
MWCNT Decorated Rich N-Doped Porous Carbon with Tunable Porosity for CO2 Capture


Low-Carbon Technology & Chemical Reaction Engineering Lab, College of Chemical Engineering, Sichuan University, Chengdu 610065, China
*
Author to whom correspondence should be addressed.
Molecules 2021, 26(11), 3451; https://0-doi-org.brum.beds.ac.uk/10.3390/molecules26113451
Submission received: 29 April 2021
/
Revised: 29 May 2021
/
Accepted: 3 June 2021
/
Published: 7 June 2021
(This article belongs to the Special Issue Nano Environmental Materials)
Abstract
:Designing of porous carbon system for CO2 uptake has attracted a plenty of interest due to the ever-increasing concerns about climate change and global warming. Herein, a novel N rich porous carbon is prepared by in-situ chemical oxidation polyaniline (PANI) on a surface of multi-walled carbon nanotubes (MWCNTs), and then activated with KOH. The porosity of such carbon materials can be tuned by rational introduction of MWCNTs, adjusting the amount of KOH, and controlling the pyrolysis temperature. The obtained M/P-0.1-600-2 adsorbent possesses a high surface area of 1017 m2 g−1 and a high N content of 3.11 at%. Such M/P-0.1-600-2 adsorbent delivers an enhanced CO2 capture capability of 2.63 mmol g−1 at 298.15 K and five bars, which is 14 times higher than that of pristine MWCNTs (0.18 mmol g−1). In addition, such M/P-0.1-600-2 adsorbent performs with a good stability, with almost no decay in a successive five adsorption-desorption cycles.
1. Introduction
Anthropogenic carbon dioxide (CO2) emission from the fuel fossil combustion causes a series of ecological crises, including global warming, glacial melting, and species numbers dropping [1,2]. The raised temperature of land also slows down the airflow between land and sea, further causing the fog and haze in urban areas. The alarming issue of the continual rise in CO2 concentration is a serious concern to the public, and plenty of strategies were urged to mitigate the greenhouse gas in various industries. Carbon capture and storage (CCS) was considered as an efficient approach to address the challenge of excessive CO2 emissions [3,4]. It is well known that amine solutions could effectively absorb CO2, however the high cost, corrosion, and environmental pollution limits its practical application [5,6]. The adsorption technologies of temperature swing adsorption (TSA) and vacuum swing adsorption (VSA) are efficient strategies for gas storage and separation, suggesting that solid adsorbents are the most promising candidates to adsorb CO2 [7,8]. The mechanism of CO2 uptake on carbonaceous sorbents was ascribed to the porosity and surface chemistry properties, which provide physical and chemical adsorption of CO2, respectively. Therefore, numerous porous adsorbents have been developed, including porous carbon, zeolites, porous polymer, and N-doped carbon [9,10,11,12].
Carbon nanotubes (CNTs) have drawn much attention for CO2 uptake due to their unique physicochemical properties and high thermal and chemical stability [13,14]. The developed porosity provided more possibilities for grafting an amine functional group, which can further improve the chemical adsorption of CO2. Keren et al. reported that impregnating 3-aminopropyl-triethoxysilane (APTS) onto CNTs increased the CO2 adsorption capacity of the CNTs by 150% [15]. Lee et al. employed polyethyleneimine to treat multi-walled carbon nanotubes (MWCNTs), and a 200% increase in CO2 adsorption capacity was achieved [16]. In addition, P-phenylenediamine grafted onto MWCNTs showed a 250% improvement of CO2 adsorption, and the CO2 adsorption capacity reached 0.59 mmol g−1 at 303.15 K and 200 kPa [17]. Recently, much attention was focused on N-doped porous carbons (NPCs), due to their large surface area and dense active nitrogen with negative charge, which can offer more active sites for CO2 uptake [18,19,20].
The fabrication of NPCs is often through the post-treatment of carbon with an inorganic nitrogen resource, such as urea or ammonia at high temperatures and the pyrolysis of N containing organic monomers. Polyaniline (PANI) is a rich N-containing polymer, and it is usually employed to be a coating on the substrate, which is promising precursor to fabricate NPCs [21,22]. Zhang et al. investigated the activation process of PANI derived NPCs by using KOH as the activator, and achieved a high surface area NPC with a surface area of 3768 m2 g−1 [23]. Silvestre-Albero et al. obtained a series of NPCs by the carbonization of PANI at different temperatures [24]. The high surface area and high N content made such NPCs deliver a good CO2 capture capability. In addition, Khalili et al. prepared N-doped activated carbon/PANI, and it delivered an enhanced CO2 adsorption capability and selectivity than that of pure activated carbon [25]. We anticipate that the NPCs derived from the PANI coating on the surface of CNTs can provide more active sites, which favor CO2 adsorption more energetically. Furthermore, the framework provided by CNTs also supports NPCs to construct the ordered channels for transferring CO2 molecules. To the best of our knowledge, however, few reports have explored this to date.
In this work, a novel adsorbent of MWCNTs/NPCs was fabricated by the in-situ chemical oxidation polymerization of PANI on a surface of MWCNTs, and then activated with KOH (see experiment section and Scheme 1 for detailed preparation). The porosity of such NPCs can be tuned by the rational addition of MWCNTs, and adjusting the amount of KOH and the pyrolysis temperature. The obtained M/P-0.1-600-2 adsorbent, with a high surface area of 1017 m2 g−1 and a high N content of 3.11 at%, possessed a boosted CO2 adsorption capacity of 2.63 mmol g−1, which is higher than that of pristine MWCNTs (0.18 mmol g−1) and pure PANI (0.54 mmol g−1). Moreover, such M/P-0.1-600-2 adsorbent performed with a good stability, with almost no decay in a successive five adsorption-desorption cycles.
2. Results and Discussion
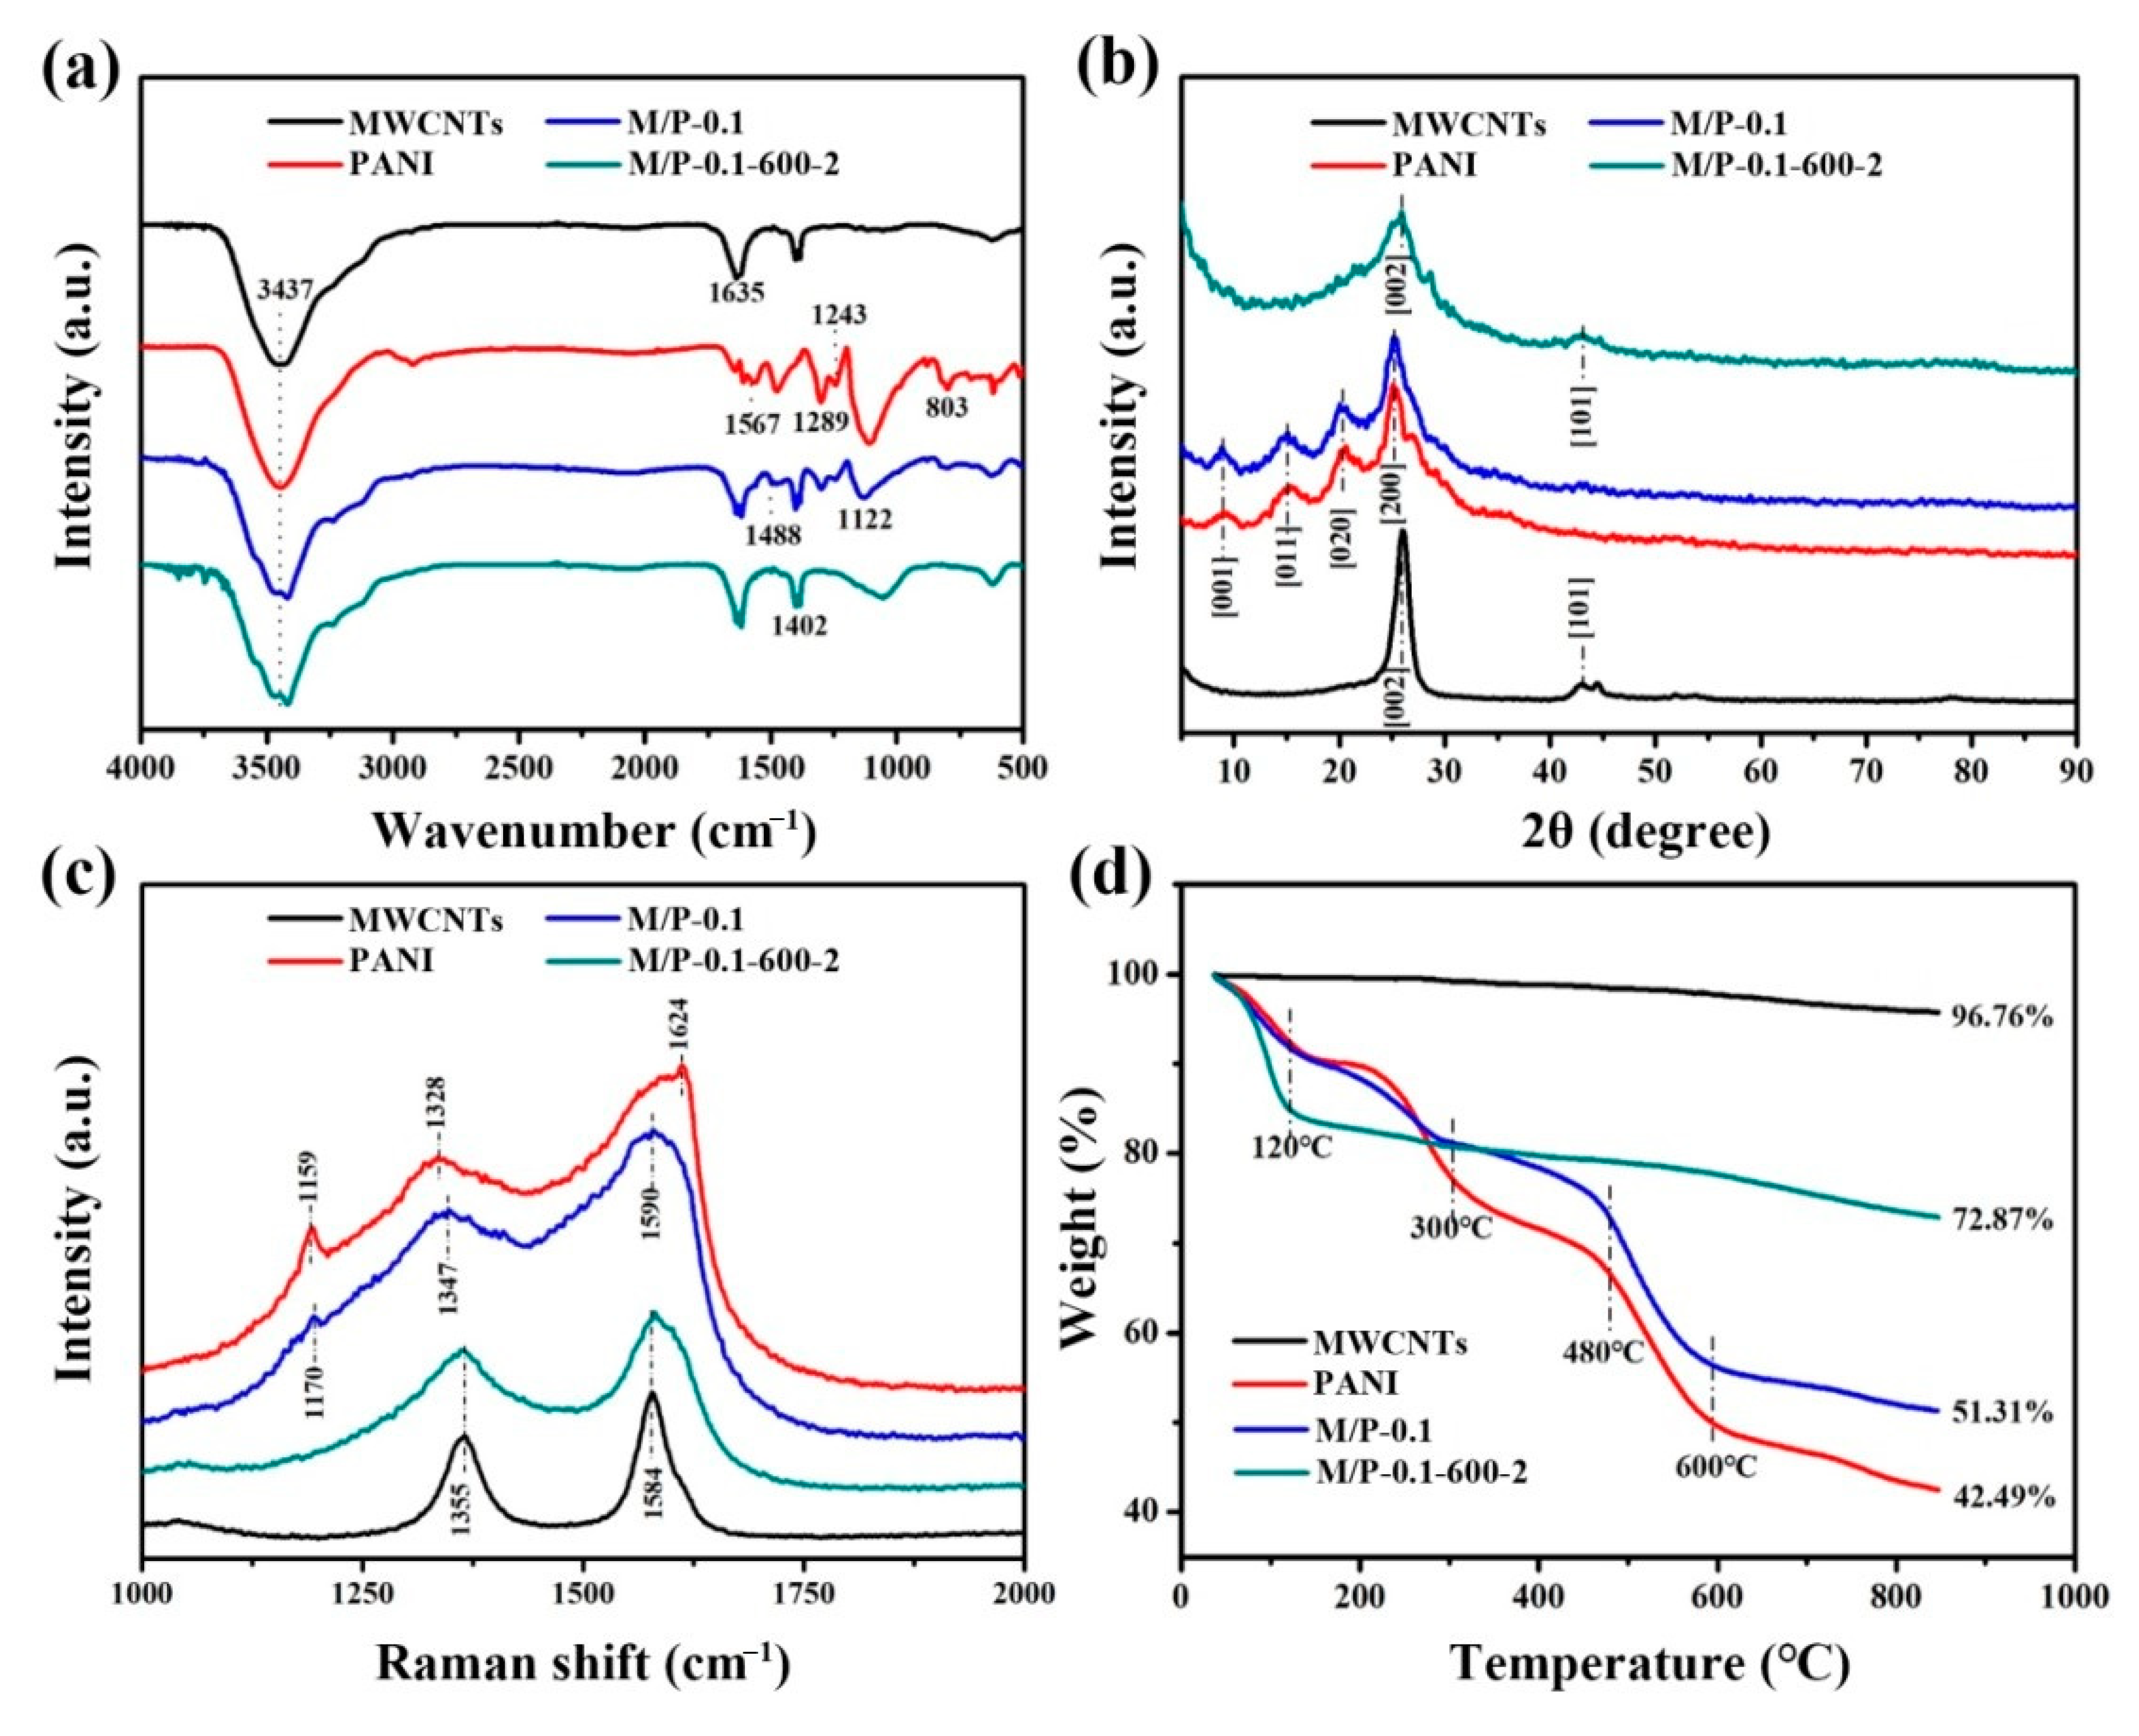
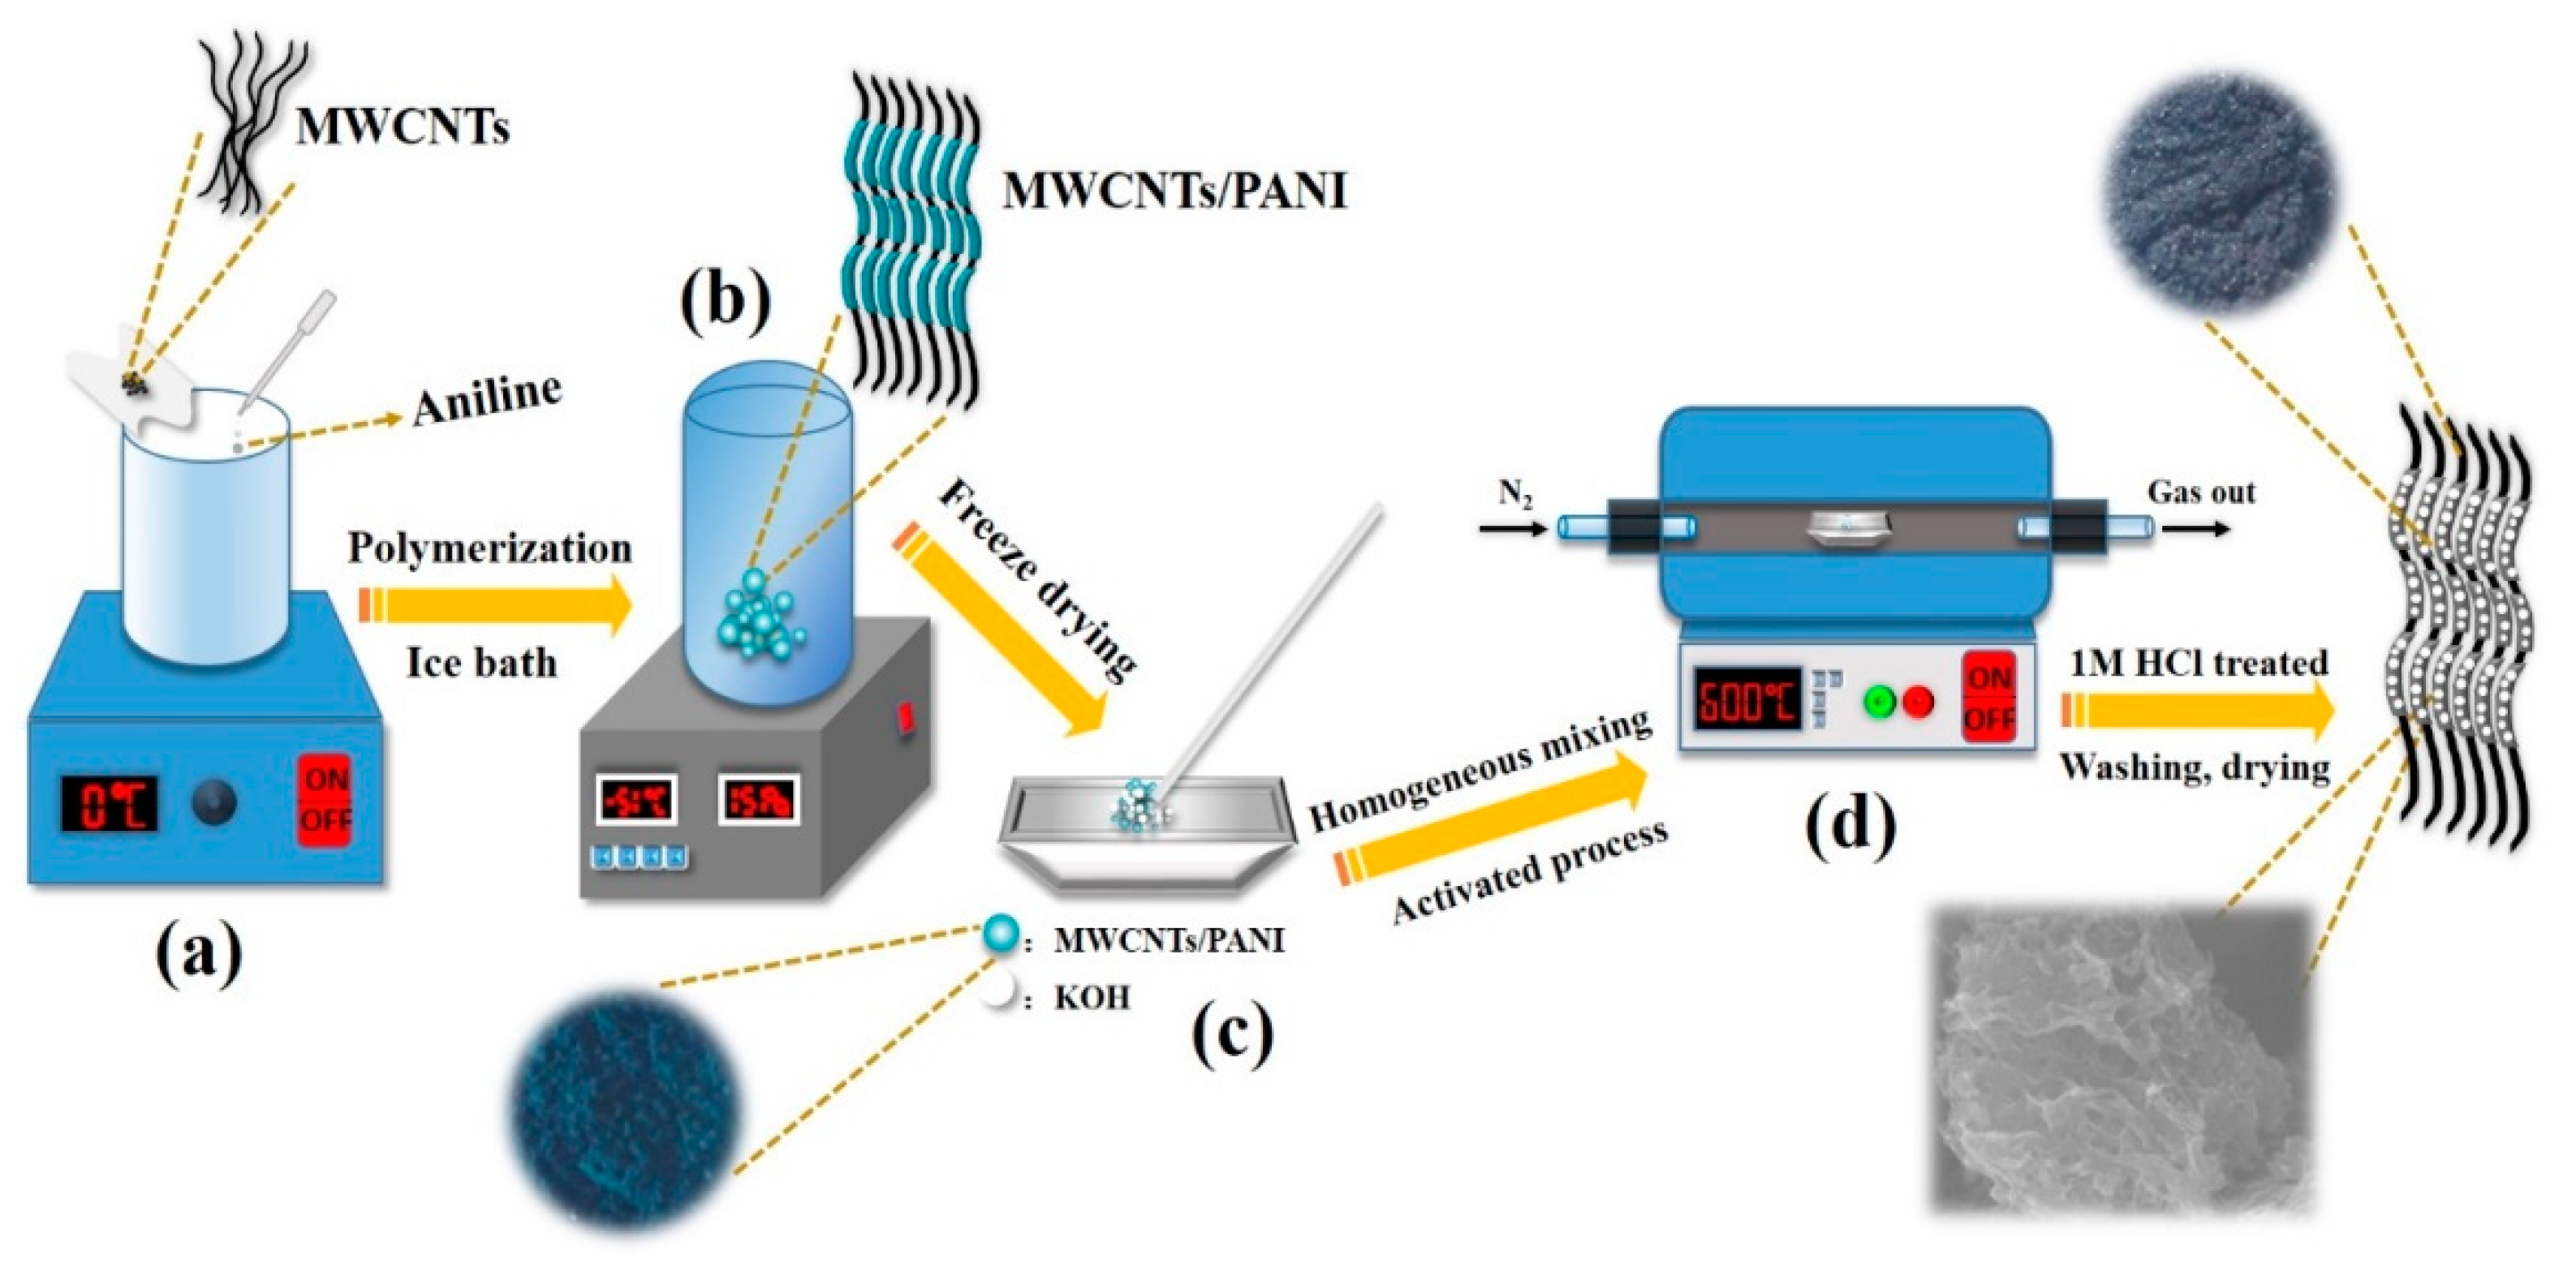
As shown in Scheme 1, PANI was first prepared by in-situ oxidative polymerization on the surface of MWCNTs. The obtained MWCNTs/PANI nanocomposite was denoted as M/P-x, where the “x” represents the mass ratio of MWCNTs and aniline monomer. Then, the M/P-x was further activated at different temperatures with KOH addition. The products were named as M/P-x-T-y, where the T is the activation temperature, and the y is the mass ratio of KOH and M/P (see experiment section for detailed preparation). Figure 1a shows the Fourier transform infrared (FTIR) spectra of M/P-0.1-600-2, M/P-0.1, PANI, and MWCNT samples. MWCNTs display three peaks at 1402 cm−1, 1635 cm−1 and 3437 cm−1, corresponding to stretching vibration of C=C, -OH, and the bending vibration of C=O, respectively [26]. This indicates the successful pre-oxidation reaction of MWCNTs. The PANI shows the peaks at 803 and 1289 cm−1, which is ascribed to the stretching of C-C and C-N, respectively. The peaks at 1243 and 1567 cm−1 are attributed to C-NH+ and stretching vibration quinoid rings [27]. After coating PANI on the surface of MWCNTs, the FTIR spectrum of M/P-0.1 shows both the MWCNTs and PANI characteristic peaks. After activation, the characteristic peaks of PANI disappeared, which is ascribed to successful carbonization of PANI to form the N-doped porous carbon. In addition, the FTIR spectra of M/P-x (x = 0, 0.03, 0.05, 0.1, 0.2, and 0.3), M/P-0.1-T-2 (T = 0, 300, 400, 500, 600, and 700), and M/P-0.1-600-y (y = 0, 1, 2, and 4) are also illustrated in Figure S1a–c, respectively. X-ray diffraction (XRD) patterns of four samples are shown in Figure 1b. Notably, M/P-0.1 shows the similar characteristic peaks of PANI, implying the existence of PANI on MWCNTs [28,29]. After activation, the characteristic peak at 42.9° is observed corresponding to the MWCNTs, which is ascribed to the break of porous carbon coating after the activation reaction. This result further confirms the PANI encapsulated the surface of MWCNTs by the in-situ chemical oxidation reaction. Figure S2a–c also display the XRD patterns of the precursor M/P-x, M/P-0.1-T, and M/P-0.1-600-y, respectively. Raman spectra of four samples (Figure 1c) show the two broad peaks at 1355 and 1584, which are attributed to D and G bands, respectively. Compared to M/P-0.1, the Raman spectrum of M/P-0.1-600-2 shows a decreased ratio of G band to D band (IG/ID), implying more defects after activation reaction. This can provide more active surface favoring the transfer and adsorption of CO2 molecule. Thermogravimetric analysis (TGA) curves of MWCNTs (Figure 1d) show a good thermal stability, with only 3.24% weight loss. However, four obvious mass loss stages can be observed for pure PANI at the range of 0–120, 250–300, 300–480, and 480–600 °C, corresponding to the evaporation of free water, the decomposition of dopant and oligomer, the decomposition of amine groups on PANI, and the decomposition macromolecular benzene ring and quinonoid ring, respectively [30]. Notably, M/P-0.1-600-2 exhibited an enhanced thermal stability. In addition, the TGA curves of all samples fabricated at different MWCNTs and KOH addition, and activation temperatures are shown in Figure S3a–d.
The morphology of nanotubes cannot be observed in the scanning electron microscopy (SEM) images of M/P-0.1 (Figure 2a–c), which is due to the MWCNTs intertwined with PANI coating. After activation, a relatively rough surface is observed (Figure 2d–f), indicating the formation of porous carbon, which is beneficial to the CO2 adsorption. Transmission electron microscopy (TEM) images of M/P-0.1 (Figure 2g–j) displays the nanotube morphology with a uniform PANI coating, which further indicates the effective in-situ chemical oxidation reaction. Hence, the formation of N-doped porous carbon after activation can uniformly disperse on the surface of MWCNTs. As shown in Figure 2j–l, M/P-0.1-600-2 shows the clear nanotube morphology, and the larger interface of each nanotube can be observed, favoring the transfer of CO2.
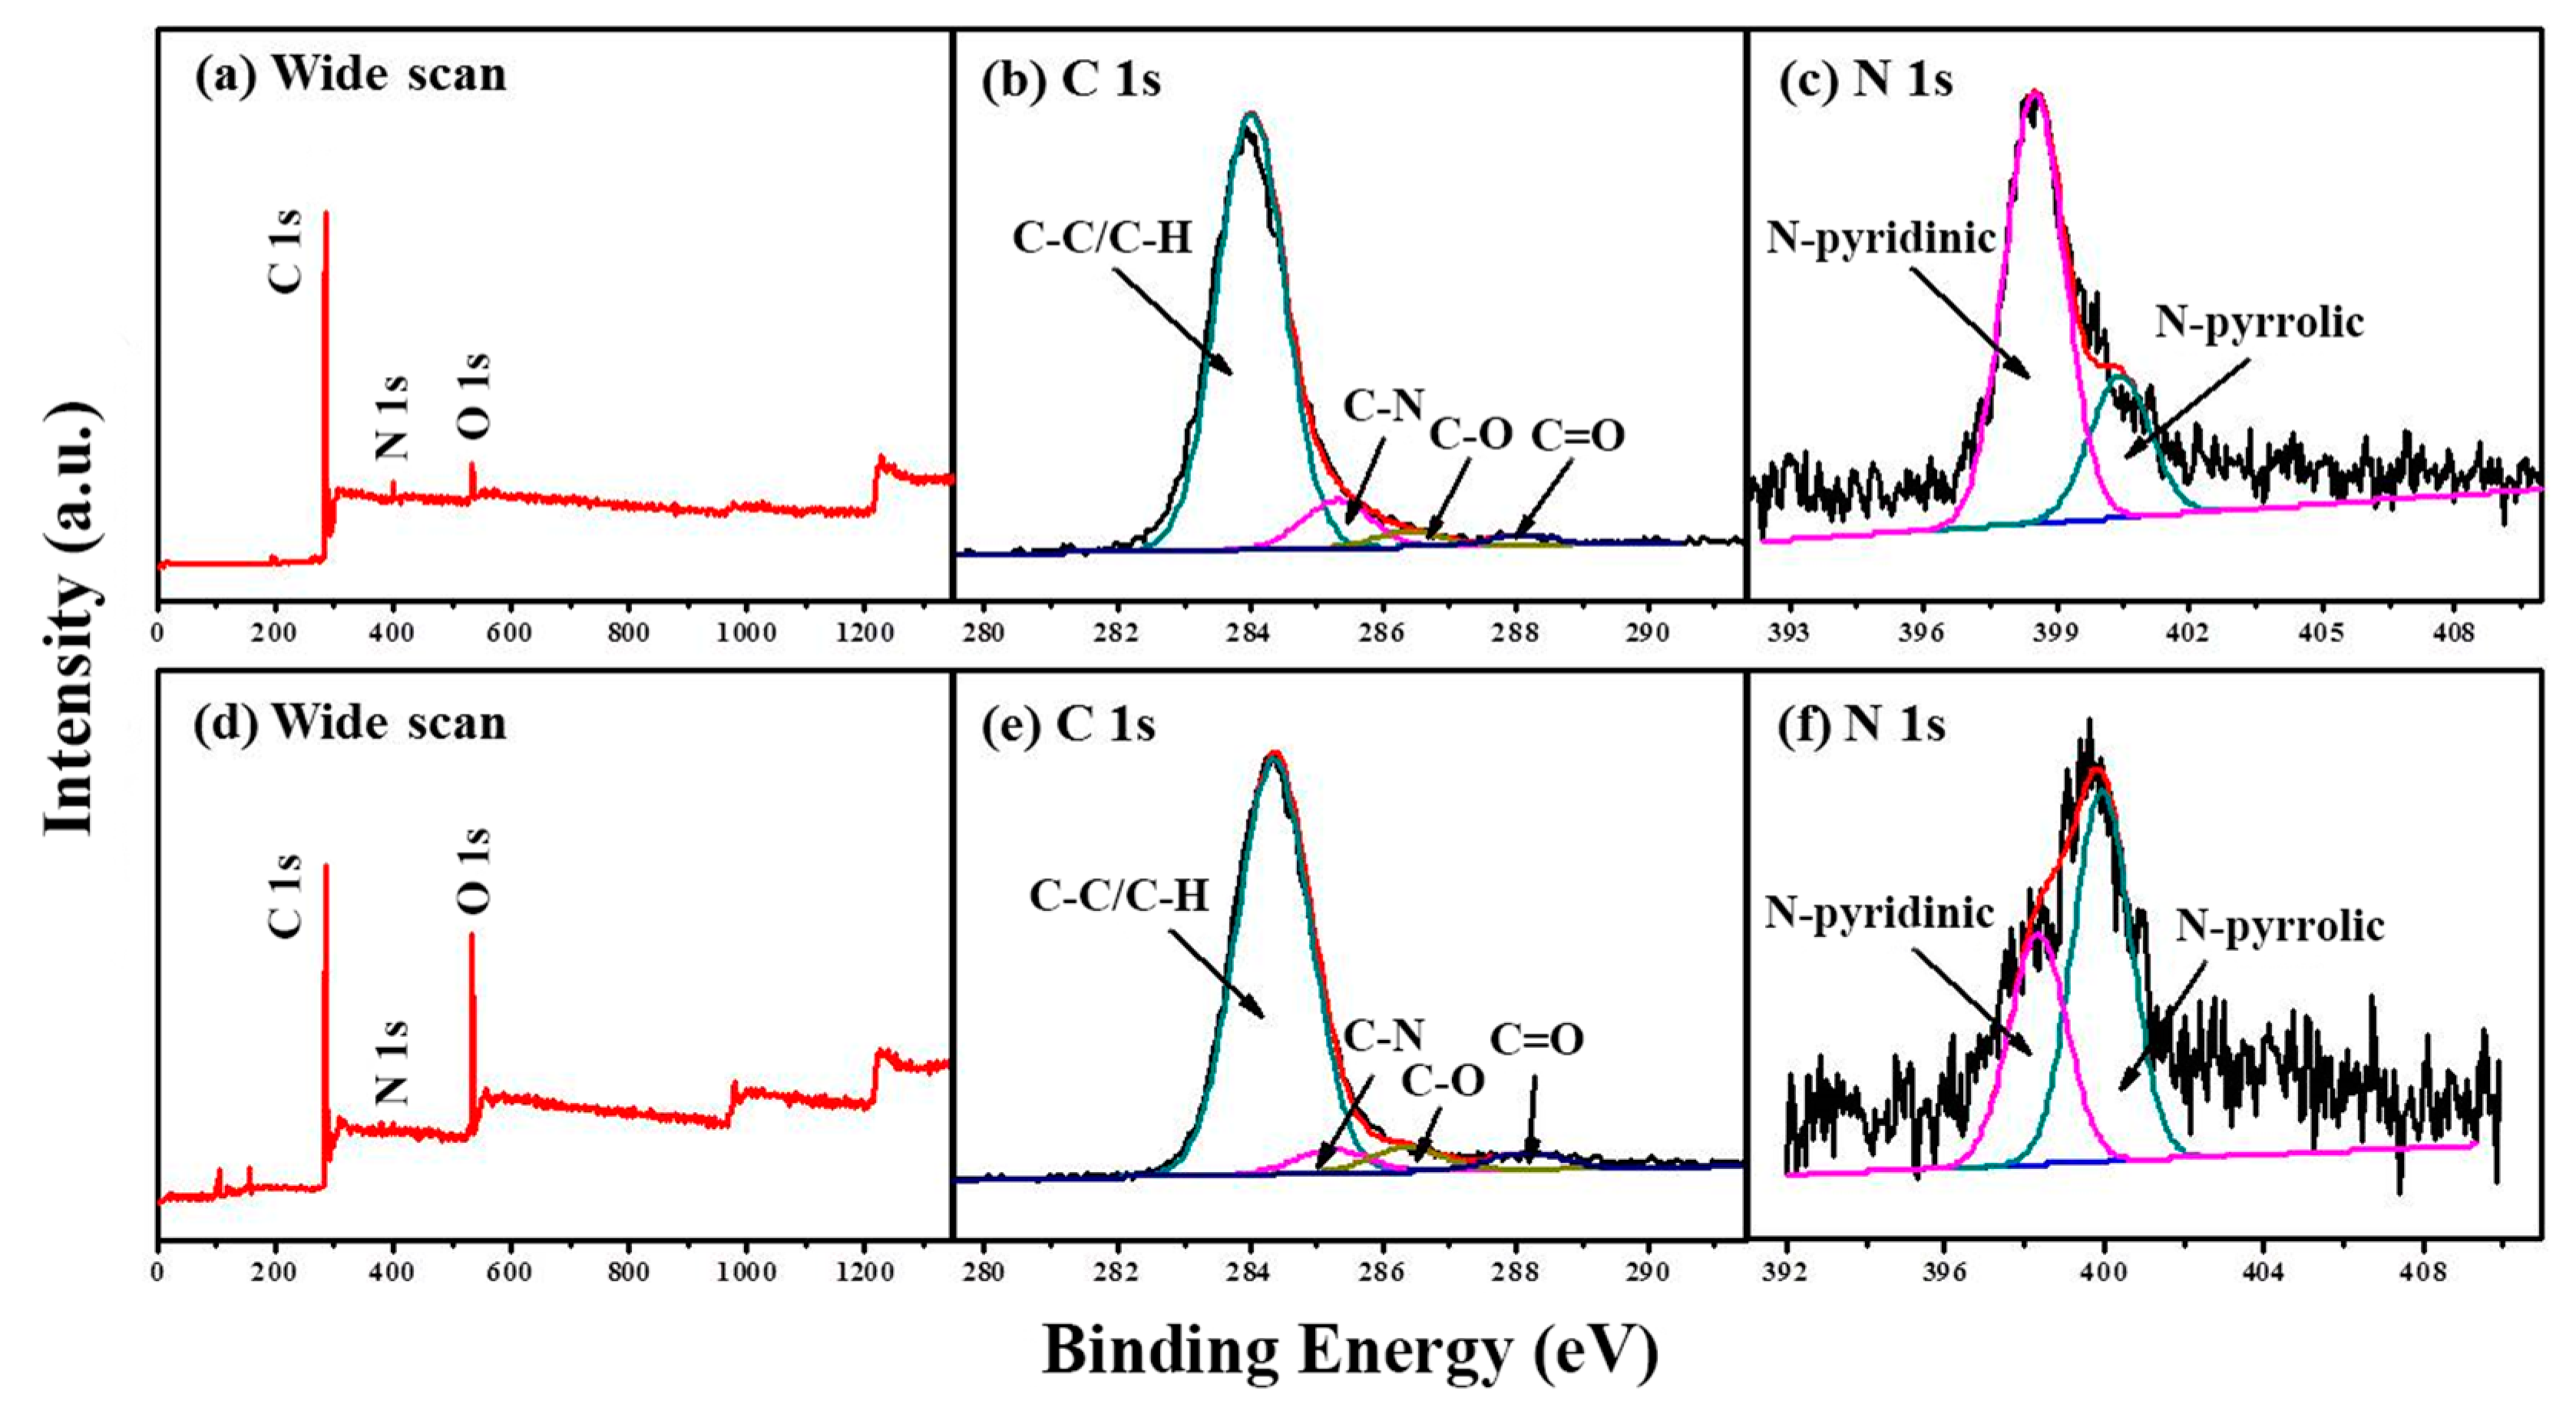
To investigate the surface chemistry, X-ray photoelectron spectroscope (XPS) measurement was employed. Figure 3 and Figure S4 compare the XPS spectra of M/P-0.1-T-2 prepared in different activation temperatures. The wide scan XPS spectra (Figure 3a,d and Figure S4a–d) show the existence of C, N, and O elements on surface of all samples. The N content of each sample is listed in Table S1. The N content of M/P-0.1 is measured to be 4.14%. After activation, the N content of 3.11% is still measured. It is of note that the N content decreased with the raised pyrolysis temperature, which is due to the instability of active N in the carbon framework. As for C 1s (Figure 3b,e and Figure S4e–h), four peaks at around 284.5, 285.2, 286.3, and 288.4 eV are observed indicating the C-C/C=C, C-N/C-O, C=O, and O=C-O, respectively [31]. Figure 3c,f and Figure S4i–l compare the N 1s core-level XPS spectra of all samples. Two peaks with binding energy of 398.4 and 400.3 eV are ascribed to the pyridine-N and pyrrolic-N, respectively [32]. Notably, more pyrrolic-N is observed in the M/P-0.1-600-2, which more favors the CO2 capture [33,34].
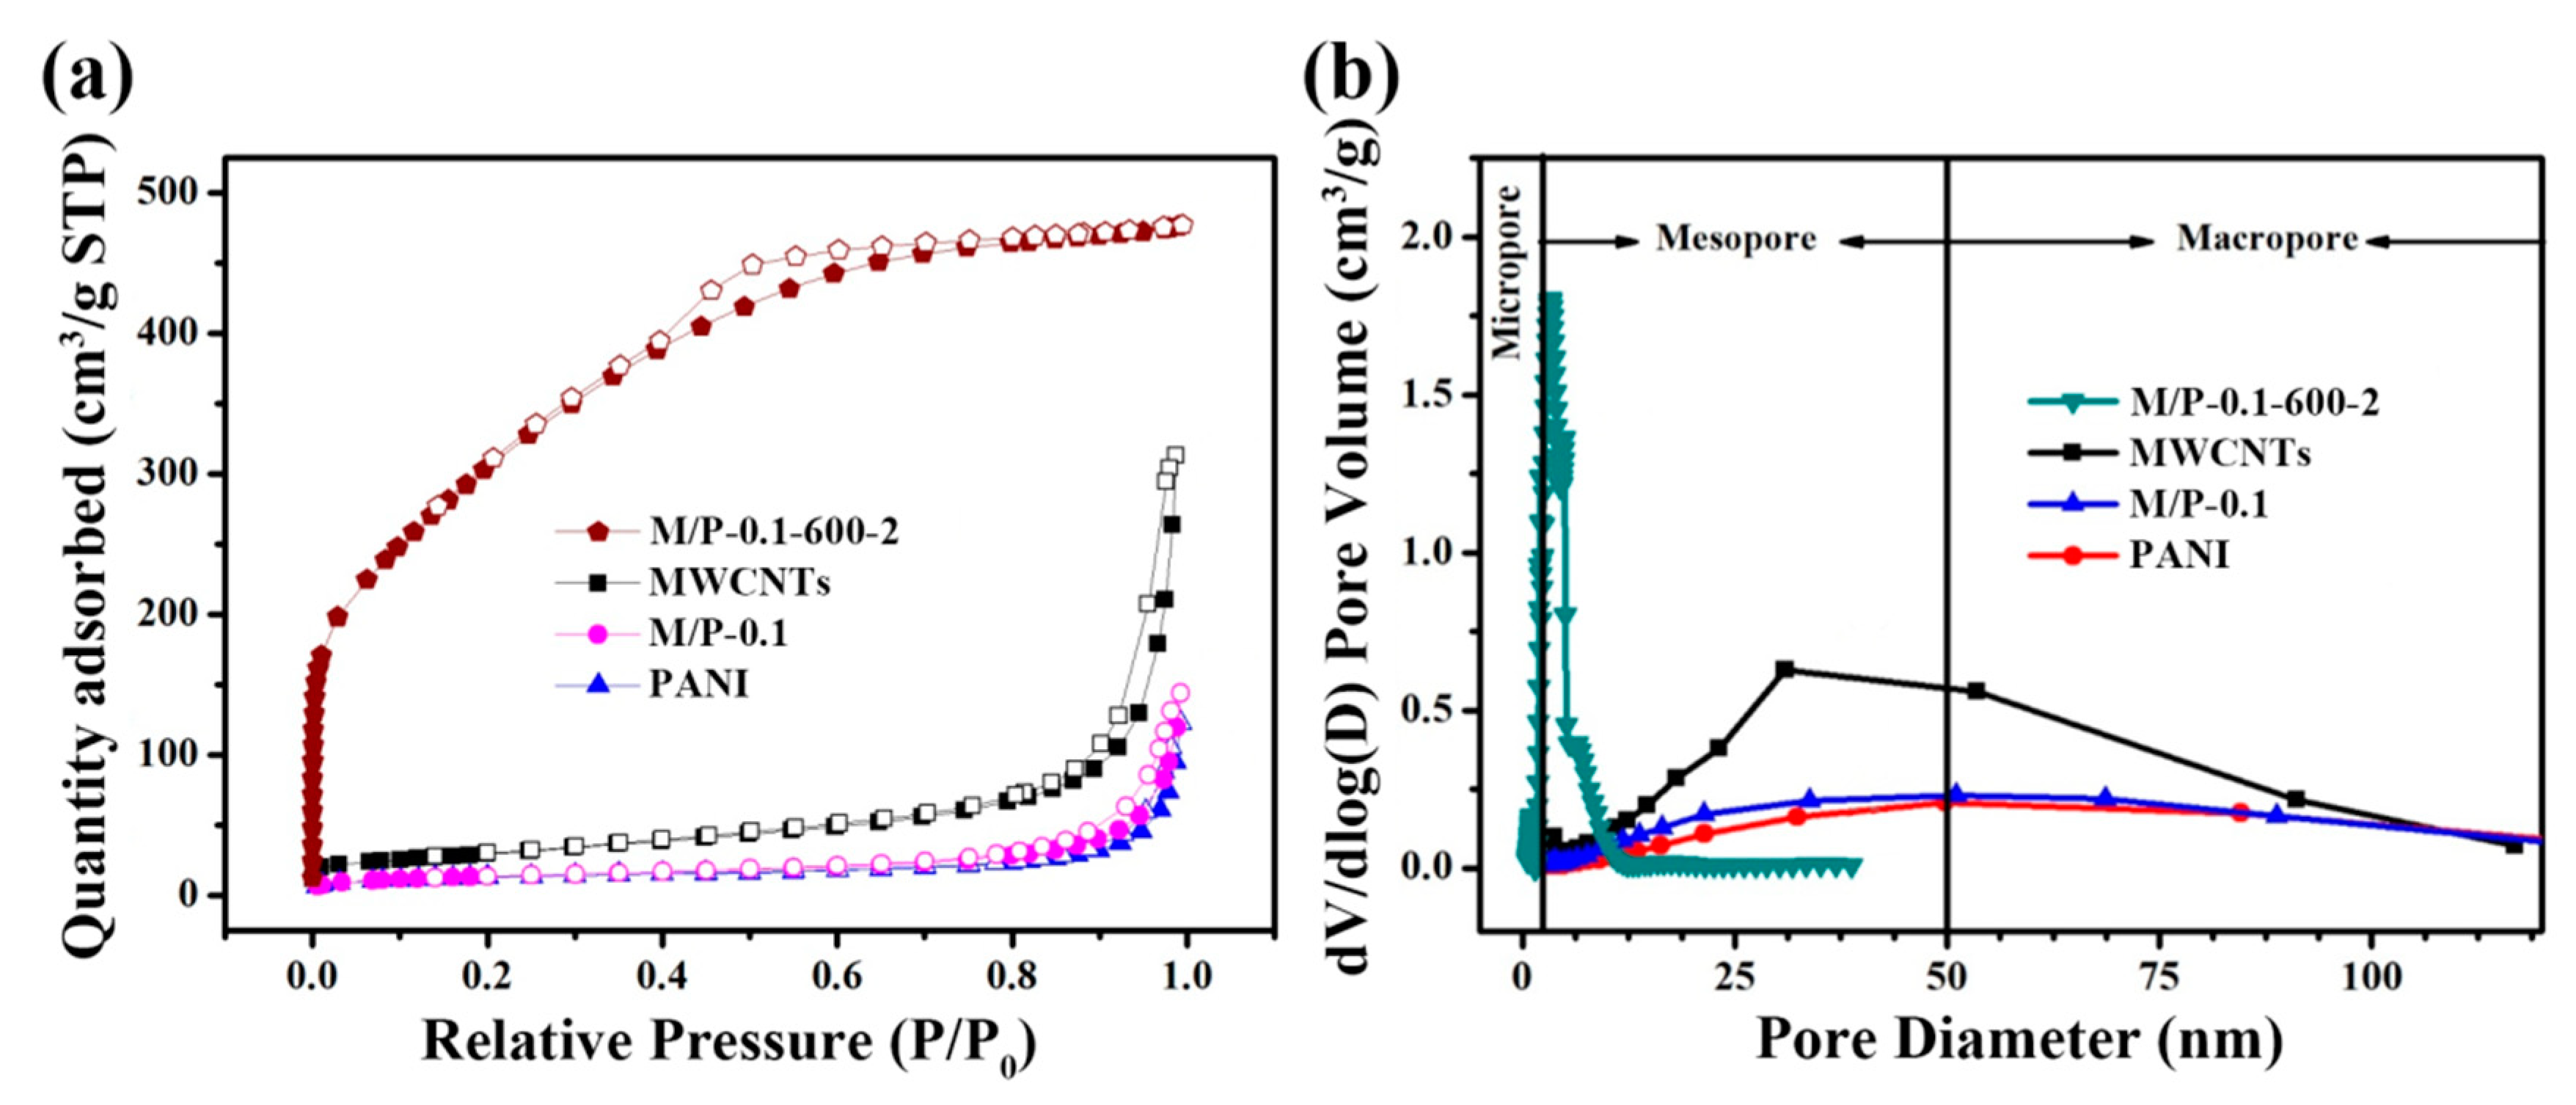
A relatively larger generation of pyrrolic-N at the activation temperature of 600 °C could be attributed to the increased defects, facilitating the exposure of active nitrogen in carbon framework, which can be further confirmed by Brunauer–Emmett–Teller (BET) measurement. N2 adsorption-desorption isotherms of four samples are shown in Figure 4a. Different from the shape of MWCNTs, M/P-0.1, and PANI, M/P-0.1-600-2 exhibits a sharply increased adsorption quantity at P/P0 < 0.03, implying type I (IUPAC classification) property for microporous materials [35]. Furthermore, N2 adsorption-desorption isotherm of M/P-0.1-600-2 shows an obvious hysteresis hoop at P/P0 = 0.4–0.7, indicating the existence both micro- and mesopore feature [36]. In addition, the isotherms of MWCNTs and M/P-0.1 displayed a sharply increased hysteresis loop at P/P0 =0.9–1.0, indicating a mesopore structure. The corresponding pore size distribution of MWCNTs (Figure 4b) exhibits the mesopore and macropore feature with the range of 25–80 nm. After combination with N-doped carbon, M/P-0.1-600-2 mainly presents the micro- and mesopore nature. To further investigate the porosity, the N2 adsorption-desorption isotherms and corresponding pore size distribution of all samples at different prepared conditions are displayed in Figures S5 and S6, respectively, and the detailed parameters are listed in Table S2. Clearly, before activation reaction, the addition of MWCNTs can facilitate a larger surface area (Figure S5a). However, for the activation samples of M/P-x-600-2, the surface area is limited by MWCNTs introduction (Figure S5b). Possibly, this result could be ascribed to the superior porosity of PANI after carbonization and activation. With the increased temperature from 300 to 600 °C, the increased surface area of M/P-0.1-T-2 is observed. The surface area of M/P-0.1-600-2 is calculated to be 1017 cm2 g−1. This value is higher than that of M/P-0.1-700-2 (780 cm2 g−1), which is due to the overactivation under a high temperature, leading to the destruction of the pore structure. This result can be further confirmed by the considerably increased pore volume from 0.37 for M/P-0.1-600-2, to 0.94 for M/P-0.1-700-2 (Figures S5c and S6c). In addition, the dosage of KOH is also a significant factor for porous carbon preparation. Excessive KOH addition also leads to an overactivation, limiting the development of porosity (Figure S5d).
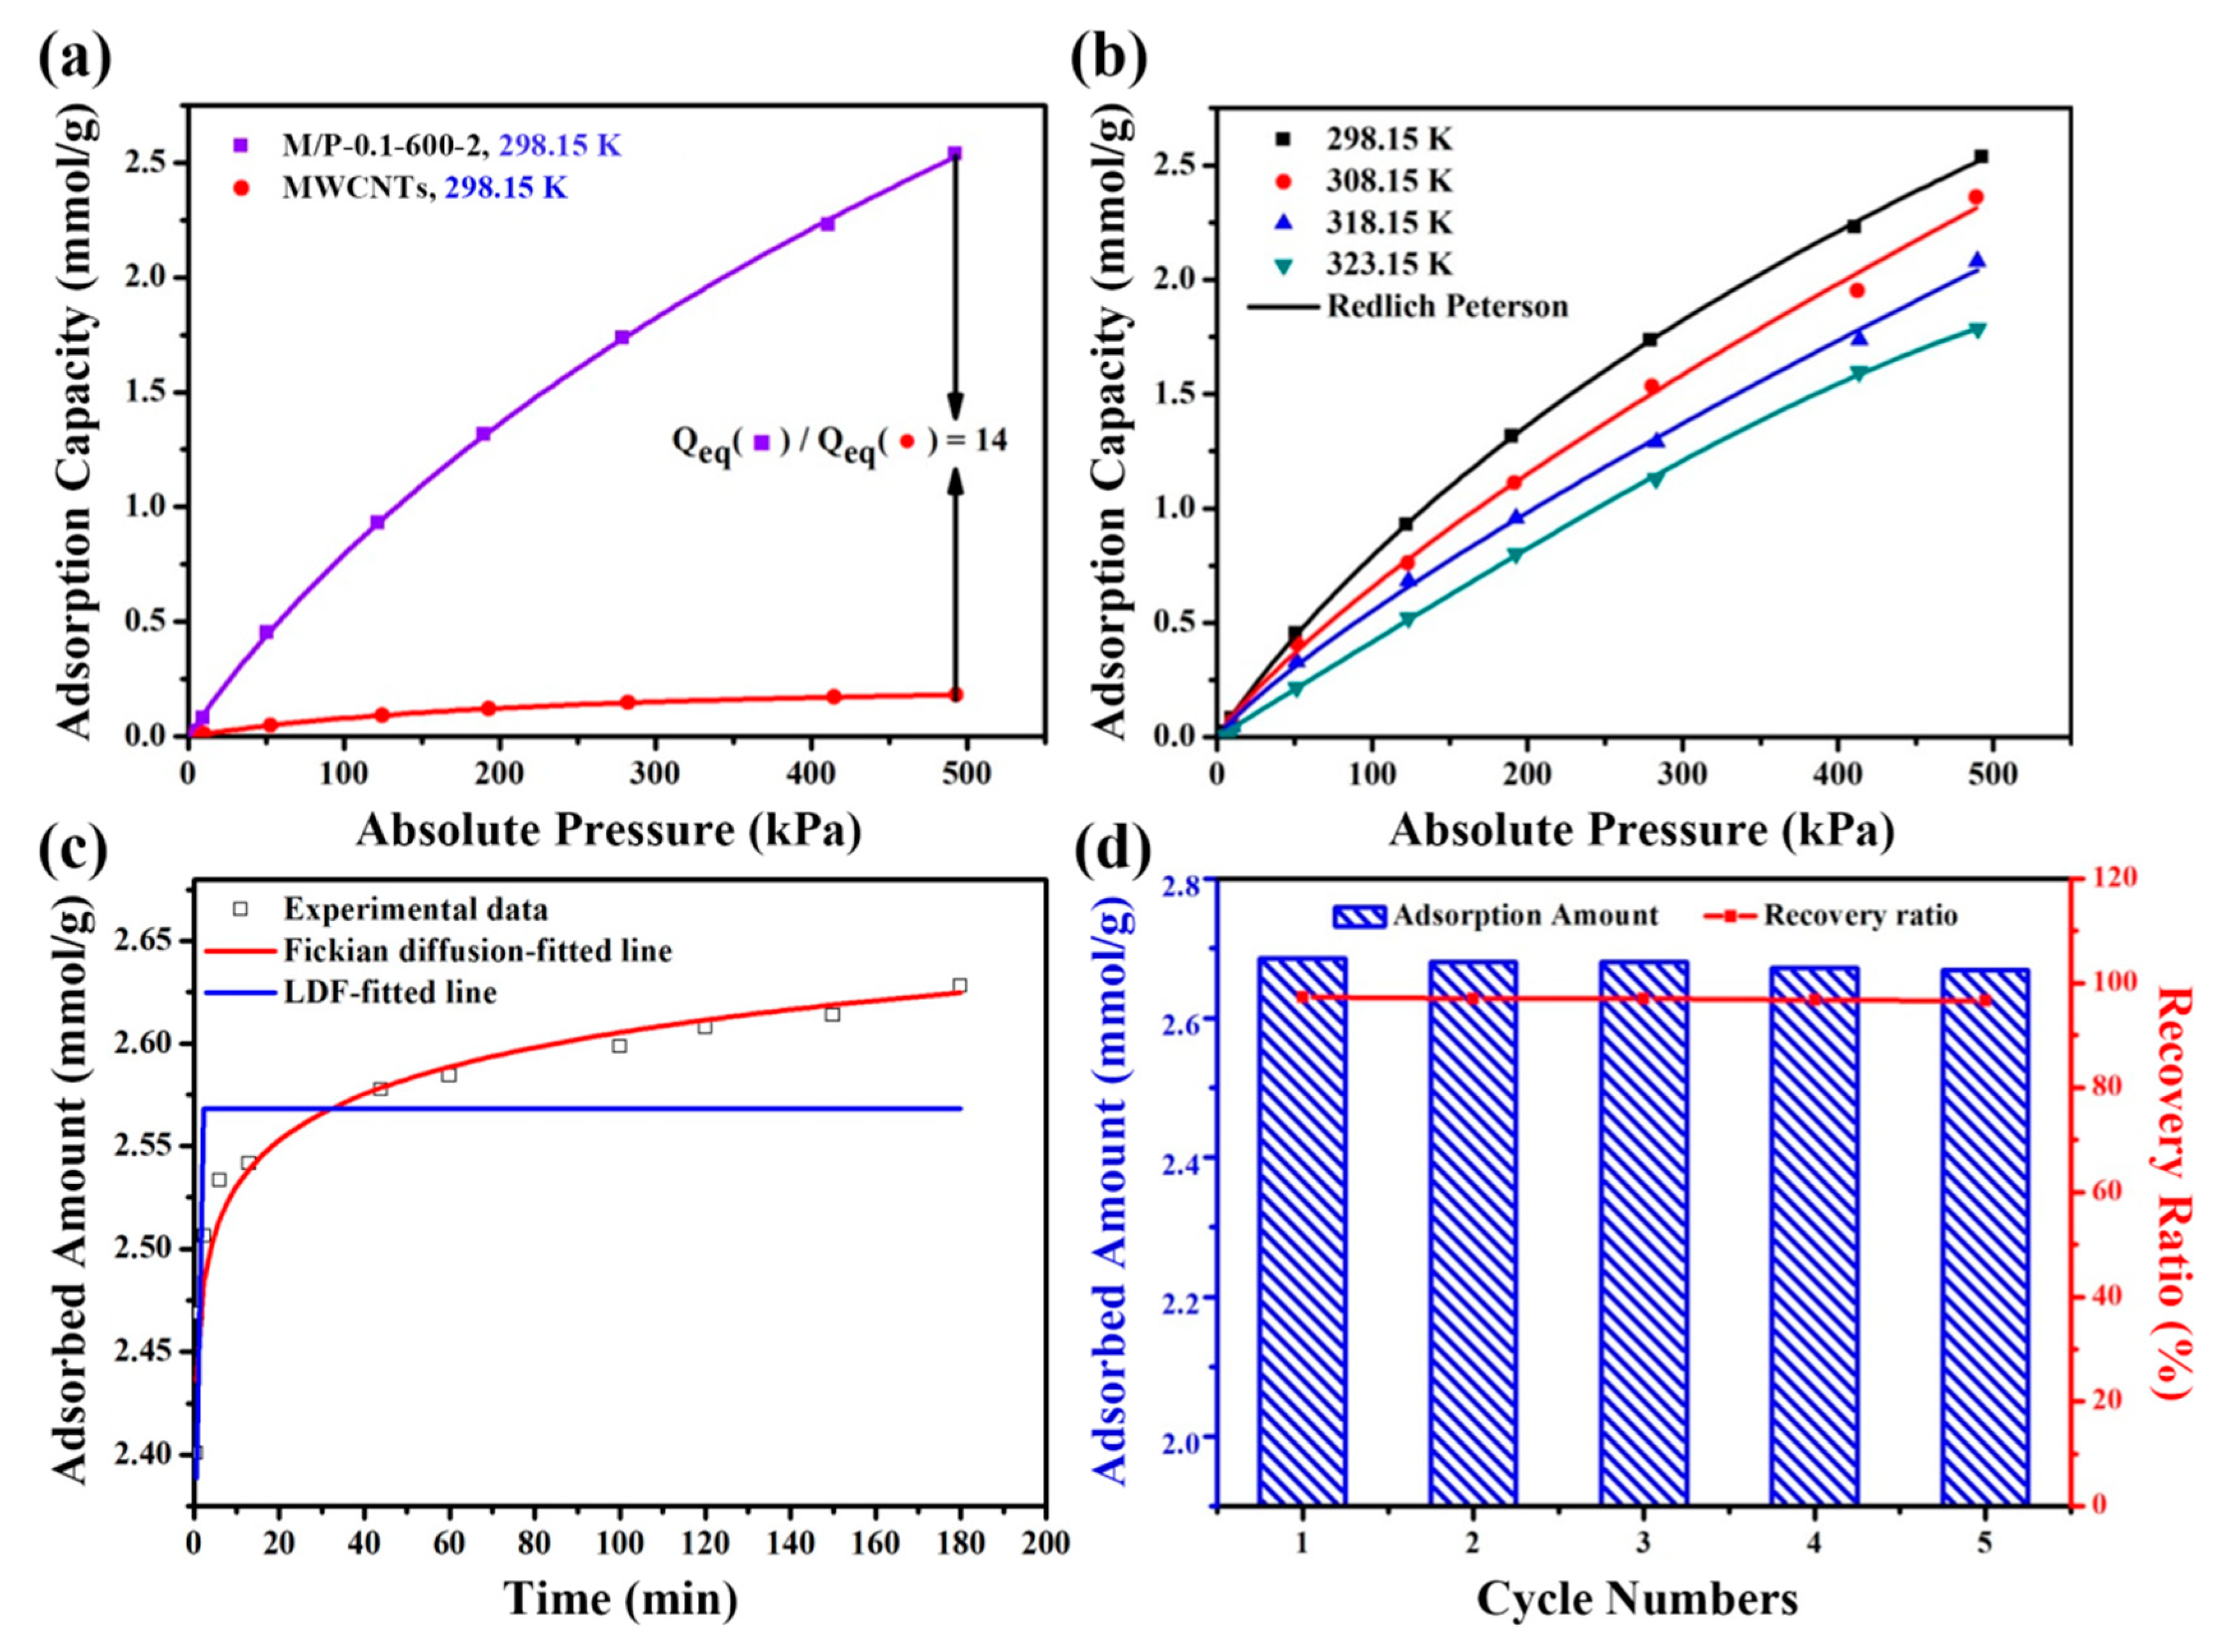
Figure 5a exhibits the adsorption isotherms of MWCNTs and M/P-0.1-600-2 at different pressure and 298.15 K. Notably, owing to the large surface area and high N content, M/P-0.1-600-2 displays a superior CO2 adsorption capacity of 2.63 mmol g−1, which is about 14 times higher than that of MWCNTs (0.18 mmol g−1) and PANI based NPCs (1.16 mmol g−1). The detailed comparison is listed in Table S2. Notably, it seems that the surface area is significant for the CO2 adsorption capacity. However, M/P-0.03-600-2 (1570 cm2 g−1) and M/P-0.05-600-2 (1601 cm2 g−1) possessing a high surface area only delivers a relatively poor CO2 capture capability with 1.25 and 1.63 mmol g−1, respectively. Possibly, the introduction of MWCNT constructs results in more pathways for CO2 adsorption, as M/P-0.1-600-2 presents relatively large pore volume (0.37 cm3 g−1) and smaller average pore size (2.71 nm). In addition, more comparisons of other porous adsorbent for CO2 capture are listed in Table S3. In order to further investigate the relationship between M/P-0.1-600-2 and CO2, three models (i.e., Redlich–Peterson, Freundlich and Langmuir) were employed [37], as illustrated in Figure 5b and Figure S7a,b, and the corresponding parameters are listed in Table S4. The data of the Redlich–Peterson model presents a higher value of R2, implying the monolayer and multi-layer adsorption process between the M/P-0.1-600-2 and CO2. In addition, Fick models and linear driving force (LDF) [38] were also conducted to evaluate the adsorption kinetics of M/P-0.1-600-2, as shown in Figure 5c. The fitted parameters (Table S5) shows that Fick models possesses a higher R2 and lower χ2 coefficient value than that of LDF, indicating that the CO2 adsorption kinetics of M/P-0.1-600-2 follows the Fick model, suggesting that the physical adsorption plays a major role in the adsorption process [39]. The regeneration property is significant for solid adsorbents. After saturated with CO2 at 298 K and five bars, the adsorbent is regenerated in a vacuum drying chamber for approximately 40 Pa at 373.15 K, and then re-employed for CO2 adsorption. Notably, after a successive five recycling tests, a CO2 adsorption capacity retention of 96.7% still remained (Figure 5d), suggesting the outstanding recycling stability for such M/P-0.1-600-2 absorbent.
3. Materials and Methods
3.1. Materials
Aniline monomer (99.8%) is an analytical grade and purchased from Sigma-Aldrich Co. (Shanghai, China). MWCNTs (98%) and ethanol (AR, 98%) were obtained from Hengqiu Technology Reagent Co. (Suzhou, China) and Changzheng Chemical Reagent Co. (Chengdu, China). Ammonium persulfate, potassium hydroxide, and hydrochloric acid are all analytically pure grades, and purchased from Kelong Chemical Reagent Co. (Chengdu, China).
3.2. Fabrication of MWCNTs/PANI Nanocomposite
A total of 0.5 g MWCNTs were added to 40 mL mixed acid, with a volume ratio of sulfuric acid and nitric acid of 3:1, and the mixture was stirred at 90 °C for 90 min. After cooling to room temperature, the mixture was washed by deionized water. The carboxylation of the MWCNTs was obtained by drying in a vacuum drying oven at 60 °C for 12 h, and then ground into powder. A total of 0.2 g (2.144 mmol) aniline monomer was dissolved into 15 mL 1 M HCl solution, then a certain amount of the carboxylated MWCNTs were dispersed into the solution with string for 60 min in an ice/water bath to obtain “solution A”. Then, 0.334 g (1.465 mmol) ammonium persulfate (APS) was dissolved into 5 mL 1 M HCl solution by stirring for 30 min in an ice/water bath to obtain “solution B”. Then, the precooled (0 °C) solution B was dropped into solution within 30 min, and then allowed to react for 6 h in ice bath. Finally, the product solution was filtrated with a Brucella funnel and washed with deionized water and ethanol until the supernatant turned transparent and pH turned neutral. The compound was frozen to ice in liquid nitrogen, then dried by freeze dryer for 24 h. The MWCNTs/PANI nanocomposites with different mass ratios of MWCNTs and aniline monomer (0.3:1, 0.2:1, 0.1:1, 0.05:1, and 0.03:1) were obtained by adjusting the content of MWCNTs. For convenience, the MWCNTs/PANI nanocomposite was denoted as M/P-x, where the “x” represents the mass ratio of MWCNTs and aniline monomer. For example, M/P-0.1 represents the composite with the mass ratio of MWCNTs and aniline of 0.1. For comparison, the neat PANI was synthesized under the same conditions without the addition of MWCNTs.
3.3. Activation of MWCNTs/PANI Nanocomposite
The well mixed M/P nanocomposites and KOH activator were preheated under N2 flow (60 mL min−1) at 200 °C for 1 h in a tubefurnace, then heated to the specified temperature at a rate of 5 °C min−1, left to activate for 2 h, and finally the activated sample was washed by ethanol and deionized water until the pH value of filtrate was approzimately7. The product was then obtained by drying in vacuum oven at 80 °C for 12 h. Different samples were fabricated under different KOH mass ratios (KOH:M/P = 1, 2, and 4) of the M/P nanocomposite and the activator, and different activation temperatures (300, 400, 500, 600, and 700 °C). The final products were named as M/P-x-T-y, where the T is the activation temperature, and the y is the mass ratio of KOH and M/P. For example, M/P-0.1-600-2 means that the mass ratio of KOH activator and M/P-0.1 is 2, and the activation temperature is 600 °C.
3.4. Characterization
The morphology of the pristine and activated composites was observed by the SEM (JSM-5900LV, JEOL, Tokyo, Japan). The FTIR spectra were obtained by a Spectrum GX FTIR spectrometer (Perkin15 Elmer Inc., Waltham, MA, USA) to identify chemical functional groups on the sample surface, operating between 4000 and 400 cm−1 with a resolution of 4 cm−1, using the KBr tablet method. The crystal structures of all samples were determined by using XRD (DX2700, Haoyuan Instruments Co., Dandong, China) with Cu K radiation (k = 1.5418 Å) produced at 40 kV and 40 mA. XRD patterns were recorded at a diffraction angle range of 2θ = 5–90° under a continuous scan using 0.06° step size. TGA was fulfilled with a thermal graphic analyzer (HTG-2, Beijing Hengjiu Science In-strument Factory, Beijing, China) with a heating rate of 10 K min−1 from room temperature to 1073 K under N2 flow (60 mL min−1). TEM (Tecnai G2 F20S-TWIN, FEI, Hillsboro, OH, USA) was used to observe the thickness changes of the samples before and after coating. The surface compositions of M-P nanocomposite fabricated under different conditions were characterized by XPS (AXIS NOVA, Kratos, UK). The pore structure characteristics of the porous materials were determined by nitrogen adsorption at −196 °C using TristarII3020 analyzers (Micromeritics, Norcross, GA, USA), and all samples were degassed at 150 °C under vacuum at 200 Pa for a period of at least 12 h. The surface area was calculated using the multipoint Brunauer–Emmett–Teller (BET) method. Raman spectra were recorded with a DXR Raman Microscope (Thermo Scientific, Waltham, MA, USA) using an excitation wavelength of 514.5 nm.
3.5. CO2 Adsorption Experiment
CO2 adsorption capacity was measured by self-made static adsorption apparatus (see the supporting information for detailed ascribed).
4. Conclusions
In summary, we demonstrated a novel method to prepare a MWCNT decorated N-doped porous carbon. The porosity of the absorbent can be well controlled by the rational addition of MWCNTs, tuning the pyrolysis temperature, and adjusting the amount of KOH. One such result, M/P-0.1-600-2, possessed a high surface area (1017 m2 g−1) and high N content (3.11 at%), and was an efficient adsorbent, presenting a good CO2 adsorption capacity of 2.63 mmol g−1 at 298.15 K and five bars. Notably, it also exhibited a good recycling stability in a successive five adsorption-desorption tests.
Supplementary Materials
The following are available online: Figure S1: FTIR spectra of (a) M/P-x (x = 0, 0.03, 0.05, 0.1, 0.2, and 0.3), (b) M/P-0.1-T-2 (T = 0, 300, 400, 500, 600, and 700), and (c) M/P-0.1-600-y (y = 0, 1, 2, and 4). Figure S2: The XRD patterns of the precursor (a) M/P-x (x = 0, 0.03, 0.05, 0.1, 0.2, and 0.3), (b) M/P-0.1-T (T = 0, 300, 400, 500, 600, and 700), and (c) M/P-0.1-600-y (y = 0, 1, 2, and 4). Figure S3: The TGA curves of (a) M/P-x (x = 0, 0.03, 0.05, 0.1, 0.2, and 0.3), (b) M/P-x-600-2 (x = 0, 0.03, 0.05, 0.1, 0.2, and 0.3), (c) M/P-0.1-T (T = 0, 300, 400, 500, 600, and 700), and (d) M/P-0.1-600-y (y = 1, 2, and 4). Figure S4: The XPS spectra of M/P-0.1-T-2 (T = 300, 400, 500, and 600). (a) Wide scan, (e) C 1s, and (i) N 1s regions of M/P-0.1-300-2. (b) Wide scan, (f) C 1s, and (j) N 1s regions of M/P-0.1-400-2. (c) Wide scan, (g) C 1s, and (k) N 1s regions of M/P-0.1-500-2. (d) Wide scan, (h) C 1s, and (l) N 1s regions of M/P-0.1-600-2. Figure S5: N2 adsorption-desorption isotherms of (a) M/P-x (x = 0, 0.03, 0.05, 0.1, 0.2, and 0.3), (b) M/P-x-600-2 (x = 0, 0.03, 0.05, 0.1, 0.2, and 0.3), (c) M/P-0.1-T (T = 0, 300, 400, 500, 600, and 700), and (d) M/P-0.1-600-y (y = 1, 2, and 4). Figure S6: The pore size distribution profiles of (a) M/P-x (x = 0, 0.03, 0.05, 0.1, 0.2, and 0.3), (b) M/P-x-600-2 (x = 0, 0.03, 0.05, 0.1, 0.2, and 0.3), (c) M/P-0.1-T (T = 0, 300, 400, 500, 600, and 700), and (d) M/P-0.1-600-y (y = 1, 2, and 4). Figure S7: (a) Freundlich and (b) Langmuir fitted adsorption isotherms of M/P-0.1-600-2 at different temperatures. Table S1: N content of M/P-0.1-T-2 (T = 0, 300, 400, 500, 600, and 700) based on XPS results. Table S2: BET data and CO2 adsorption capacity of all samples. Table S3: CO2 adsorption ability of M/P-0.1-600-2 and reported adsorbents in CO2 capture. Table S4: Model fitting parameters of CO2 adsorption isotherms on M/P-0.1-600-2 at different temperatures. Table S5: Kinetic parameters of CO2 adsorption on M/P-0.1-600-2.
Author Contributions
Conceptualization, S.Y.; methodology, S.Y.; formal analysis, Y.X. and Y.W.; investigation, Y.X. and H.J.; resources, S.Y.; data curation, S.Y.; writing—original draft preparation, Y.W. and Y.X.; writing—review and editing, S.Y.; visualization, Y.X. and H.J.; supervision, S.Y.; project administration, S.Y.; and funding acquisition, S.Y. All authors have read and agreed to the published version of the manuscript.
Funding
This research was funded by the National Natural Science Foundation of China (21978182, 21676169).
Institutional Review Board Statement
Not applicable.
Informed Consent Statement
Not applicable.
Data Availability Statement
Data are contained within the article.
Acknowledgments
We appreciate the support of Raman measurement by the Engineering Teaching Center, School of Chemical Engineering, Sichuan University, the SEM imaging by the Institute of New Energy and Low Carbon Technology of Sichuan University, and the XPS measurement by Zhang San from Shiyanjia Lab (www.shiyanjia.com) accessed on 27 April 2021.
Conflicts of Interest
The authors declare no conflict of interest.
Sample Availability
The samples are available from the authors.
References
- Li, B.; Gasser, T.; Ciais, P.; Piao, S.; Tao, S.; Balkanski, Y.; Hauglustaine, D.; Boisier, J.-P.; Chen, Z.; Huang, M.; et al. The contribution of China’s emissions to global climate forcing. Nature 2016, 531, 357–361. [Google Scholar] [CrossRef] [PubMed]
- D’Alessandro, D.M.; Smit, B.; Long, J.R. Carbon Dioxide Capture: Prospects for New Materials. Angew. Chem. Int. Ed. 2010, 49, 6058–6082. [Google Scholar] [CrossRef] [PubMed] [Green Version]
- MacDowell, N.; Florin, N.; Buchard, A.; Hallett, J.; Galindo, A.; Jackson, G.; Adjiman, C.S.; Williams, C.K.; Shah, N.; Fennell, P. An overview of CO2 capture technologies. Energy Environ. Sci. 2010, 3, 1645–1669. [Google Scholar] [CrossRef] [Green Version]
- Favre, E. Membrane processes and postcombustion carbon dioxide capture: Challenges and prospects. Chem. Eng. J. 2011, 171, 782–793. [Google Scholar] [CrossRef]
- Zachos, J.C.; Dickens, G.R.; Zeebe, R.E. An early Cenozoic perspective on greenhouse warming and carbon-cycle dynamics. Nature 2008, 451, 279–283. [Google Scholar] [CrossRef]
- Meinshausen, M.; Meinshausen, N.; Hare, W.; Raper, S.C.B.; Frieler, K.; Knutti, R.; Frame, D.J.; Allen, M.R. Greenhouse-gas emission targets for limiting global warming to 2 °C. Nature 2009, 458, 1158–1162. [Google Scholar] [CrossRef] [PubMed]
- Li, G.; Xiao, P.; Webley, P.; Zhang, J.; Singh, R.; Marshall, M. Capture of CO2 from high humidity flue gas by vacuum swing adsorption with zeolite 13X. Adsorption 2008, 14, 415–422. [Google Scholar] [CrossRef]
- Zhao, R.; Liu, L.; Zhao, L.; Deng, S.; Li, S.; Zhang, Y. A comprehensive performance evaluation of temperature swing adsorption for post-combustion carbon dioxide capture. Renew. Sustain. Energy Rev. 2019, 114, 109285. [Google Scholar] [CrossRef]
- Siegelman, R.L.; Milner, P.J.; Kim, E.J.; Weston, S.C.; Long, J.R. Challenges and opportunities for adsorption-based CO2 capture from natural gas combined cycle emissions. Energy Environ. Sci. 2019, 12, 2161–2173. [Google Scholar] [CrossRef] [PubMed]
- Qi, S.-C.; Wu, J.-K.; Lu, J.; Yu, G.-X.; Zhu, R.-R.; Liu, Y.; Liu, X.-Q.; Sun, L.-B. Underlying mechanism of CO2 adsorption onto conjugated azacyclo-copolymers: N-doped adsorbents capture CO2 chiefly through acid–base interaction? J. Mater. Chem. A 2019, 7, 17842–17853. [Google Scholar] [CrossRef]
- Kim, J.; Abouelnasr, M.; Lin, L.-C.; Smit, B. Large-Scale Screening of Zeolite Structures for CO2 Membrane Separations. J. Am. Chem. Soc. 2013, 135, 7545–7552. [Google Scholar] [CrossRef] [PubMed]
- Jeguirim, M.; Belhachemi, M.; Limousy, L.; Bennici, S. Adsorption/reduction of nitrogen dioxide on activated carbons: Textural properties versus surface chemistry—A review. Chem. Eng. J. 2018, 347, 493–504. [Google Scholar] [CrossRef]
- Smart, S.K.; Cassady, A.I.; Lu, G.Q.; Martin, D.J. The biocompatibility of carbon nanotubes. Carbon 2006, 44, 1034–1047. [Google Scholar] [CrossRef]
- Hsu, S.-C.; Lu, C.; Su, F.; Zeng, W.; Chen, W. Thermodynamics and regeneration studies of CO2 adsorption on multiwalled carbon nanotubes. Chem. Eng. Sci. 2010, 65, 1354–1361. [Google Scholar] [CrossRef]
- Osler, K.; Dheda, D.; Ngoy, J.; Wagner, N.; Daramola, M.O. Synthesis and evaluation of carbon nanotubes composite adsorbent for CO2 capture: A comparative study of CO2 adsorption capacity of single-walled and multi-walled carbon nanotubes. Int. J. Coal Sci. Technol. 2017, 4, 41–49. [Google Scholar] [CrossRef] [Green Version]
- Lee, M.-S.; Park, S.-J. Silica-coated multi-walled carbon nanotubes impregnated with polyethyleneimine for carbon dioxide capture under the flue gas condition. J. Solid State Chem. 2015, 226, 17–23. [Google Scholar] [CrossRef]
- Hu, H.; Zhang, T.; Yuan, S.; Tang, S. Functionalization of multi-walled carbon nanotubes with phenylenediamine for enhanced CO2 adsorption. Adsorption 2017, 23, 73–85. [Google Scholar] [CrossRef]
- Wang, Y.; Wang, H.; Zhang, T.C.; Yuan, S.; Liang, B. N-doped porous carbon derived from rGO-Incorporated polyphenylenediamine composites for CO2 adsorption and supercapacitors. J. Power Sources 2020, 472, 228610. [Google Scholar] [CrossRef]
- Xiao, J.; Wang, Y.; Zhang, T.C.; Yuan, S. rGO/N-porous carbon composites for enhanced CO2 capture and energy storage performances. J. Alloy. Compd. 2021, 857, 157534. [Google Scholar] [CrossRef]
- Wang, Y.; Xiao, J.; Wang, H.; Zhang, T.C.; Yuan, S. N-doped Porous Carbon Derived from Solvent-Free Synthesis of Cross-Linked Triazine Polymers for Simultaneously Achieving CO2 Capture and Supercapacitors. Chem. A Eur. J. 2021, 27, 7908–7914. [Google Scholar] [CrossRef]
- Kutorglo, E.M.; Hassouna, F.; Beltzung, A.; Kopecký, D.; Sedlářová, I.; Šoóš, M. Nitrogen-rich hierarchically porous polyaniline-based adsorbents for carbon dioxide (CO2) capture. Chem. Eng. J. 2019, 360, 1199–1212. [Google Scholar] [CrossRef]
- He, J.; To, J.W.F.; Psarras, P.C.; Yan, H.; Atkinson, T.; Holmes, R.T.; Nordlund, D.; Bao, Z.; Wilcox, J. Tunable Polyaniline-Based Porous Carbon with Ultrahigh Surface Area for CO2 Capture at Elevated Pressure. Adv. Energy Mater. 2016, 6, 1502491. [Google Scholar] [CrossRef]
- Zhang, X.; Cui, X.; Chen, W. A comprehensive study of polyaniline-derived porous carbons via KOH activation. RSC Adv. 2015, 5, 77629–77636. [Google Scholar] [CrossRef]
- Silvestre-Albero, A.; Silvestre-Albero, J.; Martínez-Escandell, M.; Rodríguez-Reinoso, F. Micro/Mesoporous Activated Carbons Derived from Polyaniline: Promising Candidates for CO2 Adsorption. Ind. Eng. Chem. Res. 2014, 53, 15398–15405. [Google Scholar] [CrossRef]
- Khalili, S.; Khoshandam, B.; Jahanshahi, M. Synthesis of activated carbon/polyaniline nanocomposites for enhanced CO2 adsorption. RSC Adv. 2016, 6, 35692–35704. [Google Scholar] [CrossRef]
- Chao, M.; Li, Y.; Wu, G.; Zhou, Z.; Yan, L. Functionalized Multiwalled Carbon Nanotube-Reinforced Polyimide Composite Films with Enhanced Mechanical and Thermal Properties. Int. J. Polym. Sci. 2019, 2019, 9302803. [Google Scholar] [CrossRef] [Green Version]
- Kumar Mishra, A.; Ramaprabhu, S. Polyaniline/multiwalled carbon nanotubes nanocomposite-an excellent reversible CO2 capture candidate. RSC Adv. 2012, 2, 1746–1750. [Google Scholar] [CrossRef]
- Gu, H.; Huang, Y.; Zhang, X.; Wang, Q.; Zhu, J.; Shao, L.; Haldolaarachchige, N.; Young, D.P.; Wei, S.; Guo, Z. Magnetoresistive polyaniline-magnetite nanocomposites with negative dielectrical properties. Polymer 2012, 53, 801–809. [Google Scholar] [CrossRef]
- Ouyang, L.; Wang, Y.; Zhang, P.; Wang, X.; Yuan, S. Heterostructured MWCNTs@PANI@TiO2 Nanocomposites for Enhanced Adsorption of As(III) from Aqueous Solution: Adsorption and Photocatalytic Oxidation Behaviors. Ind. Eng. Chem. Res. 2020, 59, 11743–11756. [Google Scholar] [CrossRef]
- Wang, Y.; Zhang, P.; Zhang, T.C.; Xiang, G.; Wang, X.; Pehkonen, S.; Yuan, S. A magnetic γ-Fe2O3@PANI@TiO2 core–shell nanocomposite for arsenic removal via a coupled visible-light-induced photocatalytic oxidation–adsorption process. Nanoscale Adv. 2020, 2, 2018–2024. [Google Scholar] [CrossRef] [Green Version]
- Wang, Z.; Goyal, N.; Liu, L.; Tsang, D.C.W.; Shang, J.; Liu, W.; Li, G. N-doped porous carbon derived from polypyrrole for CO2 capture from humid flue gases. Chem. Eng. J. 2020, 396, 125376. [Google Scholar] [CrossRef]
- Zhang, Y.; Jiang, D.; Wang, Y.; Zhang, T.C.; Xiang, G.; Zhang, Y.-X.; Yuan, S. Core–Shell Structured Magnetic γ-Fe2O3@PANI Nanocomposites for Enhanced As(V) Adsorption. Ind. Eng. Chem. Res. 2020, 59, 7554–7563. [Google Scholar] [CrossRef]
- Sevilla, M.; Valle-Vigón, P.; Fuertes, A.B. N-Doped Polypyrrole-Based Porous Carbons for CO2 Capture. Adv. Funct. Mater. 2011, 21, 2781–2787. [Google Scholar] [CrossRef] [Green Version]
- Yang, M.; Guo, L.; Hu, G.; Hu, X.; Xu, L.; Chen, J.; Dai, W.; Fan, M. Highly Cost-Effective Nitrogen-Doped Porous Coconut Shell-Based CO2 Sorbent Synthesized by Combining Ammoxidation with KOH Activation. Environ. Sci. Technol. 2015, 49, 7063–7070. [Google Scholar] [CrossRef]
- Yan, J.; Miao, L.; Duan, H.; Zhu, D.; Lv, Y.; Xiong, W.; Li, L.; Gan, L.; Liu, M. Core-shell hierarchical porous carbon spheres with N/O doping for efficient energy storage. Electrochim. Acta 2020, 358, 136899. [Google Scholar] [CrossRef]
- Miao, L.; Duan, H.; Zhu, D.; Lv, Y.; Gan, L.; Li, L.; Liu, M. Boron “gluing” nitrogen heteroatoms in a prepolymerized ionic liquid-based carbon scaffold for durable supercapacitive activity. J. Mater. Chem. A 2021, 9, 2714–2724. [Google Scholar] [CrossRef]
- Iruretagoyena, D.; Bikane, K.; Sunny, N.; Lu, H.; Kazarian, S.G.; Chadwick, D.; Pini, R.; Shah, N. Enhanced selective adsorption desulfurization on CO2 and steam treated activated carbons: Equilibria and kinetics. Chem. Eng. J. 2020, 379, 122356. [Google Scholar] [CrossRef]
- Yang, Y.-C.; Wang, C.-S.; Wei, M.-C. Kinetics and mass transfer considerations for an ultrasound-assisted supercritical CO2 procedure to produce extracts enriched in flavonoids from Scutellaria barbata. J. CO2 Util. 2019, 32, 219–231. [Google Scholar] [CrossRef]
- Chwastowski, J.; Bradło, D.; Żukowski, W. Adsorption of Cadmium, Manganese and Lead Ions from Aqueous Solutions Using Spent Coffee Grounds and Biochar Produced by Its Pyrolysis in the Fluidized Bed Reactor. Materials 2020, 13, 2782. [Google Scholar] [CrossRef] [PubMed]
Scheme 1.
Schematic representation showing the synthetic route of M/P: (a) Preparation of M/P composites by in-situ oxidative polymerization, (b) freeze drying M/P composites, (c) mixture of M/P composites and KOH, and (d) high temperature activation of M/P composites.
Scheme 1.
Schematic representation showing the synthetic route of M/P: (a) Preparation of M/P composites by in-situ oxidative polymerization, (b) freeze drying M/P composites, (c) mixture of M/P composites and KOH, and (d) high temperature activation of M/P composites.

Figure 1.
Characteristics of M/P-0.1-600-2, M/P-0.1, PANI, and MWCNT samples: (a) FTIR spectra, (b) XRD patterns, (c) Raman spectra, and (d) TGA curves.
Figure 1.
Characteristics of M/P-0.1-600-2, M/P-0.1, PANI, and MWCNT samples: (a) FTIR spectra, (b) XRD patterns, (c) Raman spectra, and (d) TGA curves.

Figure 2.
SEM images of (a–c) M/P-0.1 and (d–f) M/P-0.1-600-2 at different magnifications. TEM images of (g–i) M/P-0.1 and (j–l) M/P-0.1-600-2 at different magnifications.
Figure 2.
SEM images of (a–c) M/P-0.1 and (d–f) M/P-0.1-600-2 at different magnifications. TEM images of (g–i) M/P-0.1 and (j–l) M/P-0.1-600-2 at different magnifications.

Figure 3.
XPS spectra of M/P-0.1: (a) wide scan, (b) C 1s, and (c) N 1s regions. XPS spectra of M/P-0.1-600-2: (d) wide scan, (e) C 1s, and (f) N 1s regions.
Figure 3.
XPS spectra of M/P-0.1: (a) wide scan, (b) C 1s, and (c) N 1s regions. XPS spectra of M/P-0.1-600-2: (d) wide scan, (e) C 1s, and (f) N 1s regions.

Figure 4.
(a) N2 adsorption-desorption isotherms of M/P-0.1-600-2, M/P-0.1, PANI, and MWCNT samples. (b) Corresponding pore size distribution profiles.
Figure 4.
(a) N2 adsorption-desorption isotherms of M/P-0.1-600-2, M/P-0.1, PANI, and MWCNT samples. (b) Corresponding pore size distribution profiles.

Figure 5.
(a) The CO2 adsorption capacity comparison of M/P-0.1-600-2 and MWCNTs absorbents. (b) Redlich–Peterson-fitted adsorption isotherms of M/P-0.1-600-2 at various temperatures. (c) Adsorption kinetics of CO2 on M/P-0.1-600-2. (d) Regeneration performance of A-TDP-12 on CO2 adsorption.
Figure 5.
(a) The CO2 adsorption capacity comparison of M/P-0.1-600-2 and MWCNTs absorbents. (b) Redlich–Peterson-fitted adsorption isotherms of M/P-0.1-600-2 at various temperatures. (c) Adsorption kinetics of CO2 on M/P-0.1-600-2. (d) Regeneration performance of A-TDP-12 on CO2 adsorption.

Publisher’s Note: MDPI stays neutral with regard to jurisdictional claims in published maps and institutional affiliations. |
© 2021 by the authors. Licensee MDPI, Basel, Switzerland. This article is an open access article distributed under the terms and conditions of the Creative Commons Attribution (CC BY) license (https://creativecommons.org/licenses/by/4.0/).
Share and Cite
MDPI and ACS Style
Xiong, Y.; Wang, Y.; Jiang, H.; Yuan, S. MWCNT Decorated Rich N-Doped Porous Carbon with Tunable Porosity for CO2 Capture. Molecules 2021, 26, 3451. https://0-doi-org.brum.beds.ac.uk/10.3390/molecules26113451
AMA Style
Xiong Y, Wang Y, Jiang H, Yuan S. MWCNT Decorated Rich N-Doped Porous Carbon with Tunable Porosity for CO2 Capture. Molecules. 2021; 26(11):3451. https://0-doi-org.brum.beds.ac.uk/10.3390/molecules26113451
Chicago/Turabian StyleXiong, Yuanjie, Yuan Wang, Housheng Jiang, and Shaojun Yuan. 2021. "MWCNT Decorated Rich N-Doped Porous Carbon with Tunable Porosity for CO2 Capture" Molecules 26, no. 11: 3451. https://0-doi-org.brum.beds.ac.uk/10.3390/molecules26113451