
Simulation of Organic Liquid Products Deoxygenation by Multistage Countercurrent Absorber/Stripping Using CO2 as Solvent with Aspen-HYSYS: Thermodynamic Data Basis and EOS Modeling

 ,
, 
Abstract
:1. Introduction
2. Modeling and Simulation Methodology
2.1. Thermodynamic Modeling
2.1.1. Prediction of Thermo-Physical (Tb), Critical Properties (Tc, Pc, Vc), and Acentric Factor (ω) of OLP Compounds
Methods to Predict Thermo-Physical (Tb) and Critical Properties (Tc, Pc, Vc)
Methods Selected to Predict the Acentric Factor (ω)
- I.
- Predicted by using experimental data of critical properties, and experimental data of vapor pressure at Tr = 0.7 [71];
- II.
- Predicted by using experimental values of critical properties and vapor pressure data at Tr = 0.7, computed with Wagner’s equation [72], and the parameters obtained from experimental data fitting.
2.1.2. Statistical Analysis of Predicted Thermo-Physical Property (Tb), Critical Properties (Tc, Pc, Vc), and Acentric Factor (ω) of OLP Compounds
- The lower values for the average relative deviation (ARD) and standard deviation (S) define the best methods;
- In cases where the lower average deviation corresponds to the higher standard deviation, or vice versa, the method is selected by the lower range of deviation (R).
2.1.3. Correlation of Phase Equilibrium Data for the Binary System OLP Compounds-i-CO2
EOS Modeling
High-Pressure Equilibrium Data for the Binary Systems OLP Compound-i-CO2
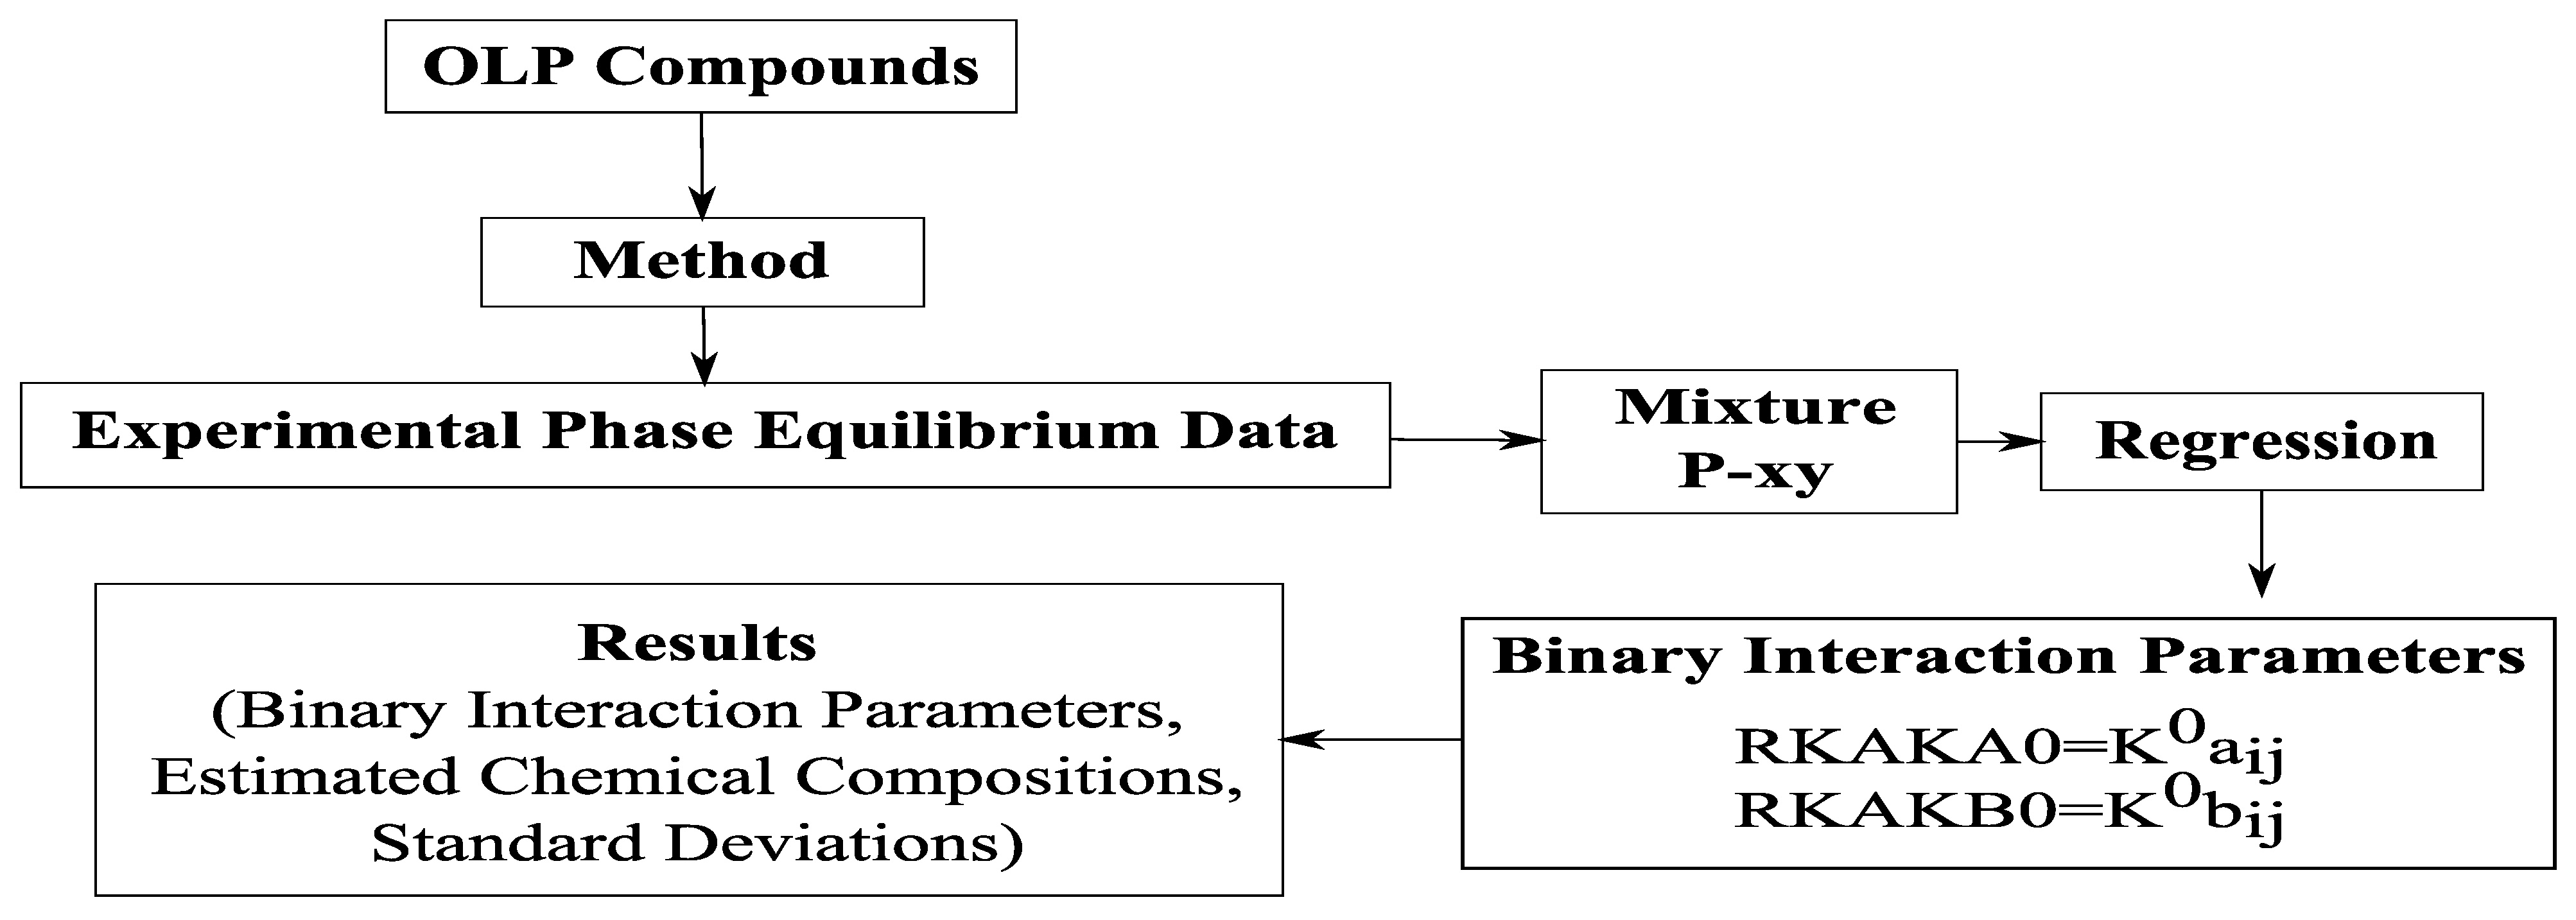
Schematic Diagram of Phase Equilibria Data Correlation
- Choice of components;
- Specification of the method (where the model applied for the regression of the experimental data is chosen);
- Introduction or choice of experimental data (T-xy, P-xy, TP-x, T-x, TP-xy, T-xx, P-xx, TP-xx, TP-xxy, etc.) depending on the type and information of the system; at this stage it is possible to either search for the compounds from the Aspen Properties® data base or enter experimental data manually;
- Regression of data: In this step the type of parameter, the parameters (according to the coding of the program) to be adjusted/correlated, the initial estimate and the limits for the regression chosen.
3. Results and Discussions
3.1. Prediction of Thermo-Physical Properties and the Acentric Factor of OLP Compounds
3.1.1. Normal Boiling Temperature (Tb) of OLP Compounds
3.1.2. Critical Temperature (Tc) of OLP Compounds
3.1.3. Critical Pressure (Pc) of OLP Compounds
3.1.4. Critical Volume (Vc) of OLP Compounds
3.1.5. Acentric Factor (ω) of OLP Compounds
3.2. Thermodynamic Modeling of Phase Equilibrium Data for the Binary System OLP Compounds-i/CO2
3.2.1. Estimation of Thermo-Physical (Tb), Critical Properties (Tc, Pc, Vc), and Acentric factor (ω) of OLP Compounds
3.2.2. Thermo-Physical (Tb), Critical Properties (Tc, Pc, Vc), and Acentric Factor (ω) of Olive Oil Key (Oleic Acid, Squalene, Triolein) Compounds
3.2.3. Estimation of RK-Aspen EOS Temperature-Independent Binary Interaction Parameters for the Binary Systems Hydrocarbons-i-CO2 and Carboxylic Acids-i-CO2
3.2.4. Estimation of RK-Aspen EOS Temperature-Independent Binary Interaction Parameters for the Binary Systems Olive Oil Key (Oleic Acid, Squalene, Triolein) Compounds-i-CO2
Equation of State (EOS) Modeling for the Binary Systems Olive Oil Key (Oleic Acid, Squalene, Triolein) Compounds-i-CO2
Simulation Modeling for the Model System Olive Oil Key (Oleic Acid-Squalene-Triolen-CO2
4. Conclusions
Supplementary Materials
Author Contributions
Funding
Institutional Review Board Statement
Informed Consent Statement
Data Availability Statement
Acknowledgments
Conflicts of Interest
References
- Hua, T.; Chunyi, L.; Chaohe, Y.; Honghong, S. Alternative processing technology for converting vegetable oil and animal fats to clean fuels and light olefins. Chin. J. Chem. Eng. 2008, 16, 394–400. [Google Scholar]
- Prado, C.M.; Filho, N.R.A. Production and characterization of the biofuels obtained by thermal cracking and thermal catalytic cracking of vegetable oils. J. Anal. Appl. Pyrolysis 2009, 86, 338–347. [Google Scholar] [CrossRef]
- Vonghia, E.; Boocock, D.G.B.; Konar, S.K.; Leung, A. Pathways for the Deoxygenation of Triglycerides to Aliphatic Hydrocarbons over Activated Alumina. Energy Fuels 1995, 9, 1090–1096. [Google Scholar] [CrossRef]
- Xu, J.; Jiang, J.; Sun, Y.; Chen, J. Production of hydrocarbon fuels from pyrolysis of soybean oils using a basic catalyst. Bioresour. Technol. 2010, 101, 9803–9806. [Google Scholar] [CrossRef]
- Taufiqurrahmi, N.; Bhatia, S. Catalytic cracking of edible and non-edible oils for the production of biofuels. Energy Environ. Sci. 2011, 4, 1087–1112. [Google Scholar] [CrossRef]
- Buzetzki, E.; Sidorová, K.; Cvengrošová, Z.; Cvengroš, J. Effects of oil type on products obtained by cracking of oils and fats. Fuel Process. Technol. 2011, 92, 2041–2047. [Google Scholar] [CrossRef]
- Buzetzki, E.; Sidorová, K.; Cvengrošová, Z.; Kaszonyi, A.; Cvengroš, J. The influence of zeolite catalysts on the products of rapeseed oil cracking. Fuel Process. Technol. 2011, 92, 1623–1631. [Google Scholar] [CrossRef]
- Yu, F.; Gao, L.; Wang, W.; Zhang, G.; Ji, J. Bio-fuel production from the catalytic pyrolysis of soybean oil over Me-Al-MCM-41 (Me = La, Ni or Fe) mesoporous materials. J. Anal. Appl. Pyrolysis 2013, 104, 325–329. [Google Scholar] [CrossRef]
- Doronin, V.; Potapenko, O.; Lipin, P.; Sorokina, T. Catalytic cracking of vegetable oils and vacuum gas oil. Fuel 2013, 106, 757–765. [Google Scholar] [CrossRef]
- Mota, S.A.P.; Mâncio, A.A.; Lhamas, D.E.L.; de Abreu, D.H.; da Silva, M.S.; dos Santos, W.G.; de Castro, D.A.R.; de Oliveira, R.M.; Araújo, M.E.; Borges, L.E.P.; et al. Production of green diesel by thermal catalytic cracking of crude palm oil (Elaeis guineensis Jacq) in a pilot plant. J. Anal. Appl. Pyrolysis 2014, 110, 1–11. [Google Scholar] [CrossRef]
- Twaiq, F.A.; Mohamed, A.R.; Bhatia, S. Liquid hydrocarbon fuels from palm oil by catalytic cracking over aluminosilicate mesoporous catalysts with various Si/Al ratios. Microporous Mesoporous Mater. 2003, 64, 95–107. [Google Scholar] [CrossRef]
- Twaiq, F.A.; Zabidi, N.A.; Bhatia, S. Catalytic Conversion of Palm Oil to Hydrocarbons: Performance of Various Zeolite Catalysts. Ind. Eng. Chem. Res. 1999, 38, 3230–3237. [Google Scholar] [CrossRef]
- Twaiq, F.A.; Mohamad, A.R.; Bhatia, S. Performance of composite catalysts in palm oil cracking for the production of liquid fuels and chemicals. Fuel Process. Technol. 2004, 85, 1283–1300. [Google Scholar] [CrossRef]
- Siswanto, D.Y.; Salim, G.W.; Wibisono, N.; Hindarso, H.; Sudaryanto, Y.; Ismadji, S. Gasoline Production from Palm Oil via Catalytic Cracking using MCM41: Determination of Optimum Conditions. J. Eng. Appl. Sci. 2008, 3, 42–46. [Google Scholar]
- Sang, O.Y. Biofuel Production from Catalytic Cracking of Palm Oil. Energy Sources 2003, 25, 859–869. [Google Scholar] [CrossRef]
- Mancio, A.D.A.; Da Costa, K.; Ferreira, C.; Santos, M.; Lhamas, D.; Mota, S.; Leão, R.; De Souza, R.; Araújo, M.; Borges, L.; et al. Process analysis of physicochemical properties and chemical composition of organic liquid products obtained by thermochemical conversion of palm oil. J. Anal. Appl. Pyrolysis 2017, 123, 284–295. [Google Scholar] [CrossRef]
- Mancio, A.D.A.; da Costa, K.; Ferreira, C.; Santos, M.; Lhamas, D.; Mota, S.; Leão, R.; de Souza, R.; Araújo, M.; Borges, L.; et al. Thermal catalytic cracking of crude palm oil at pilot scale: Effect of the percentage of Na2CO3 on the quality of biofuels. Ind. Crop. Prod. 2016, 91, 32–43. [Google Scholar] [CrossRef]
- Dandik, L.; Aksoy, H.A.; Erdem-Senatalar, A. Catalytic Conversion of Used Oil to Hydrocarbon Fuels in a Fractionating Pyrolysis Reactor. Energy Fuels 1998, 12, 1148–1152. [Google Scholar] [CrossRef]
- Dandik, L.; Aksoy, H. Pyrolysis of used sunflower oil in the presence of sodium carbonate by using fractionating pyrolysis reactor. Fuel Process. Technol. 1998, 57, 81–92. [Google Scholar] [CrossRef]
- Li, L.; Quan, K.; Xu, J.; Liu, F.; Liu, S.; Yu, S.; Xie, C.; Zhang, B.; Ge, X. Liquid Hydrocarbon Fuels from Catalytic Cracking of Waste Cooking Oils Using Basic Mesoporous Molecular Sieves K2O/Ba-MCM-41 as Catalysts. ACS Sustain. Chem. Eng. 2013, 1, 1412–1416. [Google Scholar] [CrossRef]
- Ooi, Y.-S.; Zakaria, R.; Mohamed, A.R.; Bhatia, S. Catalytic Cracking of Used Palm Oil and Palm Oil Fatty Acids Mixture for the Production of Liquid Fuel: Kinetic Modeling. Energy Fuels 2004, 18, 1555–1561. [Google Scholar] [CrossRef]
- Charusiri, W.; Vitidsant, T. Kinetic Study of Used Vegetable Oil to Liquid Fuels over Sulfated Zirconia. Energy Fuels 2005, 19, 1783–1789. [Google Scholar] [CrossRef]
- Dandïk, L.; Aksoy, H. Effect of catalyst on the pyrolysis of used oil carried out in a fractionating pyrolysis reactor. Renew. Energy 1999, 16, 1007–1010. [Google Scholar] [CrossRef]
- Ooi, Y.S.; Zakaria, R.; Mohamed, A.R.; Bhatia, S. Synthesis of Composite Material MCM-41/Beta and Its Catalytic Performance in Waste Used palm Oil Cracking. Appl. Catal. A Gen. 2004, 274, 15–23. [Google Scholar] [CrossRef]
- Chang, W.H.; Tye, C.T. Catalytic Cracking of Used Palm Oil Using Composite Zeolite. Malays. J. Anal. Sci. 2013, 17, 176–184. [Google Scholar]
- Weber, B.; Stadlbauer, E.A.; Eichenauer, S.; Frank, A.; Steffens, D.; Elmar, S.; Gerhard, S. Characterization of Alkanes and Olefins from Thermo-Chemical Conversion of Animal Fat. J. Biobased Mater. Bioenergy 2014, 8, 526–537. [Google Scholar] [CrossRef]
- Eichenauer, S.; Weber, B.; Stadlbauer, E.A. Thermochemical Processing of Animal Fat and Meat and Bone Meal to Hydrocarbons based Fuels. In Proceedings of the ASME 2015, 9th International Conference on Energy Sustainability, San Diego, CA, USA, 28 June–2 July 2015; Paper N° ES2015-49197, p. V001T02A001. [Google Scholar] [CrossRef]
- Weber, B.; Stadlbauer, E.A.; Stengl, S.; Hossain, M.; Frank, A.; Steffens, D.; Schlich, E.; Schilling, G. Production of hydrocarbons from fatty acids and animal fat in the presence of water and sodium carbonate: Reactor performance and fuel properties. Fuel 2012, 94, 262–269. [Google Scholar] [CrossRef]
- Wang, S.; Guo, Z.; Cai, Q.; Guo, L. Catalytic conversion of carboxylic acids in bio-oil for liquid hydrocarbons production. Biomass Bioenergy 2012, 45, 138–143. [Google Scholar] [CrossRef]
- Bielansky, P.; Weinert, A.; Schönberger, C.; Reichhold, A. Gasoline and gaseous hydrocarbons from fatty acids via catalytic cracking. Biomass Convers. Biorefin. 2012, 2, 53–61. [Google Scholar] [CrossRef]
- Ooi, Y.-S.; Zakaria, R.; Mohamed, A.R.; Bhatia, S. Catalytic conversion of palm oil-based fatty acid mixture to liquid fuel. Biomass Bioenergy 2004, 27, 477–484. [Google Scholar] [CrossRef]
- Bhatia, S. Catalytic Conversion of Fatty Acids Mixture to Liquid Fuels over Mesoporous Materials. React. Kinet. Mech. Catal. Lett. 2005, 84, 295–302. [Google Scholar] [CrossRef]
- Ooi, Y.-S.; Zakaria, R.; Mohamed, A.R.; Bhatia, S. Catalytic Conversion of Fatty Acids Mixture to Liquid Fuel and Chemicals over Composite Microporous/Mesoporous Catalysts. Energy Fuels 2005, 19, 736–743. [Google Scholar] [CrossRef]
- Lappi, H.; Alén, R. Production of vegetable oil-based biofuels—Thermochemical behavior of fatty acid sodium salts during pyrolysis. J. Anal. Appl. Pyrolysis 2009, 86, 274–280. [Google Scholar] [CrossRef]
- Santos, M.; Lourenço, R.; De Abreu, D.; Pereira, A.; De Castro, D.; Pereira, M.; Almeida, H.; Mancio, A.D.A.; Lhamas, D.; Mota, S.; et al. Gasoline-like hydrocarbons by catalytic cracking of soap phase residue of neutralization process of palm oil (Elaeis guineensis Jacq). J. Taiwan Inst. Chem. Eng. 2017, 71, 106–119. [Google Scholar] [CrossRef]
- Almeida, H.D.S.; Correa, O.A.; Eid, J.G.; Ribeiro, H.; De Castro, D.; Pereira, M.; Pereira, L.M.; Mancio, A.D.A.; Santos, M.; Souza, J.A.; et al. Production of biofuels by thermal catalytic cracking of scum from grease traps in pilot scale. J. Anal. Appl. Pyrolysis 2016, 118, 20–33. [Google Scholar] [CrossRef]
- Almeida, H.D.S.; Corrêa, O.; Eid, J.; Ribeiro, H.; De Castro, D.; Pereira, M.; Pereira, L.; Aâncio, A.D.A.; Santos, M.; Mota, S.; et al. Performance of thermochemical conversion of fat, oils, and grease into kerosene-like hydrocarbons in different production scales. J. Anal. Appl. Pyrolysis 2016, 120, 126–143. [Google Scholar] [CrossRef]
- Almeida, H.D.S.; Corrêa, O.; Ferreira, C.; Ribeiro, H.; de Castro, D.; Pereira, M.; Mâncio, A.D.A.; Santos, M.; Mota, S.; Souza, J.D.S.; et al. Diesel-like hydrocarbon fuels by catalytic cracking of fat, oils, and grease (FOG) from grease traps. J. Energy Inst. 2017, 90, 337–354. [Google Scholar] [CrossRef]
- de Andrade Mâncio, A. Production, Fractionation and De-Acidification of Biofuels Obtained by Thermal Catalytic Cracking of Vegetable Oils. Ph.D. Thesis, Graduate Program of Natural Resources Engineering, UFPA, Belém, Brazil, April 2015. CDD 22, Ed. 660.2995. Available online: http://proderna.propesp.ufpa.br/ARQUIVOS/teses/Andreia.pdf (accessed on 16 July 2021).
- Ferreira, C.; Costa, E.; De Castro, D.; Pereira, M.; Mancio, A.D.A.; Santos, M.; Lhamas, D.; Mota, S.; Leão, A.; Duvoisin, S.; et al. Deacidification of organic liquid products by fractional distillation in laboratory and pilot scales. J. Anal. Appl. Pyrolysis 2017, 127, 468–489. [Google Scholar] [CrossRef]
- Mancio, A.D.A.; Mota, S.; Ferreira, C.; Carvalho, T.; Neto, O.; Zamian, J.; Araújo, M.; Borges, L.; Machado, N. Separation and characterization of biofuels in the jet fuel and diesel fuel ranges by fractional distillation of organic liquid products. Fuel 2018, 215, 212–225. [Google Scholar] [CrossRef]
- Vázquez, L.; Hurtado-Benavides, A.M.; Reglero, G.; Fornari, T.; Ibez, E.; Senorans, F.J. Deacidification of olive oil by countercurrent supercritical carbon dioxide extraction: Experimental and thermodynamic modeling. J. Food Eng. 2009, 90, 463–470. [Google Scholar] [CrossRef]
- Zacchi, P.; Bastida, S.C.; Jaeger, P.; Cocero, M.; Eggers, R.; Alonso, M.J.C. Countercurrent de-acidification of vegetable oils using supercritical CO2: Holdup and RTD experiments. J. Supercrit. Fluids 2008, 45, 238–244. [Google Scholar] [CrossRef]
- Machado, N.T. Fractionation of PFAD-Compounds in Countercurrent Columns Using Supercritical Carbon Dioxide as Solvent. Ph.D. Thesis, TU-Hamburg-Harburg, Hamburg, Germany, 1998. [Google Scholar]
- Araujo, M.E.; Machado, N.T.; Meireles, M.A.A. Modeling the Phase Equilibrium of Soybean Oil Deodorizer Distillates + Supercritical Carbon Dioxide Using the Peng-Robinson EOS. Ind. Eng. Chem. Res. 2001, 40, 1239–1243. [Google Scholar] [CrossRef]
- Costa, E.C.; Ferreira, C.C.; dos Santos, A.L.B.; da Silva Vargens, H.; Menezes, E.G.O.; Cunha, V.M.B.; da Silva, M.P.; Mâncio, A.A.; Machado, N.T.; Araújo, M.E. Process simulation of organic liquid products fractionation in countercurrent multistage columns using CO2 as solvent with Aspen-HYSYS. J. Supercrit. Fluids 2018, 140, 101–115. [Google Scholar] [CrossRef]
- Vitu, S.; Privat, R.; Jaubert, J.N.; Mutelet, F. Predicting the phase equilibria of CO2 + hydrocarbon systems with the PPR78 model (PR EOS and kij calculated through a group contribution method). J. Supercrit. Fluids 2008, 45, 1–26. [Google Scholar] [CrossRef]
- Jaubert, J.N.; Vitu, S.; Mutelet, F.; Corrioum, J.P. Extension of the PPR78 model (predictive 1978, Peng–Robinson EOS with temperature dependent kij calculated through a group contribution method) to systems containing aromatic compounds. Fluid Phase Equilibria 2005, 237, 193–211. [Google Scholar] [CrossRef]
- Tochigi, K.; Hasegawa, K.; Asano, N.; Kojima, K. Vapor−Liquid Equilibria for the Carbon Dioxide + Pentane and Carbon Dioxide + Toluene Systems. J. Chem. Eng. Data 1998, 43, 954–956. [Google Scholar] [CrossRef]
- Lay, E.N.; Taghikhani, V.; Ghotbi, C. Measurement and Correlation of CO2 Solubility in the Systems of CO2 + Toluene, CO2 + Benzene, and CO2 + n-Hexane at Near-Critical and Supercritical Conditions. J. Chem. Eng. Data 2006, 51, 2197–2200. [Google Scholar] [CrossRef]
- Pfohl, O.; Pagel, A.; Brunner, G. Phase equilibria in systems containing o-cresol, p-cresol, carbon dioxide, and ethanol at 323.15–473.15 K and 10–35 MPa. Fluid Phase Equilibria 1999, 157, 53–79. [Google Scholar] [CrossRef]
- Yamamoto, M.; Iwai, Y.; Nakajima, T.; Tanabe, D.; Arai, Y.; Yamamoto, M.; Iwai, Y.; Nakajima, T.; Tanabe, D.; Arai, Y. Correlation of Solubilities and Entrainer Effects for Fatty Acids and Higher Alcohols in Supercritical Carbon Dioxide Using SRK Equation of State with Association Model. J. Chem. Eng. Jpn. 2000, 33, 538–544. [Google Scholar] [CrossRef]
- Gracia, I.; García, M.T.; Rodríguez, J.F.; Fernández, M.P.; de Lucas, A. Modelling of the phase behavior for vegetable oils at supercritical conditions. J. Supercrit. Fluids 2009, 48, 189–194. [Google Scholar] [CrossRef]
- Zamudio, M.; Schwarz, C.E.; Knoetze, J.H. Experimental measurement and modelling with Aspen Plus® of the phase behavior of supercritical CO2 + (n-dodecane + 1-decanol + 3,7-dimethyl-1-octanol). J. Supercrit. Fluids 2013, 84, 132–145. [Google Scholar] [CrossRef]
- Quinteros-Lama, H.; Llovell, F. Global phase behavior in carbon dioxide plus n-alkanes binary mixtures. J. Supercrit. Fluids 2018, 140, 147–158. [Google Scholar] [CrossRef]
- Le Thi, C.; Tamouza, S.; Passarello, J.-P.; Tobaly, P.; de Hemptinne, J.-C. Modeling Phase Equilibrium of H2 + n-Alkane and CO2 + n-Alkane Binary Mixtures Using a Group Contribution Statistical Association Fluid Theory Equation of State (GC-SAFT-EOS) with a kij Group Contribution Method. Ind. Eng. Chem. Res. 2006, 45, 6803–6810. [Google Scholar] [CrossRef]
- Ambrose, D.; Ghiassee, N. Vapour pressures and critical temperatures and critical pressures of some alkanoic acids: C1 to C10. J. Chem. Thermodyn. 1987, 19, 505–519. [Google Scholar] [CrossRef]
- Simmrock, K.H.; Janowsky, R.; Ohnsorge, A. Critical Data of Pure Substances; Chemistry Data Series; DECHEMA: Frankfurt, Germany, 1986; Volumes 1–2. [Google Scholar]
- Danner, R.P.; Daubert, T.E. Tables of Physical Thermodynamic Properties of Pure Compounds; Design Institute for Physical Property Data (DIPPR), AIChE: New York, NY, USA, 1991. [Google Scholar]
- Yaws, C.L. Thermophysical Properties of Chemicals and Hydrocarbons, 2nd ed.; Willian Andrew Inc.: New York, NY, USA, 2014; 809p. [Google Scholar]
- Teja, A.; Lee, R.; Rosenthal, D.; Anselme, M. Correlation of the critical properties of alkanes and alkanols. Fluid Phase Equilibria 1990, 56, 153–169. [Google Scholar] [CrossRef]
- Boublik, T.; Fried, V.; Hala, E. The Vapor Pressure of Pure Substances, 2nd ed.; Elsevier: New York, NY, USA, 1984; 980p. [Google Scholar]
- Joback, K.; Reid, R. Estimation of pure-component properties from group-contributions. Chem. Eng. Commun. 1987, 57, 233–243. [Google Scholar] [CrossRef]
- Constantinou, L.; Gani, R. New group contribution method for estimating properties of pure compounds. AIChE J. 1994, 40, 1697–1710. [Google Scholar] [CrossRef]
- Marrero-Morejón, J.; Pardillo-Fontdevila, E. Estimation of pure compound properties using group-interaction contributions. AIChE J. 1999, 45, 615–621. [Google Scholar] [CrossRef]
- Marrero, J.; Gani, R. Group-contribution based estimation of pure component properties. Fluid Phase Equilibria 2001, 183–184, 183–208. [Google Scholar] [CrossRef]
- Constantinou, L.; Gani, R.; O’Connell, J.P. Estimation of the acentric factor and the liquid molar volume at 298 K using a new group contribution method. Fluid Phase Equilibria 1995, 103, 11–22. [Google Scholar] [CrossRef]
- Han, B.; Peng, D.-Y. A group-contribution correlation for predicting the acentric factors of organic compounds. Can. J. Chem. Eng. 1993, 71, 332–334. [Google Scholar] [CrossRef]
- Araújo, M.E.; Meireles, M.A. Improving phase equilibrium calculation with the Peng–Robinson EOS for fats and oils related compounds/supercritical CO2 systems. Fluid Phase Equilibria 2000, 169, 49–64. [Google Scholar] [CrossRef]
- Vetere, A. Predicting the vapor pressures of pure compounds by using the wagner equation. Fluid Phase Equilibria 1991, 62, 1–10. [Google Scholar] [CrossRef]
- Pitzer, K.S.; Lippman, D.Z.; Curl, R.F., Jr.; Huggins, C.M.; Patersen, D.E. The volumetric and thermodynamic properties of fluids. I. Theoretical basis and virial coefficients. II. Compressibility factor, vapor pressure and entropy of vaporization. J. Am. Chem. Soc. 1955, 77, 3427–3440. [Google Scholar] [CrossRef]
- Wagner, Z. Vapor–liquid equilibrium in the carbon dioxide-ethyl propanoate system at pressures from 2 to 9 MPa and temperatures from 303 to 323 K. Fluid Phase Equilibria 1995, 112, 125–129. [Google Scholar] [CrossRef]
- Melo, S.A.B.V.; Mendes, M.F.; Pessoa, F.L.P. An oriented way to estimate Tc and Pc using the most accurate methods available. Braz. J. Chem. Eng. 1996, 13, 192–199. [Google Scholar]
- Jiménez-Gallegos, R.; Galicia-Luna, L.A.; Elizalde-Solis, O. Experimental Vapor–Liquid Equilibria for the Carbon Dioxide + Octane and Carbon Dioxide + Decane Systems. J. Chem. Eng. Data 2006, 51, 1624–1628. [Google Scholar] [CrossRef]
- Camacho-Camacho, L.E.; Galicia-Luna, L.A.; Elizalde-Solis, O.; Martínez-Ramírez, Z. New isothermal vapor–liquid equilibria for the CO2 + n-nonane, and CO2 + n-undecane systems. Fluid Phase Equilibria 2007, 259, 45–50. [Google Scholar] [CrossRef]
- Gasem, K.A.M.; Dickson, K.B.; Dulcamara, P.B.; Nagarajan, N.; Robinson, R.L.J. Equilibrium Phase Compositions, Phase Densities, and Interfacial Tensions for CO2 + Hydrocarbon Systems. CO2 + n-Tetradecane. J. Chem. Inf. Model 1989, 34, 191–195. [Google Scholar]
- Secuianu, C.; Feroiu, V.; Geană, D. Phase Behavior for the Carbon Dioxide + N-Pentadecane Binary System. J. Chem. Eng. Data 2010, 55, 4255–4259. [Google Scholar] [CrossRef]
- D’Souza, R.; Patrick, J.R.; Teja, A.S. High-pressure phase equilibria in the carbon dioxide-n-hexadecane and carbon dioxide-water systems. Can. J. Chem. Eng. 1988, 66, 319. [Google Scholar] [CrossRef]
- Kim, H.; Lin, H.M.; Chao, K.-C. Vapor-liquid equilibrium in binary mixtures of carbon dioxide + n-propylcyclohexane and carbon dioxide + n-octadecane. AIChE Symp. Ser. 1985, 84, 96–101. [Google Scholar]
- Yau, J.-S.; Chiang, Y.-Y.; Shy, D.-S.; Tsai, F.-N. Solubilities of carbon dioxide in carboxylic acids under high pressures. J. Chem. Eng. Jpn. 1992, 25, 544–548. [Google Scholar] [CrossRef] [Green Version]
- Bharath, R.; Inomata, H.; Adschiri, T.; Arai, K. Phase equilibrium study for the separation and fractionation of fatty oil components using supercritical carbon dioxide. Fluid Phase Equilibria 1992, 81, 307–320. [Google Scholar] [CrossRef]
- Weber, W.; Petkov, S.; Brunner, G. Vapour–liquid-equilibria and calculations using the Redlich–Kwong-Aspen-equation of state for tristearin, tripalmitin, and triolein in CO2 and propane. Fluid Phase Equilibria 1999, 158-160, 695–706. [Google Scholar] [CrossRef]
- Zou, M.; Yu, Z.; Kashulines, P.; Rizvi, S.; Zollweg, J. Fluid-Liquid phase equilibria of fatty acids and fatty acid methyl esters in supercritical carbon dioxide. J. Supercrit. Fluids 1990, 3, 23–28. [Google Scholar] [CrossRef]
- Hernández, E.J.; Señoráns, F.J.; Reglero, G.; Fornari, T. High-Pressure Phase Equilibria of Squalene + Carbon Dioxide: New Data and Thermodynamic Modeling. J. Chem. Eng. Data 2010, 55, 3606–3611. [Google Scholar] [CrossRef]
- Brunner, G.; Saure, C.; Buss, D. Phase Equilibrium of Hydrogen, Carbon Dioxide, Squalene, and Squalane Phase Equilibrium of Hydrogen, Carbon Dioxide, Squalene, and Squalane. J. Chem. Eng. Data 2009, 54, 1598–1609. [Google Scholar] [CrossRef]
- Kontogeorgis, G.; Tassios, D.P. Critical constants and acentric factors for long-chain alkanes suitable for corresponding states applications. A critical review. Chem. Eng. J. 1997, 66, 35–49. [Google Scholar] [CrossRef]
- Owczarek, I.; Blazej, K. Recommended Critical Temperatures. Part 1. Aliphatic Hydrocarbons. ChemInform 2004, 35, 541–548. [Google Scholar] [CrossRef]
- Ceriani, R.; Gani, R.; Liu, Y.A. Predicition of Vapor Pressure and Heats of Vaporization of Edible Oil/Fat Compounds by Group Contribution. Fluid Phase Equilibria 2013, 337, 53–59. [Google Scholar] [CrossRef]
- Nikitin, E.D.; Pavlov, P.A.; Popov, A. Critical temperatures and pressures of 1-alkanols with 13 to 22 carbon atoms. Fluid Phase Equilibria 1998, 149, 223–232. [Google Scholar] [CrossRef]
- Simões, P.; Brunner, G. Multicomponent phase equilibria of an extra-virgin olive oil in supercritical carbon dioxide. J. Supercrit. Fluids 1996, 9, 75–81. [Google Scholar] [CrossRef]


| Constantinou-Gani [64] | Marrero-Gani [66] |
|---|---|
| Joback & Reid [63] | Marrero-Pardillo [65] |
| Equation of State | ||
|---|---|---|
| RK-Aspen | ||
| Mixing Rules | ||
| van der Waals (RK-Aspen) | ||
| CO2+ | N | T [K] | P [bar] | References |
|---|---|---|---|---|
| Decane | 29 | 319.11–372.94 | 34.85–160.60 | Jimenez-Gallegos et al. (2006) |
| Undecane | 18 | 314.98–344.46 | 23.73–133.88 | Camacho-Camacho et al. (2007) |
| Tetradecane | 2 | 344.28 | 155.54–162.99 | Gasem et al. (1989) |
| Pentadecane | 22 | 293.15–353.15 | 5.60–139.40 | Secuianu et al. (2010) |
| Hexadecane | 12 | 314.14–333.13 | 80.65–148.70 | D’Souza et al. (1988) |
| Octadecane | 12 | 534.86–605.36 | 10.16–61.90 | Kim et al. (1985) |
| Palmitic acid | 10 | 423.20–473.20 | 10.10–50.70 | Yau et al. (1992) |
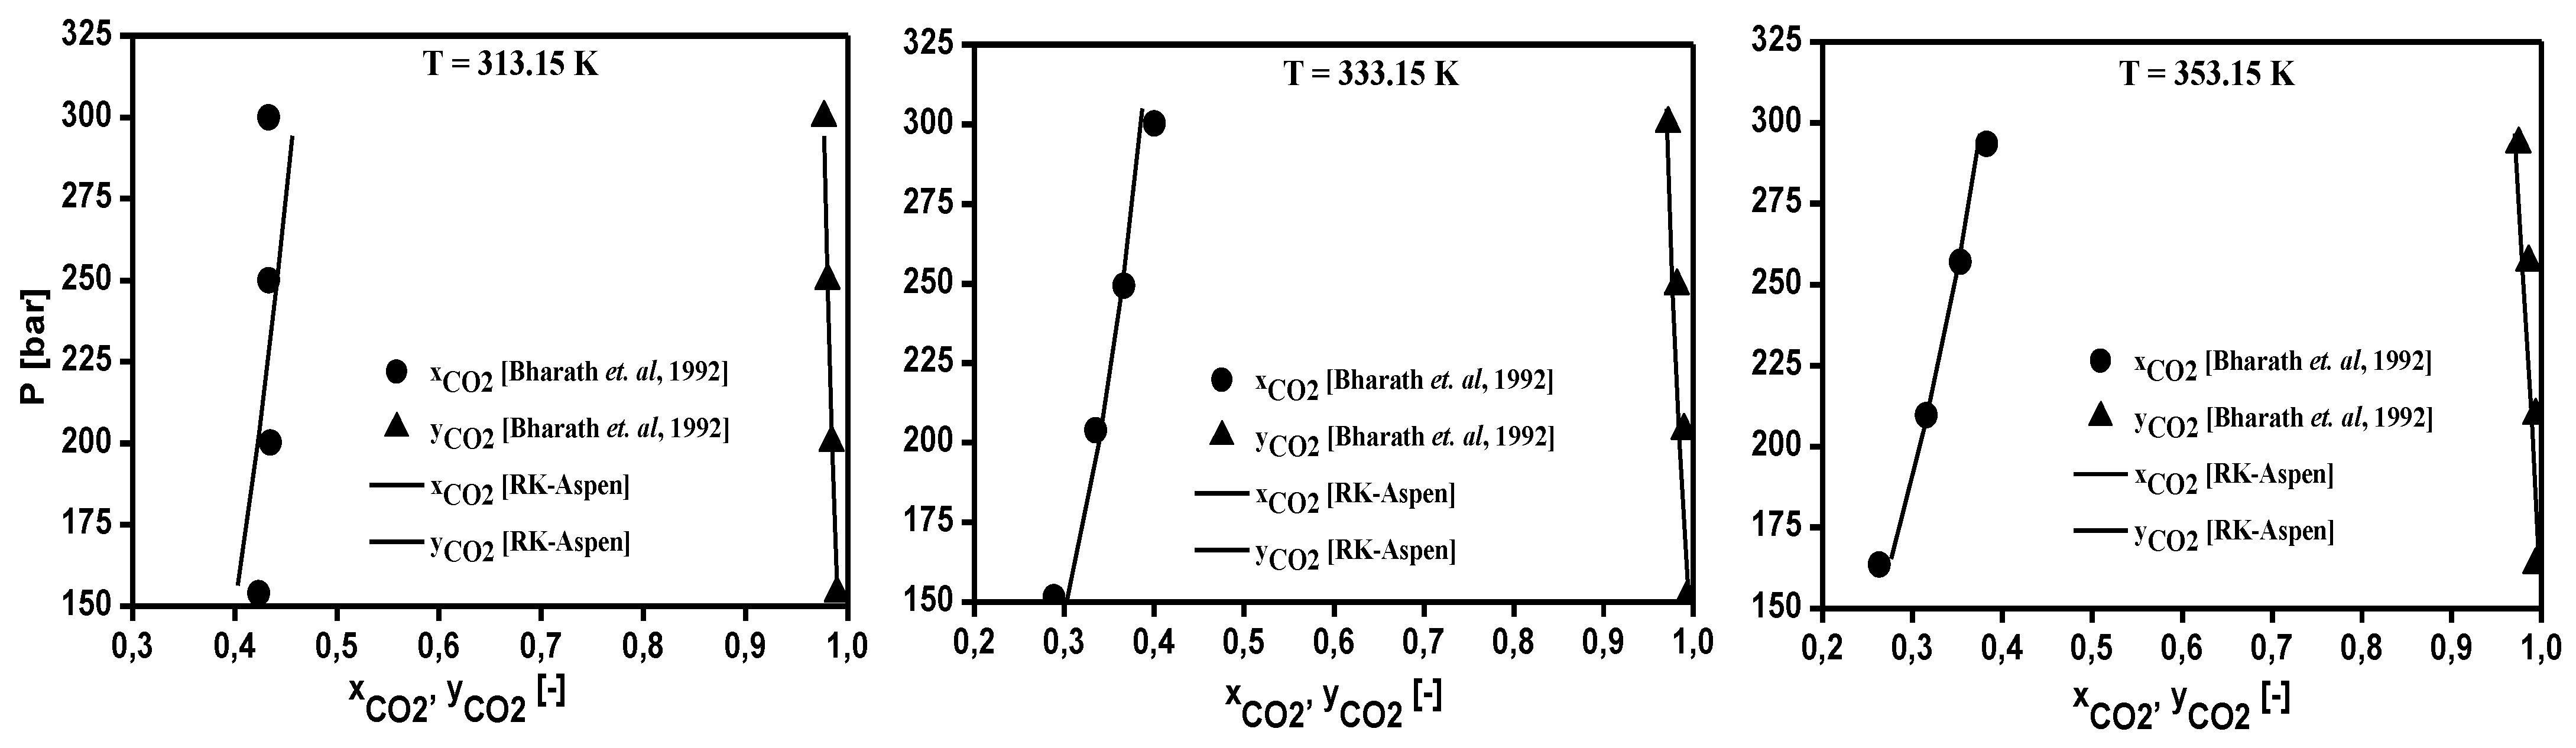
| Oleic acid | 16 | 313.15–353.15 | 101.70–300.20 | Bharath et al. (1992) |
| CO2+ | T [K] | P [bar] | N | References |
|---|---|---|---|---|
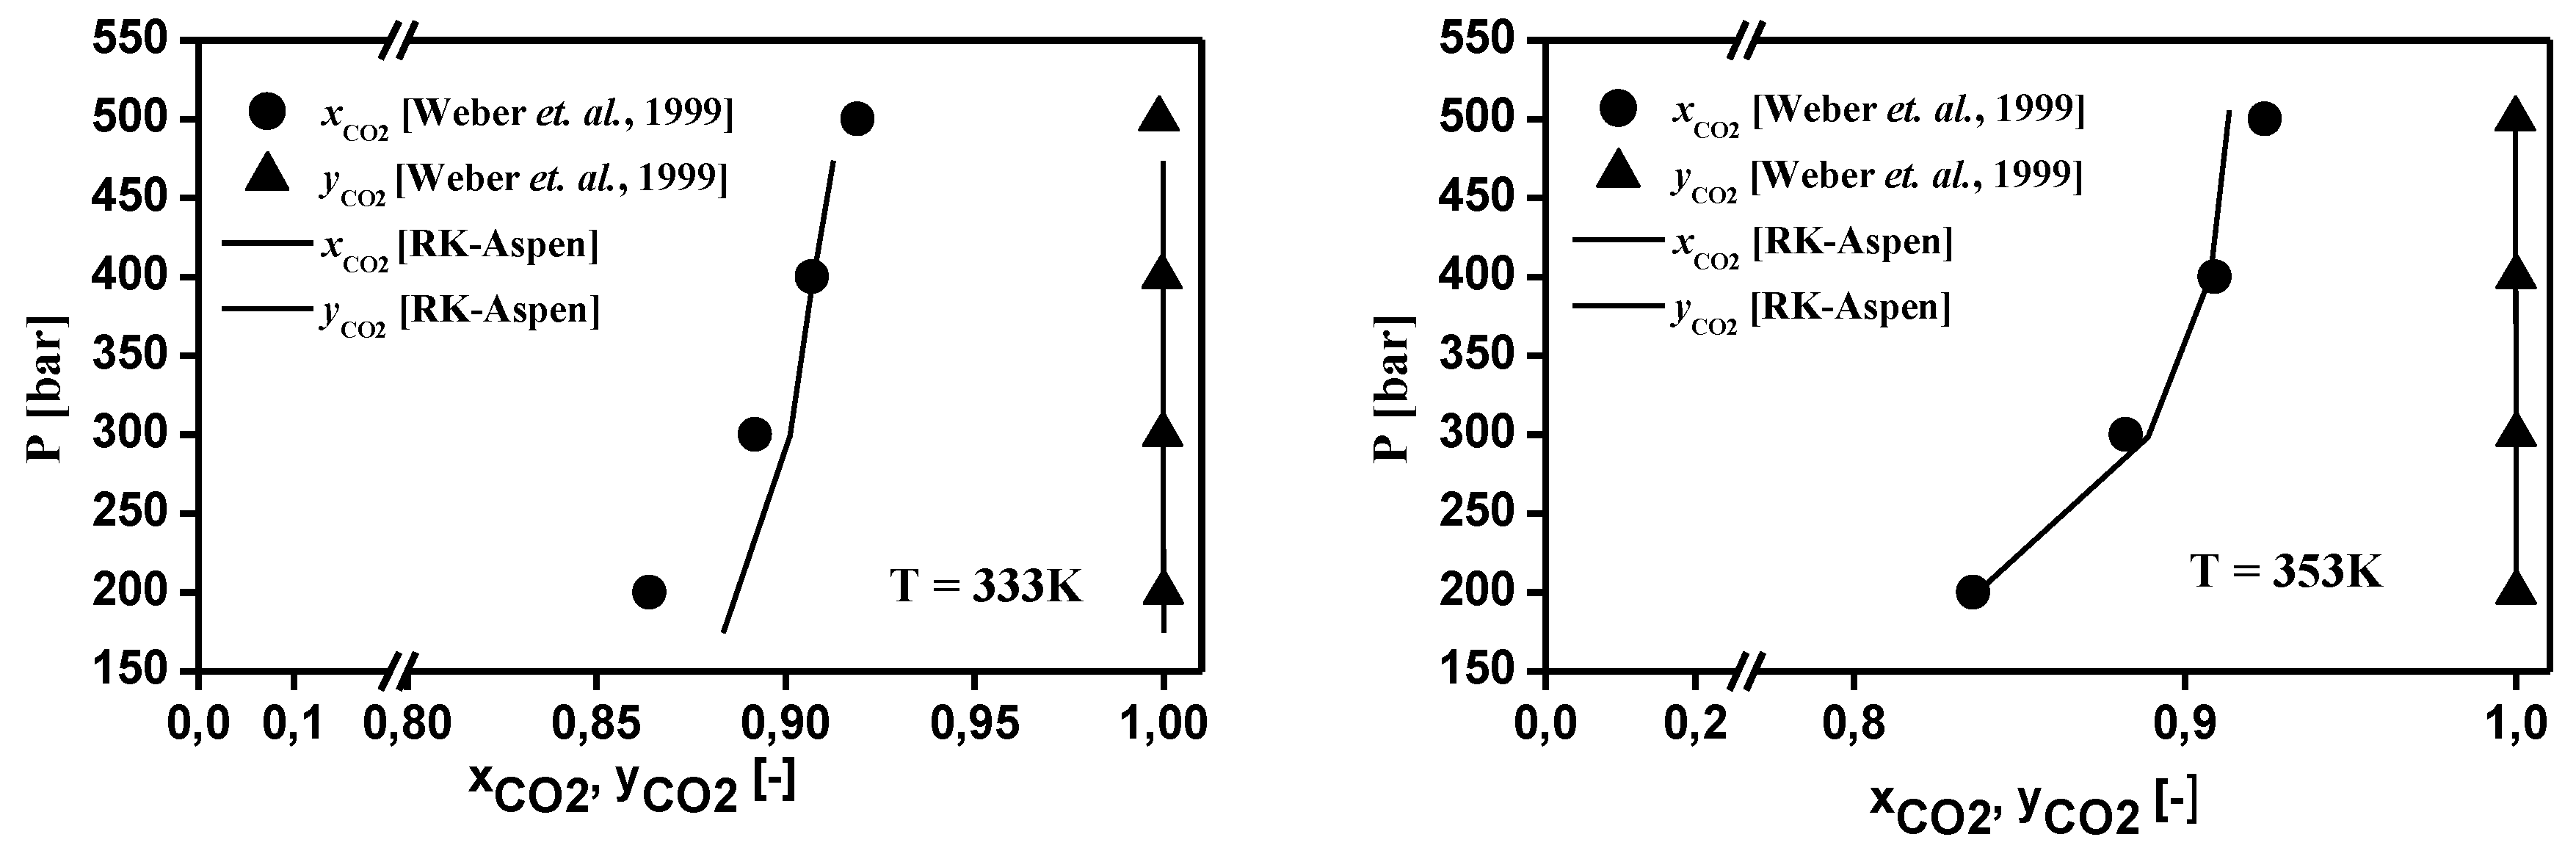
| Triolein | 333.15, 353.15 | 200-500 | 8 | Weber et al. (1999) |
| 313.15–333.15 | 153.4–310.0 | 8 | Bharath et al. (1992) | |
| Oleic acid | 313–333 | 72.1–284.1 | 12 | Zou et al. (1990) |
| 313.15–353.156 | 101.7–300.2 | 16 | Bharath et al. (1992) | |
| Squalene | 313–333 | 100–350 | 11 | Hernandez et al. (2010) |
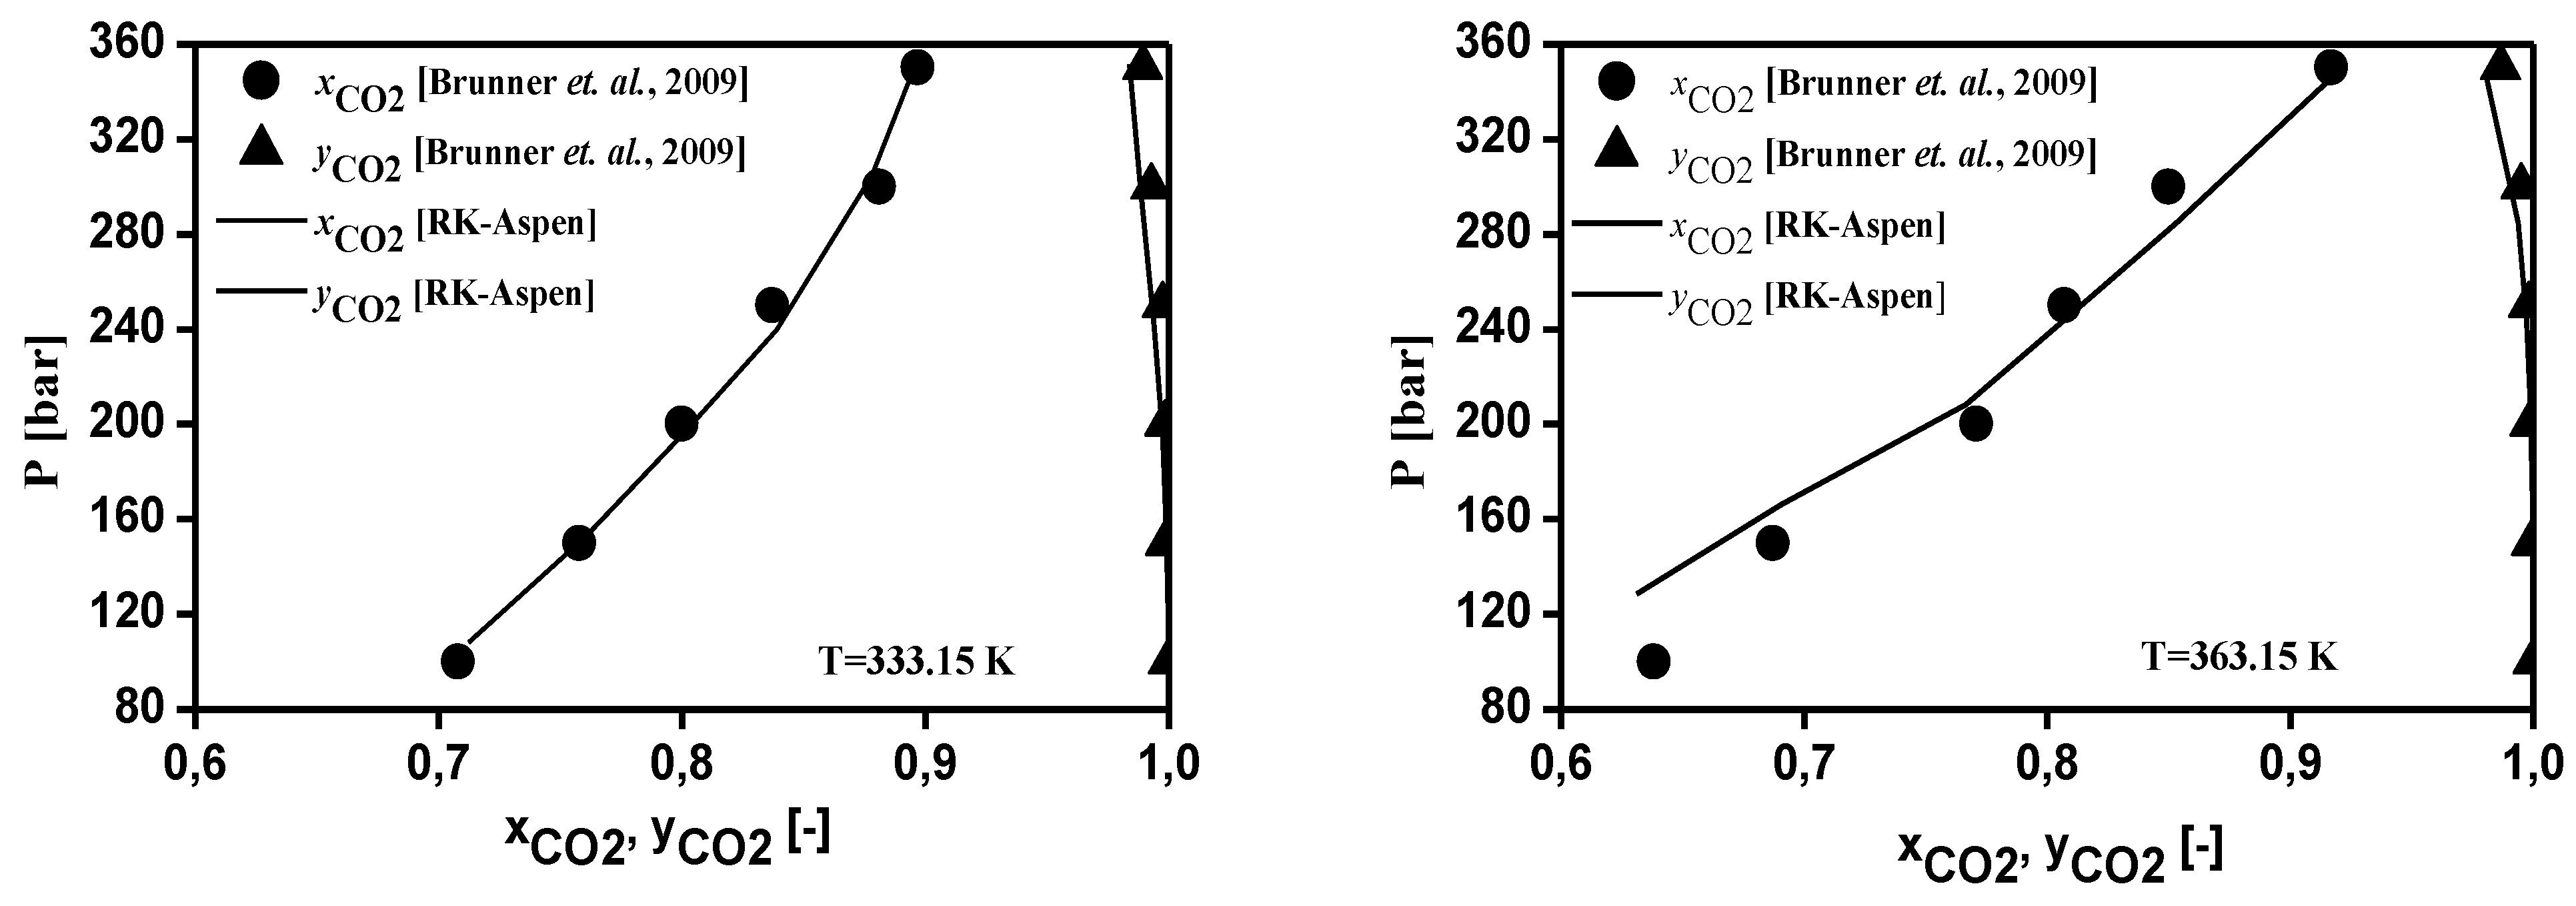
| 333.15–363.15 | 100–350 | 12 | Brunner et al. (2009) |
| Class of Hydrocarbons | N | ARD [%] | S [%] | R [%] | Methods |
|---|---|---|---|---|---|
| n-Alkanes | 27 | −2.806 | 1.943 | 6.797 | Marrero-Gani |
| Alkenes | 19 | −0.848 | 1.206 | 5.396 | Marrero-Gani |
| Unsubstituted cyclics | 9 | −2.001 | 4.815 | 13.720 | Constantinou-Gani |
| Substituted cyclics | 62 | −0.546 | 2.208 | 10.604 | Constantinou-Gani |
| Aromatics | 28 | −0.214 | 1.916 | 7.021 | Joback |
| Class of Hydrocarbons | N | ARD [%] | S [%] | R [%] | Methods |
|---|---|---|---|---|---|
| n-Alkanes | 15 | −0.685 | 0.157 | 0.496 | Marrero-Gani |
| Alkenes | 14 | 0.74 | 0.544 | 2.072 | Marrero-Gani |
| Unsubstituted cyclics | 7 | −0.839 | 2.113 | 5.364 | Marrero-Gani |
| Substituted cyclics | 13 | 0.152 | 1.089 | 3.364 | Marrero-Gani |
| Aromatics | 31 | −1.192 | 2.233 | 8.415 | Constantinou-Gani |
| Class of Hydrocarbons | N | ARD [%] | S [%] | R [%] | Methods |
|---|---|---|---|---|---|
| n-alkanes | 17 | 3.749 | 2.12 | 6.996 | Marrero-Pardillo |
| alkenes | 16 | 0.353 | 2.781 | 10.809 | Marrero-Gani |
| Unsubstituted cyclics | 7 | −0.47 | 2.355 | 6.593 | Joback |
| Substituted cyclics | 14 | 1.537 | 2.939 | 12.782 | Constantinou-Gani |
| Aromatics | 18 | 0.461 | 2.035 | 9.486 | Marrero-Gani |
| Class of Hydrocarbons | N | ARD [%] | S [%] | R [%] | Methods |
|---|---|---|---|---|---|
| n-alkanes | 8 | −0.23 | 0.681 | 2.070 | Marrero-Gani |
| alkenes | 16 | −0.113 | 1.210 | 4.013 | Marrero-Pardillo |
| Unsubstituted cyclics | 6 | −1.024 | 1.359 | 2.215 | Joback |
| Substituted cyclics | 14 | −0.318 | 4.832 | 12.717 | Marrero-Gani |
| Aromatics | 19 | 0.034 | 1.914 | 6.785 | Constantinou-Gani |
| Class of Hydrocarbons | N | ARD [%] | S [%] | R [%] | Methods |
|---|---|---|---|---|---|
| n-alkanes | 16 | 0.033 | 1.943 | 7.703 | Han-Peng |
| alkenes | 15 | 0.976 | 5.518 | 20.825 | Han-Peng |
| Unsubstituted cyclics | 7 | 2.822 | 2.555 | 7.374 | Vetere |
| Substituted cyclics | 16 | 1.843 | 3.539 | 15.089 | Vetere |
| Aromatics | 14 | 1.323 | 2.105 | 9.39 | Vetere |
| Compounds | Cas Number | MW | Tb [°C] | TC [°C] | PC [kPa] | Vc [m3/kmol] | ω |
|---|---|---|---|---|---|---|---|
| Triolein | 122-32-7 | 885.00 | 616.7 | 673.9 | 468.2 | 3.022 | 1.686 |
| Oleic acid | 122-80-1 | 282.2 | 353.7 | 579.4 | 1388.0 | 1.101 | 1.0787 |
| Squalene | 7683-64-9 | 410.7 | 401.2 | 564.9 | 653.0 | 2.052 | 1.398 |
| CO2+ | T [K] | AADx | AADy | ||
|---|---|---|---|---|---|
| Undecane | 314.98 | 0.116458 | −0.008014 | 0.0029 | 0.0003 |
| 344.46 | 0.103282 | −0.029465 | 0.0030 | 0.0036 | |
| Tetradecane | 344.28 | 0.099874 | −0.000546 | 0.0003 | 0.0011 |
| Pentadecane | 313.15 | 0.093344 | 0.026454 | 0.0125 | 0.0020 |
| 333.15 | 0.101805 | 0.014904 | 0.0067 | 0.0030 | |
| Hexadecane | 314.14 | 0.083111 | −0.075317 | 0.0117 | 0.0090 |
| 333.13 | 0.082146 | −0.081056 | 0.0013 | 0.0034 | |
| Octadecane | 534.86 | 0.246616 | 0.073306 | 0.0010 | 0.0024 |
| 605.36 | 0.107125 | 0.015525 | 0.0002 | 0.0064 | |
| Palmitic acid | 423.20 | −0.179556 | −0.042625 | 0.0037 | 8.93 × 10⁻⁵ |
| 473.20 | −0.059218 | −0.013329 | 0.0008 | 0.0002 | |
| Oleic acid | 313.15 | 0.110902 | 0.132527 | 0.0039 | 0.0031 |
| 333.15 | 0.116604 | 0.054485 | 0.0039 | 0.0035 | |
| 353.15 | 0.117892 | 0.049413 | 0.0049 | 0.0046 |
| CO2+ | T (K) | AADx | AADy | ||
|---|---|---|---|---|---|
| Triolein | 313.15 (a) | 0.071209 | 0.099779 | 0.0094 | 0.0027 |
| 333.15 (a) | 0.077653 | 0.096221 | 0.0126 | 0.0030 | |
| 333.15 (b) | 0.078059 | 0.083746 | 0.0088 | 0.0003 | |
| 353.15 (b) | 0.103763 | 0.132745 | 0.0050 | 0.0001 | |
| Squalene | 333.15 (c) | 0.054090 | −0.023325 | 0.0022 | 0.0025 |
| 363.15 (c) | 0.047825 | −0.032640 | 0.0031 | 0.0014 | |
| 313 (e) | 0.065395 | −0.030832 | 0.0151 | 0.0016 | |
| 333 (e) | 0.067249 | −0.032589 | 0.0128 | 0.0013 | |
| Oleic acid | 313.15 (a) | 0.115801 | 0.130956 | 0.0199 | 0.0031 |
| 333.15 (a) | 0.116604 | 0.054485 | 0.0084 | 0.0035 | |
| 353.15 (a) | 0.117892 | 0.049413 | 0.0062 | 0.0046 | |
| 313.15 (d) | 0.070093 | −0.006360 | 0.0094 | 0.0051 | |
| 333.15 (d) | 0.089088 | 0.041100 | 0.0002 | 0.0067 |
| 1–2 | 1–3 | 1–4 | 2–3 | 2–4 | 3–4 | RMSDx | RMSDy | |
|---|---|---|---|---|---|---|---|---|
| FFA in feed = 2.9 [wt.%], T[K] = 313 | ||||||||
| −1.44168 | 1.00000 | −1.56772 | −0.47399 | 0.08331 | −0.54788 | 0.0014 | 2.0 × 10⁻⁶ | |
| 0.94017 | −0.12023 | −2.27950 | 1.00000 | 0.26809 | −0.52108 | |||
| FFA in feed = 2.9 [wt.%], T[K] = 323 | ||||||||
| −1.78375 | 1.00000 | −2.19466 | −1.26916 | 0.06593 | −0.90195 | 0.0017 | 2.8 × 10⁻⁵ | |
| 1.97388 | 0.32731 | −3.32627 | −0.36925 | 0.31781 | −0.87789 | |||
| FFA in feed = 5.2 [wt.%], T[K] = 338 | ||||||||
| 2.44416 | −0.68874 | 2.65877 | −0.07842 | 0.00445 | 0.40698 | 3.0E-07 | 2.0 × 10⁻⁸ | |
| 2.16063 | 0.99919 | 1.77156 | 0.08648 | 0.37099 | −1.22870 | |||
| FFA in feed = 5.2 [wt.%], T[K] = 353 | ||||||||
| 0.05504 | 0.13002 | 0.14571 | 0.16947 | 0.08930 | 0.43896 | 0.0058 | 7.4 × 10⁻⁷ | |
| 0.12297 | −0.66975 | 0.00107 | −0.91096 | 0.18358 | 0.66131 | |||
| FFA in feed = 7.6 [wt.%], T[K] = 313 | ||||||||
| −0.39597 | 0.95245 | −0.41348 | −0.40686 | 0.06993 | −0.16959 | 0.0010 | 0.0002 | |
| 0.74176 | −4.75749 | −0.76430 | 0.70767 | 0.27402 | 0.22365 | |||
| FFA in feed = 15.3[wt.%], T[K] = 338 | ||||||||
| 1.89568 | 0.99648 | 2.17462 | 0.31810 | 0.06235 | −0.22787 | 0.0007 | 6.9 × 10⁻⁵ | |
| 0.75657 | 0.51874 | 2.50669 | 0.92458 | 0.20835 | 0.54779 | |||
| FFA [wt.%] | T [K] | P [bar] | N | Reference |
|---|---|---|---|---|
| 2.9 | 313 | 138–275 | 4 | Simões and Brunner (1996) |
| 323 | 182–257 | 3 | ||
| 5.2 | 338 | 190–280 | 2 | |
| 353 | 210–298 | 3 | ||
| 7.6 | 313 | 180–281 | 3 | |
| 323 | 179–212 | 2 | ||
| 15.3 | 313 | 180–302 | 3 | |
| 338 | 21–259 | 2 | ||
| 353 | 212–303 | 3 |
| AAD | |||||||||
|---|---|---|---|---|---|---|---|---|---|
| FFA in Feed [wt.%] | T [K] | x1 | x2 | x3 | x4 | y1 | y2 | y3 | y4 |
| 2.9 | 313 | 0.0062 | 0.1906 | 0.0017 | 0.1828 | 0.0000 | 0.0002 | 0.0000 | 0.0003 |
| 2.9 | 323 | 0.0164 | 0.2310 | 0.0028 | 0.2118 | 0.0020 | 0.0027 | 0.0006 | 0.0027 |
| 5.2 | 338 | 0.0000 | 0.0000 | 0.0000 | 0.0000 | 0.0000 | 0.0000 | 0.0000 | 0.0000 |
| 5.2 | 353 | 0.0215 | 0.7240 | 0.0033 | 0.7082 | 0.0001 | 0.0001 | 0.0000 | 0.0001 |
| 7.6 | 313 | 0.0164 | 0.1274 | 0.0014 | 0.1097 | 0.0093 | 0.0225 | 0.0009 | 0.0324 |
| 15.3 | 338 | 0.0090 | 0.0908 | 0.0003 | 0.0816 | 0.0053 | 0.0059 | 0.0000 | 0.0112 |
| 1–2 | 1–3 | 1–4 | 2–3 | 2–4 | 3–4 | RMSDx | RMSDy | |
|---|---|---|---|---|---|---|---|---|
| FFA in feed = 2.9 and 7.6 [wt.%], T [K] = 313 | ||||||||
| −0.150477 | −0.297646 | −0.111520 | −0.602362 | 0.074580 | −0.802333 | 0.0138 | 0.0009 | |
| 0.286959 | −0.614753 | −0.372917 | 0.992085 | 0.127803 | −0.803741 | |||
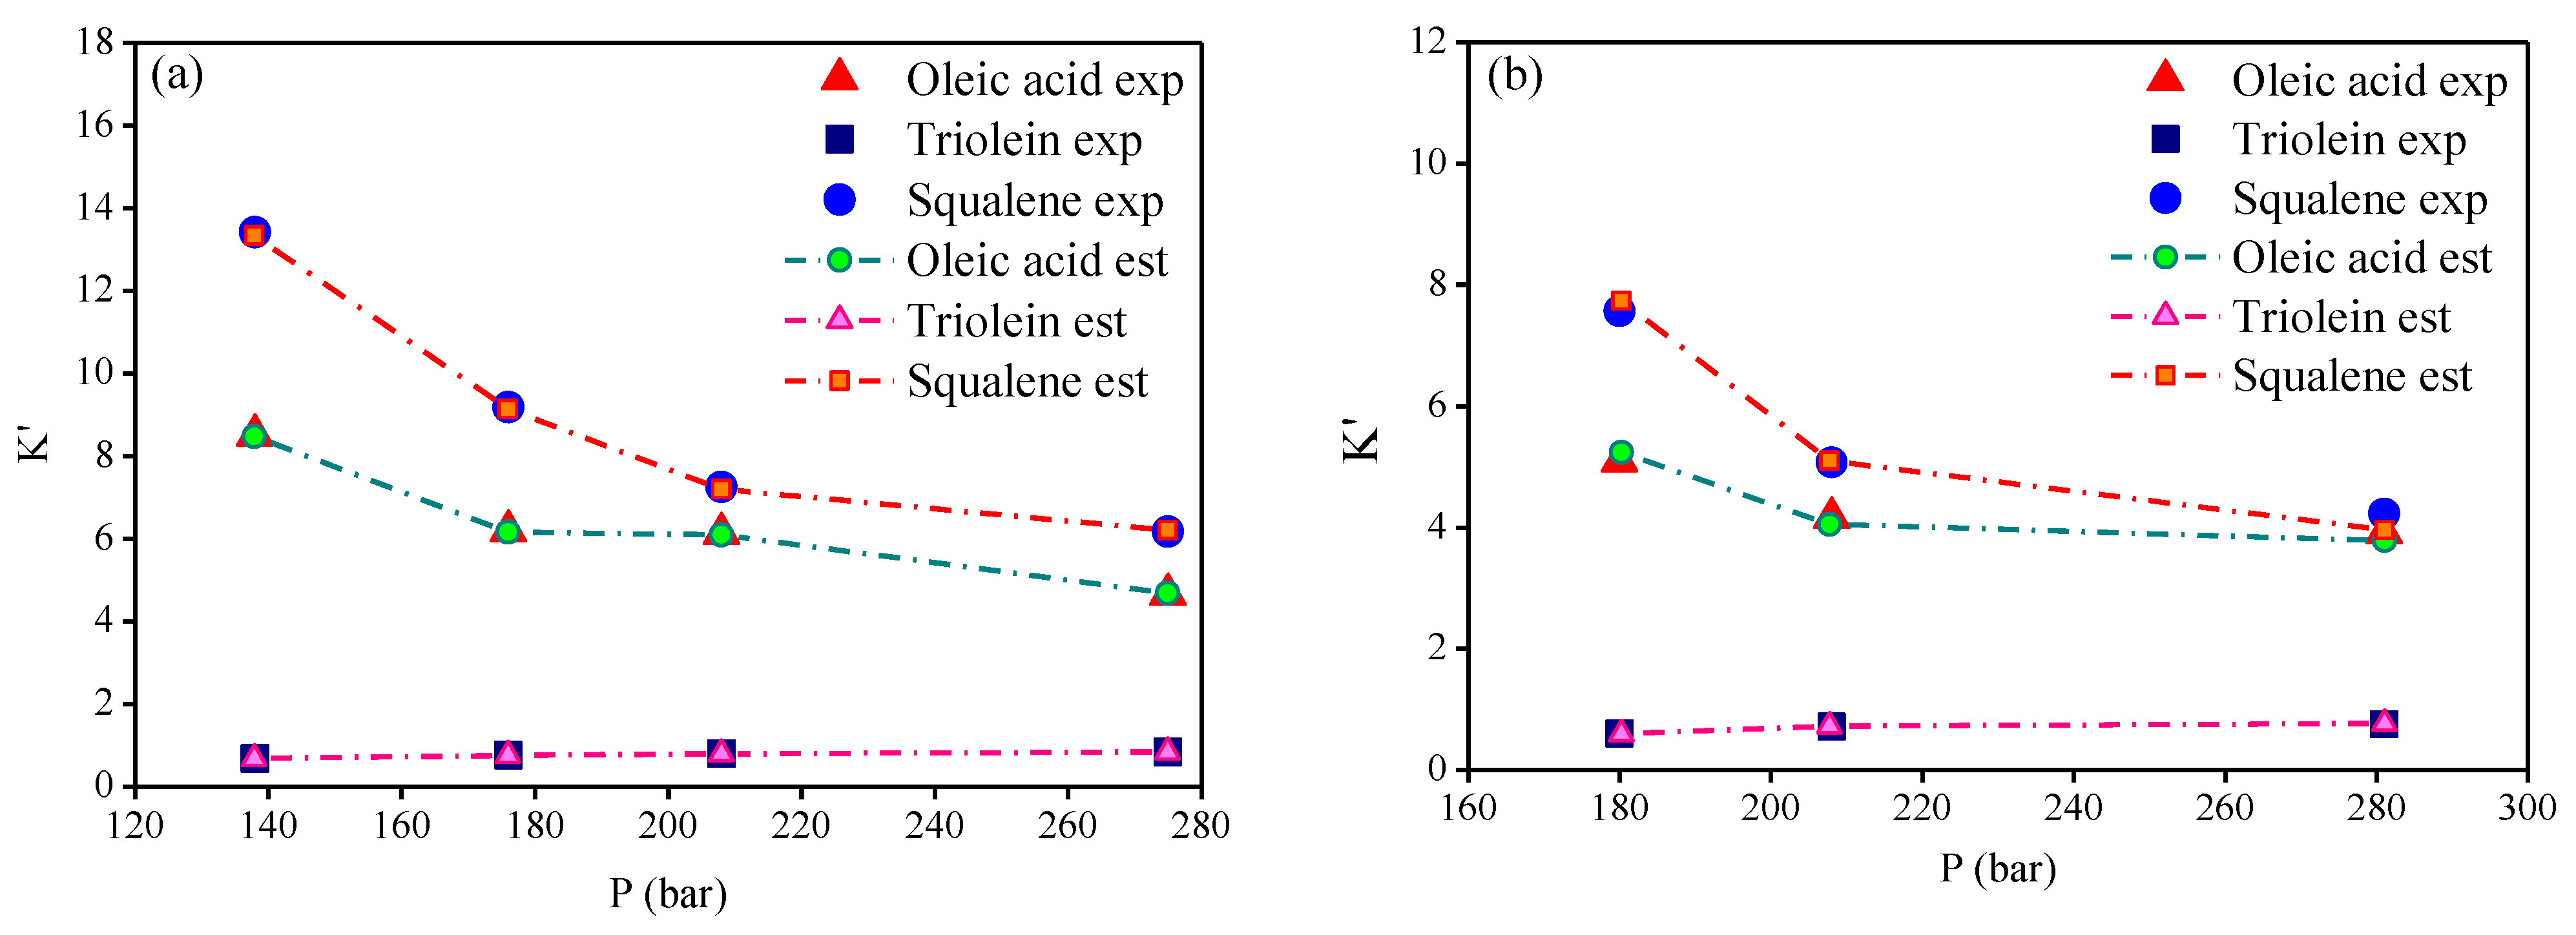
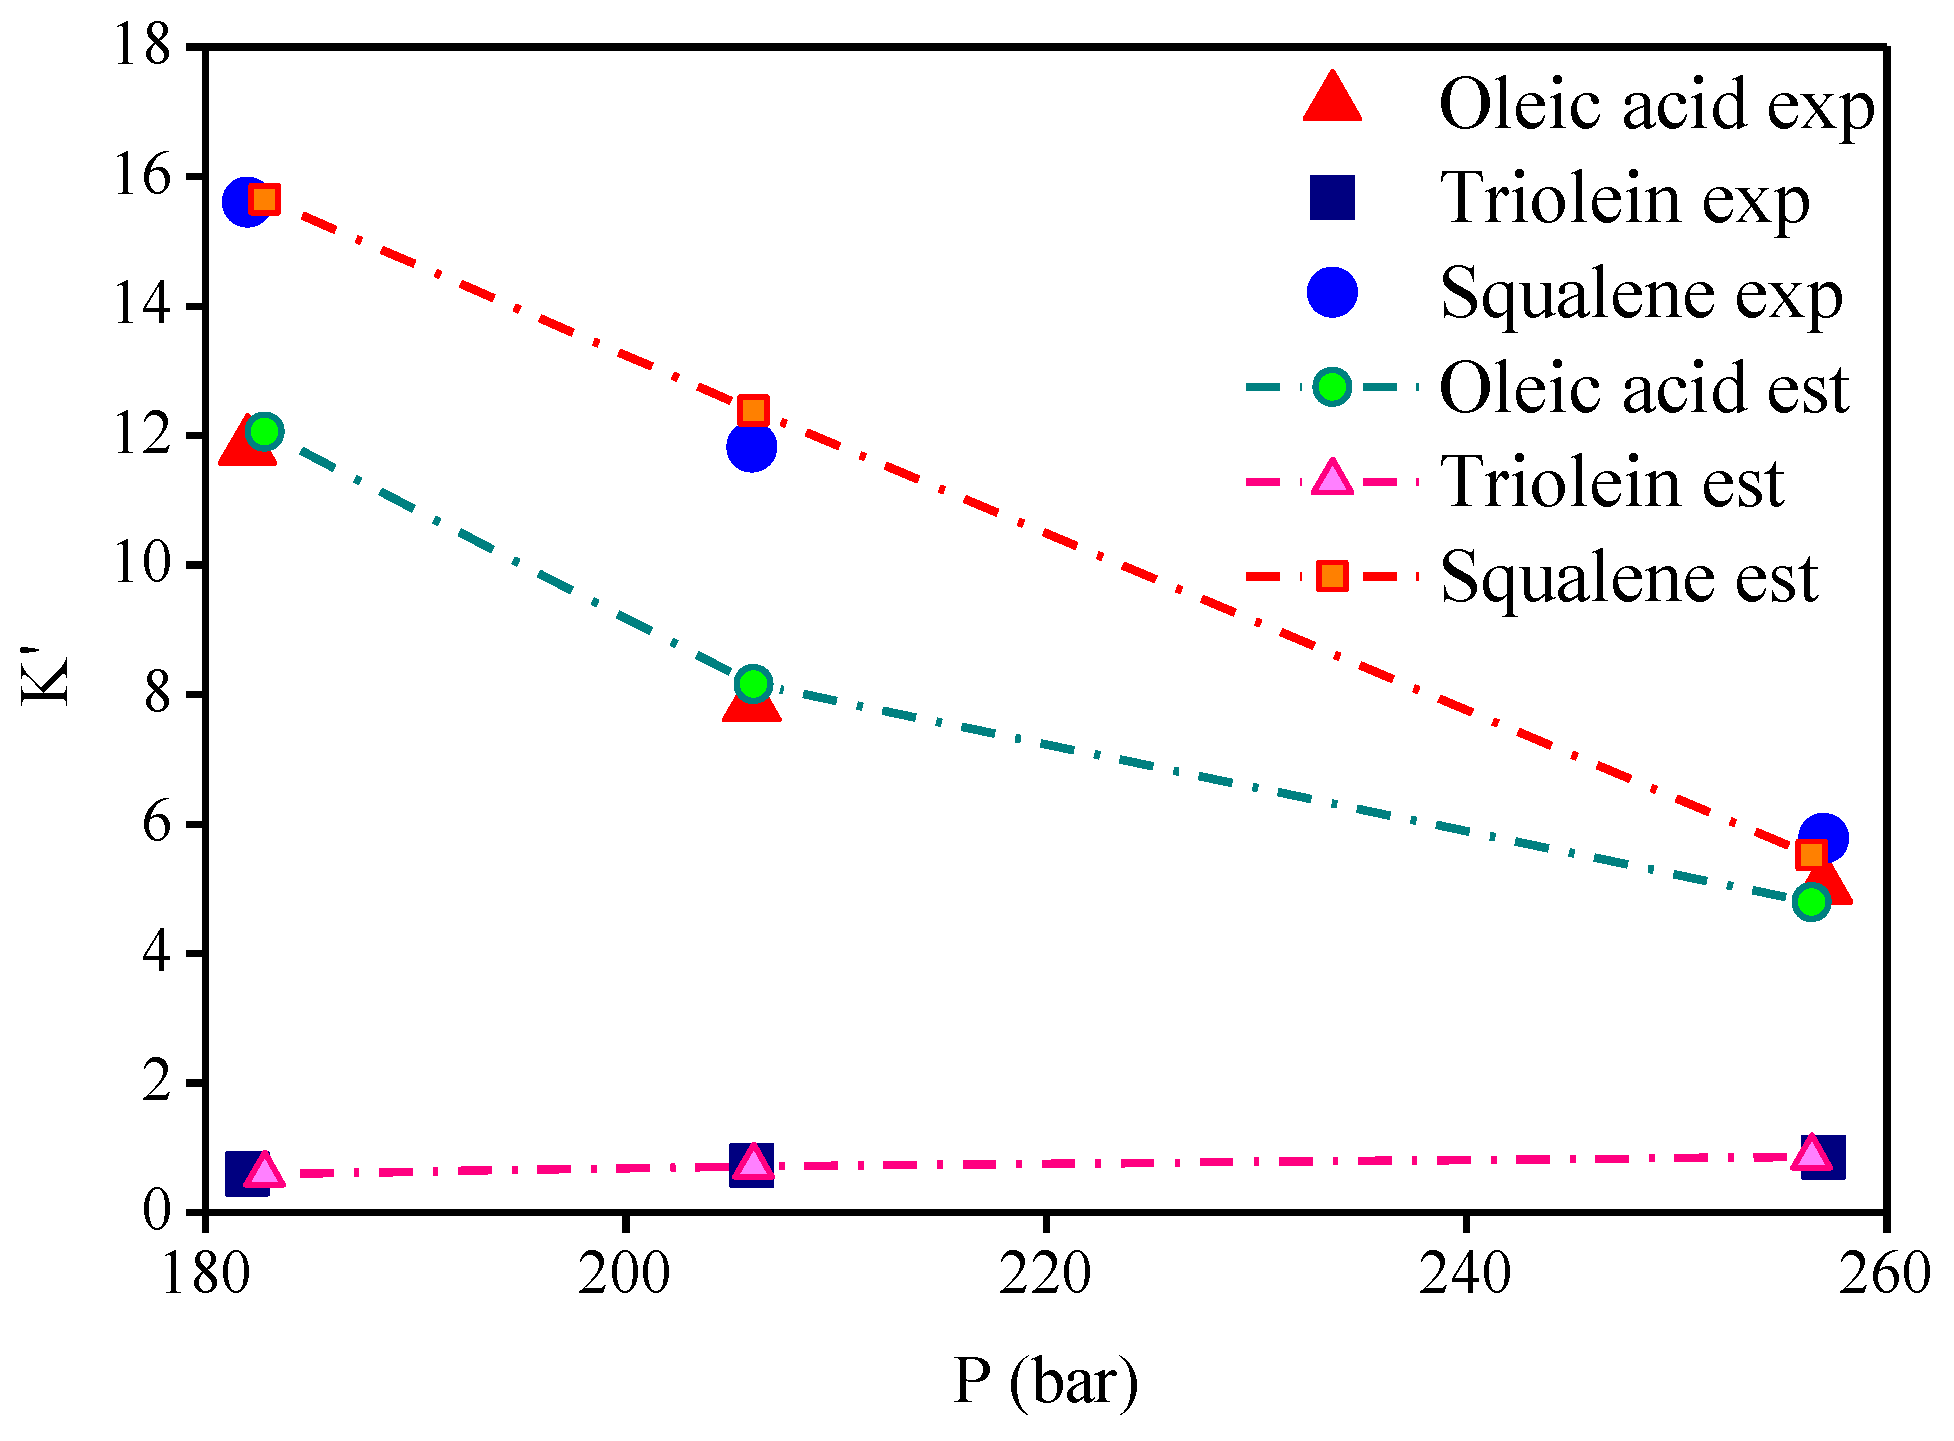
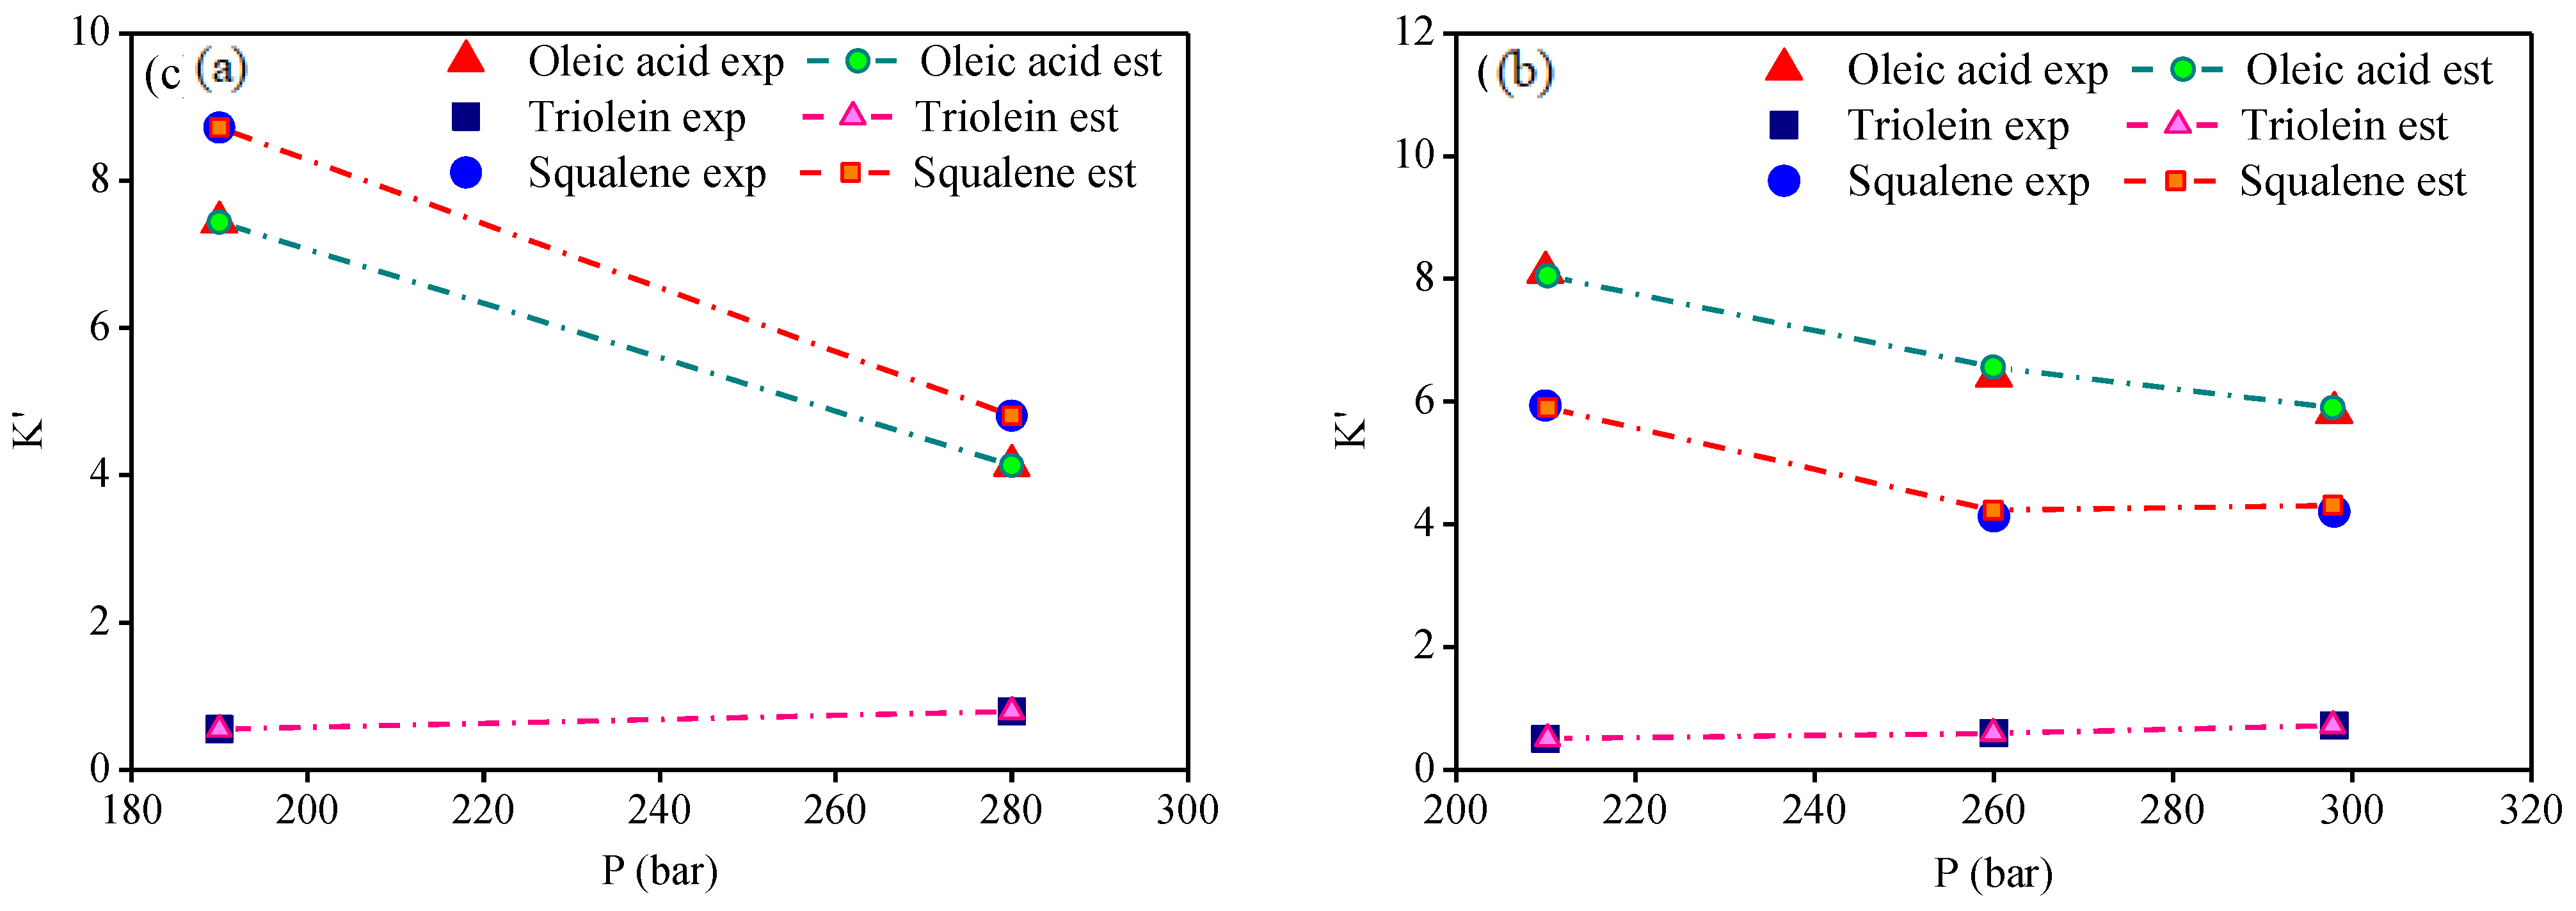
| FFA in Feed [wt.%]/T [K] | P [bar] | K1 × 102 | K2 × 102 | K3 × 102 | |||
|---|---|---|---|---|---|---|---|
| Exp | Est | Exp | Est | Exp | Est | ||
| 2.9/313 | 138 | 1.09 | 1.08 | 0.09 | 0.09 | 1.71 | 1.71 |
| 176 | 2.88 | 2.87 | 0.36 | 0.36 | 4.27 | 4.26 | |
| 208 | 4.01 | 4.01 | 0.52 | 0.52 | 4.75 | 4.73 | |
| 275 | 4.50 | 4.51 | 0.81 | 0.81 | 5.95 | 5.98 | |
| 2.9/323 | 182 | 1.93 | 1.97 | 0.10 | 0.10 | 2.54 | 2.55 |
| 206 | 2.68 | 2.83 | 0.25 | 0.25 | 4.03 | 4.30 | |
| 257 | 4.17 | 3.99 | 0.70 | 0.71 | 4.77 | 4.59 | |
| 5.2/338 | 190 | 1.08 | 1.08 | 0.08 | 0.08 | 1.26 | 1.26 |
| 280 | 4.59 | 4.59 | 0.88 | 0.88 | 5.34 | 5.34 | |
| 5.2/353 | 210 | 2.89 | 2.87 | 0.18 | 0.18 | 2.11 | 2.11 |
| 260 | 4.76 | 4.80 | 0.44 | 0.44 | 3.07 | 3.10 | |
| 298 | 7.11 | 7.08 | 0.88 | 0.86 | 5.13 | 5.17 | |
| 7.6/313 | 180 | 2.32 | 2.48 | 0.28 | 0.28 | 3.45 | 3.67 |
| 208 | 3.33 | 3.04 | 0.57 | 0.54 | 4.06 | 3.83 | |
| 281 | 4.64 | 4.73 | 0.90 | 0.96 | 5.02 | 4.95 | |
| 15.3/338 | 215 | 2.65 | 2.71 | 0.54 | 0.55 | 7.60 | 7.61 |
| 259 | 2.67 | 2.60 | 1.08 | 1.07 | 5.16 | 5.17 | |
Publisher’s Note: MDPI stays neutral with regard to jurisdictional claims in published maps and institutional affiliations. |
© 2021 by the authors. Licensee MDPI, Basel, Switzerland. This article is an open access article distributed under the terms and conditions of the Creative Commons Attribution (CC BY) license (https://creativecommons.org/licenses/by/4.0/).
Share and Cite
Costa, E.C.; de Araújo Silva, W.; Menezes, E.G.O.; da Silva, M.P.; Cunha, V.M.B.; de Andrade Mâncio, A.; Santos, M.C.; da Mota, S.A.P.; Araújo, M.E.; Machado, N.T. Simulation of Organic Liquid Products Deoxygenation by Multistage Countercurrent Absorber/Stripping Using CO2 as Solvent with Aspen-HYSYS: Thermodynamic Data Basis and EOS Modeling. Molecules 2021, 26, 4382. https://0-doi-org.brum.beds.ac.uk/10.3390/molecules26144382
Costa EC, de Araújo Silva W, Menezes EGO, da Silva MP, Cunha VMB, de Andrade Mâncio A, Santos MC, da Mota SAP, Araújo ME, Machado NT. Simulation of Organic Liquid Products Deoxygenation by Multistage Countercurrent Absorber/Stripping Using CO2 as Solvent with Aspen-HYSYS: Thermodynamic Data Basis and EOS Modeling. Molecules. 2021; 26(14):4382. https://0-doi-org.brum.beds.ac.uk/10.3390/molecules26144382
Chicago/Turabian StyleCosta, Elinéia Castro, Welisson de Araújo Silva, Eduardo Gama Ortiz Menezes, Marcilene Paiva da Silva, Vânia Maria Borges Cunha, Andréia de Andrade Mâncio, Marcelo Costa Santos, Sílvio Alex Pereira da Mota, Marilena Emmi Araújo, and Nélio Teixeira Machado. 2021. "Simulation of Organic Liquid Products Deoxygenation by Multistage Countercurrent Absorber/Stripping Using CO2 as Solvent with Aspen-HYSYS: Thermodynamic Data Basis and EOS Modeling" Molecules 26, no. 14: 4382. https://0-doi-org.brum.beds.ac.uk/10.3390/molecules26144382