
Flaxseed Increases Animal Lifespan and Reduces Ovarian Cancer Severity by Toxically Augmenting One-Carbon Metabolism


Abstract
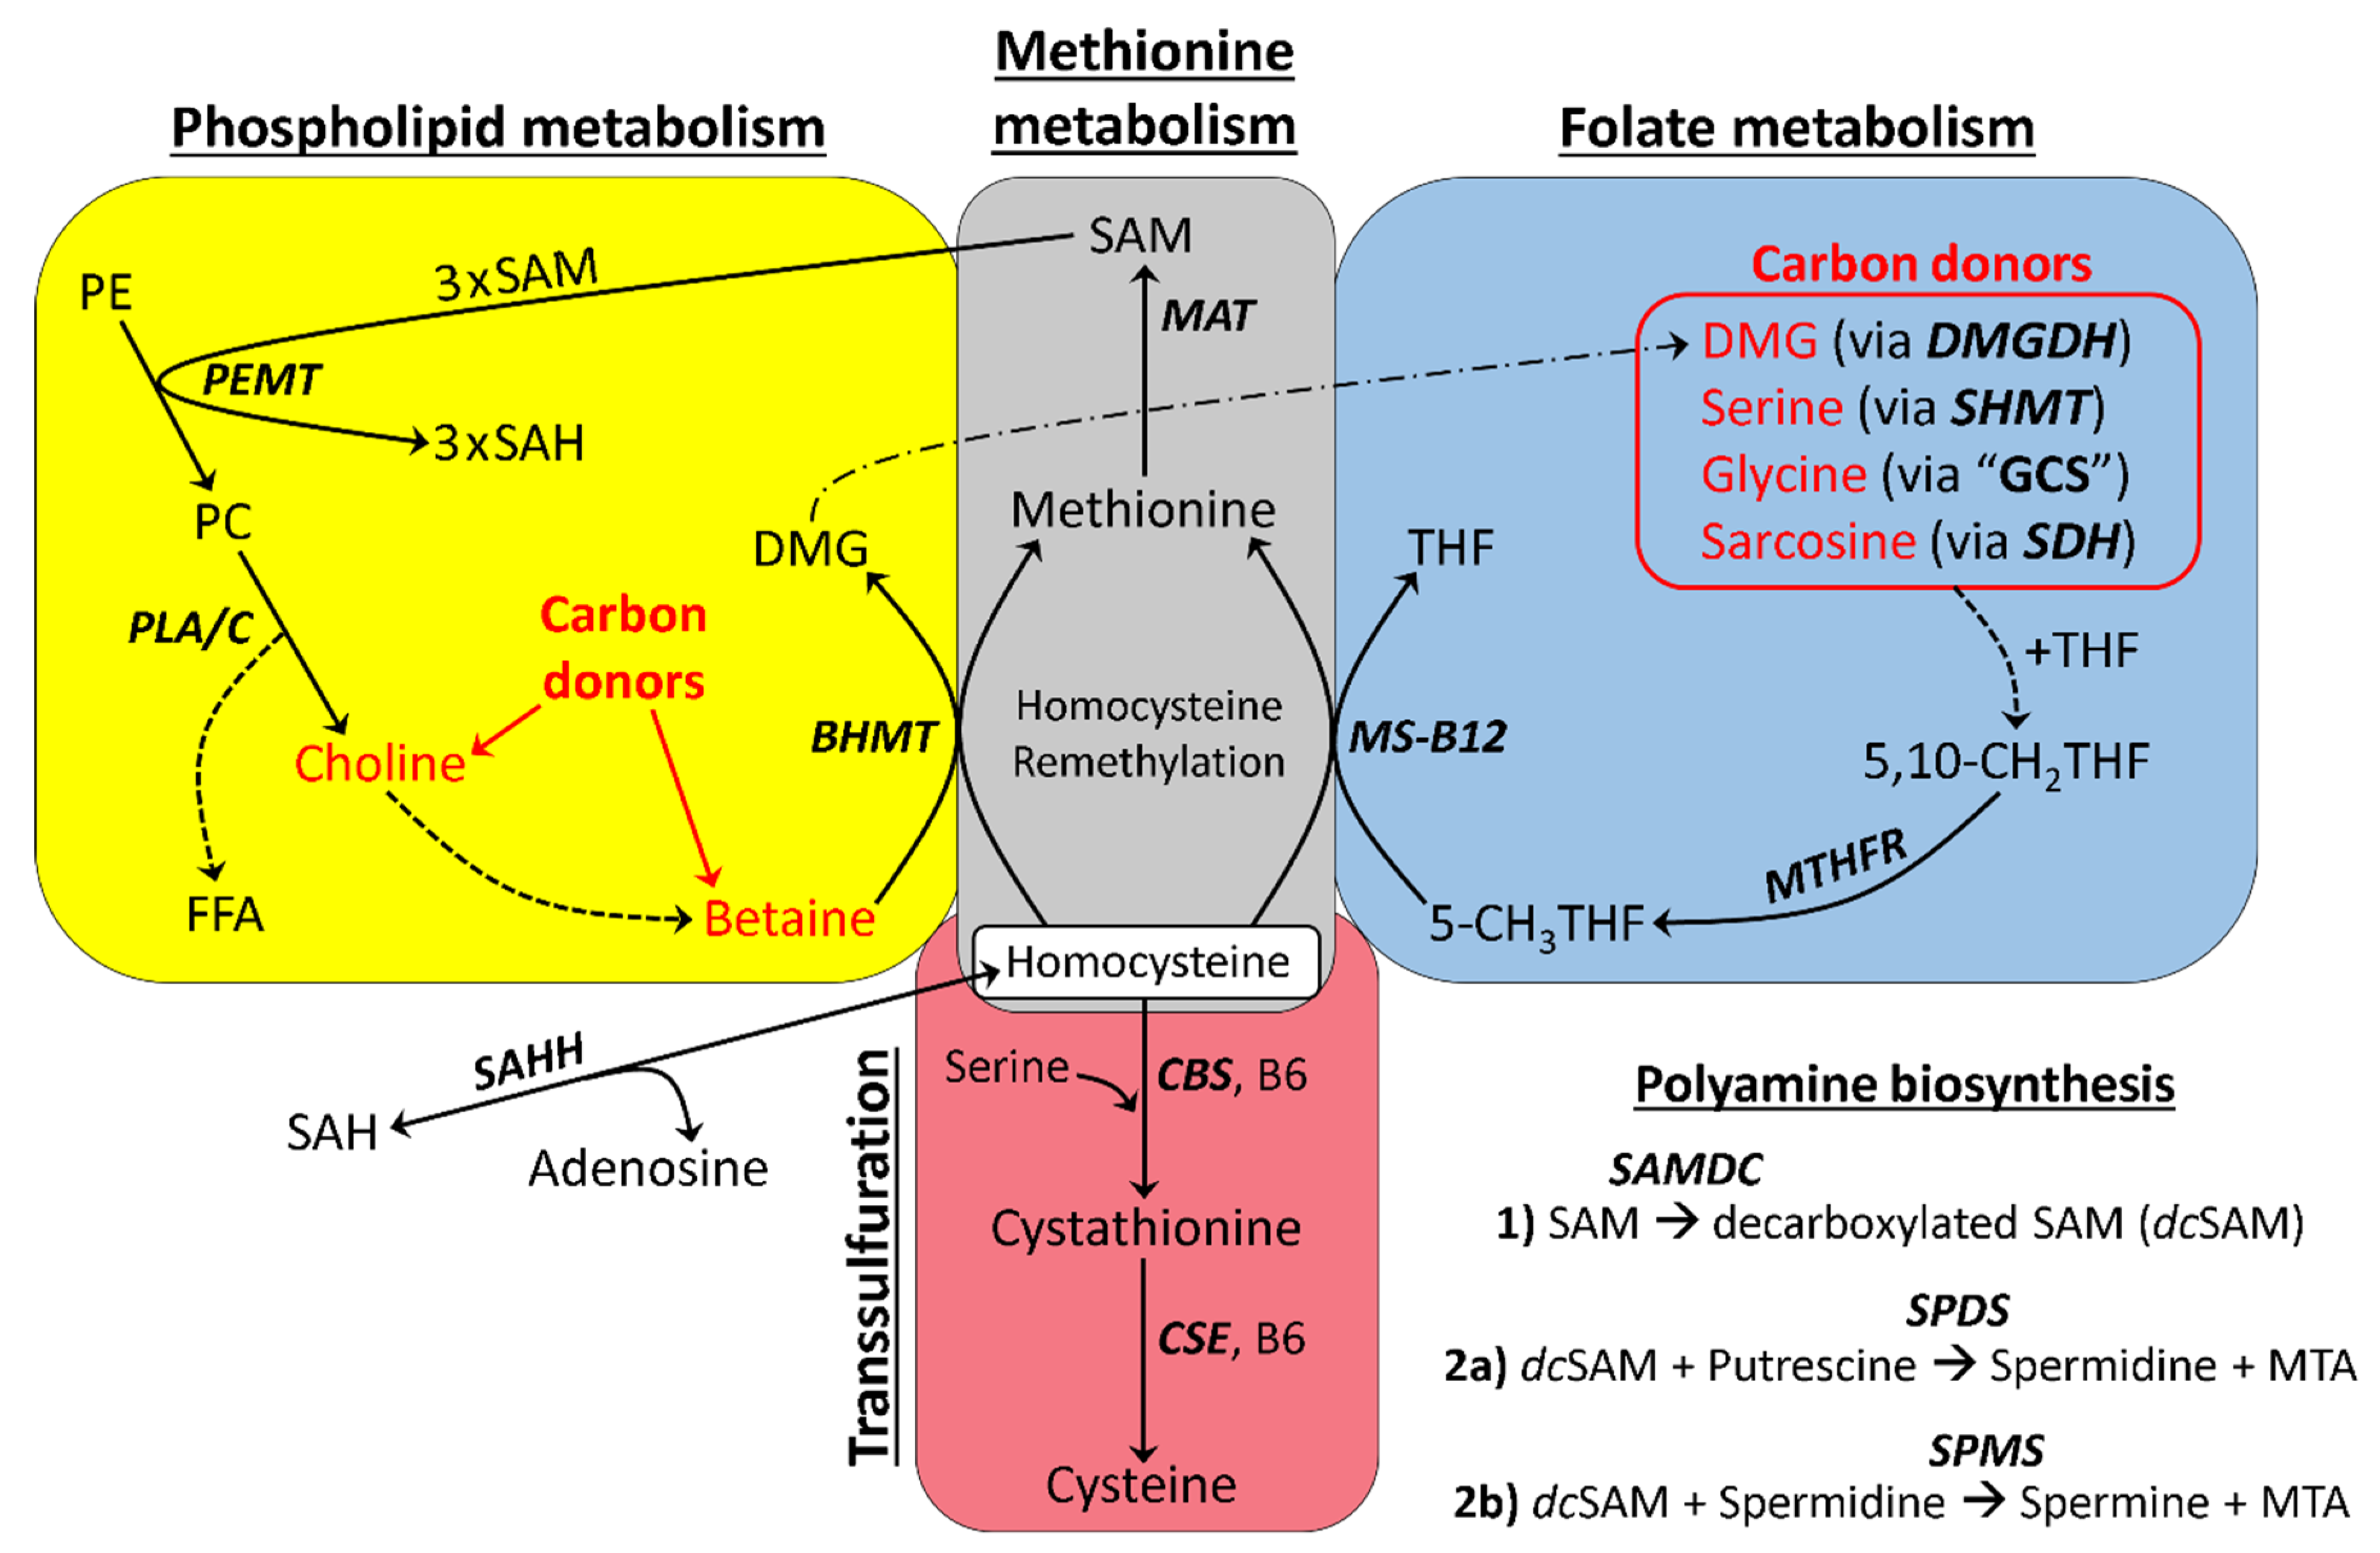
:1. Introduction
- (1)
- (2)
- Oxidation to cystathionine via cystathionine beta synthase (CBS) [18];
- (3)
- Adenosylation to S-adenosylhomocysteine (SAH) via the bidirectional enzyme S-adenosylhomocysteine hydrolase (SAHH) [19];
- (4)
- Accumulation (where Hcy is not remethylated, oxidized, or adenosylated), leading to a pathological condition known as hyperhomocysteinemia (HHcy) [20].
2. Results
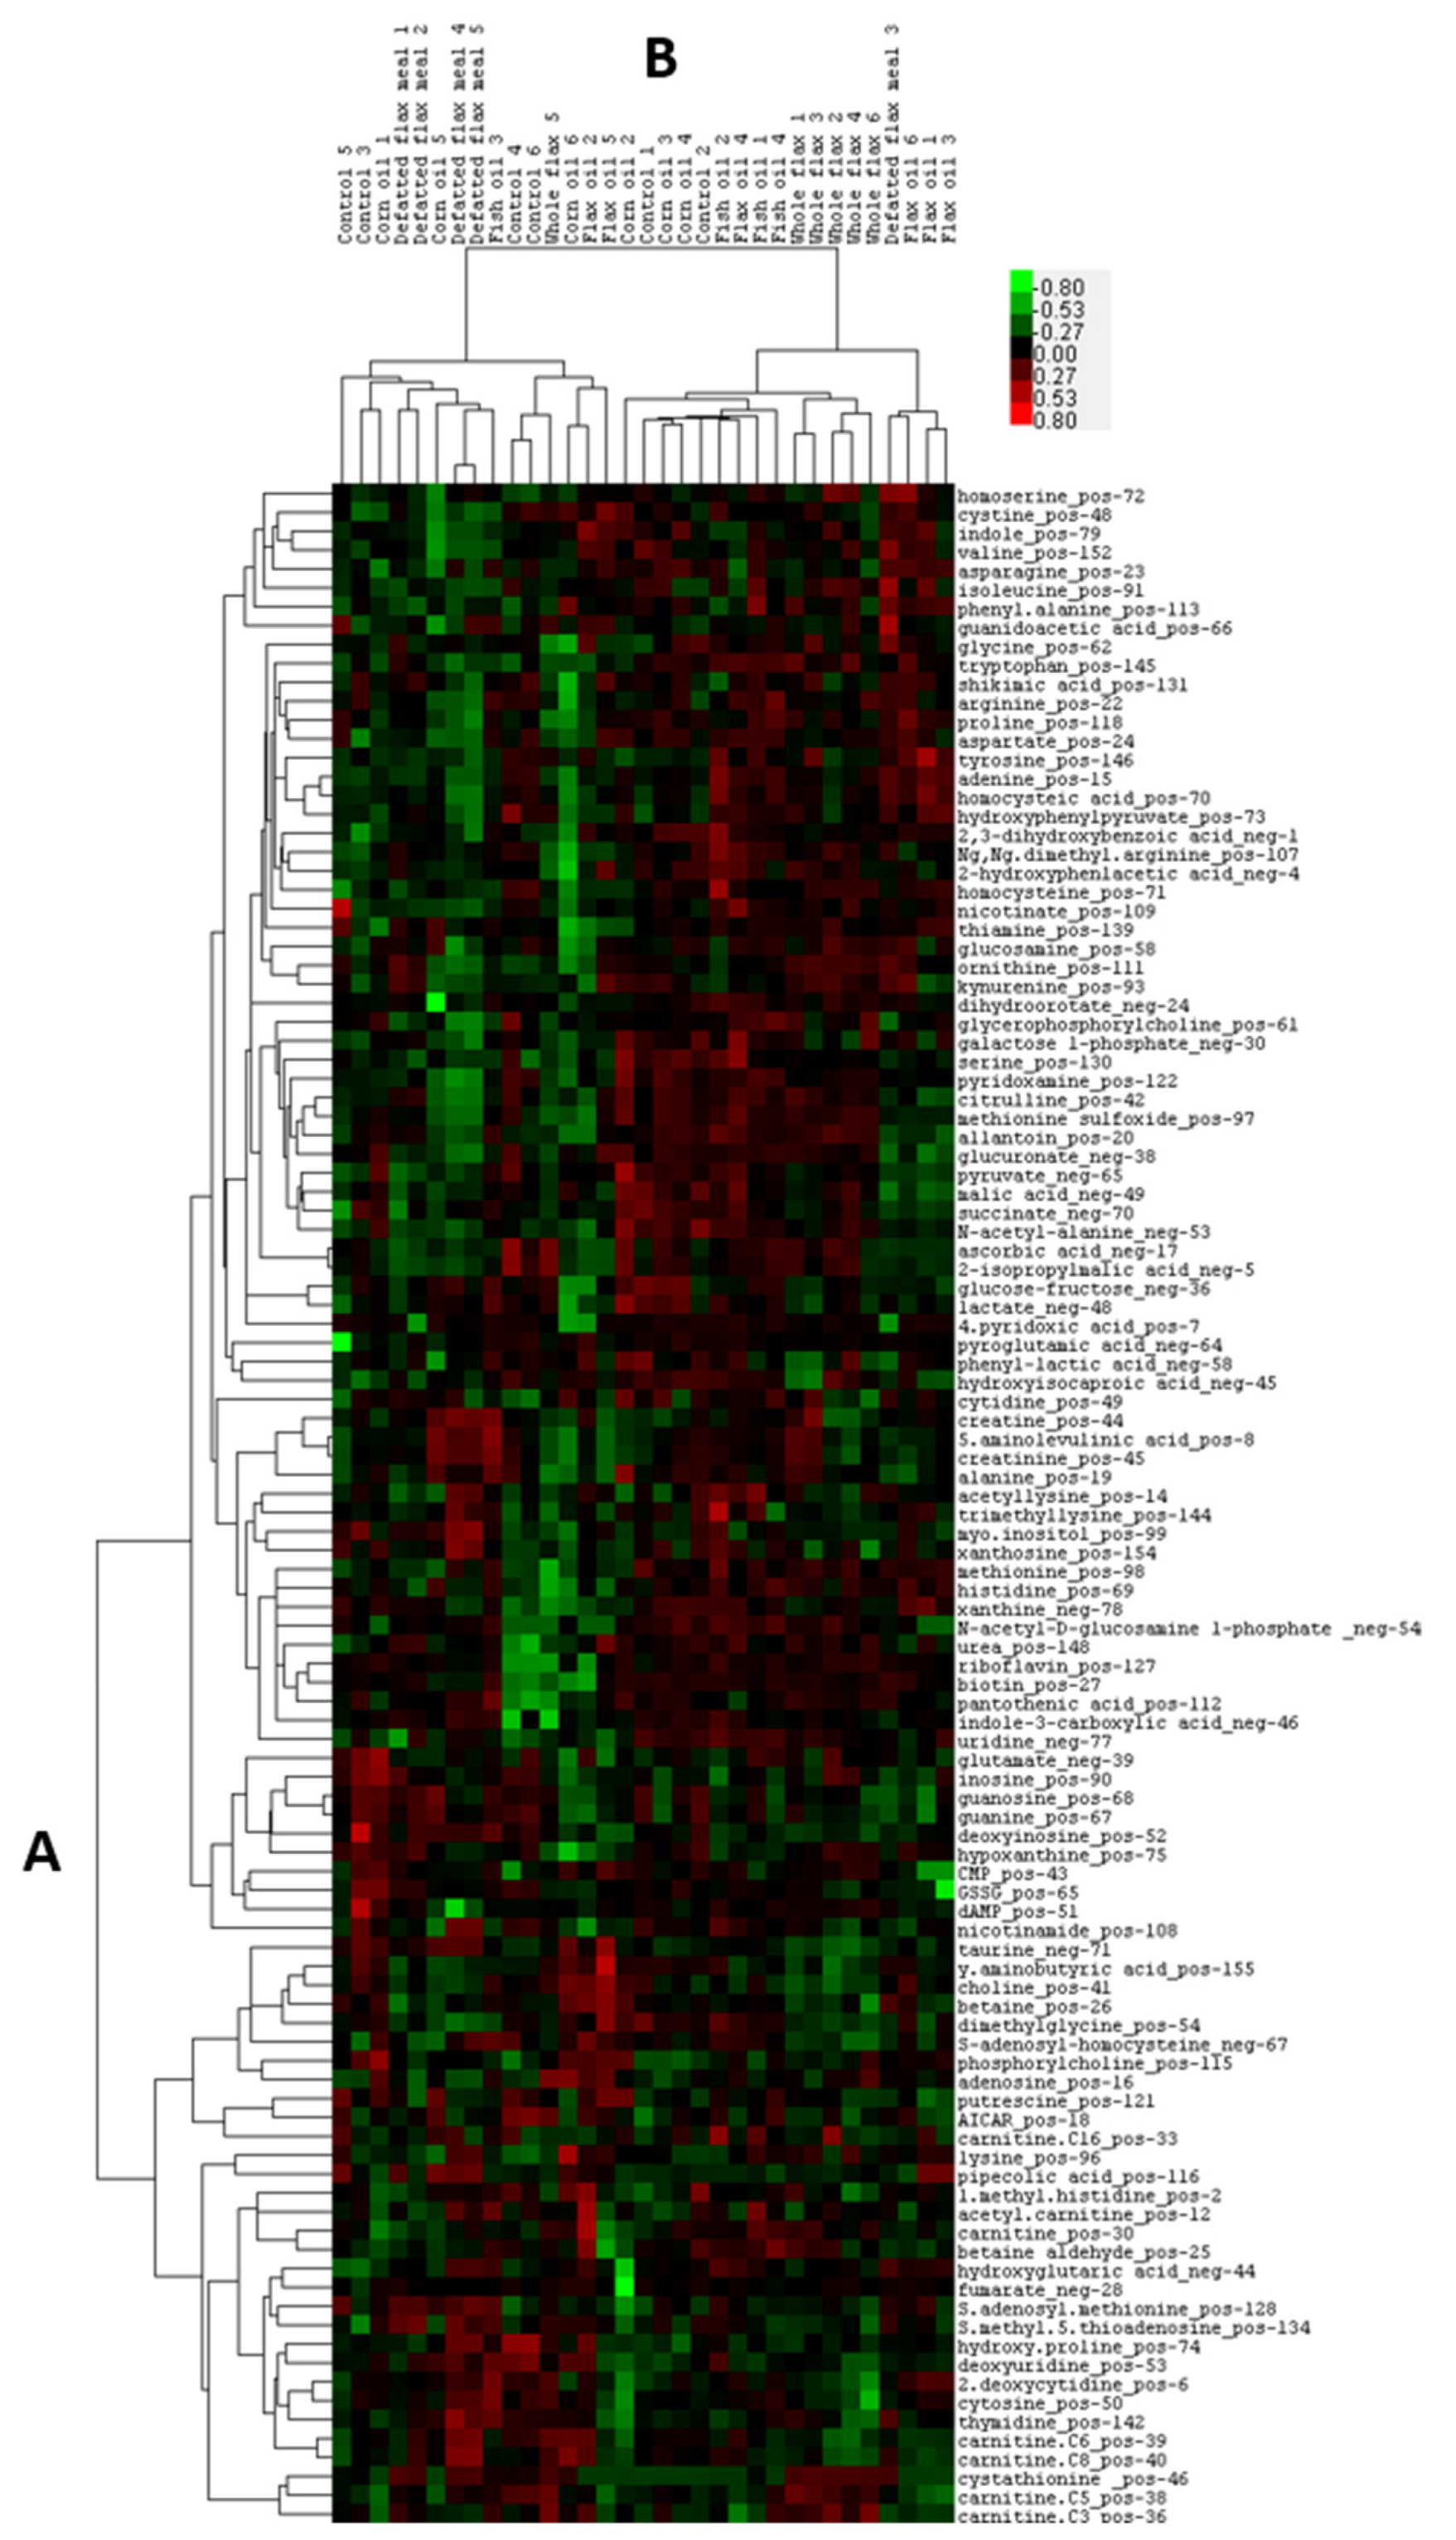
2.1. Heatmap and PLSDA Analysis of Plasma Metabolites
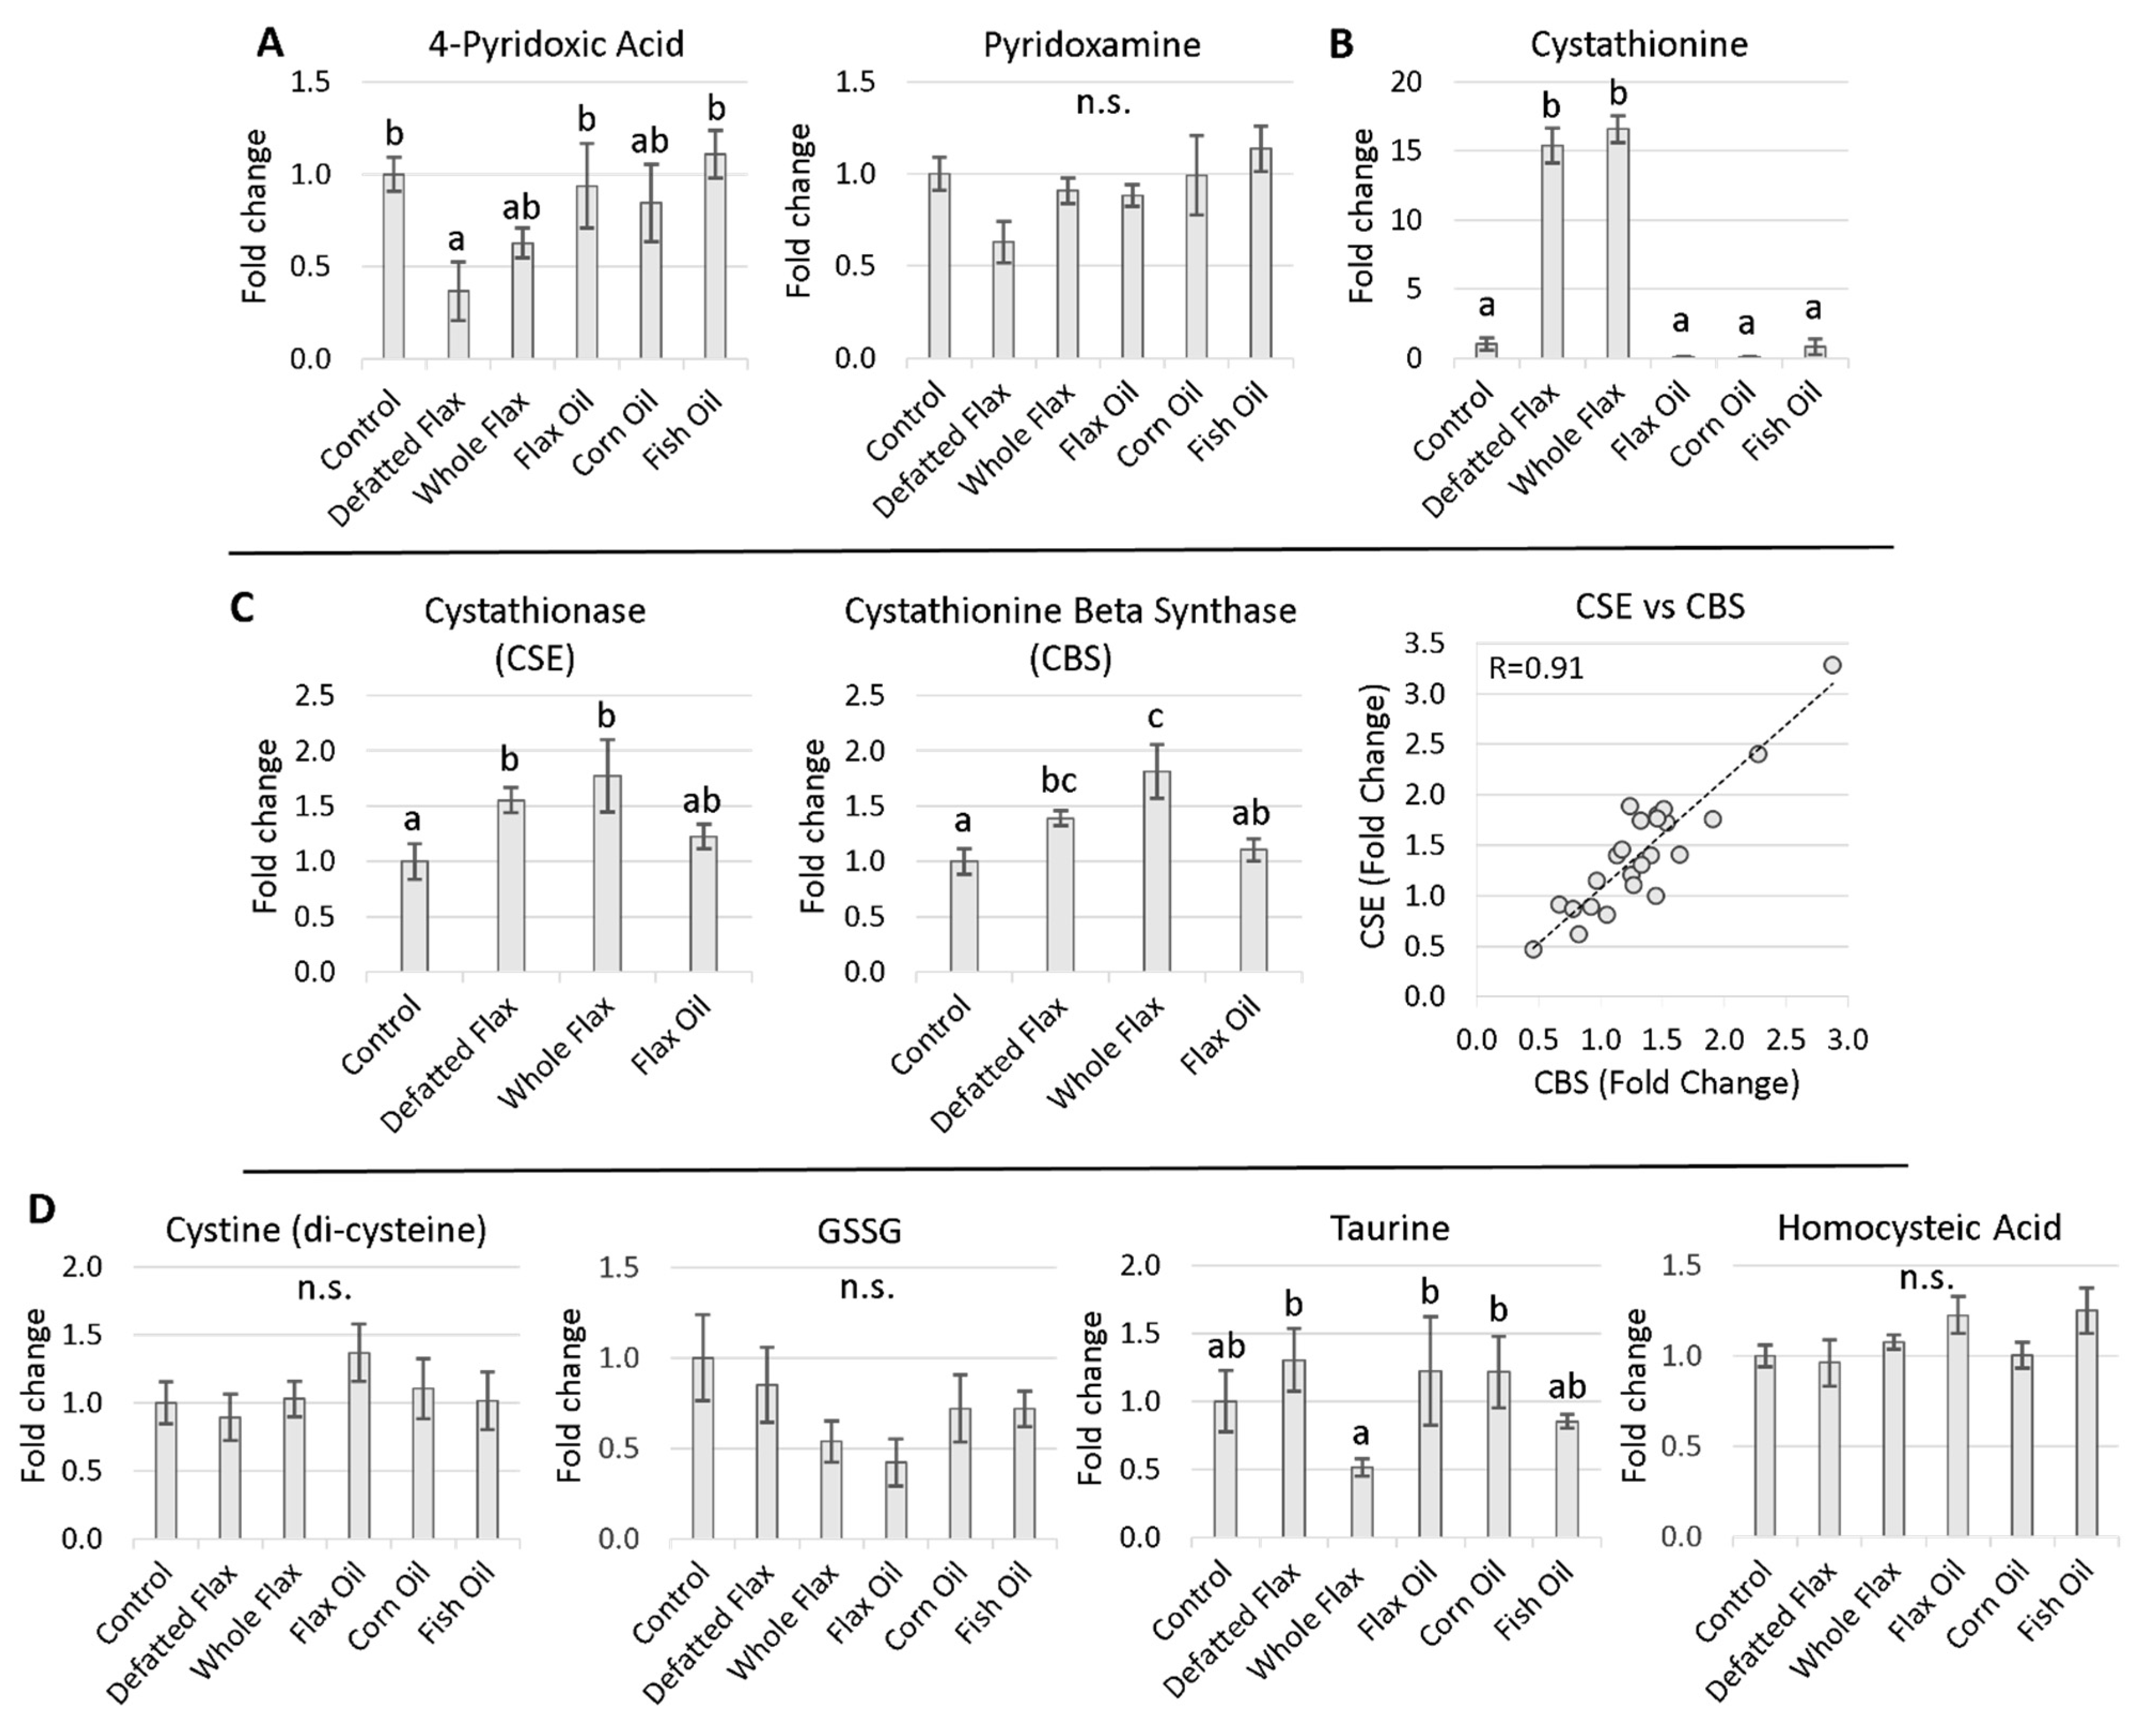
2.2. Perturbed B6 Levels Concomitant with Elevated Cystathionine
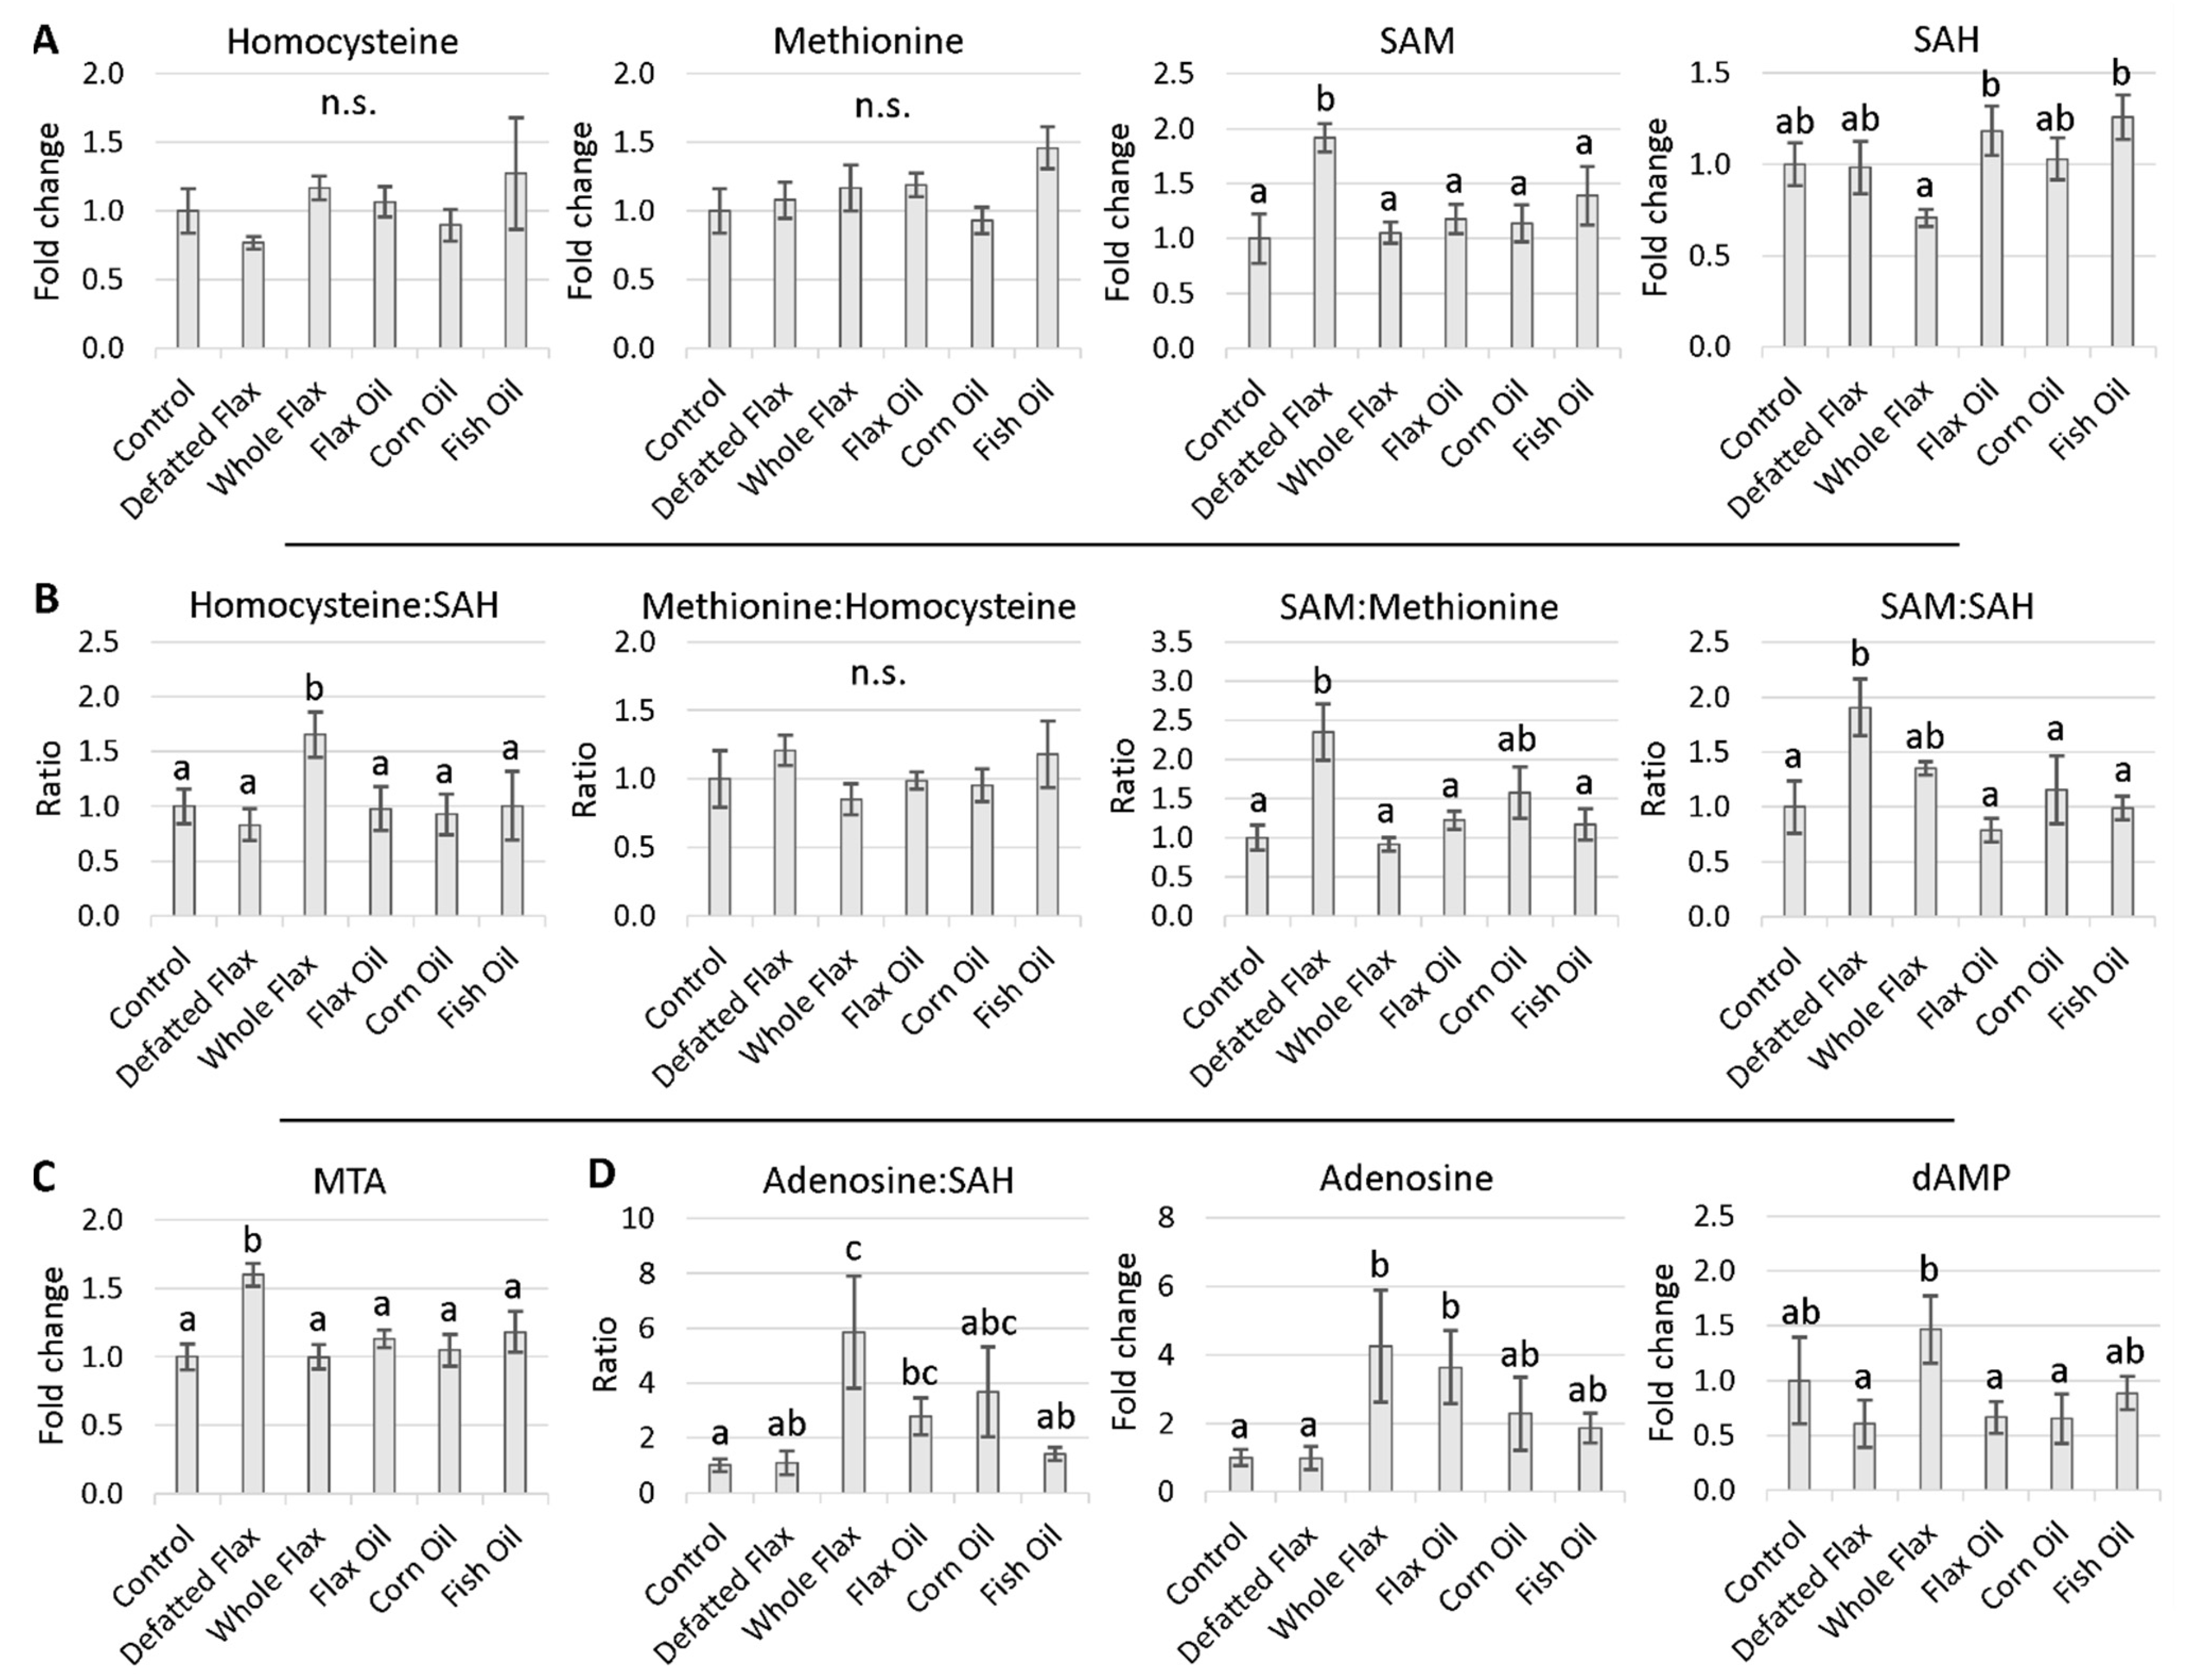
2.3. Methionine Cycle Metabolites
2.4. Evidence of Accelerated Hcy Remethylation
2.4.1. One-Carbon Donors That Fuel BHMT: Choline and Betaine
2.4.2. Hen Body Mass Was Reduced in Association with Choline Content
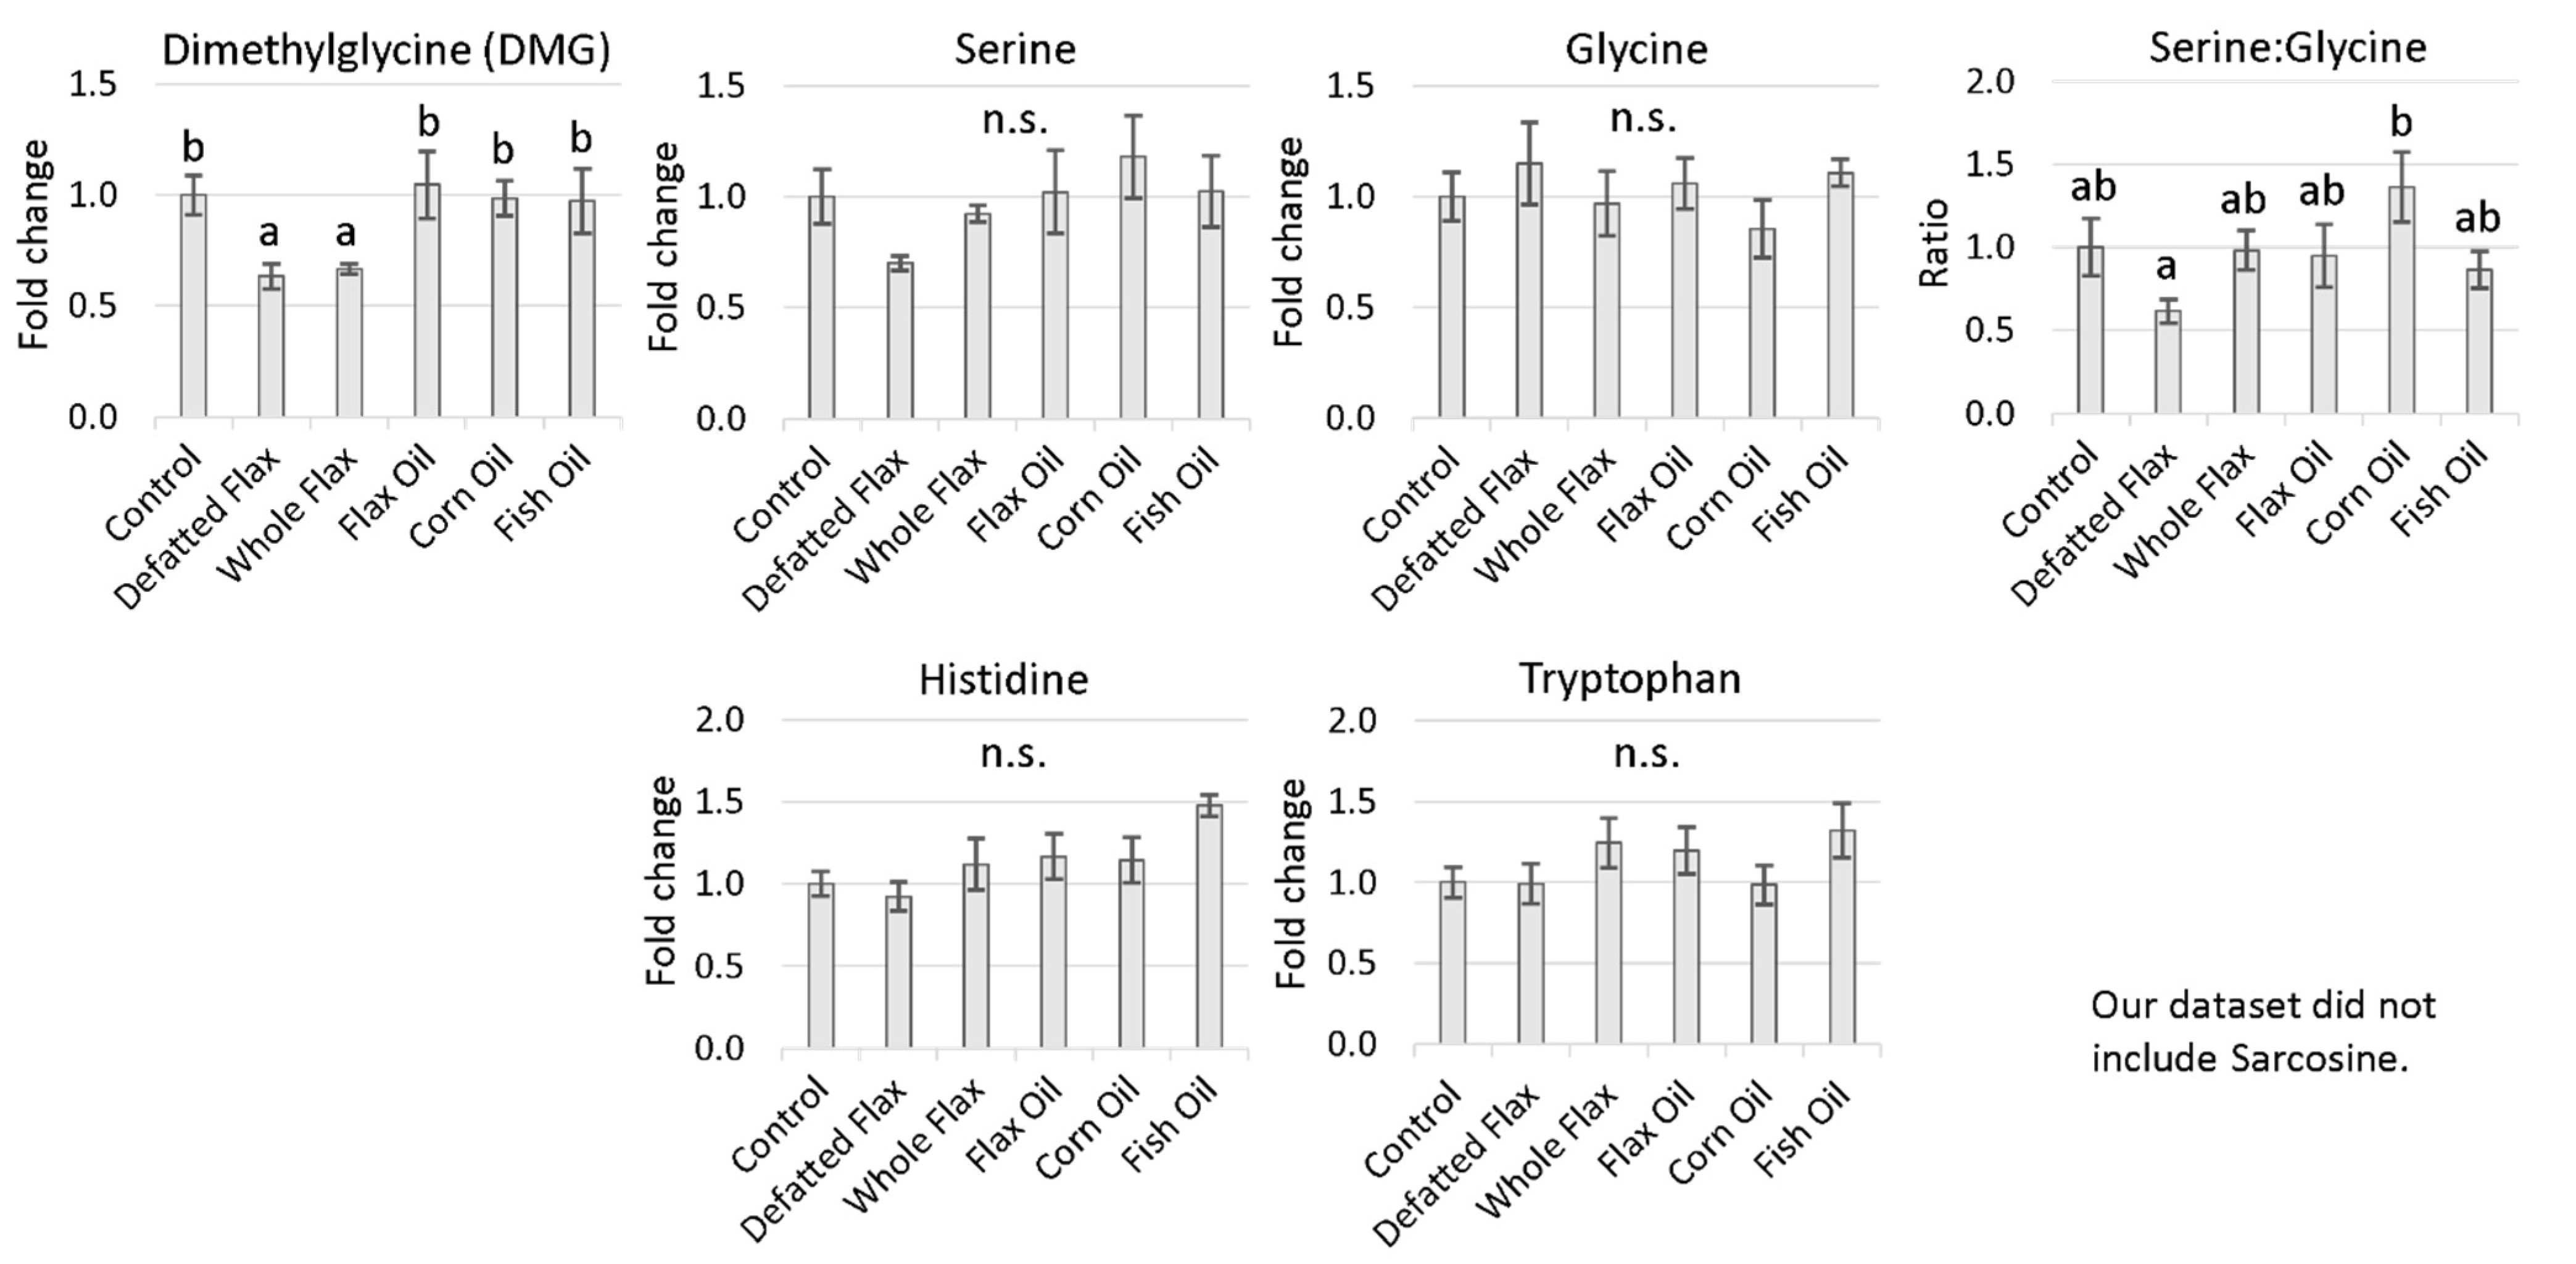
2.4.3. One-Carbon Donors That Fuel the Folate Cycle (i.e., Fuel 5,10-CH2THF Synthesis)
2.5. Survival and Physiological Aging of Hens
2.6. Flaxseed’s Effect on Microarray Feature Expression in the Hen Ovary
2.6.1. Flaxseed Downregulates Feature Expression in the Ovary
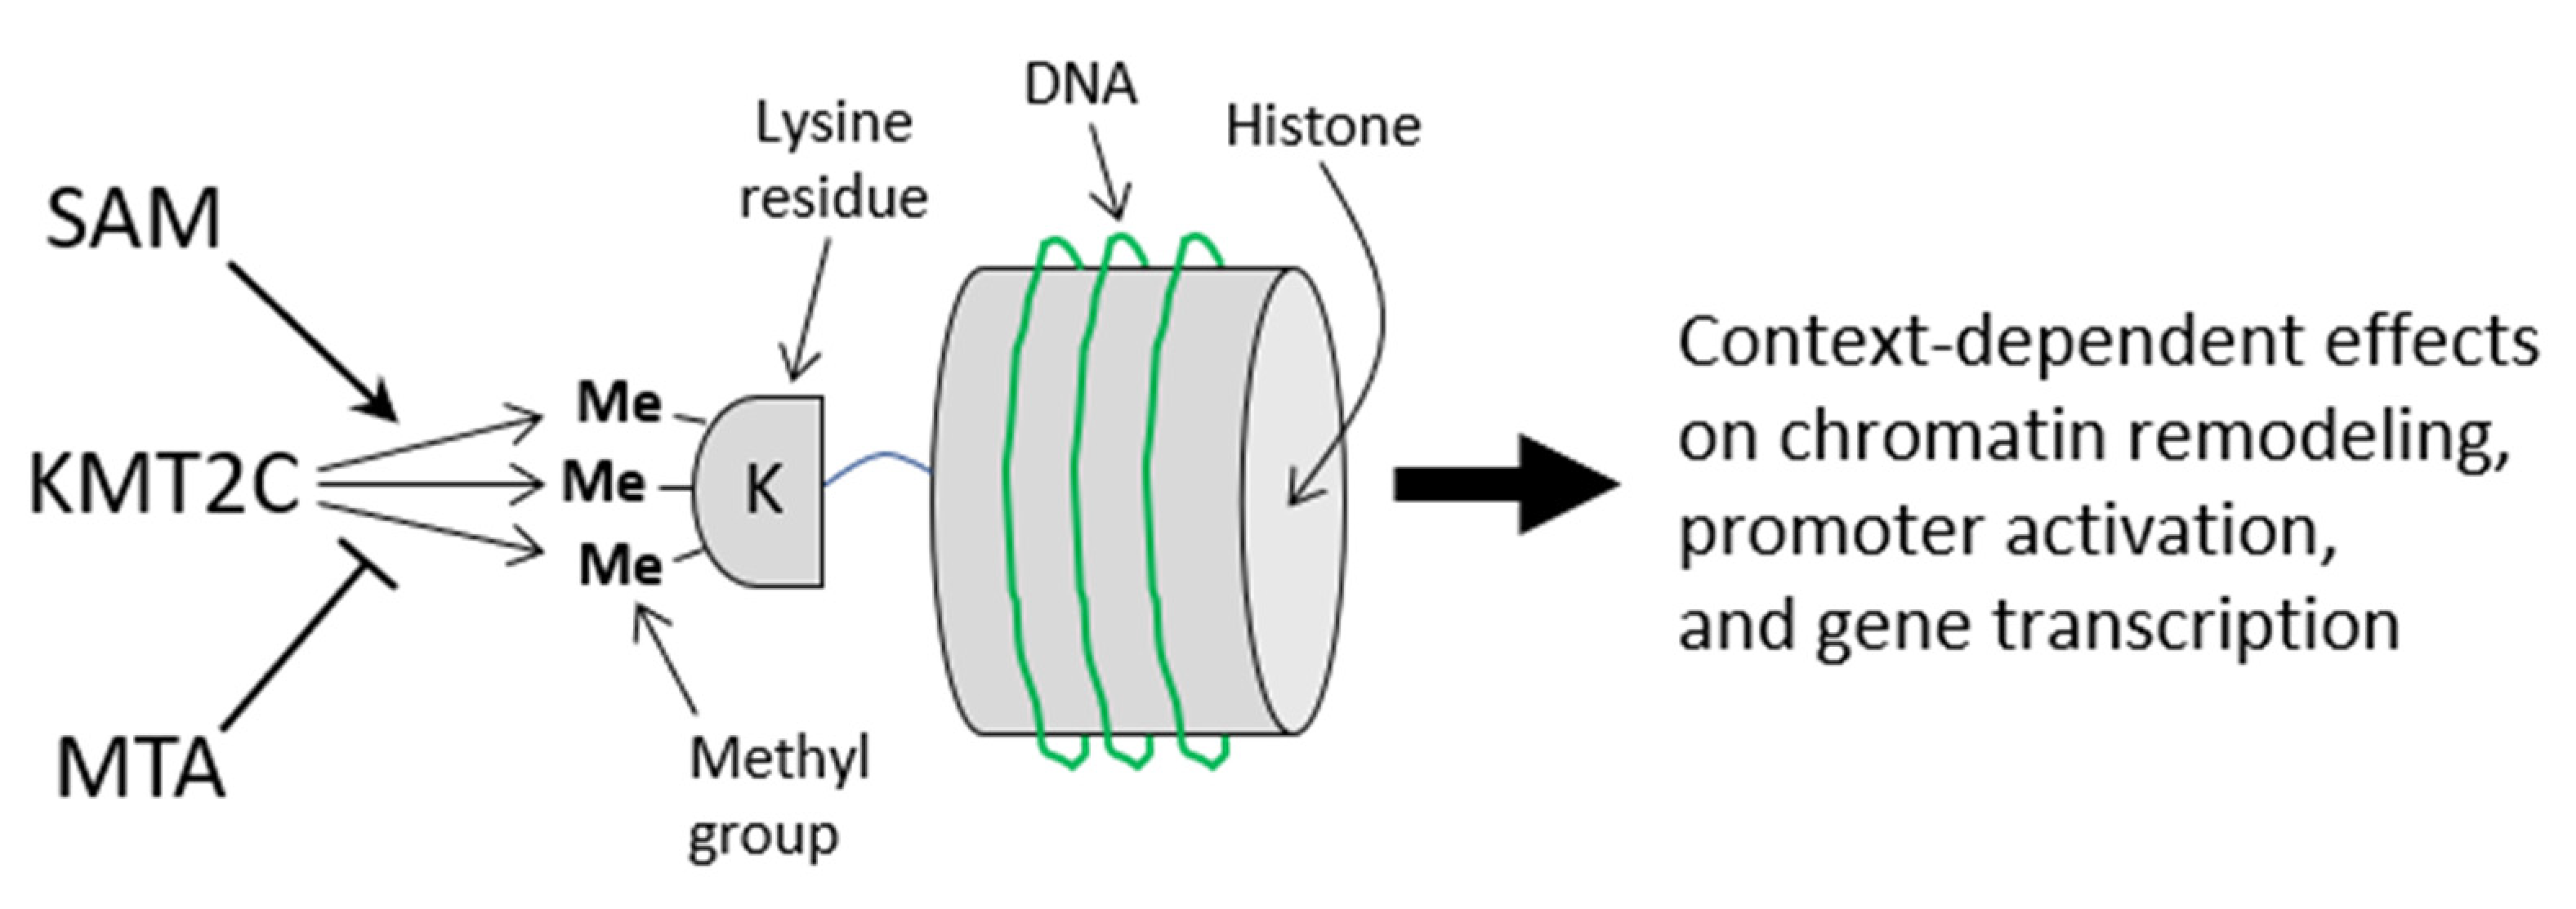
2.6.2. Flaxseed Downregulates Features for SAM-Dependent Methyltransferases
2.6.3. Flaxseed Increases SLC25A26 Expression and Might Reduce Ovarian Tumor Aging
3. Discussion
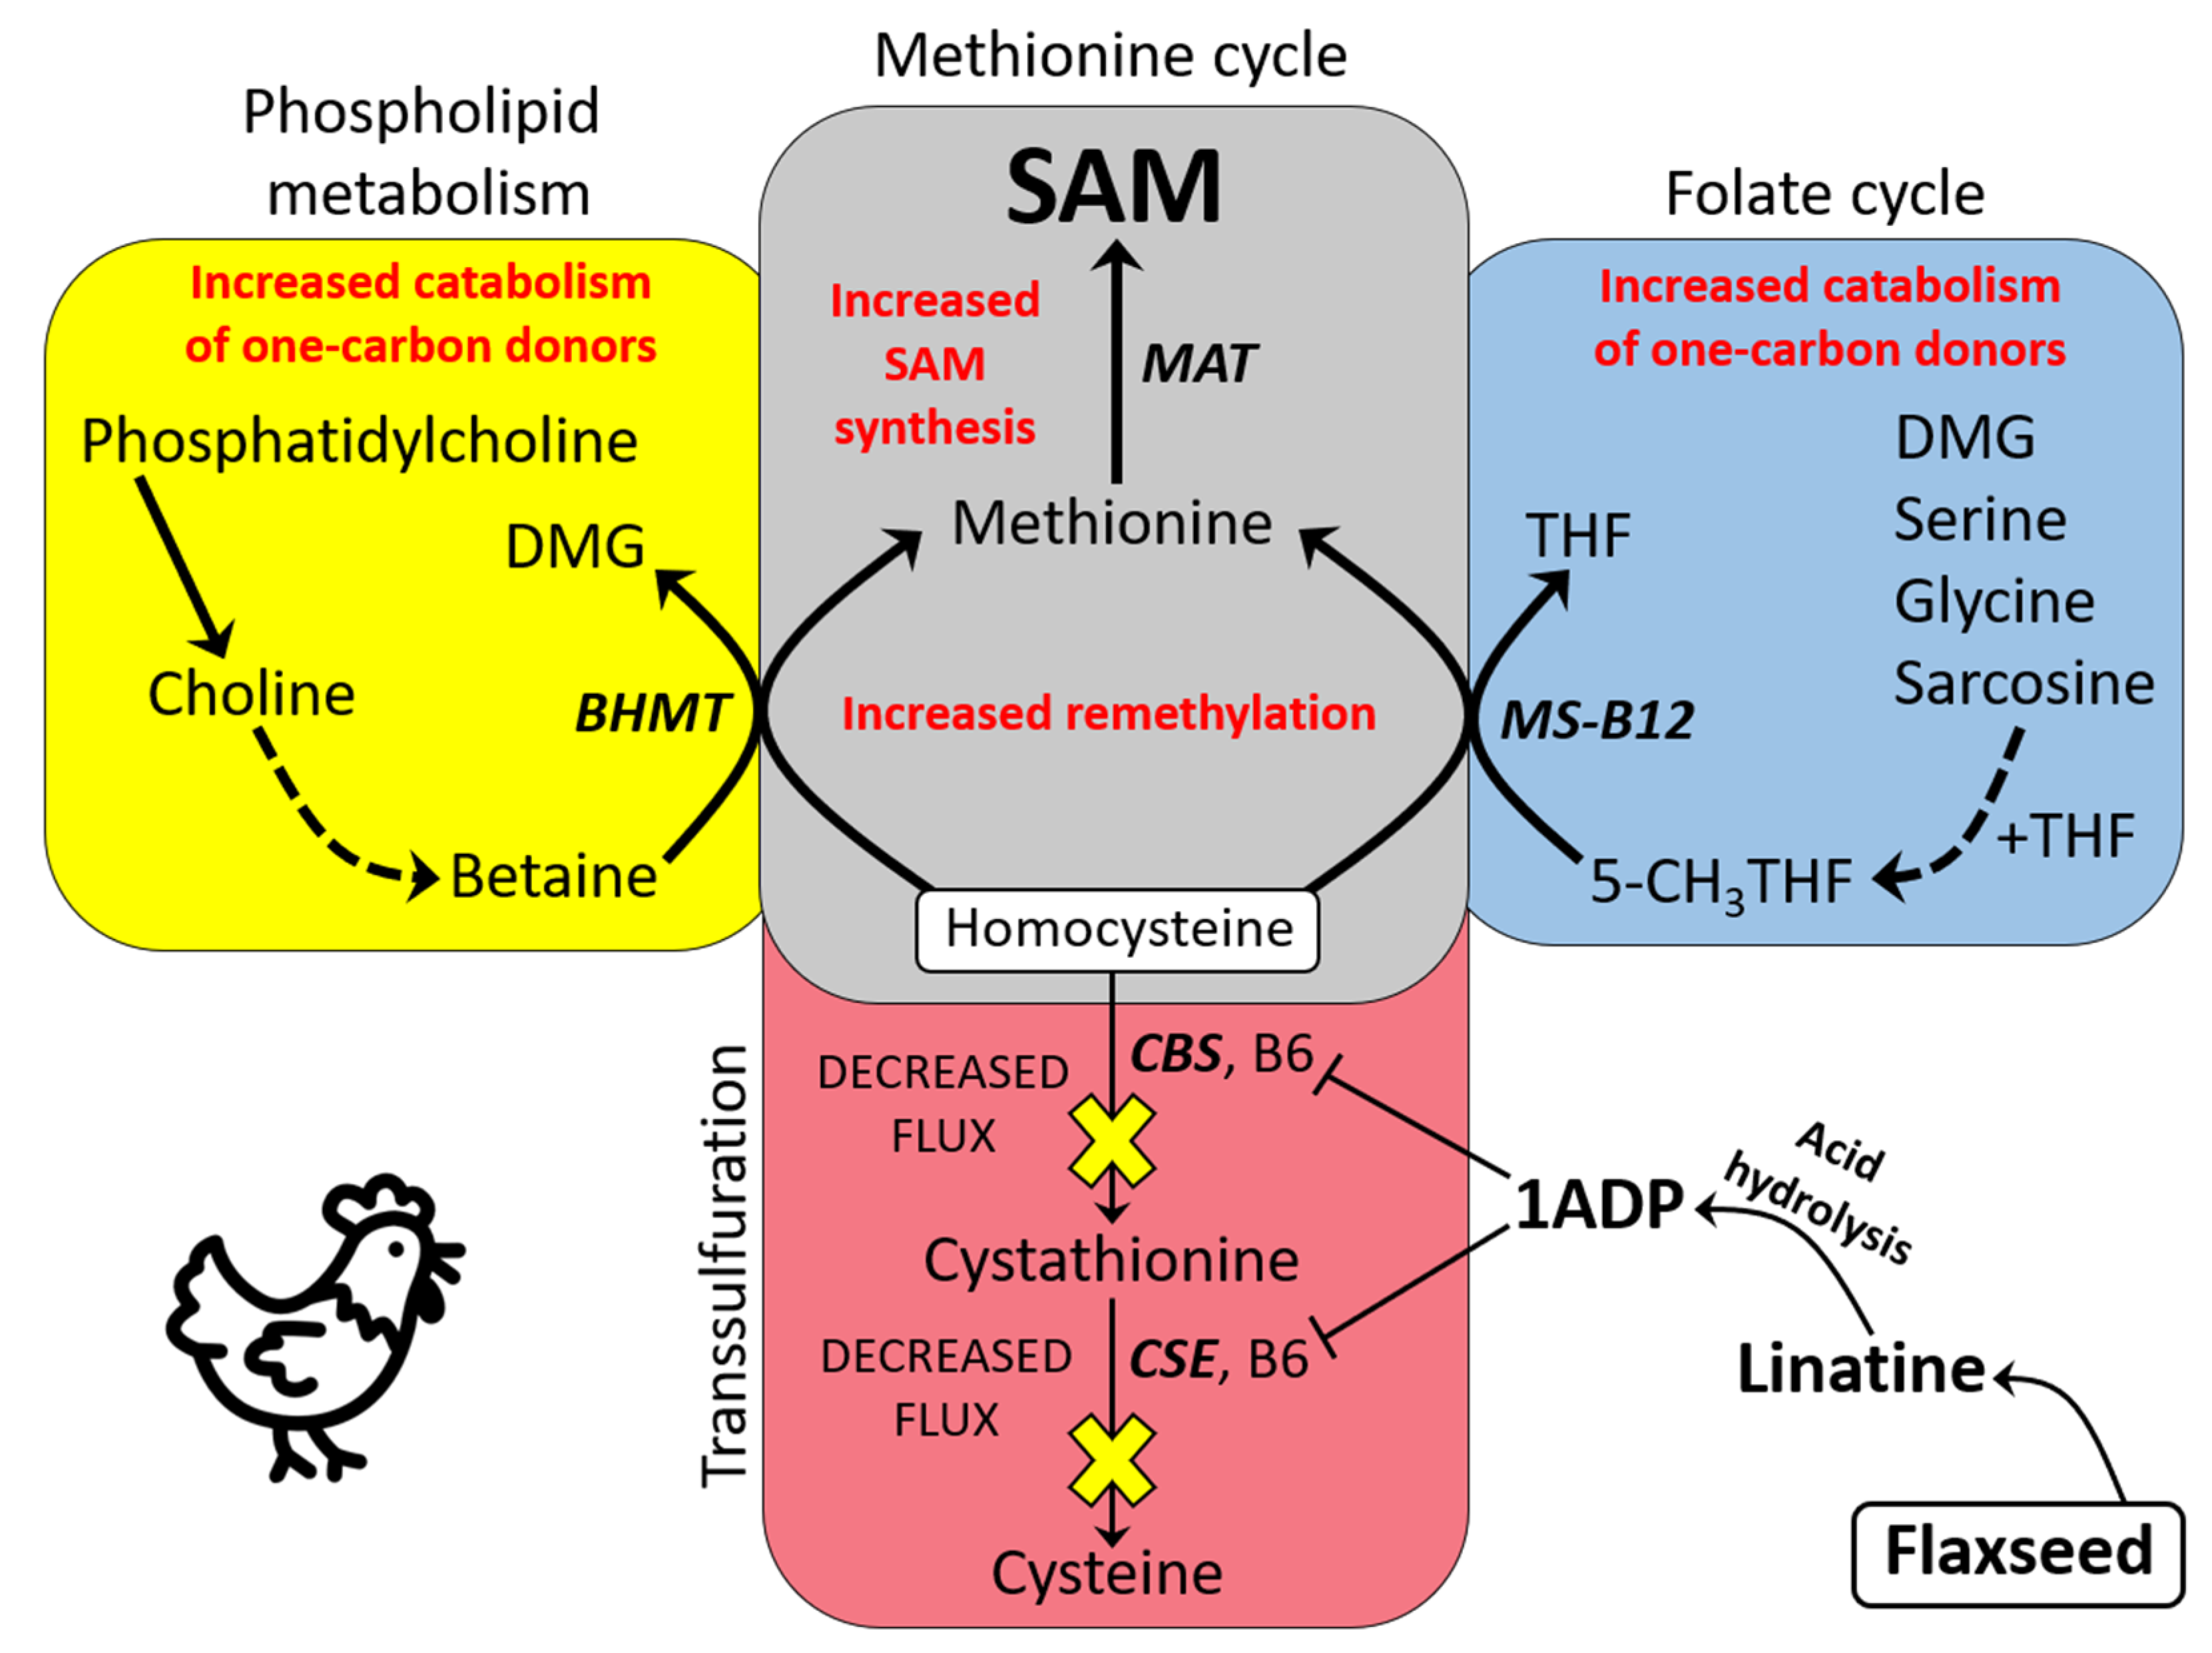
3.1. Basic Model of One-Carbon Metabolism in Flaxseed-Fed Hens
3.2. Flaxseed Perturbs B6 Metabolism and Transsulfuration Flux: The Effect of 1ADP
3.3. SAM, SAM:SAH Ratio, and MTA Are All Elevated in Flaxseed-Fed Hens
3.4. Increased Lifespan and Reduced Aging Associated with Elevated SAM and Elevated MTA
3.5. BHMT Hyperactivation: A Means to Accelerate Hcy Remethylation (with the Additional Effect of Decreasing Liver Steatosis, Liver Mass, and Body Mass)
3.6. Increased Input to the Folate Cycle: Also Accelerating Hcy Remethylation (Focus on DMG!)
3.7. Flaxseed Could Decelerate Ovarian Tumor Metastasis by Reducing Omental Adiposity
3.8. Flaxseed Protects Individuals from Cachexia during Cancer, by Improving Liver Function
3.9. Flaxseed Likely Regulates the Methyltransferome by Augmenting One-Carbon Metabolism
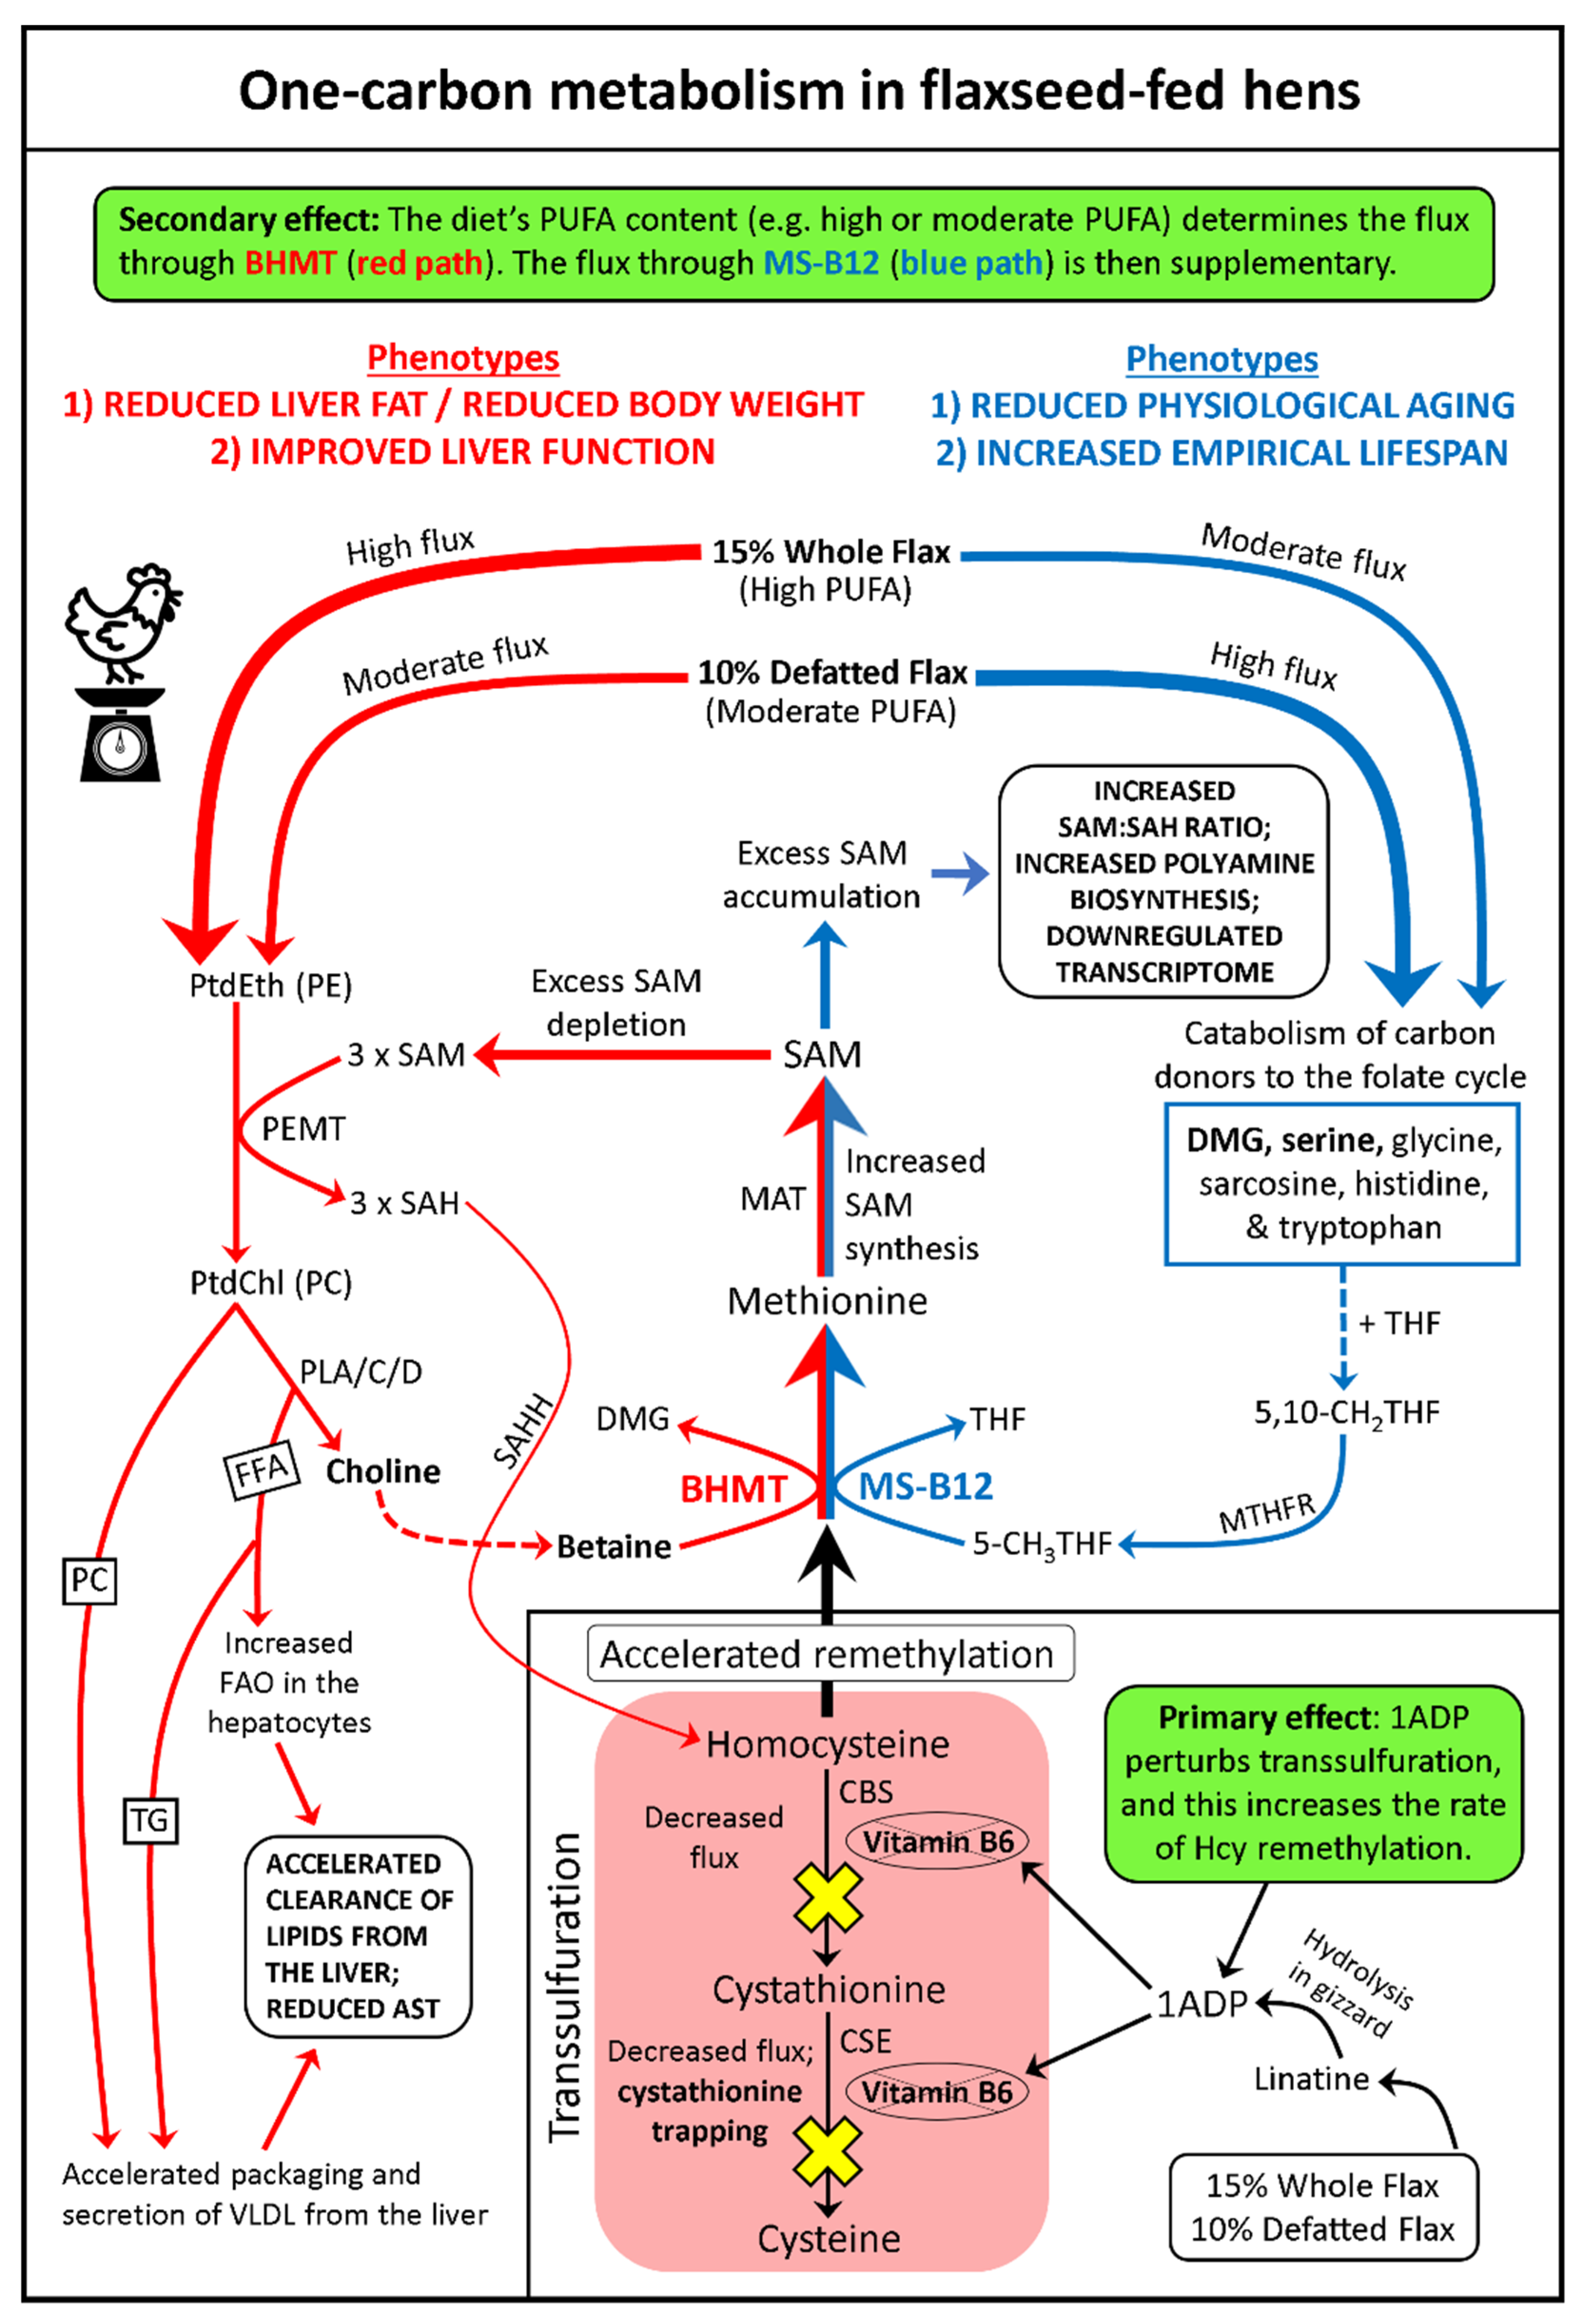
3.10. Comprehensive Model of One-Carbon Metabolism in Flaxseed-Fed Hens
4. Conclusions
5. Materials and Methods
5.1. Animal Studies and Diet Descriptions
5.2. Plasma Collection and Animal Necropsy
5.3. LC-MS/MS Analysis of Plasma Metabolites
5.4. RNA Isolation and cDNA Synthesis
5.5. qPCR Analysis
5.6. Reanalysis of Microarray Features Expressed in Hen Ovaries
5.7. Statistical Analysis
Supplementary Materials
Author Contributions
Funding
Institutional Review Board Statement
Informed Consent Statement
Data Availability Statement
Acknowledgments
Conflicts of Interest
Sample Availability
Abbreviations
| Abbreviation | Full term |
| 4PA | 4-Pyridoxic Acid |
| B6 | Vitamin B6 |
| 5,10-CH2THF | 5,10-Methylene Tetrahydrofolate |
| 5-CH3THF | 5-Methyl Tetrahydrofolate |
| BADH | Betaine aldehyde dehydrogenase |
| BHMT | Betaine homocysteine methyltransferase |
| CBWD1 | Cobalamin Synthetase W Domain-Containing Protein 1 |
| CHDH | Choline dehydrogenase |
| CRN | 5% Corn Oil |
| CTL | Control Diet |
| DNMT3A | DNA methyltransferase 3A |
| dcSAM | Decarboxylated SAM |
| DFM | 10% Defatted Flaxseed Meal |
| DHA | Docosahexaenoic Acid |
| DMG | Dimethylglycine |
| DMGDH | Dimethylglycine dehydrogenase |
| ED | Enterodiol |
| EL | Enterolactone |
| EPA | Eicosahexaenoic Acid |
| FSH | 5% Fish Oil |
| FXO | 5% Flaxseed Oil |
| GAPDH | Glyceraldehyde 3-phosphate dehydrogenase |
| GCS | Glycine Cleavage System |
| GPC | Glycerophosphorylcholine |
| Hcy | Homocysteine |
| HHcy | Hyperhomocysteinemia |
| KMT2C | Lysine methyltransferase 2C |
| MAT | Methionine adenosyltransferase |
| Met | Methionine |
| MS-B12 | Methionine synthase (complexed with B12) |
| MTA | Methylthioadenosine |
| MTHFR | Methylene tetrahydrofolate reductase |
| PC | Phosphatidylcholine |
| PE | Phosphatidylethanolamine |
| PEMT | Phosphatidylethanolamine methyltransferase |
| PLA | Phospholipase A |
| PLC | Phospholipase C |
| PLD | Phospholipase D |
| PRMT5 | Protein arginine methyltransferase 5 |
| PLP | Pyridoxal 5′ Phosphate |
| PUFA | Polyunsaturated Fatty Acid |
| SAH | S-adenosylhomocysteine |
| SAHH | S-adenosylhomocysteine hydrolase |
| SAM | S-adenosylmethionine |
| SDG | Secoisolariciresinol diglucoside |
| SDH | Sarcosine Dehydrogenase |
| SEM | Standard error of the mean |
| SHMT1 | Serine hydroxymethyltransferase 1 (cytosolic SHMT) |
| SHMT2 | Serine hydroxymethyltransferase 2 (mitochondrial SHMT) |
| TG | Triglyceride |
| THF | Tetrahydrofolate |
| TME | Total Metabolizable Energy |
| VIP | Variable Importance of Projection |
| VLDL | Very Low-Density Lipoprotein |
| WFX | 15% Whole Flaxseed |
| WFX10 | 10% Whole Flaxseed |
References
- Barua, A.; Bitterman, P.; Abramowicz, J.S.; Dirks, A.L.; Bahr, J.M.; Hales, D.B.; Bradaric, M.J.; Edassery, S.L.; Rotmensch, J.; Luborsky, J.L. Histopathology of ovarian tumors in laying hens, a preclinical model of human ovarian cancer. Int. J. Gynecol. Cancer 2009, 19, 531–539. [Google Scholar] [CrossRef] [Green Version]
- Johnson, P.A.; Giles, J.R. The hen as a model of ovarian cancer. Nat. Rev. Cancer 2013, 13, 432. [Google Scholar] [CrossRef]
- Hakim, A.A.; Barry, C.P.; Barnes, H.J.; Anderson, K.E.; Petitte, J.; Whitaker, R.; Lancaster, J.M.; Wenham, R.M.; Carver, D.K.; Turbov, J.; et al. Ovarian Adenocarcinomas in the Laying Hen and Women Share Similar Alterations in p53, ras, and HER-2/neu. Cancer Prev. Res. 2009, 2, 114–121. [Google Scholar] [CrossRef] [PubMed] [Green Version]
- Hawkridge, A.M. The Chicken Model of Spontaneous Ovarian Cancer. Proteomics. Clin. Appl. 2014, 8, 689–699. [Google Scholar] [CrossRef] [PubMed] [Green Version]
- Giles, J.R.; Elkin, R.G.; Trevino, L.S.; Urick, M.E.; Ramachandran, R.; Johnson, P.A. The restricted ovulator chicken: A unique animal model for investigating the etiology of ovarian cancer. Int. J. Gynecol. Cancer 2010, 20, 738–744. [Google Scholar] [CrossRef]
- Eilati, E.; Small, C.C.; McGee, S.R.; Kurrey, N.K.; Hales, D.B. Anti-inflammatory effects of fish oil in ovaries of laying hens target prostaglandin pathways. Lipids Health Dis. 2013, 12, 1. [Google Scholar] [CrossRef] [PubMed] [Green Version]
- Dikshit, A.; Hales, K.; Hales, D.B. Whole flaxseed diet alters estrogen metabolism to promote 2-methoxtestradiol-induced apoptosis in hen ovarian cancer. J. Nutr. Biochem. 2017, 42, 117–125. [Google Scholar] [CrossRef] [PubMed] [Green Version]
- Dikshit, A.; Gao, C.; Small, C.; Hales, K.; Hales, D.B. Flaxseed and its components differentially affect estrogen targets in pre-neoplastic hen ovaries. J. Steroid Biochem. Mol. Biol. 2016, 159, 73–85. [Google Scholar] [CrossRef] [Green Version]
- Hales, K.H.; Speckman, S.C.; Kurrey, N.K.; Hales, D.B. Uncovering molecular events associated with the chemosuppressive effects of flaxseed: A microarray analysis of the laying hen model of ovarian cancer. BMC Genom. 2014, 15, 709. [Google Scholar] [CrossRef] [Green Version]
- Pal, P.; Hales, K.; Petrik, J.; Hales, D.B. Pro-apoptotic and anti-angiogenic actions of 2-methoxyestradiol and docosahexaenoic acid, the biologically derived active compounds from flaxseed diet, in preventing ovarian cancer. J. Ovarian Res. 2019, 12, 49. [Google Scholar] [CrossRef] [PubMed]
- Ansenberger, K.; Richards, C.; Zhuge, Y.; Barua, A.; Bahr, J.M.; Luborsky, J.L.; Hales, D.B. Decreased severity of ovarian cancer and increased survival in hens fed a flaxseed-enriched diet for 1 year. Gynecol. Oncol. 2010, 117, 341–347. [Google Scholar] [CrossRef] [PubMed] [Green Version]
- Torre, L.A.; Trabert, B.; DeSantis, C.E.; Miller, K.D.; Samimi, G.; Runowicz, C.D.; Gaudet, M.M.; Jemal, A.; Siegel, R.L. Ovarian cancer statistics, 2018. CA. Cancer J. Clin. 2018, 68, 284–296. [Google Scholar] [CrossRef]
- Clare, C.E.; Brassington, A.H.; Kwong, W.Y.; Sinclair, K.D. One-Carbon Metabolism: Linking Nutritional Biochemistry to Epigenetic Programming of Long-Term Development. Annu. Rev. Anim. Biosci. 2019, 7, 263–287. [Google Scholar] [CrossRef]
- Ducker, G.S.; Rabinowitz, J.D. One-Carbon Metabolism in Health and Disease. Cell Metab. 2017, 25, 27–42. [Google Scholar] [CrossRef] [PubMed] [Green Version]
- da Silva, R.P.; Kelly, K.B.; Al Rajabi, A.; Jacobs, R.L. Novel insights on interactions between folate and lipid metabolism. Biofactors 2014, 40, 277–283. [Google Scholar] [CrossRef] [Green Version]
- Strakova, J.; Gupta, S.; Kruger, W.D.; Dilger, R.N.; Tryon, K.; Li, L.; Garrow, T.A. Inhibition of betaine-homocysteine S-methyltransferase in rats causes hyperhomocysteinemia and reduces liver cystathionine β-synthase activity and methylation capacity. Nutr. Res. 2011, 31, 563–571. [Google Scholar] [CrossRef] [PubMed] [Green Version]
- Froese, D.S.; Fowler, B.; Baumgartner, M.R. Vitamin B12, folate, and the methionine remethylation cycle—biochemistry, pathways, and regulation. J. Inherit. Metab. Dis. 2019, 42, 673–685. [Google Scholar] [CrossRef] [PubMed] [Green Version]
- Kabil, O.; Vitvitsky, V.; Xie, P.; Banerjee, R. The quantitative significance of the transsulfuration enzymes for H2S production in murine tissues. Antioxid. Redox Signal. 2011, 15, 363–372. [Google Scholar] [CrossRef] [Green Version]
- Cantoni, G.L.; Chiang, P.K. The Role of S-Adenosylhomocysteine and S-Adenosylhomocysteine Hydrolase in the Control of Biological Methylations. In Natural Sulfur Compounds; Cavallini, D., Gaull, G.E., Zappia, V., Eds.; Springer: Boston, MA, USA, 1980; pp. 67–80. [Google Scholar]
- Watanabe, M.; Osada, J.; Aratani, Y.; Kluckman, K.; Reddick, R.; Malinow, M.R.; Maeda, N. Mice deficient in cystathionine beta-synthase: Animal models for mild and severe homocyst(e)inemia. Proc. Natl. Acad. Sci. USA 1995, 92, 1585–1589. [Google Scholar] [CrossRef] [Green Version]
- Finkelstein, J.D. Methionine metabolism in liver diseases. Am. J. Clin. Nutr. 2003, 77, 1094–1095. [Google Scholar] [CrossRef] [Green Version]
- Finkelstein, J.D. Inborn Errors of Sulfur-Containing Amino Acid Metabolism. J. Nutr. 2006, 136, 1750S–1754S. [Google Scholar] [CrossRef] [Green Version]
- Mudd, S.H.; Brosnan, J.T.; Brosnan, M.E.; Jacobs, R.L.; Stabler, S.P.; Allen, R.H.; Vance, D.E.; Wagner, C. Methyl balance and transmethylation fluxes in humans. Am. J. Clin. Nutr. 2007, 85, 19–25. [Google Scholar] [CrossRef] [PubMed]
- Koutmos, M.; Datta, S.; Pattridge, K.A.; Smith, J.L.; Matthews, R.G. Insights into the reactivation of cobalamin-dependent methionine synthase. Proc. Natl. Acad. Sci. USA 2009, 106, 18527–18532. [Google Scholar] [CrossRef] [Green Version]
- Slow, S.; Garrow, T.A. Liver Choline Dehydrogenase and Kidney Betaine-Homocysteine Methyltransferase Expression Are Not Affected by Methionine or Choline Intake in Growing Rats. J. Nutr. 2006, 136, 2279–2283. [Google Scholar] [CrossRef] [PubMed] [Green Version]
- Finkelstein, J.D. Methionine metabolism in mammals. J. Nutr. Biochem. 1990, 1, 228–237. [Google Scholar] [CrossRef]
- Mudd, S.H.; Finkelstein, J.D.; Irreverre, F.; Laster, L. Transsulfuration in Mammals: Microassays and tissue distributions of three enzymes of the pathway. J. Biol. Chem. 1965, 240, 4382–4392. [Google Scholar] [CrossRef]
- Vance, D.E.; Walkey, C.J.; Cui, Z. Phosphatidylethanolamine N-methyltransferase from liver. Biochim. Biophys. Acta-Lipids Lipid Metab. 1997, 1348, 142–150. [Google Scholar] [CrossRef]
- McMullen, M.H.; Rowling, M.J.; Ozias, M.K.; Schalinske, K.L. Activation and induction of glycine N-methyltransferase by retinoids are tissue- and gender-specific. Arch. Biochem. Biophys. 2002, 401, 73–80. [Google Scholar] [CrossRef]
- Ye, C.; Sutter, B.M.; Wang, Y.; Kuang, Z.; Tu, B.P. A Metabolic Function for Phospholipid and Histone Methylation. Mol. Cell 2017, 66, 180–193.e8. [Google Scholar] [CrossRef] [Green Version]
- Cantoni, G.L. S-adenosylmethionine, a new intermediate formed enzymatically from l-methionine and adenosinetriphosphate. J. Biol. Chem. 1953, 204, 403–416. [Google Scholar] [CrossRef]
- Xia, L.; Ma, S.; Zhang, Y.; Wang, T.; Zhou, M.; Wang, Z.; Zhang, J. Daily variation in global and local DNA methylation in mouse livers. PLoS ONE 2015, 10, e0118101. [Google Scholar] [CrossRef] [Green Version]
- Xue, C.; Zhao, Y.; Li, L. Advances in RNA cytosine-5 methylation: Detection, regulatory mechanisms, biological functions and links to cancer. Biomark. Res. 2020, 8, 43. [Google Scholar] [CrossRef] [PubMed]
- Wang, X.; Lu, Z.; Gomez, A.; Hon, G.C.; Yue, Y.; Han, D.; Fu, Y.; Parisien, M.; Dai, Q.; Jia, G.; et al. N6-methyladenosine-dependent regulation of messenger RNA stability. Nature 2014, 505, 117–120. [Google Scholar] [CrossRef] [PubMed]
- Männistö, P.T.; Kaakkola, S. Catechol-O-methyltransferase (COMT): Biochemistry, Molecular Biology, Pharmacology, and Clinical Efficacy of the New Selective COMT Inhibitors. Pharmacol. Rev. 1999, 51, 593–628. [Google Scholar] [PubMed]
- Kerr, S.J. Competing Methyltransferase Systems. J. Biol. Chem. 1972, 247, 4248–4252. [Google Scholar] [CrossRef]
- Cantoni, G. S-Adenosylamino Acids Thirty Years Later: 1951–1981. In Biochemistry of S-Adenosylmethionine and Related Compounds; Palgrave Macmillan: Camden, London, UK, 1982; pp. 3–10. [Google Scholar]
- Fowler, B. The folate cycle in human disease. Kidney Int. 2001, 59, S221–S229. [Google Scholar] [CrossRef] [Green Version]
- Abbasi, I.H.R.; Abbasi, F.; Wang, L.; Abd El Hack, M.E.; Swelum, A.A.; Hao, R.; Yao, J.; Cao, Y. Folate promotes S-adenosyl methionine reactions and the microbial methylation cycle and boosts ruminants production and reproduction. AMB Express 2018, 8, 65. [Google Scholar] [CrossRef] [Green Version]
- Lamers, Y.; Williamson, J.; Ralat, M.; Quinlivan, E.P.; Gilbert, L.R.; Keeling, C.; Stevens, R.D.; Newgard, C.B.; Ueland, P.M.; Meyer, K.; et al. Moderate dietary vitamin B-6 restriction raises plasma glycine and cystathionine concentrations while minimally affecting the rates of glycine turnover and glycine cleavage in healthy men and women. J. Nutr. 2009, 139, 452–460. [Google Scholar] [CrossRef] [Green Version]
- Perry, C.; Yu, S.; Chen, J.; Matharu, K.S.; Stover, P.J. Effect of vitamin B6 availability on serine hydroxymethyltransferase in MCF-7 cells. Arch. Biochem. Biophys. 2007, 462, 21–27. [Google Scholar] [CrossRef] [Green Version]
- Wittwer, A.J.; Wagner, C. Identification of the folate-binding proteins of rat liver mitochondria as dimethylglycine dehydrogenase and sarcosine dehydrogenase. Flavoprotein nature and enzymatic properties of the purified proteins. J. Biol. Chem. 1981, 256, 4109–4115. [Google Scholar] [CrossRef]
- Kikuchi, G.; Motokawa, Y.; Yoshida, T.; Hiraga, K. Glycine cleavage system: Reaction mechanism, physiological significance, and hyperglycinemia. Proc. Jpn. Acad. Ser. B Phys. Biol. Sci. 2008, 84, 246–263. [Google Scholar] [CrossRef] [PubMed] [Green Version]
- Osborne, C.B.; Lowe, K.E.; Shane, B. Regulation of folate and one-carbon metabolism in mammalian cells. I. Folate metabolism in Chinese hamster ovary cells expressing Escherichia coli or human folylpoly-gamma-glutamate synthetase activity. J. Biol. Chem. 1993, 268, 21657–21664. [Google Scholar] [CrossRef]
- Millian, N.S.; Garrow, T.A. Human Betaine–Homocysteine Methyltransferase Is a Zinc Metalloenzyme. Arch. Biochem. Biophys. 1998, 356, 93–98. [Google Scholar] [CrossRef] [PubMed]
- Dowhan, W.; Bogdanov, M.B.T.-N.C.B. Chapter 1 Functional roles of lipids in membranes. In Biochemistry of Lipids, Lipoproteins and Membranes, 4th ed.; Vance, D.E., Vance, J.E., Eds.; Elsevier: Alpharetta, GA, USA, 2002; Volume 36, pp. 1–35. ISBN 0167-7306. [Google Scholar]
- Åkesson, B. Autoregulation of phospholipid N-methylation by the membrane phosphatidylethanolamine content. FEBS Lett. 1978, 92, 177–180. [Google Scholar] [CrossRef] [Green Version]
- Sundler, R.; Akesson, B. Regulation of phospholipid biosynthesis in isolated rat hepatocytes. Effect of different substrates. J. Biol. Chem. 1975, 250, 3359–3367. [Google Scholar] [CrossRef]
- Neece, D.J.; Griffiths, M.A.; Garrow, T.A. Isolation and characterization of a mouse betaine-homocysteine S-methyltransferase gene and pseudogene. Gene 2000, 250, 31–40. [Google Scholar] [CrossRef]
- Klosterman, H.J. Vitamin B6 antagonists of natural origin. J. Agric. Food Chem. 1974, 22, 13–16. [Google Scholar] [CrossRef]
- Klosterman, H.J.; Lamoureux, G.L.; Parsons, J.L. Isolation, Characterization, and Synthesis of Linatine. A Vitamin B6 Antagonist from Flaxseed (Linum usitatissimum). Biochemistry 1967, 6, 170–177. [Google Scholar] [CrossRef]
- Mayengbam, S.; Yang, H.; Barthet, V.; Aliani, M.; House, J.D. Identification, Characterization, and Quantification of an Anti-pyridoxine Factor from Flaxseed Using Ultrahigh-Performance Liquid Chromatography–Mass Spectrometry. J. Agric. Food Chem. 2014, 62, 419–426. [Google Scholar] [CrossRef]
- Bethke, R.M.; Bohstedt, G.; Sassaman, H.L.; Kennard, D.C.; Edgington, B.H. The comparative nutritive value of the proteins of linseed meal and cottonseed meal for different animals. J. Agric. Res. 1928, 36, 817–855. [Google Scholar]
- Kratzer, F.H.; Williams, D.E. The Improvement of Linseed Oil Meal for Chick Feeding by the Addition of Synthetic Vitamins. Poult. Sci. 1948, 27, 236–238. [Google Scholar] [CrossRef]
- Kratzer, F.H. The Growth Depression of Turkey Poults Caused by Linseed Oil Meal. Poult. Sci. 1949, 28, 618–620. [Google Scholar] [CrossRef]
- Mayengbam, S.; Raposo, S.; Aliani, M.; House, J.D. Oral exposure to the anti-pyridoxine compound 1-amino d-proline further perturbs homocysteine metabolism through the transsulfuration pathway in moderately vitamin B6 deficient rats. J. Nutr. Biochem. 2015, 26, 241–249. [Google Scholar] [CrossRef]
- Mayengbam, S.; Raposo, S.; Aliani, M.; House, J.D. A Vitamin B-6 Antagonist from Flaxseed Perturbs Amino Acid Metabolism in Moderately Vitamin B-6–Deficient Male Rats. J. Nutr. 2015, 146, 14–20. [Google Scholar] [CrossRef] [Green Version]
- Zhang, Z.; Kebreab, E.; Jing, M.; Rodriguez-Lecompte, J.C.; Kuehn, R.; Flintoft, M.; House, J.D. Impairments in pyridoxine-dependent sulphur amino acid metabolism are highly sensitive to the degree of vitamin B6 deficiency and repletion in the pig. Animal 2009, 3, 826–837. [Google Scholar] [CrossRef]
- Davis, S.R.; Quinlivan, E.P.; Stacpoole, P.W.; Gregory III, J.F. Plasma Glutathione and Cystathionine Concentrations Are Elevated but Cysteine Flux Is Unchanged by Dietary Vitamin B-6 Restriction in Young Men and Women. J. Nutr. 2006, 136, 373–378. [Google Scholar] [CrossRef]
- Lima, C.P.; Davis, S.R.; Mackey, A.D.; Scheer, J.B.; Williamson, J.; Gregory III, J.F. Vitamin B-6 Deficiency Suppresses the Hepatic Transsulfuration Pathway but Increases Glutathione Concentration in Rats Fed AIN-76A or AIN-93G Diets. J. Nutr. 2006, 136, 2141–2147. [Google Scholar] [CrossRef] [PubMed]
- Soda, K. Polyamine Metabolism and Gene Methylation in Conjunction with One-Carbon Metabolism. Int. J. Mol. Sci. 2018, 19, 3106. [Google Scholar] [CrossRef] [Green Version]
- Stead, L.M.; Brosnan, J.T.; Brosnan, M.E.; Vance, D.E.; Jacobs, R.L. Is it time to reevaluate methyl balance in humans? Am. J. Clin. Nutr. 2006, 83, 5–10. [Google Scholar] [CrossRef] [PubMed]
- Jacobs, R.L.; Stead, L.M.; Devlin, C.; Tabas, I.; Brosnan, M.E.; Brosnan, J.T.; Vance, D.E. Physiological regulation of phospholipid methylation alters plasma homocysteine in mice. J. Biol. Chem. 2005, 280, 28299–28305. [Google Scholar] [CrossRef] [PubMed] [Green Version]
- Igolnikov, A.C.; Green, R.M. Mice heterozygous for the Mdr2 gene demonstrate decreased PEMT activity and diminished steatohepatitis on the MCD diet. J. Hepatol. 2006, 44, 586–592. [Google Scholar] [CrossRef]
- Mudd, S.H.; Poole, J.R. Labile methyl balances for normal humans on various dietary regimens. Metab. Clin. Exp. 1975, 24, 721–735. [Google Scholar] [CrossRef]
- Aziza, A.E.; Awadin, W.; Cherian, G. Impact of Choline Supplementation on Hepatic Histopathology, Phospholipid Content, and Tocopherol Status in Layer Hens Fed Flaxseed. J. Appl. Poult. Res. 2019, 28, 679–687. [Google Scholar] [CrossRef]
- van der Veen, J.N.; Kennelly, J.P.; Wan, S.; Vance, J.E.; Vance, D.E.; Jacobs, R.L. The critical role of phosphatidylcholine and phosphatidylethanolamine metabolism in health and disease. Biochim. Biophys. Acta-Biomembr. 2017, 1859, 1558–1572. [Google Scholar] [CrossRef] [PubMed]
- DeLong, C.J.; Shen, Y.J.; Thomas, M.J.; Cui, Z. Molecular distinction of phosphatidylcholine synthesis between the CDP- choline pathway and phosphatidylethanolamine methylation pathway. J. Biol. Chem. 1999, 274, 29683–29688. [Google Scholar] [CrossRef] [Green Version]
- Ho, A.; Sinick, J.; Esko, T.; Fischer, K.; Menni, C.; Zierer, J.; Matey-Hernandez, M.; Fortney, K.; Morgen, E.K. Circulating glucuronic acid predicts healthspan and longevity in humans and mice. Aging 2019, 11, 7694–7706. [Google Scholar] [CrossRef] [PubMed]
- Montoliu, I.; Scherer, M.; Beguelin, F.; DaSilva, L.; Mari, D.; Salvioli, S.; Martin, F.-P.J.; Capri, M.; Bucci, L.; Ostan, R.; et al. Serum profiling of healthy aging identifies phospho- and sphingolipid species as markers of human longevity. Aging 2014, 6, 9–25. [Google Scholar] [CrossRef] [Green Version]
- Suzuki, S.; Kodera, Y.; Saito, T.; Fujimoto, K.; Momozono, A.; Hayashi, A.; Kamata, Y.; Shichiri, M. Methionine sulfoxides in serum proteins as potential clinical biomarkers of oxidative stress. Sci. Rep. 2016, 6, 38299. [Google Scholar] [CrossRef] [Green Version]
- Dërmaku-Sopjani, M.; Kolgeci, S.; Abazi, S.; Sopjani, M. Significance of the anti-aging protein Klotho. Mol. Membr. Biol. 2013, 30, 369–385. [Google Scholar] [CrossRef]
- Zeng, Y.; Wang, P.-H.; Zhang, M.; Du, J.-R. Aging-related renal injury and inflammation are associated with downregulation of Klotho and induction of RIG-I/NF-κB signaling pathway in senescence-accelerated mice. Aging Clin. Exp. Res. 2016, 28, 69–76. [Google Scholar] [CrossRef]
- Yan, Y.; Wang, Y.; Xiong, Y.; Lin, X.; Zhou, P.; Chen, Z. Reduced Klotho expression contributes to poor survival rates in human patients with ovarian cancer, and overexpression of Klotho inhibits the progression of ovarian cancer partly via the inhibition of systemic inflammation in nude mice. Mol. Med. Rep. 2017, 15, 1777–1785. [Google Scholar] [CrossRef] [Green Version]
- Lu, L.; Katsaros, D.; Wiley, A.; Rigault de la Longrais, I.A.; Puopolo, M.; Yu, H. Klotho Expression in Epithelial Ovarian Cancer and its Association with Insulin-Like Growth Factors and Disease Progression. Cancer Investig. 2008, 26, 185–192. [Google Scholar] [CrossRef] [PubMed]
- Mayengbam, S.; Raposo, S.; House, J. Effect of Vitamin B6-antagonist from Flaxseed on Amino Acid Metabolism in Moderately Vitamin B6-deficient Rats. FASEB J. 2015, 29, 134.6. [Google Scholar] [CrossRef]
- Humberto Vilar Da Silva, J.; González-Cerón, F.; Howerth, E.W.; Rekaya, R.; Aggrey, S.E. Inhibition of the Transsulfuration Pathway Affects Growth and Feather Follicle Development in Meat-Type Chickens. Anim. Biotechnol. 2019, 30, 175–179. [Google Scholar] [CrossRef]
- Wang, H.; Jiang, X.; Yang, F.; Gaubatz, J.W.; Ma, L.; Magera, M.J.; Yang, X.; Berger, P.B.; Durante, W.; Pownall, H.J.; et al. Hyperhomocysteinemia accelerates atherosclerosis in cystathionine β-synthase and apolipoprotein E double knock-out mice with and without dietary perturbation. Blood 2003, 101, 3901–3907. [Google Scholar] [CrossRef] [PubMed]
- Wang, L.; Jhee, K.H.; Hua, X.; DiBello, P.M.; Jacobsen, D.W.; Kruger, W.D. Modulation of Cystathionine β-Synthase Level Regulates Total Serum Homocysteine in Mice. Circ. Res. 2004, 94, 1318–1324. [Google Scholar] [CrossRef] [PubMed] [Green Version]
- Zhang, J.; Zheng, Y.G. SAM/SAH Analogs as Versatile Tools for SAM-Dependent Methyltransferases. ACS Chem. Biol. 2016, 11, 583–597. [Google Scholar] [CrossRef] [Green Version]
- Kryukov, G.V.; Wilson, F.H.; Ruth, J.R.; Paulk, J.; Tsherniak, A.; Marlow, S.E.; Vazquez, F.; Weir, B.A.; Fitzgerald, M.E.; Tanaka, M.; et al. MTAP deletion confers enhanced dependency on the PRMT5 arginine methyltransferase in cancer cells. Science 2016, 351, 1214–1218. [Google Scholar] [CrossRef] [PubMed] [Green Version]
- Minois, N.; Carmona-Gutierrez, D.; Madeo, F. Polyamines in aging and disease. Aging 2011, 3, 716–732. [Google Scholar] [CrossRef] [PubMed] [Green Version]
- Soda, K.; Dobashi, Y.; Kano, Y.; Tsujinaka, S.; Konishi, F. Polyamine-rich food decreases age-associated pathology and mortality in aged mice. Exp. Gerontol. 2009, 44, 727–732. [Google Scholar] [CrossRef]
- Scalabrino, G.; Ferioli, M.E. Polyamines in mammalian ageing: An oncological problem, too? A review. Mech. Ageing Dev. 1984, 26, 149–164. [Google Scholar] [CrossRef]
- Nishimura, K.; Shiina, R.; Kashiwagi, K.; Igarashi, K. Decrease in Polyamines with Aging and Their Ingestion from Food and Drink. J. Biochem. 2006, 139, 81–90. [Google Scholar] [CrossRef] [PubMed]
- Vivó, M.; de Vera, N.; Cortés, R.; Mengod, G.; Camón, L.; Martínez, E. Polyamines in the basal ganglia of human brain. Influence of aging and degenerative movement disorders. Neurosci. Lett. 2001, 304, 107–111. [Google Scholar] [CrossRef]
- Eisenberg, T.; Knauer, H.; Schauer, A.; Büttner, S.; Ruckenstuhl, C.; Carmona-Gutierrez, D.; Ring, J.; Schroeder, S.; Magnes, C.; Antonacci, L.; et al. Induction of autophagy by spermidine promotes longevity. Nat. Cell Biol. 2009, 11, 1305–1314. [Google Scholar] [CrossRef] [PubMed]
- Altamura, C.; Maes, M.; Dai, J.; Meltzer, H.Y. Plasma concentrations of excitatory amino acids, serine, glycine, taurine and histidine in major depression. Eur. Neuropsychopharmacol. 1995, 5, 71–75. [Google Scholar] [CrossRef]
- Neeman, G.; Blanaru, M.; Bloch, B.; Kremer, I.; Ermilov, M.; Javitt, D.C.; Heresco-Levy, U. Relation of Plasma Glycine, Serine, and Homocysteine Levels to Schizophrenia Symptoms and Medication Type. Am. J. Psychiatry 2005, 162, 1738–1740. [Google Scholar] [CrossRef]
- Parker, V.J.; Fascetti, A.J.; Klamer, B.G. Amino acid status in dogs with protein-losing nephropathy. J. Vet. Intern. Med. 2019, 33, 680–685. [Google Scholar] [CrossRef] [PubMed]
- Davis, J.E.; Cain, J.; Small, C.; Hales, D.B. Therapeutic effect of flax-based diets on fatty liver in aged laying hens. Poult. Sci. 2016, 95, 2624–2632. [Google Scholar] [CrossRef]
- Davis, J.E.; Cain, J.; Small, C.; Hales, D.B. Supplementation of whole flaxseed reduced hepatic steatosis in aged laying hens. FASEB J. 2016, 30, 692.28. [Google Scholar] [CrossRef]
- Thanabalan, A.; Moats, J.; Kiarie, E.G. Effects of feeding broiler breeder hens a coextruded full-fat flaxseed and pulses mixture without or with multienzyme supplement. Poult. Sci. 2020, 99, 2616–2623. [Google Scholar] [CrossRef]
- Singh, U.; Yokota, K.; Gupta, C.; Shinozuka, H. Choline deficiency activates phospholipases A2 and C in rat liver without affecting the activity of protein kinase C. J. Nutr. Biochem. 1990, 1, 434–439. [Google Scholar] [CrossRef]
- Prigogine, I.; Lefever, R. Symmetry Breaking Instabilities in Dissipative Systems. II. J. Chem. Phys. 1968, 48, 1695–1700. [Google Scholar] [CrossRef]
- Kitts, D.D.; Yuan, Y.V.; Wijewickreme, A.N.; Thompson, L.U. Antioxidant activity of the flaxseed lignan secoisolariciresinol diglycoside and its mammalian lignan metabolites enterodiol and enterolactone. Mol. Cell. Biochem. 1999, 202, 91–100. [Google Scholar] [CrossRef] [PubMed]
- Damdimopoulou, P.; Nurmi, T.; Salminen, A.; Damdimopoulos, A.E.; Kotka, M.; van der Saag, P.; Strauss, L.; Poutanen, M.; Pongratz, I.; Mäkelä, S. A Single Dose of Enterolactone Activates Estrogen Signaling and Regulates Expression of Circadian Clock Genes in Mice. J. Nutr. 2011, 141, 1583–1589. [Google Scholar] [CrossRef] [PubMed] [Green Version]
- Landen, C.N.; Birrer, M.J.; Sood, A.K. Early Events in the Pathogenesis of Epithelial Ovarian Cancer. J. Clin. Oncol. 2008, 26, 995–1005. [Google Scholar] [CrossRef] [PubMed]
- Cho, K.R.; Shih, I.-M. Ovarian Cancer. Annu. Rev. Pathol. Mech. Dis. 2009, 4, 287–313. [Google Scholar] [CrossRef]
- Howlader, N.; Noone, A.M.; Krapcho, M.; Miller, D.; Brest, A.; Yu, M.; Ruhl, J.; Tatalovich, Z.; Mariotto, A.; Lewis, D.R.; et al. SEER Cancer Statistics Review, 1975–2017. Available online: https://seer.cancer.gov/archive/csr/1975_2017/ (accessed on 31 October 2020).
- Lengyel, E. Ovarian cancer development and metastasis. Am. J. Pathol. 2010, 177, 1053–1064. [Google Scholar] [CrossRef]
- Nieman, K.M.; Kenny, H.A.; Penicka, C.V.; Ladanyi, A.; Buell-Gutbrod, R.; Zillhardt, M.R.; Romero, I.L.; Carey, M.S.; Mills, G.B.; Hotamisligil, G.S.; et al. Adipocytes promote ovarian cancer metastasis and provide energy for rapid tumor growth. Nat. Med. 2011, 17, 1498–1503. [Google Scholar] [CrossRef] [Green Version]
- Mohammadi-Sartang, M.; Mazloom, Z.; Raeisi-Dehkordi, H.; Barati-Boldaji, R.; Bellissimo, N.; Totosy de Zepetnek, J.O. The effect of flaxseed supplementation on body weight and body composition: A systematic review and meta-analysis of 45 randomized placebo-controlled trials. Obes. Rev. 2017, 18, 1096–1107. [Google Scholar] [CrossRef]
- Aoyagi, T.; Terracina, K.P.; Raza, A.; Matsubara, H.; Takabe, K. Cancer cachexia, mechanism and treatment. World J. Gastrointest. Oncol. 2015, 7, 17–29. [Google Scholar] [CrossRef]
- Bronger, H.; Hederich, P.; Hapfelmeier, A.; Metz, S.; Noël, P.B.; Kiechle, M.; Schmalfeldt, B. Sarcopenia in Advanced Serous Ovarian Cancer. Int. J. Gynecol. Cancer 2017, 27, 223–232. [Google Scholar] [CrossRef]
- Fearon, K.; Strasser, F.; Anker, S.D.; Bosaeus, I.; Bruera, E.; Fainsinger, R.L.; Jatoi, A.; Loprinzi, C.; MacDonald, N.; Mantovani, G.; et al. Definition and classification of cancer cachexia: An international consensus. Lancet Oncol. 2011, 12, 489–495. [Google Scholar] [CrossRef]
- Evans, W.J.; Morley, J.E.; Argilés, J.; Bales, C.; Baracos, V.; Guttridge, D.; Jatoi, A.; Kalantar-Zadeh, K.; Lochs, H.; Mantovani, G.; et al. Cachexia: A new definition. Clin. Nutr. 2008, 27, 793–799. [Google Scholar] [CrossRef]
- Porporato, P.E. Understanding cachexia as a cancer metabolism syndrome. Oncogenesis 2016, 5, e200. [Google Scholar] [CrossRef] [PubMed] [Green Version]
- Plauth, M.; Schütz, E.-T. Cachexia in liver cirrhosis. Int. J. Cardiol. 2002, 85, 83–87. [Google Scholar] [CrossRef]
- Noga, A.A.; Zhao, Y.; Vance, D.E. An Unexpected Requirement for PhosphatidylethanolamineN-Methyltransferase in the Secretion of Very Low Density Lipoproteins. J. Biol. Chem. 2002, 277, 42358–42365. [Google Scholar] [CrossRef] [Green Version]
- Estabrook, R.W. A Passion for P450s (Remembrances of the early history of research on cytochrome P450). Drug Metab. Dispos. 2003, 31, 1461–1473. [Google Scholar] [CrossRef] [PubMed]
- Robertson, K.D.; Keyomarsi, K.; Gonzales, F.A.; Velicescu, M.; Jones, P.A. Differential mRNA expression of the human DNA methyltransferases (DNMTs) 1, 3a and 3b during the G0/G1 to S phase transition in normal and tumor cells. Nucleic Acids Res. 2000, 28, 2108–2113. [Google Scholar] [CrossRef] [Green Version]
- Mullen, A.R.; Hu, Z.; Shi, X.; Jiang, L.; Boroughs, L.K.; Kovacs, Z.; Boriack, R.; Rakheja, D.; Sullivan, L.B.; Linehan, W.M.; et al. Oxidation of alpha-ketoglutarate is required for reductive carboxylation in cancer cells with mitochondrial defects. Cell Rep. 2014, 7, 1679–1690. [Google Scholar] [CrossRef] [Green Version]
- Rio, D.C.; Ares, M.; Hannon, G.J.; Nilsen, T.W. Purification of RNA Using TRIzol (TRI Reagent). Cold Spring Harb. Protoc. 2010, pdb.prot5439. [Google Scholar] [CrossRef] [PubMed]
- Livak, K.J.; Schmittgen, T.D. Analysis of Relative Gene Expression Data Using Real-Time Quantitative PCR and the 2−ΔΔCT Method. Methods 2001, 25, 402–408. [Google Scholar] [CrossRef] [PubMed]


| Ovarian Tissue Type | p-Value Cutoff from t-Test (Whole Flax Versus Control Diet) | Total Number of Features Affected at p-Value Cutoff | Ratio of Downregulated to Upregulated | Average Fold Change Per Downregulated or Upregulated Feature | |||
|---|---|---|---|---|---|---|---|
| Total (n) | * Down by WFX10 (n) | # Up by WFX10 (n) | Ratio (Down/Up) | Fold Down | Fold Up | ||
| Normal ovary | p < 0.10 | 5042 | 3479 | 1563 | 2.23 | −1.74 | +1.53 |
| p < 0.05 | 2198 | 1671 | 527 | 3.17 | −1.83 | +1.64 | |
| p < 0.01 | 156 | 127 | 29 | 4.38 | −2.09 | +1.91 | |
| Cancerous ovary | p < 0.10 | 2965 | 1721 | 1235 | 1.39 | −1.60 | +1.60 |
| p < 0.05 | 1199 | 767 | 432 | 1.78 | −1.75 | +1.66 | |
| p < 0.01 | 157 | 120 | 37 | 3.24 | −2.01 | +1.90 | |
| Ovarian Tissue Type | Gene Name | Description of Gene | Fold Change | p-Value |
|---|---|---|---|---|
| Normal ovary | KMT2C | Histone-lysine methyltransferase (H3K4 methyltransferase) | −2.10 | 0.005 |
| TRMT1L (C1orf25) | tRNA methyltransferase | −2.10 | 0.007 | |
| SAM-MT | Conserved sequence domain for an unnamed SAM-dependent methyltransferase | −2.04 | 0.008 | |
| NOL1, NOP2 | Ribosomal RNA methyltransferase | −1.97 | 0.009 | |
| CBWD1 (COBW) | Cobalamin (B12) biosynthesis | −1.88 | 0.009 | |
| RSBN1 (ROSBIN) | Histone-lysine demethylase (H4K20 demethylase) | −1.67 | 0.005 | |
| Cancerous ovary | SLC25A26 | Mitochondrial SAM carrier protein (SAMC) | +2.07 | 0.003 |
| Ingredient (g/100 g) | Control (CTL) | 10% Defatted Flaxseed Meal (DFM) | 15% Whole Flaxseed (WFX) | 5% Flax Oil (FXO) | 5% Corn Oil (CRN) | 5% Menhaden Fish Oil (FSH) |
|---|---|---|---|---|---|---|
| Corn | 67.40 | 54.90 | 47.58 | 52.00 | 52.00 | 52.00 |
| Soybean meal | 18.30 | 18.30 | 18.30 | 18.30 | 18.30 | 18.30 |
| Flaxseed (whole) | 15.00 | |||||
| Corn Gluten Meal | 3.00 | 5.00 | 5.00 | 5.00 | ||
| Corn Oil | 5.00 | |||||
| Flax Oil | 5.00 | |||||
| Fish Oil | 5.00 | |||||
| Defatted Flax Meal | 10.00 | |||||
| Qual Fat | 3.80 | 2.50 | ||||
| Solka Floc | 0.30 | 2.00 | 5.62 | 8.70 | 8.70 | 8.70 |
| Each diet received the following in g/100 g of diet: limestone (8.75), dical (1.5), salt (0.3), vitamin mix 1 (0.2), mineral mix 2 (0.15), and dl-methionine (0.1). | ||||||
| Calculated Analysis | Control (CTL) | 10% Defatted Flaxseed Meal (DFM) | 15% Whole Flaxseed (WFX) | 5% Flax Oil (FXO) | 5% Corn Oil (CRN) | 5% Menhaden Fish Oil (FSH) |
|---|---|---|---|---|---|---|
| TME 1, kcal/kg | 2816 | 2816 | 2815 | 2815 | 2815 | 2815 |
| CP 2, % TME | 16.56 | 17.04 | 16.50 | 16.49 | 16.49 | 16.49 |
| Calcium, % TME | 3.73 | 3.77 | 3.75 | 3.73 | 3.73 | 3.73 |
| aPhosphorus 3, % TME | 0.38 | 0.40 | 0.38 | 0.37 | 0.37 | 0.37 |
| Met + Cys, % TME | 0.67 | 0.72 | 0.64 | 0.67 | 0.67 | 0.67 |
| Gene | Forward Primer (5′ to 3′) | Reverse Primer (5′ to 3′) |
|---|---|---|
| BHMT | TGGGTCAGAGCAAGAGCAAGAAA | TGGTCACTCCCCAGCCATCT |
| CBS | GTTCCAGTGTCTAAGGCCAAGCC | CTTACAGTCCTCAGTGTCTGTCCCA |
| CSE | CACTTCGGCACGCAGGCCAT | CGCCTGCTGCTTGAACGTGGT |
| GAPDH | ACAGCAACCGTGTTGTGGAC | CAACAAAGGGTCCTGCTTCC |
| MS | CAGAGCCGCAGAAGAAAGCAAG | AGAGGTGTGCCTCGGAAGTGA |
| MTHFR | GGCAGCAGCAGTGGGAGTG | GCCTCCGCCGCATCTTCTC |
Publisher’s Note: MDPI stays neutral with regard to jurisdictional claims in published maps and institutional affiliations. |
© 2021 by the authors. Licensee MDPI, Basel, Switzerland. This article is an open access article distributed under the terms and conditions of the Creative Commons Attribution (CC BY) license (https://creativecommons.org/licenses/by/4.0/).
Share and Cite
Weston, W.C.; Hales, K.H.; Hales, D.B. Flaxseed Increases Animal Lifespan and Reduces Ovarian Cancer Severity by Toxically Augmenting One-Carbon Metabolism. Molecules 2021, 26, 5674. https://0-doi-org.brum.beds.ac.uk/10.3390/molecules26185674
Weston WC, Hales KH, Hales DB. Flaxseed Increases Animal Lifespan and Reduces Ovarian Cancer Severity by Toxically Augmenting One-Carbon Metabolism. Molecules. 2021; 26(18):5674. https://0-doi-org.brum.beds.ac.uk/10.3390/molecules26185674
Chicago/Turabian StyleWeston, William C., Karen H. Hales, and Dale B. Hales. 2021. "Flaxseed Increases Animal Lifespan and Reduces Ovarian Cancer Severity by Toxically Augmenting One-Carbon Metabolism" Molecules 26, no. 18: 5674. https://0-doi-org.brum.beds.ac.uk/10.3390/molecules26185674