Evaluation of Fluorescent Cu2+ Probes: Instant Sensing, Cell Permeable Recognition and Quantitative Detection


School of Pharmacy, Xi’an Medical University, Xi’an 710021, China
*
Author to whom correspondence should be addressed.
Molecules 2021, 26(2), 512; https://0-doi-org.brum.beds.ac.uk/10.3390/molecules26020512
Submission received: 30 November 2020
/
Revised: 15 January 2021
/
Accepted: 15 January 2021
/
Published: 19 January 2021
(This article belongs to the Special Issue Fluorescent Probes in Pharmaceutical and Drug Design Applications: Quantum Chemistry-Based Design, Synthesis, Photophysical and Chemical Properties, Biological Applications)
Abstract
:By incorporating a rhodamine spirolactam structure as the recognition site for Cu2+, two novel probes were synthesized through a connection of rhodamine 6G acylhydrazine and 5-formyl-6-hydroxyl-4-methylcoumarin/2,4-dihydroxybenzaldehyde. In the recognition process of probes towards Cu2+, the spirolactam ring exhibited opening and closing, accompanying an instant and specific change in fluorescence and in color, which could also achieve a naked-eye and semiquantitative recognition of aqueous Cu2+ besides the fluorescent Cu2+ detection method. Fluorescent analyses and ECV304 cell imaging further revealed the probes’ good optical stability, instant response, low toxicity, and membrane permeability, which offers future possibilities for the probes’ instant detection and the real-time tracking of Cu2+ in biological systems.
1. Introduction
As an abundantly existing element with the highest concentration occurring in the brain [1], copper [2,3] is an active participant in the human body and its abnormal changes have been proven to be connected with a number of neurodegenerative diseases [4,5]. On the one hand, there are commonly coexisting oxidation states of cuprous and copper ions in the biological systems, on the other hand, there are a variety of complex changes of copper, including the distribution, storage, and transportation, thus, if out of order [6], the dynamic changes of copper would induce abnormal accumulation or uncontrolled oxidation-reduction reactions [7], then disrupt the natural balance or trigger chain reactions, finally result in neurodegenerative diseases like Alzheimer’s and Parkinson’s Diseases [8]. In order to better understand the dynamic changes of copper, increasing copper-detecting techniques, especially those that could efficiently distinguish cuprous ions from copper ones without sample damages, need to be developed.
With numerous Cu2+-detecting methods [9,10] having been developed, the fluorescent probe method has been receiving much attention for the probes’ characteristics, such as tangible fluorescent signals [11] and instant responses to the target [12,13]. Especially, Cu2+ probes of rhodamine spirolactam-type, outstand for their remarkable copper ions assessment and specific color changes accompanied the recognition process. From the pioneering studies of rhodamine Cu2+ probes by A. Czarnik [14], to D. Wu [15] and P. Li [16], until recent research works by C. Liu [17] and M. Tian [18], increasing efforts were made to solve the remained problems in practical Cu2+ detections, such as enhancing the probes’ sensitivity and selectivity [19] towards Cu2+ in complex environments or biological systems, enforcing the probes’ long-wavelength excitation and emission characteristics [20] to avoid biological interferences, increasing the probes’ solubilities [15] and affinities [21], and so on.
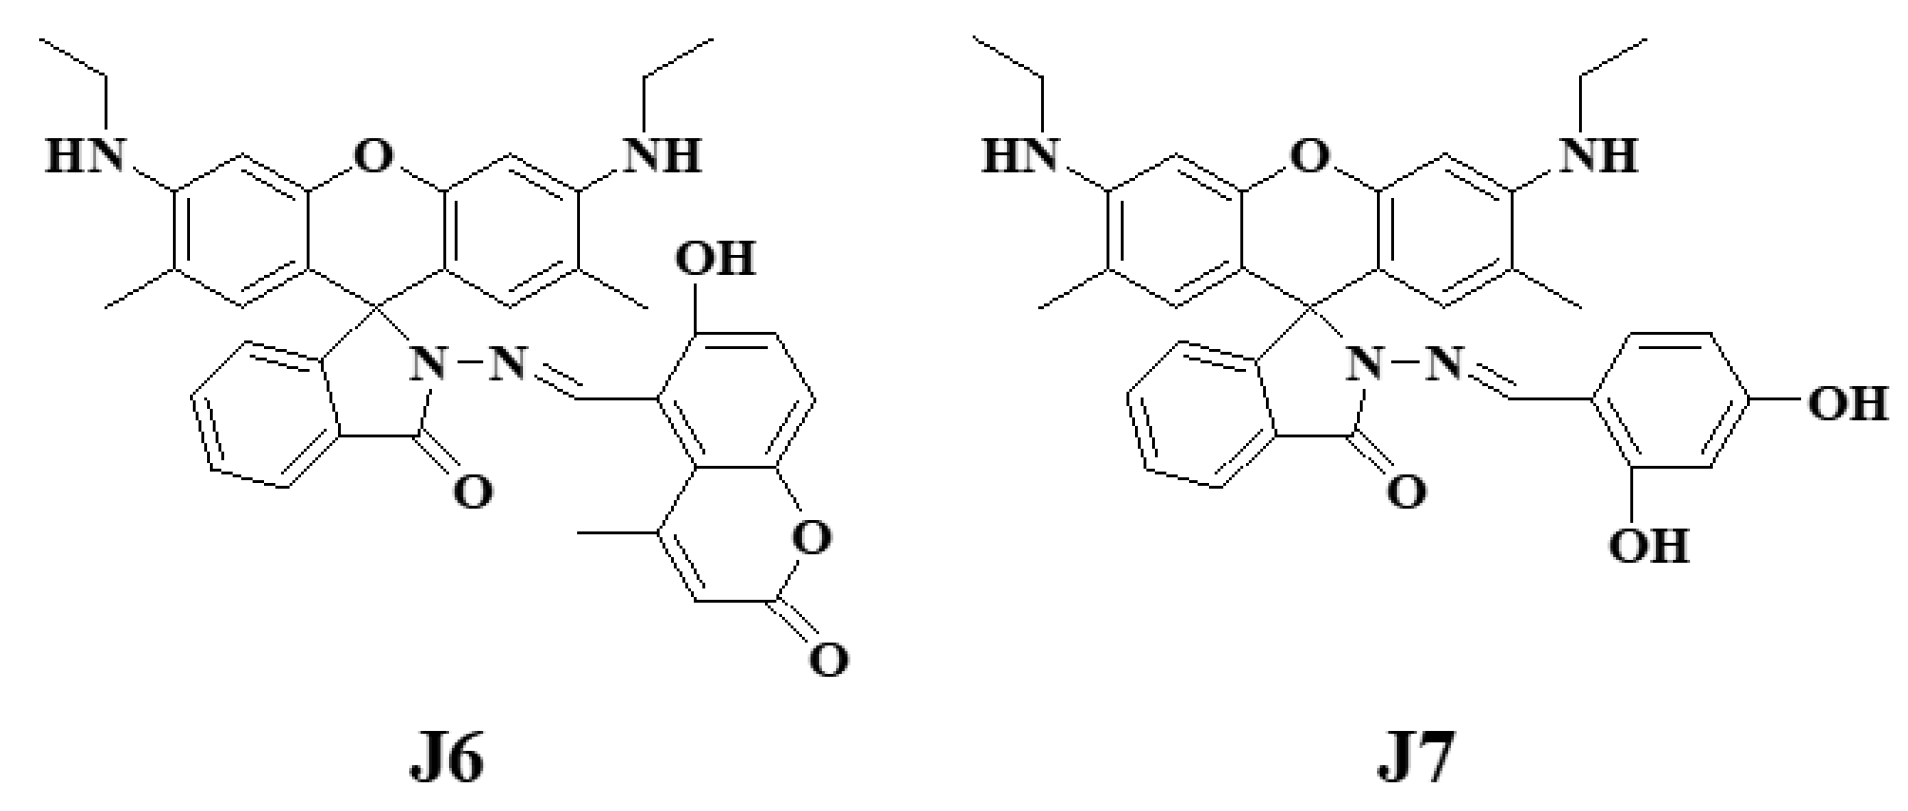
Accordingly, two novel Cu2+ probes were synthesized through a connection of rhodamine 6G moiety to a coumarin derivative (to obtain probe J6) and to a salicylaldehyde derivative (to obtain J7), respectively (Figure 1). The probes demonstrated specific responses to Cu2+ over other metals (Cu+ included) with remarkable spectral changes in both aqueous solutions and living cells. Apart from the highly qualitative Cu2+ detection, the synthesized two probes possessed good quantitative relationship and steady combination with Cu2+ in a relatively wide concentration range, not only at different pH values, but in time-lapse environments. Their good qualitative and quantitative relationships offer the probes a practical value for instant detection and time-lapse tracking of intracellular Cu2+ in biological systems. Additionally, semiquantitative Cu2+ test paper was prepared based on the probes’ naked-eye recognition characteristics, giving us a quick and convenient Cu2+ colorimetric method.
2. Results
2.1. Structure Characterization
By introducing coumarin and salicylaldehyde derivatives to a rhodamine 6G moiety, two novel fluorescent probes J6 and J7 for Cu2+ were synthesized. The structures of J6 and J7 were characterized by IR, 1H NMR and MS. The calculation and measurement results of MS were all matched, 1H NMR chemical shifts were in accordance with the target structures, and the characteristic absorbance peaks of newly synthesized functional groups C=O and C=N, both located at the spirolactam ring, were at the reasonable ranges of ~1700 and 1600~1620 cm−1 in IR spectra.
2.2. Metal Ion Selectivity
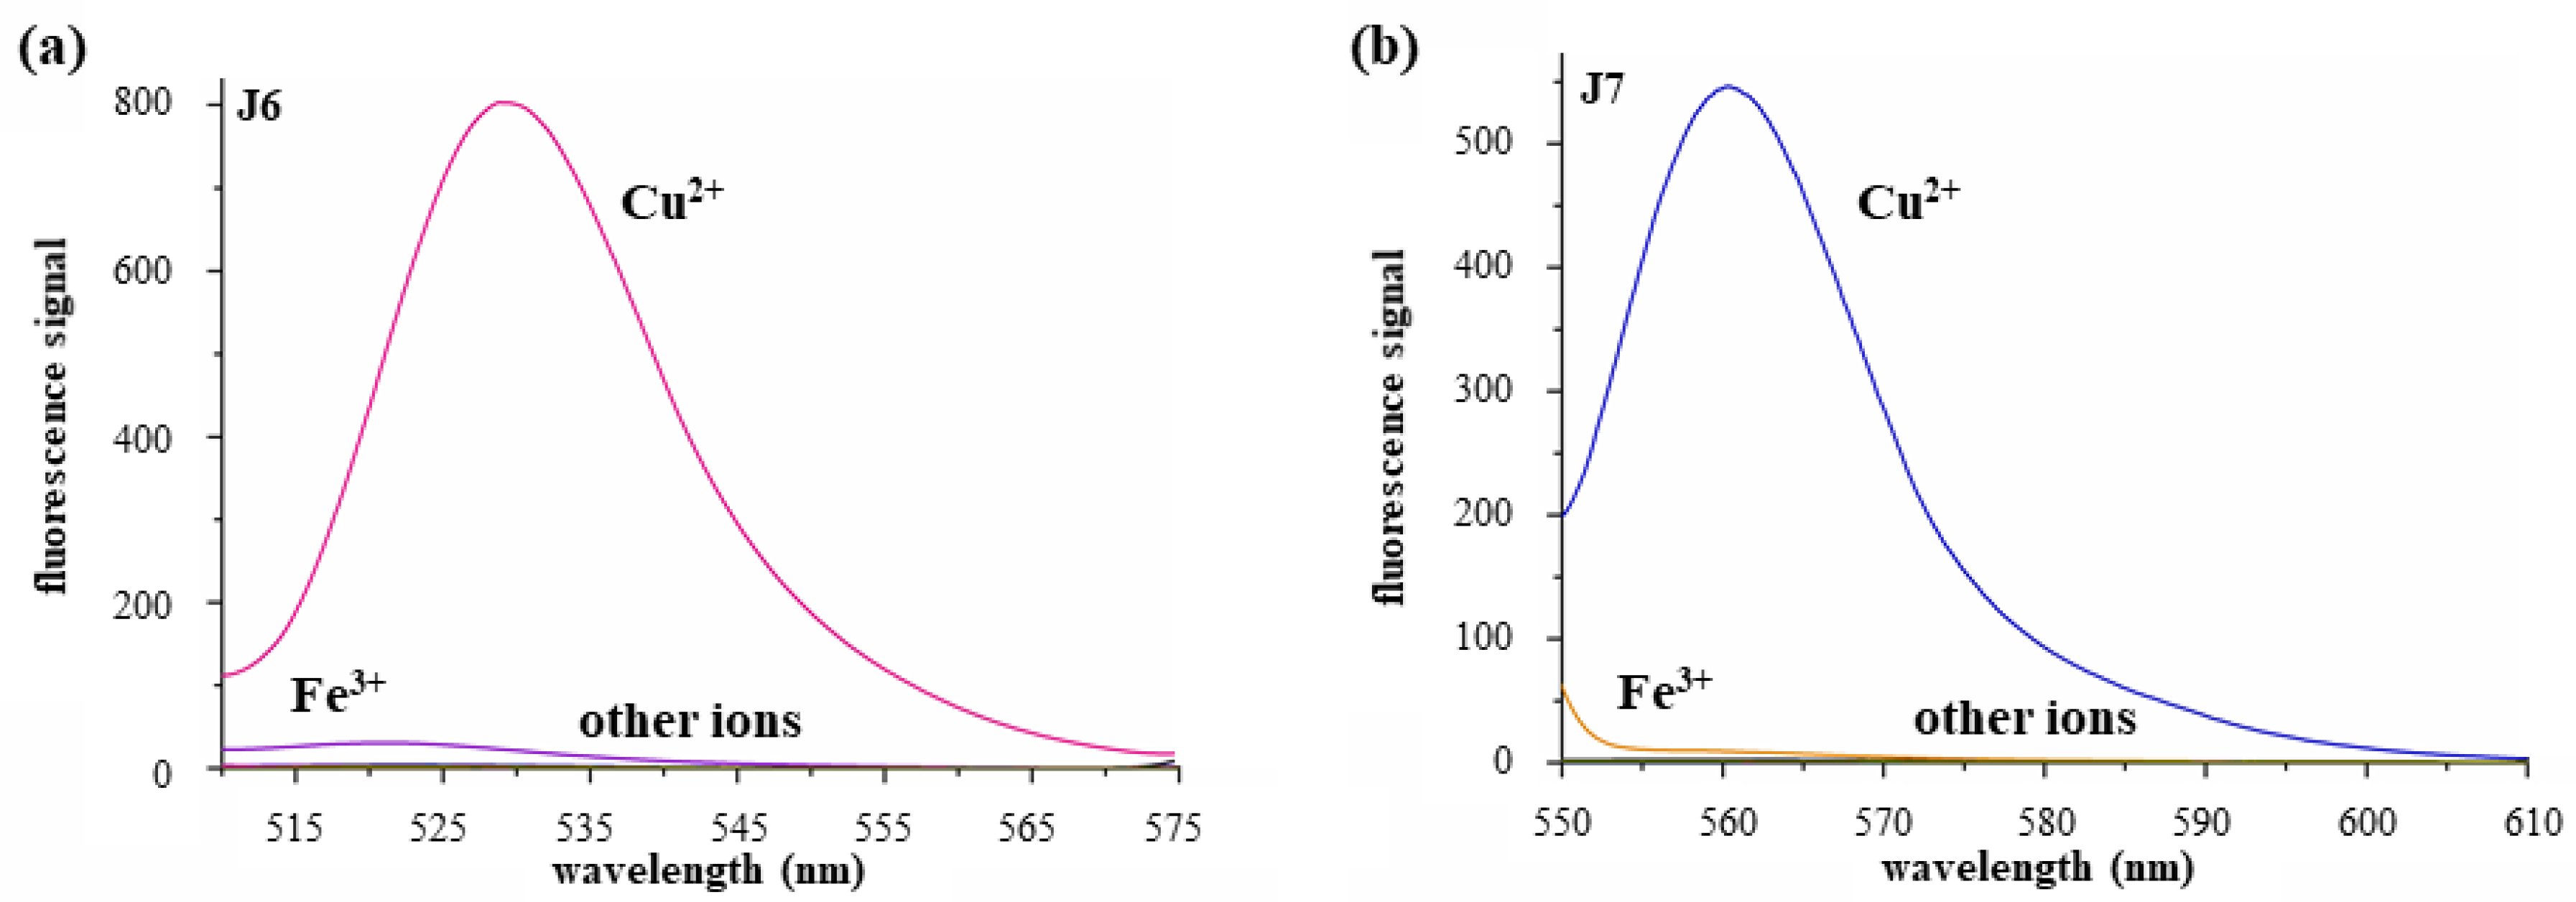
In biological systems, the complex coexistence of multiple ions is making the task of a specific detection on the target ion much more difficult. And high selectivity has been therefore becoming a very important evaluation parameter concerning the probes’ performance. By incorporating the spirolactam ring with an opening and closing transformation, the synthesized rhodamine probes J6 and J7 showed highly critical responses towards Cu2+. When excited by the wavelength of 470 nm, neither probe J6 itself nor the coexistence of J6 and other ions except Cu2+ displayed obvious fluorescence emission at 529 nm, indicating a predominantly closed spirolactam form in J6. Otherwise, the addition of Cu2+ could immediately trigger a significant fluorescence intensity enhancement at 529 nm (Figure 2a), only with a relatively low interference coming from Fe3+, which suggested the opening of initially closed spirolactam ring in the recognition process of J6 to Cu2+. A similar phenomenon was observed in J7 and the fluorescence increase of J7-Cu2+ emerged at 560 nm when excited by 507 nm (Figure 2b).
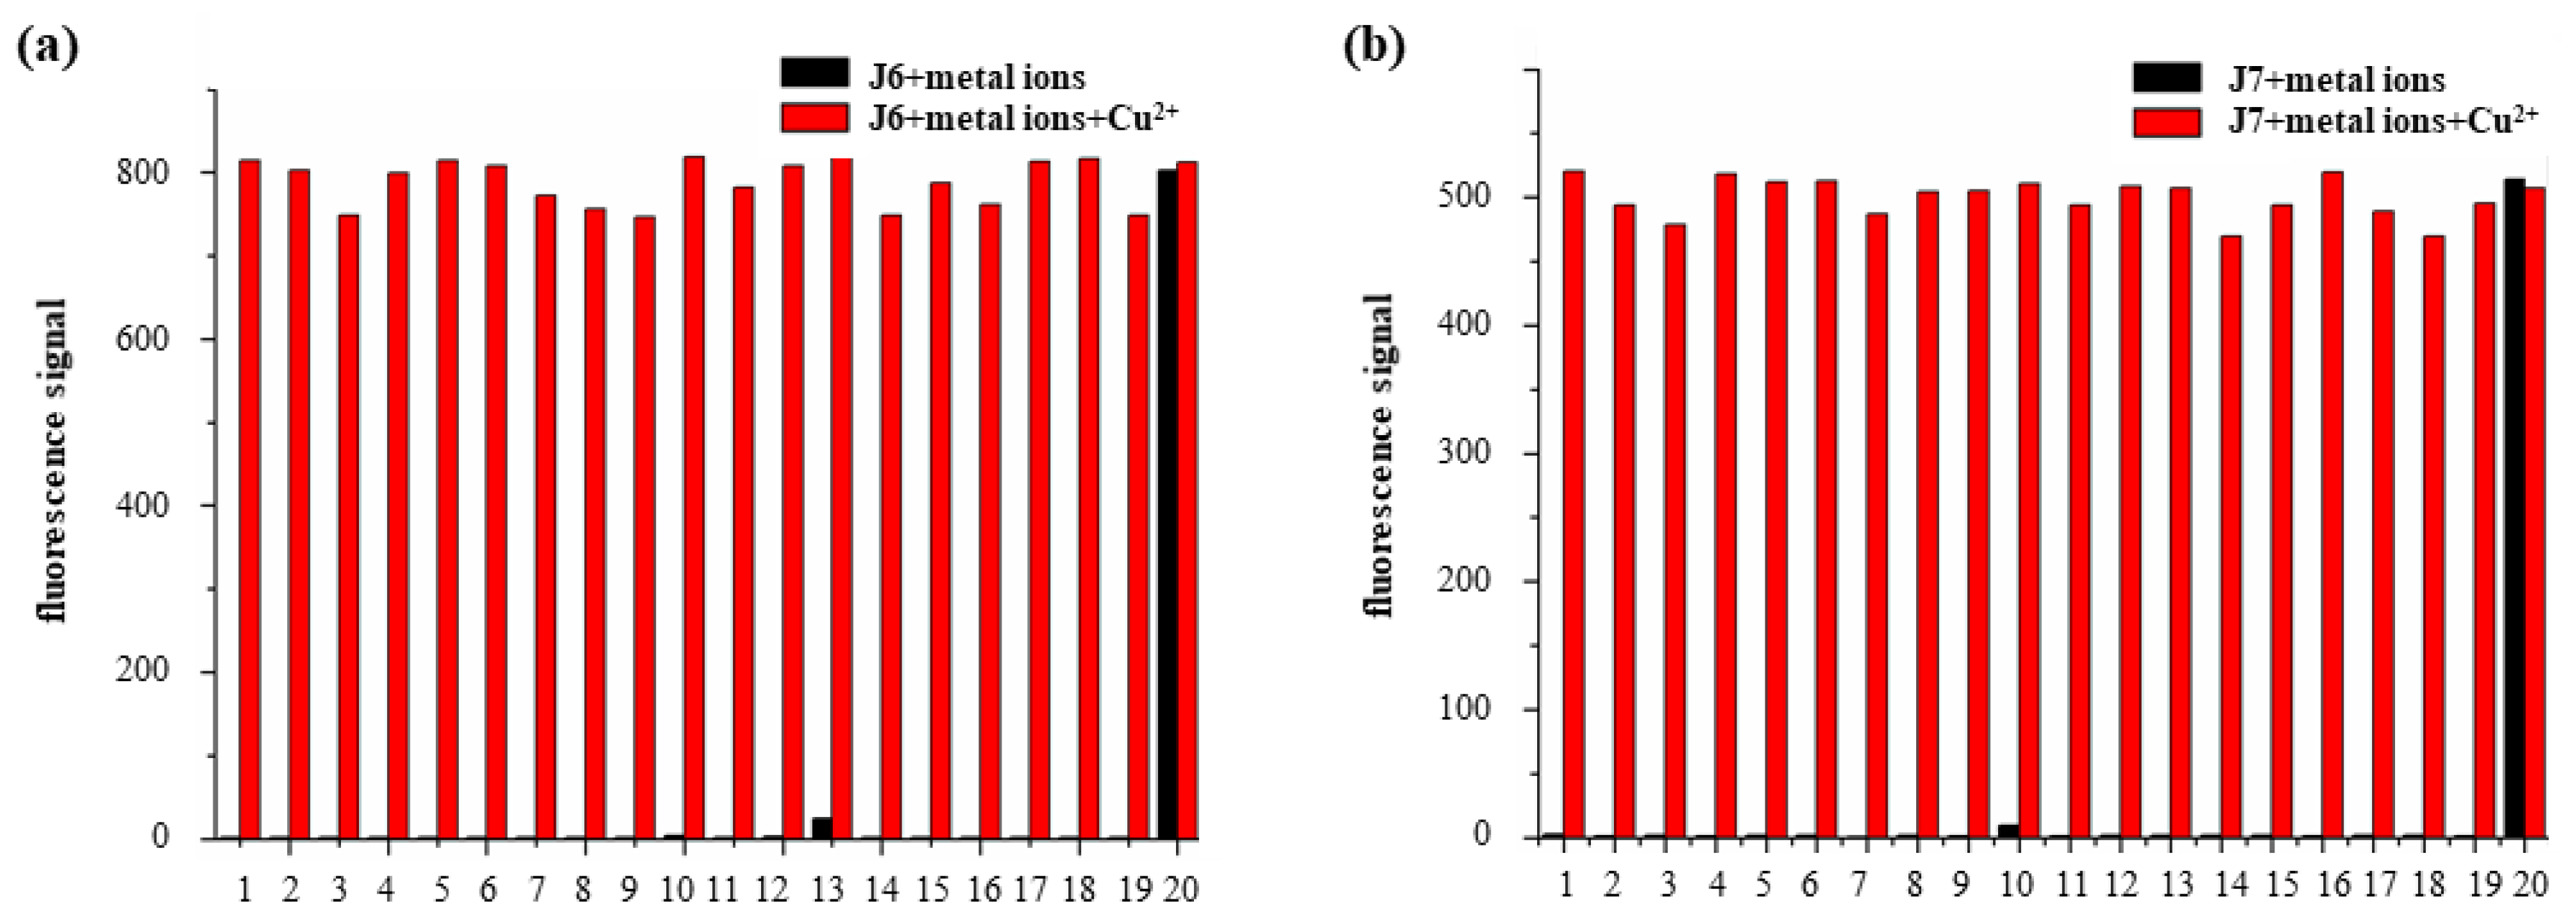
In the presence of other metal ions, experiments on ions competition were conducted by adding Cu2+ to the solution of probe J6 (J6: 10 μmol L−1, metal ions: 10 μmol L−1) at an excited wavelength of 470 nm. The spectral enhancement induced by Cu2+ at 529 nm, evidently, was almost not affected by the presence of other metal ions (Figure 3a). The ions competition tests indicated that probe J6 was highly sensitive towards Cu2+ and provide a future use of J6 for Cu2+ detection in complex environments. Similar phenomena were observed at 560 nm for J7 when excited by 507 nm (Figure 3b).
2.3. Visual Detection of Copper Ions
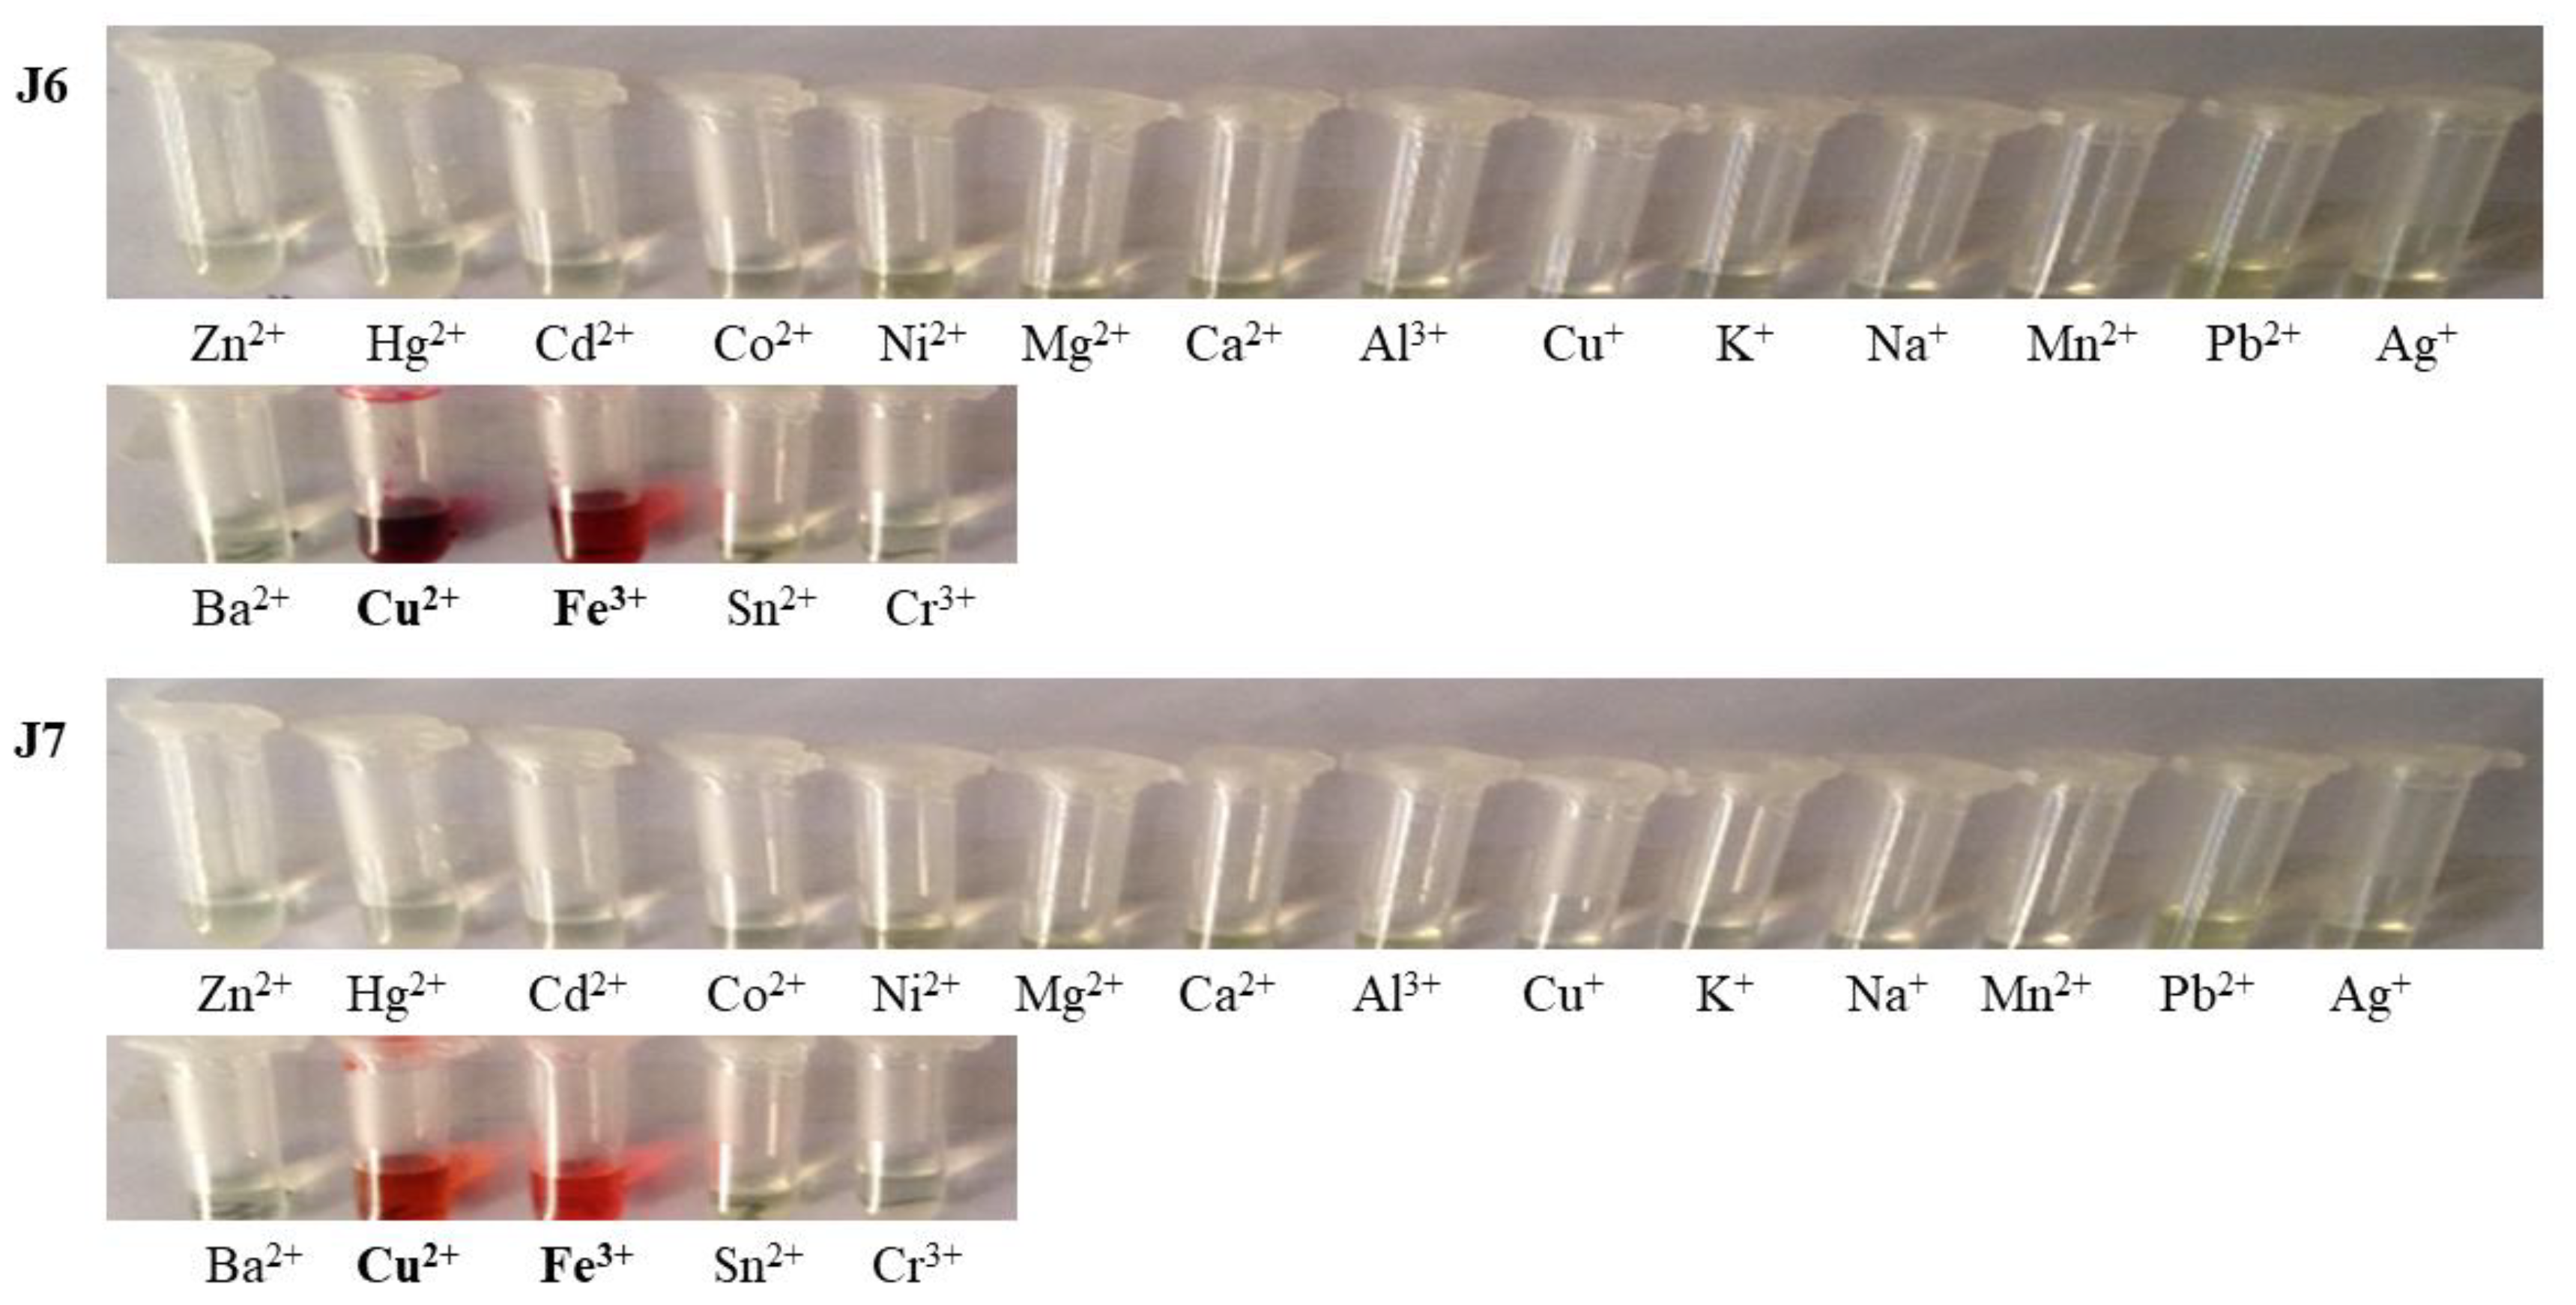
During the detections of Cu2+ by J6/J7, a significant color change, accompanying the fluorescence enhancement, emerged immediately upon the adding of Cu2+ to the probe, with low interferences of Fe3+. Instead, other metal ions’ addition did not induce any color changes (Figure 4).
Before and after Cu2+ addition, the J6/J7 solution exhibited an obvious and rhodamine-characteristic color change from colorless J6/J7 to the rhodamine red with an open spirolactam ring in J6/J7-Cu2+, which implied that J6/J7 showed a high selectivity for Cu2+ and could serve as “naked-eye” probes.
2.4. Quantitative Detection of Copper Ions
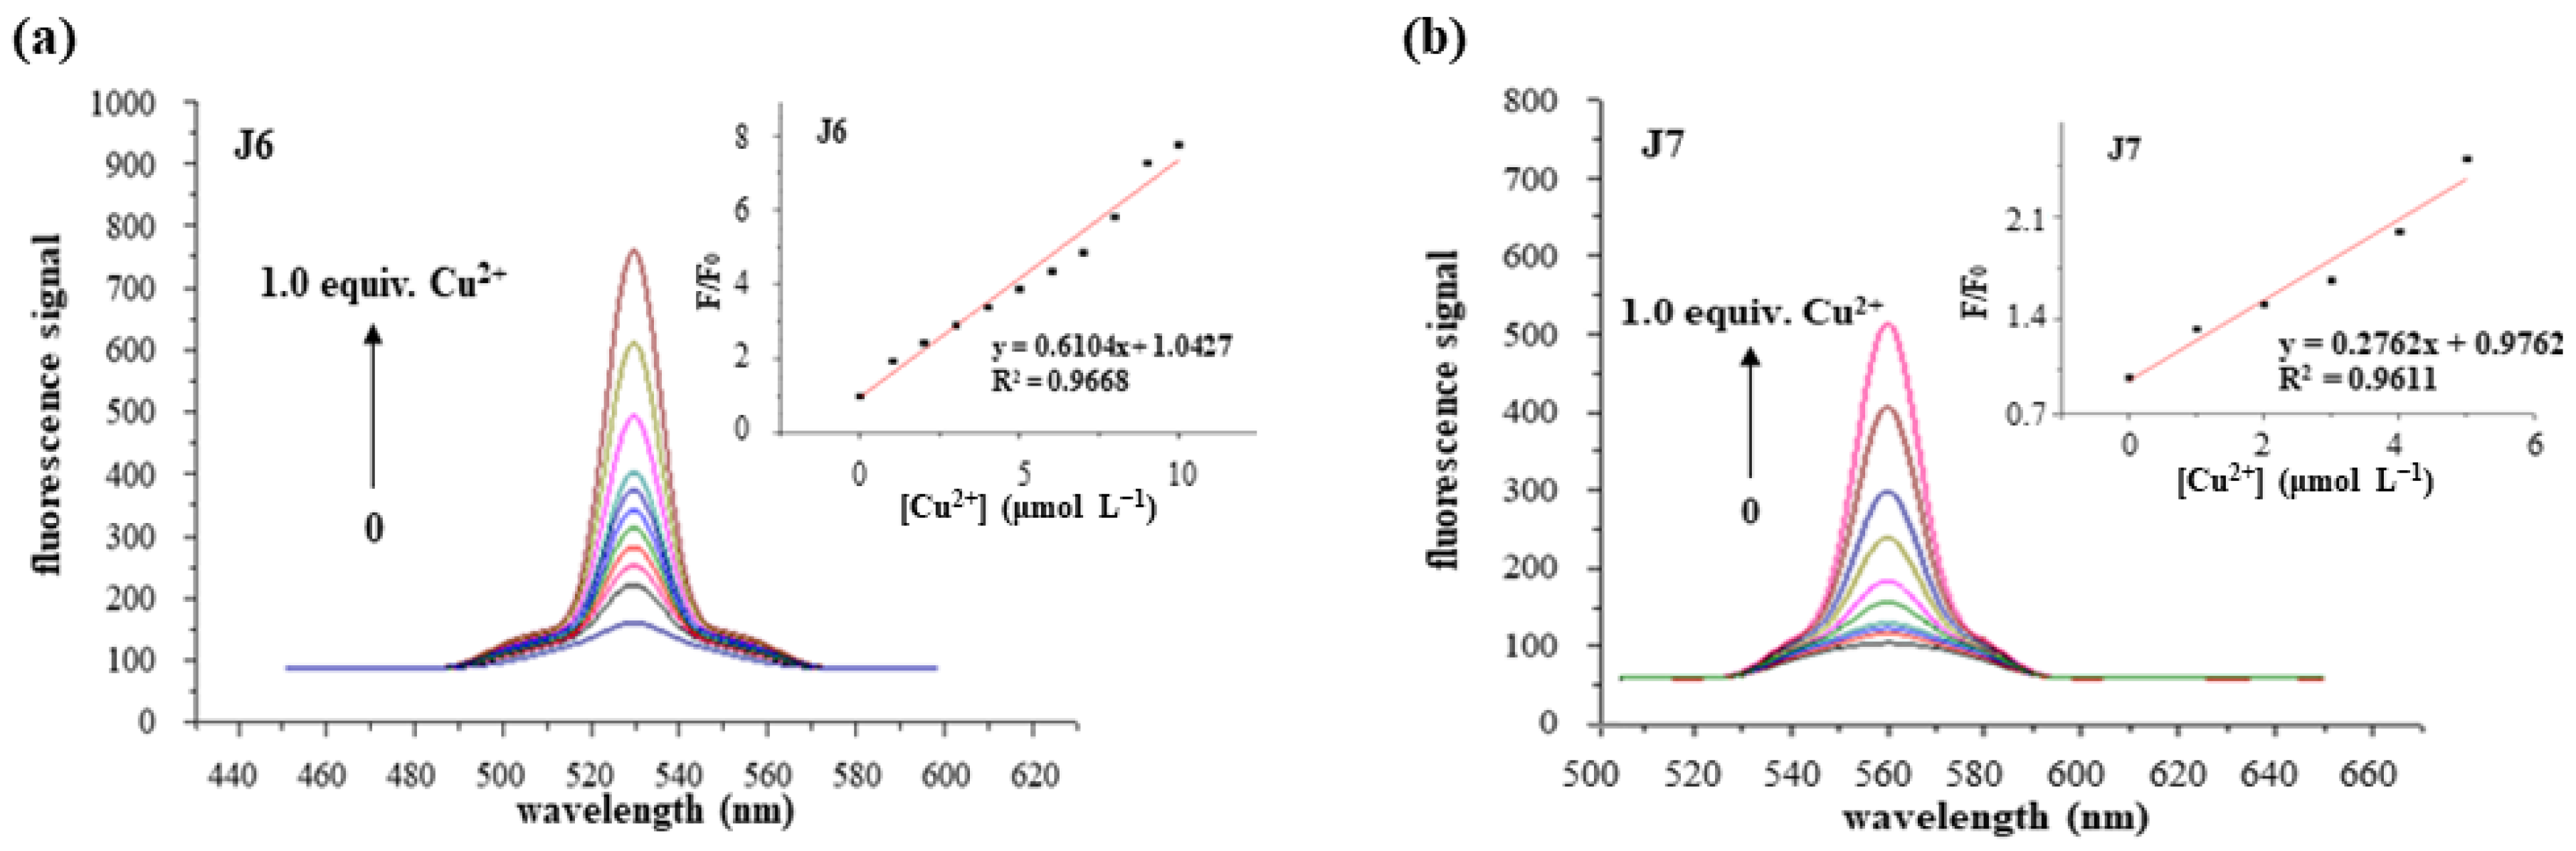
To analyze the quantitative relationship of J6/J7 and Cu2+, fluorescence titration was performed. As shown in Figure 5a of J6 and Figure 5b of J7, probe J6 itself with a predominant spirolactam form displayed nearly no fluorescence at 529 nm, while addition of Cu2+ immediately induced opening of the initially closed rhodamine-spirolactam ring, accompanied by a significant fluorescence enhancement at 529 nm. To furtherly analyze the 529 nm fluorescence intensity of J6-Cu2+ system, a linear relationship between fluorescence intensity and concentration of Cu2+ was obtained, indicating a highly quantitative detection of Cu2+ by J6 in the concentration range of 0~10 μmol L−1 Cu2+ (Figure 5a, inset). The linear response of fluorescence emission intensity at 529 nm towards [Cu2+] in the range of 0~10 μmol L−1 could be expressed by the following Stern-Volmer Equation [22,23] through an analysis on the relationship of F/F0 (F: fluorescence intensity of the probe-Cu2+ system, F0: fluorescence intensity of the probe) versus [Cu2+]: y = 0.6104x+1.0427 (R2 = 0.9668). The association constant was Ka = 1.64 × 10⁶ L mol−1, and the corresponding detection limit of Cu2+ by J6 was calculated to be 0.592 μmol L−1.
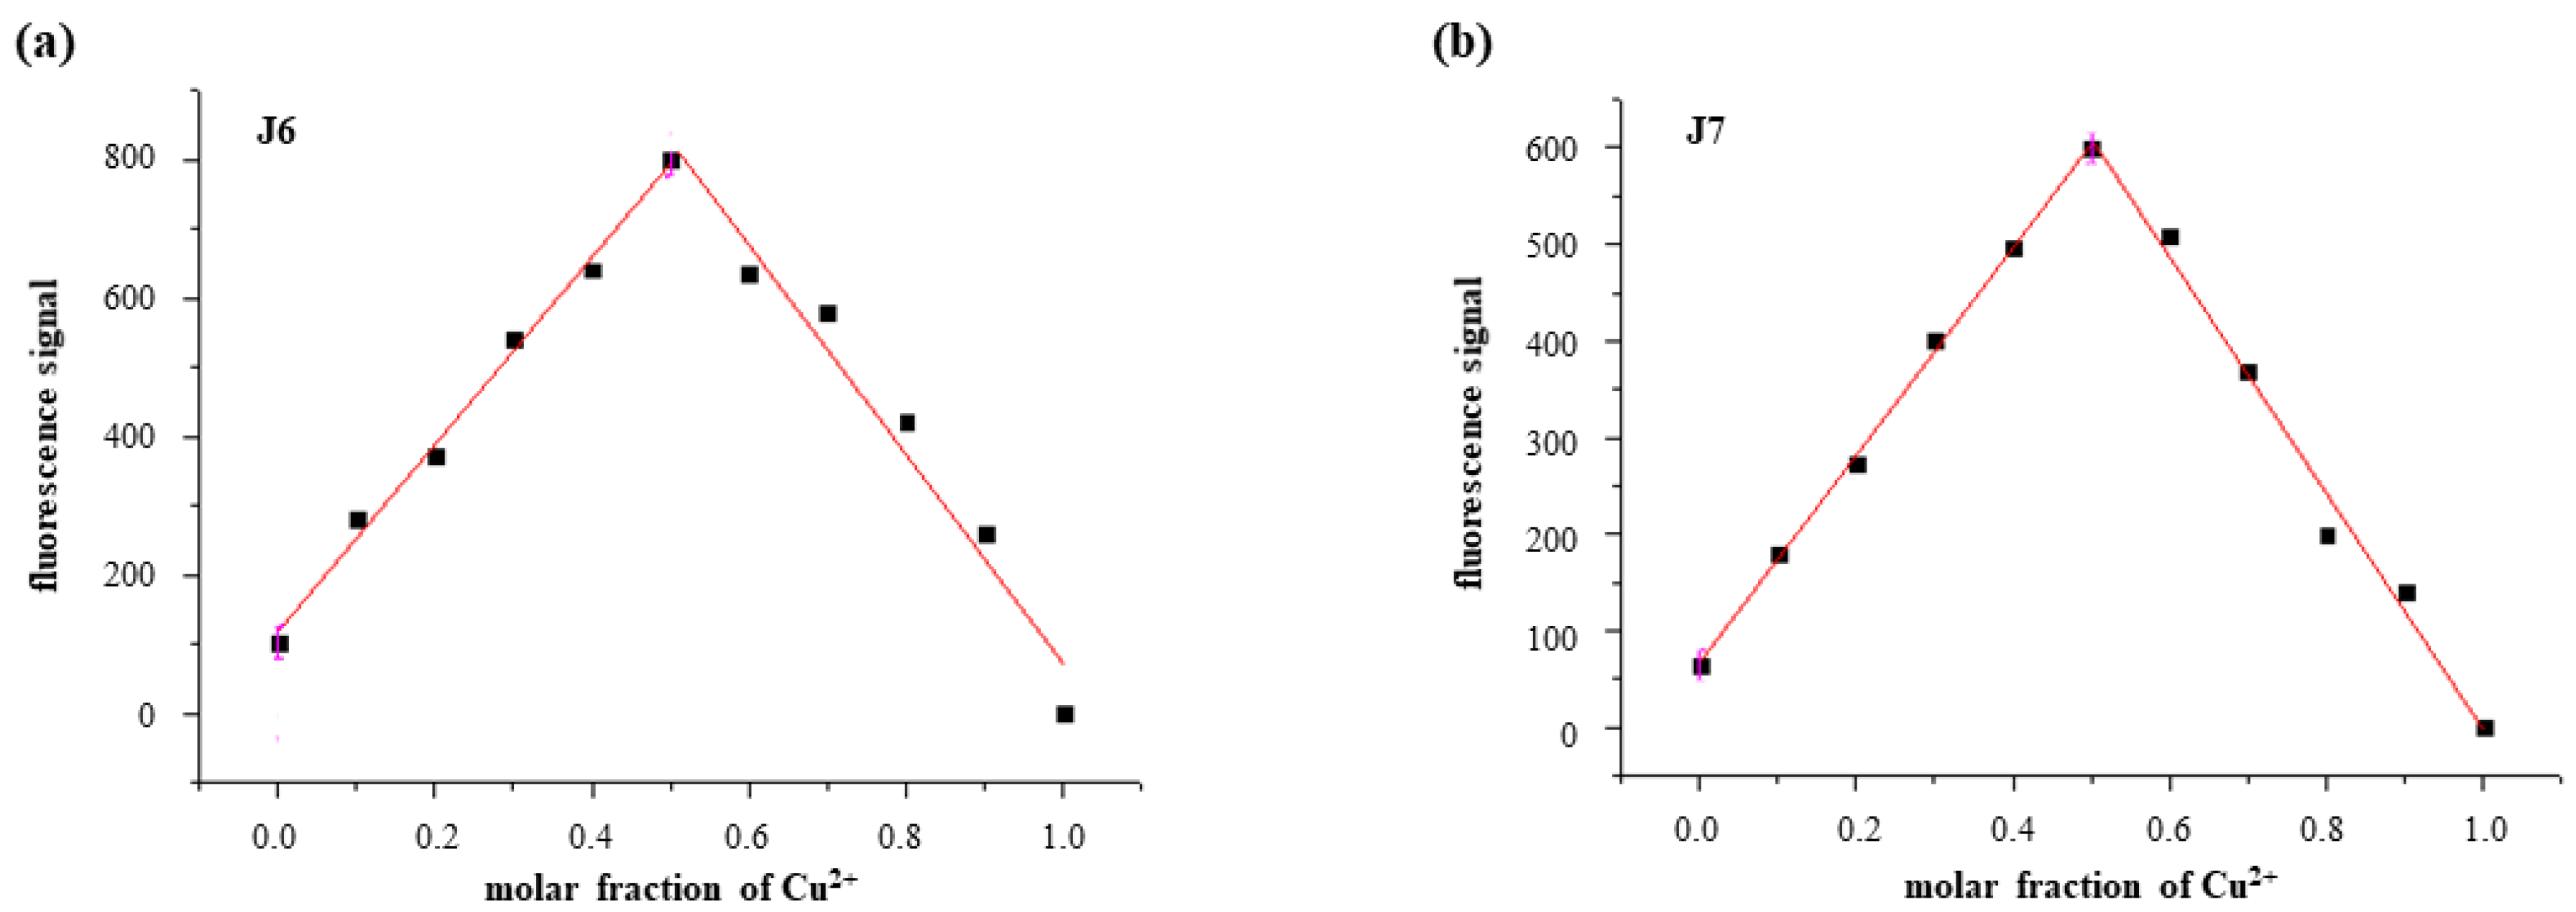
A stoichiometry calculation was performed to better understand the probes’ sensitivity, indicating a 1:1 stoichiometry between J6 and Cu2+ was adopted, as shown in Figure 6a.
As for J7, the linear relationship at 560 nm towards [Cu2+] in the range of 0~6 μmol L−1 (Figure 5b, inset) based on Stern-Volmer Equation could be expressed as y = 0.2762x + 0.9762 (R2 = 0.9611), with a Cu2+ detection limit of 0.977 μmol L−1 and the association constant Ka as 3.62 × 10⁶ L mol−1, also demonstrating 1:1 association stoichiometry between J7 and Cu2+ (Figure 6b).
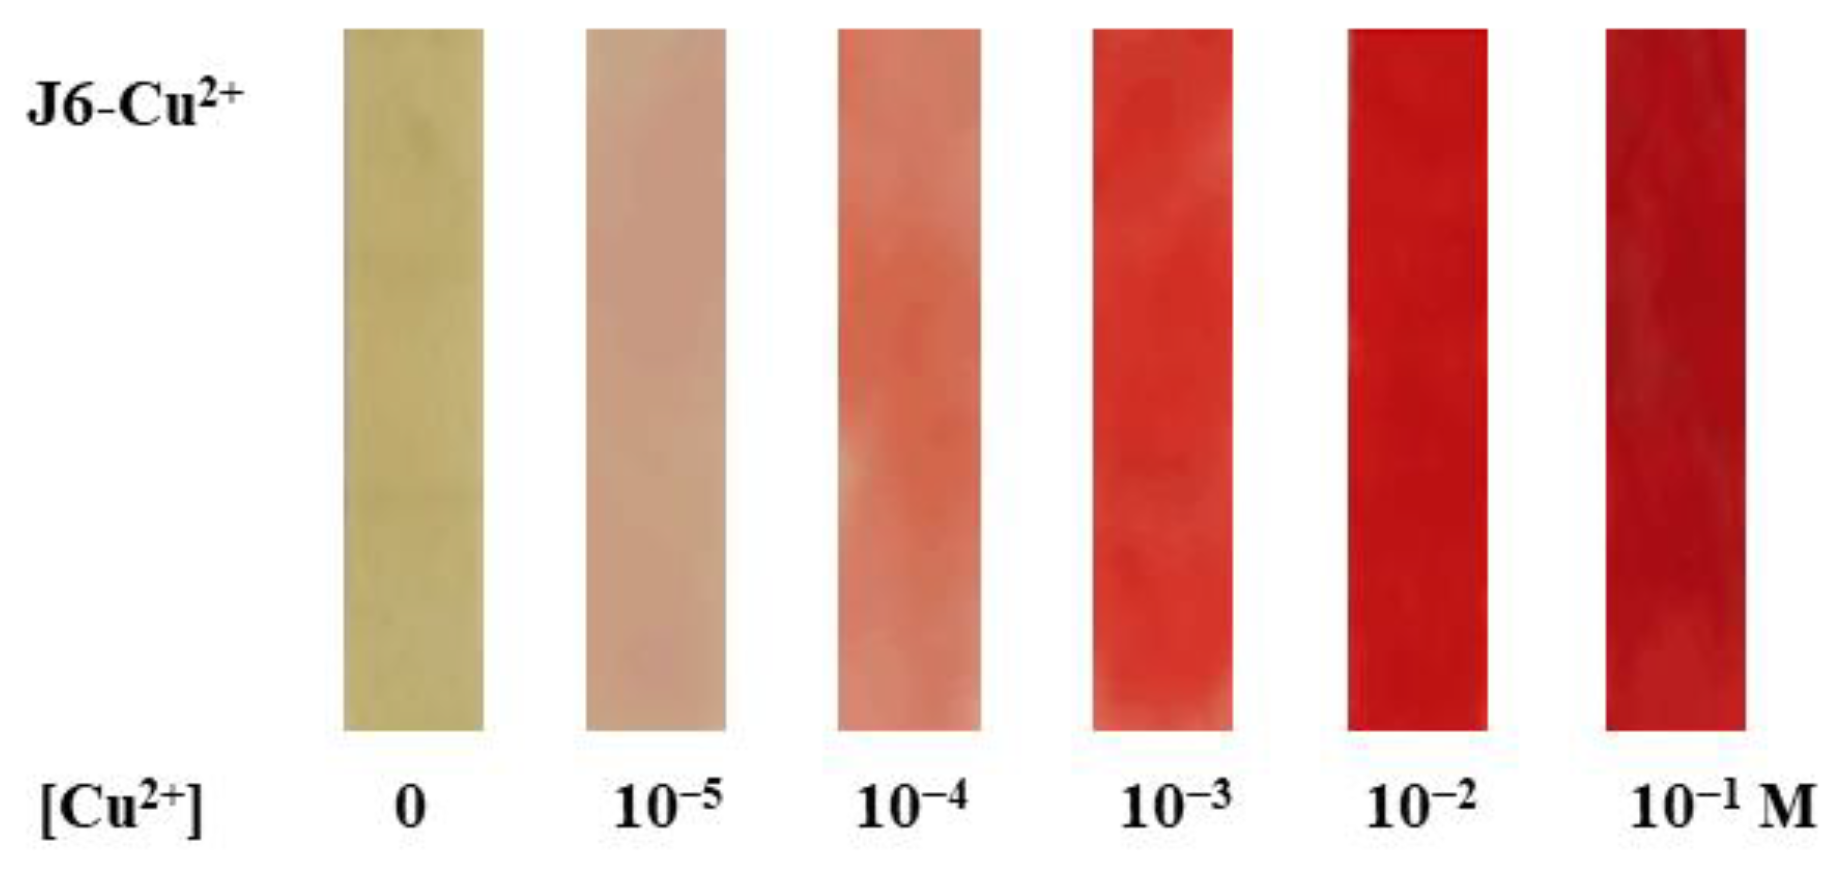
A semiquantitative test paper was prepared for a compatible detection of Cu2+, the characteristic rhodamine red of an opening spirolactam ring exhibited a positive correlation with [Cu2+] through gradient color changes (Figure 7), which could be distinguished by the naked eye, affording a quick and convenient Cu2+ semiquantitative colorimetric method.
2.5. Influences of pH and Time on the Detection of Copper Ions
Considering the complex environment in biological applications of the probes, the fluorescence stability at physiological pH [24] was examined. At a varied pH region of 5.4 to 7.4, fluorescence intensity of both the J6/J7 and J6/J7-Cu2+ systems kept steady (Figure S1), suggesting a relatively wide pH range from 5.4 to 7.4 appropriate for J6/J7-Cu2+ combination system.
As for time influence on the fluorescence intensity of probe-Cu2+ system, the J6/J7-Cu2+ remained steady for hours (Figure S2), indicating a possible time-lapse imaging application apart from an instant fluorescence imaging.
2.6. MTT Assay
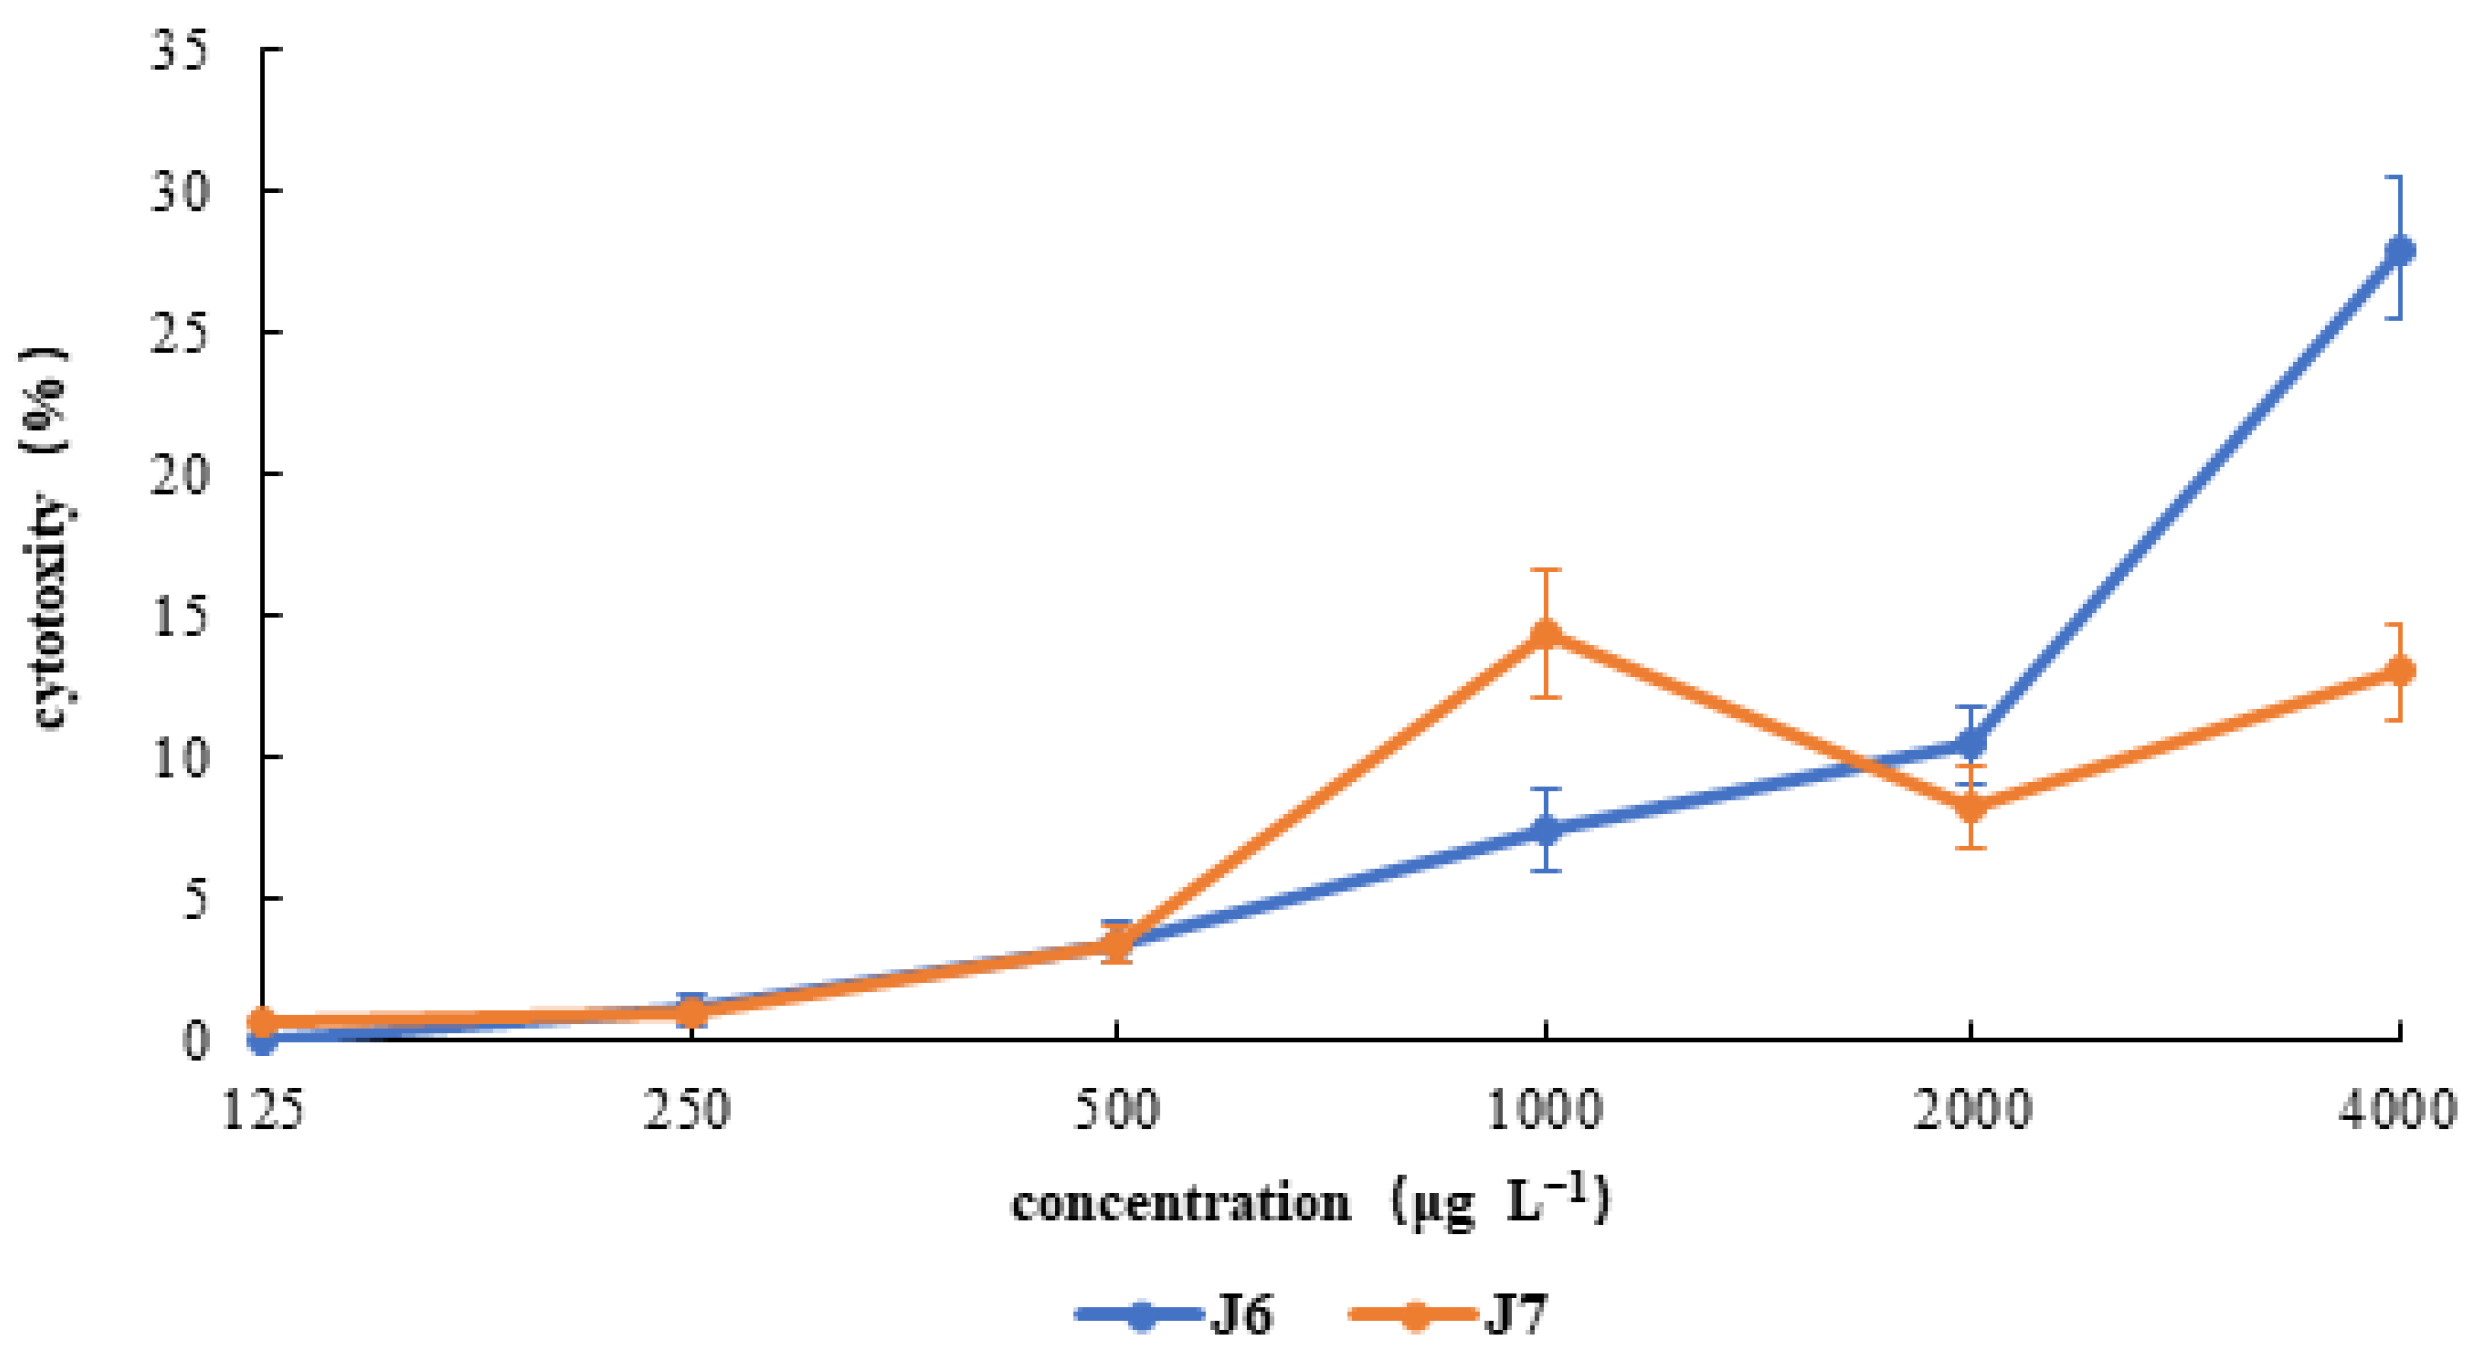
To evaluate the potential imaging and diagnostic applications [15] of the two probes J6 and J7, MTT assay was performed in ECV304 cells with a concentration gradient of 125, 250, 500, 1000, 2000 and 4000 μg L−1 for each probe. The cytotoxicity of J6 and J7 in ECV304 cells at 24 h were compiled in Table S1 and depicted in Figure 8, indicating that there was no significant toxic effect of J6 and J7 on ECV304 cells when incubated for 24 h. Even when the concentration of J6/J7 reached the highest 4000 μg L−1 in the assay, the cytotoxicity of ECV304 cells remained below 30%, indicating a relatively low cytotoxicity of J6/J7 in the range of 125~4000 μg L−1, which satisfies the cytotoxicity-concentration demands of μmol L−1 Cu2+ distributions in most biological systems.
2.7. Recognition Mechanism
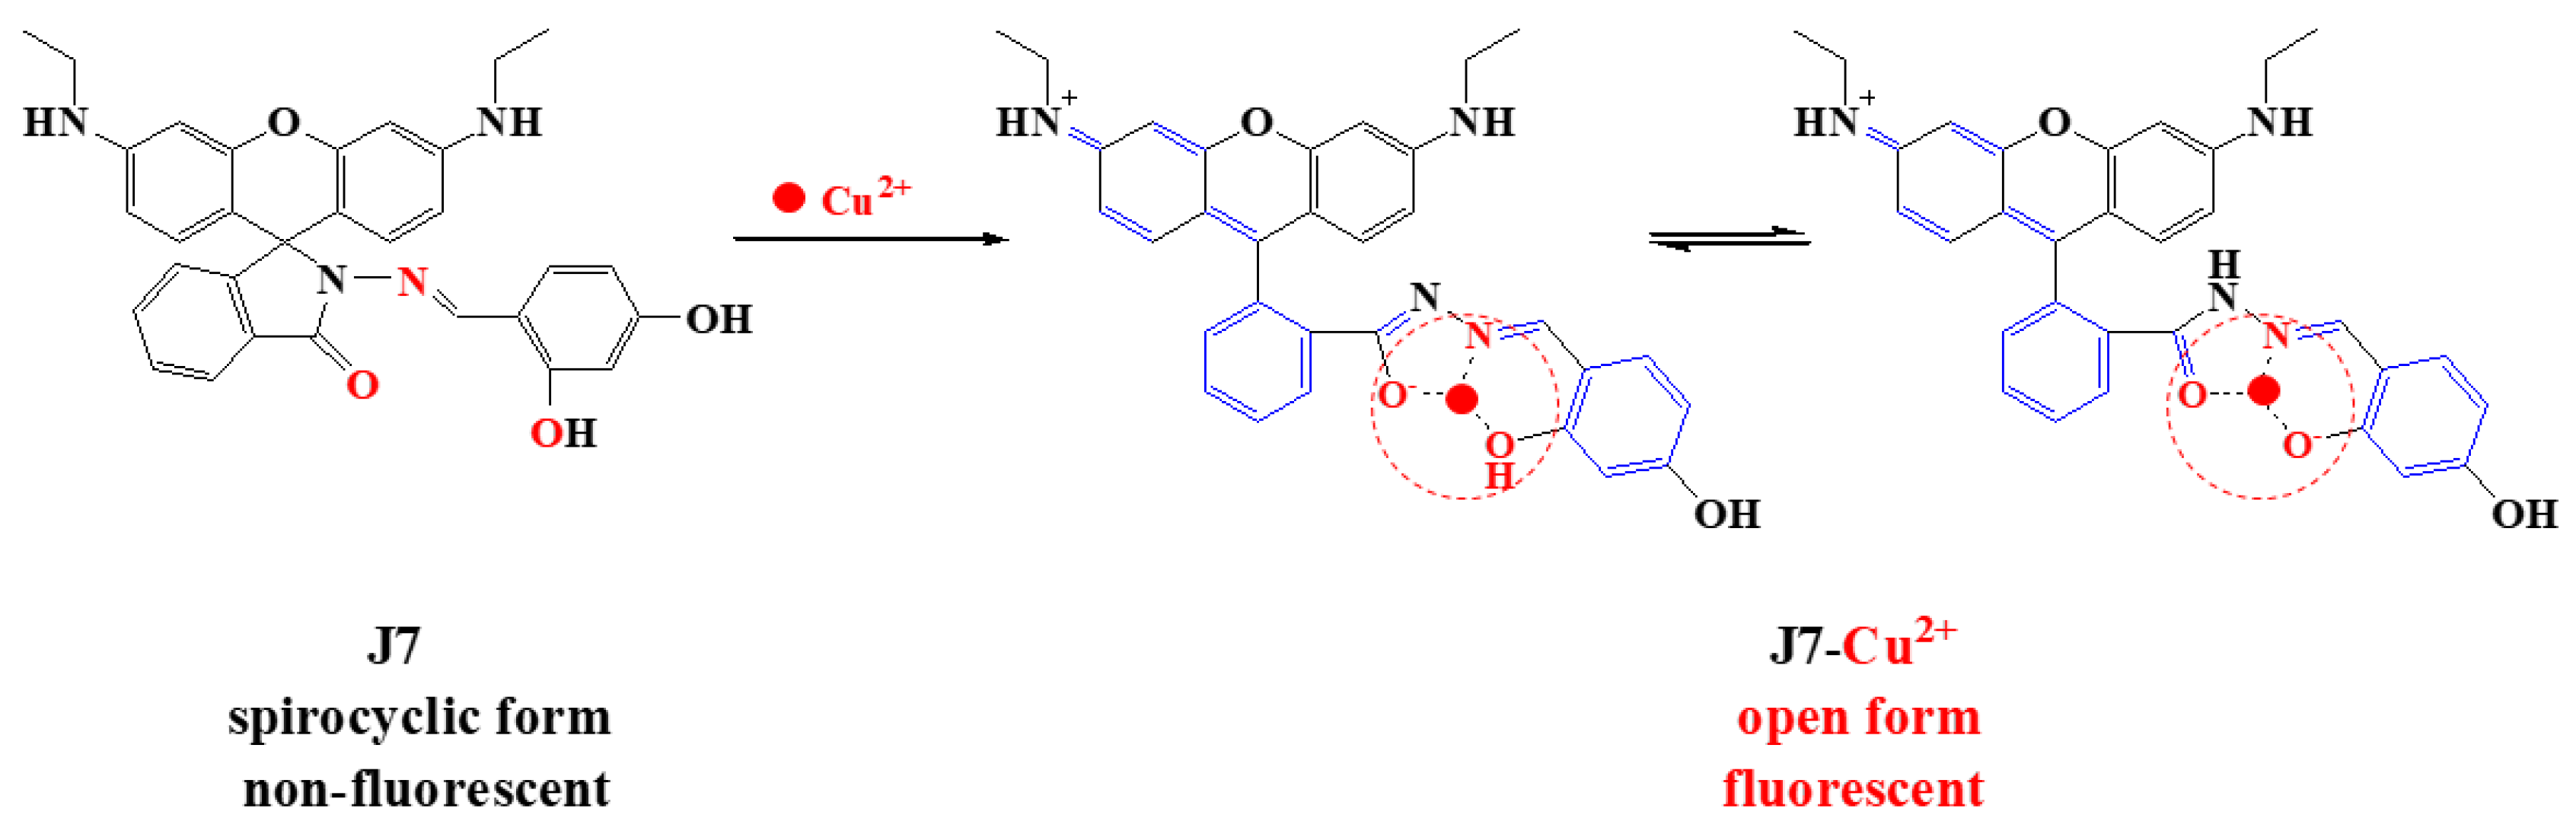
Besides a structural transformation of the spirolactam ring from initially closed to later opening in the recognition process of probe-Cu2+, fluorescence increase at the target emission wavelength could also be attributed to a possible structural cavity [15,25] to capture Cu2+ (Figure 9) and electron effect [26].
In J6/J7, the two oxygen and one nitrogen atoms located around the spirolactam ring, with higher nucleophilic activity towards Cu2+, probably act as the recognition sites to capture target Cu2+. When the spirolactam ring opens and thus the three atoms form an appropriate cavity to hold Cu2+, then the unbonding electron pairs of the two oxygen and one nitrogen atoms will partly be provided to fulfill the empty electron orbits of Cu2+ through intramolecular forces [27,28], though weaker than coordination bonds, an obvious electron transfer [29] will then be established and two chelating five- and six-membered rings formed, which contributes to a better planarity and rigid of the J6/J7-Cu2+ system. And stronger fluorescence intensity of the J6/J7-Cu2+ system accompanied with the extended conjugated chain (the extended conjugation chain was labelled in blue in Figure 9) and better molecular planarity.
Unlike the reaction-based irreversible chemosensors for copper (II), probes J6/J7 bind reversibly to Cu2+ due to their multidentate chelation model [30] in the recognition mechanism and could be better applied to Cu2+ detections in mild-reaction needed biological environments.
2.8. Bioimaging
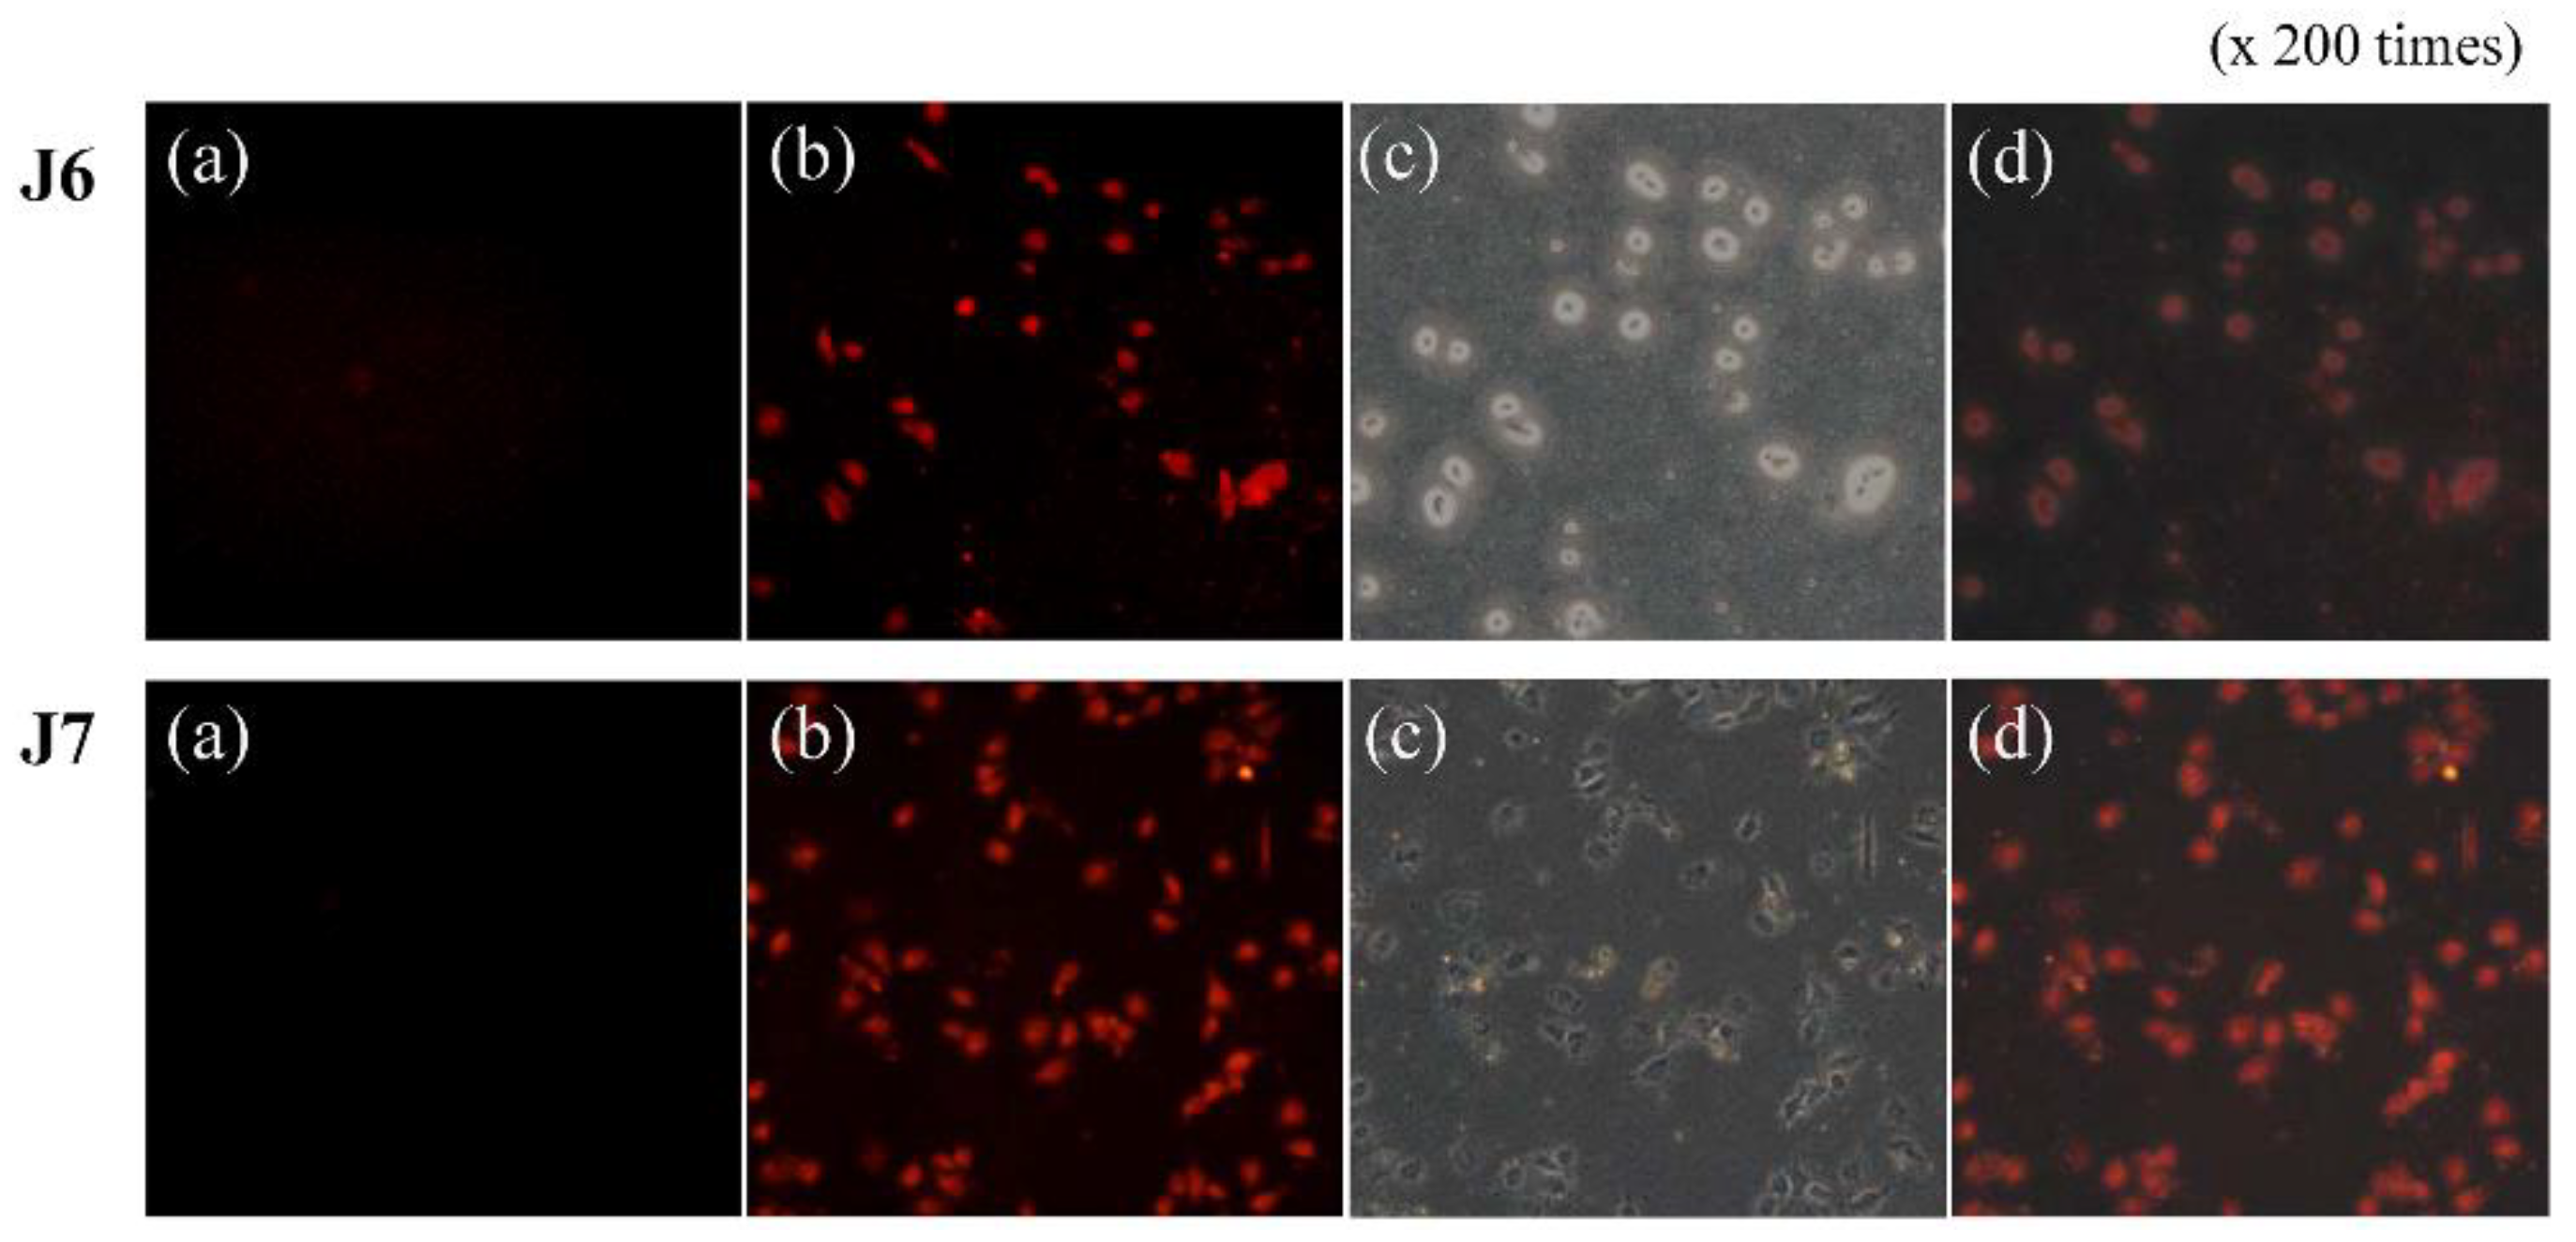
After an initial incubation of ECV304 and J6/J7 (Figure 10a), 10 μmol L−1 Cu2+ was added in, incubated for another 2 h at 37 °C, and red fluorescence was emitted from the intracellular area (Figure 10b) in comparison with Figure 10a, demonstrating the recognition process of added Cu2+ by J6/J7 accomplished almost instantly. The overlay of fluorescence image (Figure 10b) and bright-field transmission image (Figure 10c) revealed that the fluorescence signals were from the cytosol [31,32] (Figure 10d), which indicated the good cell permeability of J6/J7 and the future applications of J6/J7 for dynamic imaging and tracking of Cu2+ in living cells.
3. Discussion
Novel rhodamine-based Cu2+ probes J6 and J7 were synthesized, with their structures characterized by IR, MS, and 1H NMR, and biological applications analyzed by FS, MTT, and bioimaging. J6 and J7 demonstrated high selectivity to Cu2+ over other metal ions and could be used for highly specific recognition of Cu2+ in ions coexisting environment. Accompanying the recognition process was a significant color change, which enabled the “naked-eye” detection of aqueous Cu2+ and was prepared as a compatible and semiquantitative Cu2+ test paper. Further fluorescence titration and stoichiometry revealed the detection limits of Cu2+ by J6/J7 to be 0.592 and 0.977 μmol L−1, although not as good as the 10−8 mol L−1 concentration limit seen in some commercial Cu2+ probes, the LOD value could still satisfy the demands of μmol L−1 Cu2+ distributions in most biological systems. Low cytotoxicity and instant signaling in fluorescence imaging of Cu2+ in living cells ECV304 suggested the probe’s future applications as an instant Cu2+ detection method in clinical diagnosis and a dynamic tracking tool for Cu2+ in biological systems.
4. Materials and Methods
4.1. Materials and Instrumentation
All the reagents and solvents used for synthesis were analytically pure and used without further treatment unless otherwise noted. The ECV304 cells were purchased from KeyGen BioTECH (Nanjing, China). The reaction process was monitored by thin-layer chromatography (TLC) on silica gel GF254. The products were purified by column chromatography on Merck silica gel (250–400 mesh ASTM). A Tris-HCl buffer solution (pH 7.4) was prepared using 0.1 mol L−1 HCl and proper amount of a 0.1 mol L−1 Tris stock solution (Sinopharm Chemical Reagent Company, Shanghai, China). Double distilled water was used throughout the process of solution preparing and spectroscopic testing. Metal ion solutions were prepared from their nitrate and chloride salts, KCl, NaCl, AgNO3, Ca(NO3)2·4H2O, Mg(NO3)2·6H2O, BaCl2, NiCl2, PbCl2, MnCl2, CoCl2, Zn(NO3)2·6H2O, Cd(NO3)2·2H2O, SnCl2, HgCl2, AlCl3, Cr(NO3)3·9H2O, FeCl2, Fe(NO3)3·9H2O, CuCl, and Cu(NO3)2·3H2O, respectively.
Fourier Transform-Infrared (FT-IR) spectra were recorded with KBr pellets on a Bruker EQUINOX-55 FT-IR spectrometer (Karlsruhe, Germany). Elemental Analyses (EA) were recorded on an Elementar varioEL III analyzer. 1H Nuclear Magnetic Resonance (1H NMR) spectra were recorded on a Varian INOVA-400 spectrometer (Palo Alto, CA, USA) at 400 MHz and chemical shifts were reported relative to the internal standard tetramethylsilane (TMS). Fluorescence spectra were recorded on a HITACHI F-4500 fluorescence spectrophotometer (Tokyo, Japan). Mass Spectrometry (MS) analyses were performed using an Agilent 1260-6460A triple quadrupole liquid chromatograph-mass spectrometer (Santa Clara, CA, USA). The cytotoxicity results were analyzed with the SoftMax Pro Software (version 2.2.1) (San Jose, CA, USA) in a Molecular Devices SpectraMax 190 microplate reader (San Jose, CA, USA). The cell-imaging experiments were performed using an OLYMPUS U-LH 100HG IX73 fluorescence microscope.
4.2. Synthesis and Characterization of Probes J6/J7
Target probes J6 and J7 were synthesized in a route shown in Scheme 1. The structures of J6 and J7 were characterized by IR, 1H NMR, and MS.
4.2.1. 6-Hydroxyl-4-Methylcoumarin (Scheme 1a)
With the temperature controlled between 0 and 5 °C in an ice bath, p-benzenediol (5.0 g, 0.045 mol) and ethyl acetoacetate (15 mL, 0.12 mol) were first added to concentrated sulfuric acid (25 mL), then the mixture was kept between 0 and 5 °C and stirred for 24 h, poured into iced water (100 mL), filtered, and subsequently purified by column chromatography (silica gel, V (EtOAc): V (hexane) = 1: 2 as the eluent) to obtain 6-hydroxyl-4-methylcoumarin (a).
6-Hydroxyl-4-methylcoumarin: yellow solid, 5.2 g, yield 75%. IR (KBr pellet, υ/cm−1): 3342 (υ–OH); 1691 (υC=O); 1580 (υC=C); 1443 (σ–OH); 1232 (υC–O–C) (Figure S3). EA: C 68.17%, H 4.55% (calcd. for C10H8O3: C 68.18%, H 4.58%).
4.2.2. 5-Formyl-6-Hydroxyl-4-Methylcoumarin (Scheme 1b)
With the temperature controlled between 0 and 5 °C in an ice bath, 6-hydroxyl-4-methylcoumarin (1.0 g, 5.0 mmol) and hexamethylenetetramine (2.0 g, 10 mmol) were added to trifluoroacetic acid (10 mL), the mixture was then refluxed at 70 °C for 10 h, monitored by TLC, cooled down, concentrated in vacuo, poured into iced water (50 mL), filtered, and subsequently purified by column chromatography (silica gel, V (EtOAc):V (hexane) = 1:2 as the eluent) to afford 5-formyl-6-hydroxyl-4-methylcoumarin (b).
5-Formyl-6-hydroxyl-4-methylcoumarin: yellow powder, 0.82 g, yield 63%. IR (KBr pellet, υ/cm−1): 3423 (υ–OH); 2800, 2700 (υC–H); 1606 (υC=C); 1367 (σ–OH) (Figure S4). EA: C 64.74%, H 3.97% (calcd. for C11H8O4: C 64.71%, H 3.95%).
4.2.3. Rhodamine 6G Acylhydrazine (Scheme 1c)
At r. t., 98% hydrazine hydrate (3.5 mL, 0.069 mol) was added to a 20 mL ethanol solution of rhodamine 6G (3.0 g, 7.2 mmol); after that, the reaction mixture was refluxed at 80 °C for 3 h, monitored by TLC, then cooled down, filtered and washed with anhydrous ethanol, affording rhodamine 6G acylhydrazine (c).
Rhodamine 6G acylhydrazine: pink solid, 0.76 g, yield 75%. IR (KBr pellet, υ/cm−1): 3427 (υ–NH2); 1688 (υC=O); 2926 (υC–H), 1421 (σC–H); 1623, 1516 (υC=C) (Figure S5). EA: C 72.89%, H 6.57%, N 13.08% (calcd. for C26H28N4O2: C 72.87%, H 6.59%, N 13.07%).
4.2.4. Probe J6
The synthesized rhodamine 6G acylhydrazine (0.17 g, 0.40 mmol) and 5-formyl-6-hydroxyl-4-methylcoumarin (0.10 g, 0.50 mmol) in previous steps were dissolved in anhydrous methanol (20 mL) and then refluxed at 65 °C for 1.5 h, monitored by TLC, cooled down, filtered, washed with anhydrous methanol, concentrated in vacuo, and subsequently purified by column chromatography (silica gel, V (EtOAc):V (hexane) = 1:1 as the eluent) to afford J6.
J6: yellow solid, 0.13 g, yield 50%. IR (KBr pellet, υ/cm−1): 3432 (υ–OH); 1726 (υC=O); 1621 (υC=N); 1516 (υC=C); 1422 (σ–OH); 1216 (υC–O–C) (Figure S6). 1H-NMR (400 MHz, CDCl3) δ: 10.89 (s, 2H, 2×–NH–), 8.93 (s, 1H, –OH), 8.06~8.01 (m, 2H, Ar-H), 7.57~7.48 (m, 4H, Ar-H), 7.19~7.14 (m, 2H, Ar-H), 7.03 (s, 2H, Ar-H), 7.01 (s, 2H, 2×=CH–), 2.02 (s, 4H, 2×–CH2–), 1.92 (s, 15H, 5×–CH3) (Figure S7). MS: m/z = 614.29 (calcd. for C37H34N4O5: 614.25) (Figure S8).
4.2.5. Probe J7
Rhodamine 6G acylhydrazine (0.28 g, 0.60 mmol) and 2,4-dihydroxybenzaldehyde (0.12 g, 0.80 mmol) were initially dissolved in anhydrous methanol (20 mL) and then refluxed at 65 °C for 2 h, monitored by TLC, cooled down, filtered, washed with anhydrous methanol, concentrated in vacuo, and subsequently purified by column chromatography (silica gel, V (EtOAc):V (hexane) = 1:1 as the eluent) to afford J7.
J7: pink solid, 0.20 g, yield 47%. IR (KBr pellet, υ/cm−1): 3427, 3404 (υ–OH); 1673 (υC=O); 1624 (υC=N); 1518 (υC=C); 1423 (σOH); 1222 (υC–O–C) (Figure S9). 1H-NMR (400 MHz, CDCl3) δ: 11.07 (s, 2H, 2×–NH–), 9.09 (s, 2H, 2×–OH), 8.00 (dd, J = 5.8, 2.6 Hz, 3H, Ar-H), 7.54~7.48 (m, 4H, Ar-H), 7.13 (dd, J = 5.7, 2.6 Hz, 3H, Ar-H), 6.95 (s, 1H, Ar-H), 6.93 (s, 1H, =CH–), 2.03 (s, 4H, 2×–CH2–), 1.93 (s, 12H, 4×–CH3) (Figure S10). MS: m/z = 548.29 (calcd. for C33H32N4O4: 548.24) (Figure S11).
4.3. Spectroscopic Analysis
Stock solutions (200 μmol L−1) of probe J6/J7, K+, Na+, Ag+, Ca2+, Mg2+, Ba2+, Ni2+, Pb2+, Mn2+, Co2+, Zn2+, Cd2+, Sn2+, Hg2+, Al3+, Cr3+, Fe2+, Fe3+, Cu+ and Cu2+ were prepared in a mixed solvent system (V (EtOH):V (H2O) = 5:5, Tris-HCl pH = 7.4) [33]. When used for fluorescence tests, the stock solutions were usually diluted to 10 μmol L−1 with mixed EtOH-H2O solvent (5:5, V/V, Tris-HCl pH = 7.4) unless otherwise noted. All the spectroscopic measurements were performed at least in triplicate and averaged.
4.4. Cytotoxicity
The cytotoxicity of J6 and J7 in ECV304 cells was analyzed by Methyl Thiazolyl Tetrazolium (MTT) assay [34]. ECV304 cells were cultured in Dulbecco’s Modified Eagle Medium (DMEM) with 10% Fetal Bovine Serum (FBS) in a humidified atmosphere with 5% CO2 at 37 °C. All cells in the exponential phase of growth were used in the experiments. After digestion with a 0.25% trypsin solution, the cells were seeded in 96-well cell culture clusters with 200 μL per well at a density of 2.5 × 10⁴ cells/mL for 24 h. The probes J6/J7 (100 mmol L−1 in DMSO) were then added to the 96-well plate to achieve a concentration gradient of 125, 250, 500, 1000, 2000, and 4000 μg L−1, and then incubated for another 24 h. Subsequently, the medium was removed, the cells were washed gently with Phosphate Buffered Saline (PBS) three times and incubated with 5.0 mg mL−1 MTT solution at 37 °C for 4 h. After that, the cells were washed gently with PBS three times, 150 μL DMSO was added to each well to dissolve the resulting crystals. The optical density was measured at 490 nm on a microplate spectrophotometer. All of the tests were conducted in triplicate. Data were expressed as mean ± standard deviation (SD).
4.5. Fluorescent Imaging in Living Cells
ECV304 cells were dispensed and cultured for 2 h until they plated on glass-bottomed dishes. The medium was then removed, and the cells were washed with DMEM and incubated for 30 min with 10 μmol L−1 of the probes at 37 °C, then washed three times with PBS and imaged [35]. After that, the cells were supplemented with 10 μmol L−1 of Cu2+ in the growth medium for another 30 min at 37 °C, washed three times with PBS, and imaged.
Supplementary Materials
The following are available online, Figure S1: Influence of pH on J6/J7 (8 μmol L−1) in the absence and presence of Cu2+ (8 μmol L−1), Figure S2: Influence of time on J6/J7-copper ions system (probe: 8 μmol L−1, Cu2+: 8 μmol L−1), Figure S3: IR of 6-hydroxyl-4-methylcoumarin (a), Figure S4: IR of 5-formyl-6-hydroxyl-4-methylcoumarin (b), Figure S5: IR of rhodamine 6G acylhydrazine (c), Figure S6: IR of probe J6, Figure S7: 1H NMR of probe J6, Figure S8: MS of probe J6, Figure S9: IR of probe J7, Figure S10: 1H NMR of probe J7, Figure S11: MS of probe J7, Table S1: Cytotoxicity of probes J6 and J7 in ECV304 at 24 h.
Author Contributions
Conceptualization, H.H. and Z.C.; methodology, H.H., Z.C. and L.Z.; software, Z.C.; validation, H.H. and Z.C.; formal analysis, L.Z. and X.Z.; investigation, H.H. and Z.C.; resources, H.H. and Z.C.; data curation, L.Z. and X.Z.; writing—original draft preparation, H.H.; writing—review and editing, Z.C.; visualization, Z.C.; supervision, Z.C. and X.Z.; project administration, Z.C.; funding acquisition, H.H., X.Z. and Z.C. All authors have read and agreed to the published version of the manuscript.
Funding
This research was funded by Shaanxi Natural Science Basic Research Project (2019JQ-068), Natural Science Foundation of Shaanxi Provincial Department of Education (20JK0902), Innovative Talents Promotion Plan in Shaanxi Province (2019KJXX-057), the Fund for Young Outstanding Talents in Universities of Shaanxi Province (05041904), Doctor Program of Xi’an Medical University (2020DOC32).
Data Availability Statement
The data presented in this study are available in the article and supplementary material.
Conflicts of Interest
The authors declare no conflict of interest.
Sample Availability
Samples of the compounds are available from the authors.
References
- Prohaska, J.R. Functions of trace elements in brain metabolism. Physiol. Rev. 1987, 67, 858–901. [Google Scholar] [CrossRef] [PubMed]
- Stockel, J.; Safar, J.; Wallace, A.C.; Cohen, F.E.; Prusiner, S.B. Prion protein selectively binds copper(II) ions. Biochemistry 1998, 37, 7185–7193. [Google Scholar] [CrossRef] [PubMed]
- Schlief, M.L.; Gitlin, J.D. Copper homeostasis in the CNS: A novel link between the NMDA receptor and copper homeostasis in the hippocampus. Mol. Neurobiol. 2006, 33, 81–90. [Google Scholar] [CrossRef]
- Mezzaroba, L.; Alfieri, D.F.; Colado Simao, A.N.; Vissoci Reiche, E.M. The role of zinc, copper, manganese and iron in neurodegenerative diseases. Neurotoxicology 2019, 74, 230–241. [Google Scholar] [CrossRef] [PubMed]
- Lavado, L.K.; Zhang, M.H.; Patel, K.; Khan, S.; Patel, U.K. Biometals as potential predictors of the neurodegenerative decline in Alzheimer’s Disease. Cureus 2019, 11, 5573–5583. [Google Scholar] [CrossRef] [Green Version]
- Strausak, D.; Mercer, J.F.B.; Dieter, H.H.; Stremmel, W.; Multhaup, G. Copper in disorders with neurological symptoms: Alzheimer’s, Menkes, and Wilson diseases. Brain Res. Bull. 2001, 55, 175–185. [Google Scholar] [CrossRef]
- Watts, R.W.E. Inside story. Nature 1989, 342, 868–869. [Google Scholar] [CrossRef]
- Gaggelli, E.; Kozlowski, H.; Valensin, D.; Valensin, G. Copper homeostasis and neurodegenerative disorders (Alzheimer’s, prion, and Parkinson’s diseases and amyotrophic lateral sclerosis). Chem. Rev. 2006, 106, 1995–2044. [Google Scholar] [CrossRef]
- Yang, L.; McRae, R.; Henary, M.M.; Patel, R.; Lai, B.; Vogt, S.; Fahrni, C.J. Imaging of the intracellular topography of copper with a fluorescent sensor and by synchrotron x-ray fluorescence microscopy. Proc. Natl. Acad. Sci. USA 2005, 102, 11179–11184. [Google Scholar] [CrossRef] [Green Version]
- Viguier, R.F.; Hulme, A.N. A sensitized europium complex generated by micromolar concentrations of copper(I): Toward the detection of copper(I) in biology. J. Am. Chem. Soc. 2006, 128, 11370–11371. [Google Scholar] [CrossRef]
- Jun, Y.W.; Cho, S.W.; Jung, J.; Huh, Y.; Kim, Y.; Kim, D.; Ahn, K.H. Frontiers in probing Alzheimer’s Disease biomarkers with fluorescent small molecules. ACS Cent. Sci. 2019, 5, 209–217. [Google Scholar] [CrossRef] [Green Version]
- Lee, M.H.; Kim, J.S.; Sessler, J.L. Small molecule-based ratiometric fluorescence probes for cations, anions, and biomolecules. Chem. Soc. Rev. 2015, 44, 4185–4191. [Google Scholar] [CrossRef] [PubMed] [Green Version]
- Zeng, L.; Miller, E.W.; Pralle, A.; Isacoff, E.Y.; Chang, C.J. A selective turn-on fluorescent sensor for imaging copper in living cells. J. Am. Chem. Soc. 2006, 128, 10–11. [Google Scholar] [CrossRef] [PubMed] [Green Version]
- Dujols, V.; Ford, F.; Czarnik, A.W. A long-wavelength fluorescent chemodosimeter selective for Cu(II) ion in water. J. Am. Chem. Soc. 1997, 119, 7386–7387. [Google Scholar] [CrossRef]
- Wu, D.; Huang, W.; Duan, C.; Lin, Z.; Meng, Q. Highly sensitive fluorescent probe for selective detection of Hg2+ in DMF aqueous media. Inorg. Chem. 2007, 46, 1538–1540. [Google Scholar] [CrossRef] [PubMed]
- Li, P.; Duan, X.; Chen, Z.; Liu, Y.; Xie, T.; Fang, L.; Li, X.; Yin, M.; Tang, B. A near-infrared fluorescent probe for detecting copper(II) with high selectivity and sensitivity and its biological imaging applications. Chem. Commun. 2011, 47, 7755–7757. [Google Scholar] [CrossRef]
- Liu, C.; Jiao, X.; He, S.; Zhao, L.; Zeng, X. A highly selective and sensitive fluorescent probe for Cu2+ based on a novel naphthalimide-rhodamine platform and its application in live cell imaging. Org. Biomol. Chem. 2017, 15, 3947–3954. [Google Scholar] [CrossRef]
- Tian, M.; He, H.; Wang, B.B.; Wang, X.; Liu, Y.; Jiang, F.L. A reaction-based turn-on fluorescent sensor for the detection of Cu(II) with excellent sensitivity and selectivity: Synthesis, DFT calculations, kinetics and application in real water samples. Dyes. Pigm. 2019, 165, 383–390. [Google Scholar] [CrossRef]
- Ning, J.; Wang, W.; Ge, G.; Chu, P.; Long, F.; Yang, Y.; Peng, Y.; Feng, L.; Ma, X.; James, T.D. Target enzyme-activated two-photon fluorescent probes: A case study of CYP3A4 using a two-dimensional design strategy. Angew. Chem. Int. Ed. Engl. 2019, 58, 9959–9963. [Google Scholar] [CrossRef]
- Ning, J.; Liu, T.; Dong, P.; Wang, W.; Ge, G.; Wang, B.; Yu, Z.; Shi, L.; Tian, X.; Huo, X.; et al. Molecular design strategy to construct the near-infrared fluorescent probe for selectively sensing human cytochrome P450 2J2. J. Am. Chem. Soc. 2019, 141, 1126–1134. [Google Scholar] [CrossRef]
- Feng, L.; Yan, Q.; Zhang, B.; Tian, X.; Wang, C.; Yu, Z.; Cui, J.; Guo, D.; Ma, X.; James, T.D. Ratiometric fluorescent probe for sensing Streptococcus mutans glucosyltransferase, a key factor in the formation of dental caries. Chem. Commun. 2019, 55, 3548–3551. [Google Scholar] [CrossRef] [PubMed] [Green Version]
- Kuijpers, K.P.L.; Bottecchia, C.; Cambié, D.; Drummen, K.; König, N.J.; Noël, T. A fully automated continuous-flow platform for fluorescence quenching studies and Stern-Volmer analysis. Angew. Chem. Int. Ed. Engl. 2018, 57, 11278–11282. [Google Scholar] [CrossRef] [PubMed] [Green Version]
- Zhu, M.; Yuan, M.; Liu, X.; Xu, J.; Lv, J.; Huang, C.; Liu, H.; Li, Y.; Wang, S.; Zhu, D. Visible near-infrared chemosensor for mercury ion. Org. Lett. 2008, 10, 1481–1484. [Google Scholar] [CrossRef]
- Zhao, Y.; Sun, Y.; Lv, X.; Liu, Y.L.; Chen, M.L.; Guo, W. Rhodamine-based chemosensor for Hg2+ in aqueous solution with a broad pH range and its application in live cell imaging. Org. Biomol. Chem. 2010, 8, 4143–4147. [Google Scholar] [CrossRef] [PubMed]
- Fang, Y.; Zhou, Y.; Rui, Q.; Yao, C. Rhodamine-ferrocene conjugate chemosensor for selectively sensing copper(II) with multisignals: Chromaticity, fluorescence, and electrochemistry and its application in living cell imaging. Organometallics 2015, 34, 2962–2970. [Google Scholar] [CrossRef]
- Zhou, J.; Yu, X.G.; Jin, X.L.; Tang, G.P.; Zhang, W.; Hu, J.M.; Zhong, C.F. Novel carbazole-based main chain polymeric metal complexes containing complexes of phenanthroline with Zn(II) or Cd(II): Synthesis, characterization and photovoltaic application in DSSCs. J. Mol. Struct. 2014, 1058, 14–21. [Google Scholar] [CrossRef]
- Cai, Z.B.; Liu, L.F.; Zhou, M. Synthesis of nickel(II) complexes containing modified phenanthroline ligands for potential nonlinear optical applications. Opt. Mater. 2013, 35, 1481–1486. [Google Scholar] [CrossRef]
- Bhattacharyya, B.; Kundu, A.; Guchhait, N.; Dhara, K. Anthraimidazoledione Based Reversible and Reusable Selective Chemosensors for Fluoride Ion: Naked-Eye, Colorimetric and Fluorescence “ON-OFF”. J. Fluoresc. 2017, 27, 1041–1049. [Google Scholar] [CrossRef]
- Varadaraju, C.; Paulraj, M.S.; Tamilselvan, G.; Enoch, I.V.M.V.; Srinivasadesikan, V.; Shyi-Long, L. Evaluation of metal ion sensing behaviour of fluorescent probe along with its precursors: PET-CHEF mechanism, molecular logic gate behaviour and DFT studies. J. Incl. Phenom. Macro. 2019, 95, 79–89. [Google Scholar] [CrossRef]
- Zhang, S.; Yu, T.; Sun, M.; Yu, H.; Zhang, Z.; Wang, S.; Jiang, H. Highly sensitive and selective fluorescence detection of copper(II) ion based on multi-ligand metal chelation. Talanta 2014, 126, 185–190. [Google Scholar] [CrossRef]
- Jung, H.S.; Kwon, P.S.; Lee, J.W.; Kim, J.I.; Hong, C.S.; Kim, J.W.; Yan, S.; Lee, J.Y.; Lee, J.H.; Joo, T.; et al. Coumarin-derived Cu2+-selective fluorescence sensor: Synthesis, mechanisms, and applications in living cells. J. Am. Chem. Soc. 2009, 131, 2008–2012. [Google Scholar] [CrossRef] [PubMed]
- Wang, C.; Dong, B.; Kong, X.; Song, X.; Zhang, N.; Lin, W. A cancer cell-specific fluorescent probe for imaging Cu2+ in living cancer cells. Spectrochim. Acta A Mol. Biomol. Spectrosc. 2017, 182, 32–36. [Google Scholar] [CrossRef] [PubMed]
- Huang, W.; Zhou, P.; Yan, W.; He, C.; Xiong, L.; Li, F.; Duan, C. A bright water-compatible sugar-rhodamine fluorescence sensor for selective detection of Hg2+ in natural water and living cells. J. Environ. Monit. 2009, 11, 330–335. [Google Scholar] [CrossRef] [PubMed]
- Palanisamy, S.; Wang, Y.L.; Chen, Y.J.; Chen, C.Y.; Tsai, F.T.; Liaw, W.F.; Wang, Y.M. In vitro and in vivo imaging of nitroxyl with copper fluorescent probe in living cells and zebrafish. Molecules 2018, 23, 2551. [Google Scholar] [CrossRef] [Green Version]
- Yi, X.Q.; He, Y.F.; Cao, Y.S.; Shen, W.X.; Lv, Y.Y. Porphyrinic probe for fluorescence “turn-on” monitoring of Cu+ in aqueous buffer and mitochondria. ACS Sens. 2019, 4, 856–864. [Google Scholar] [CrossRef]
Figure 1.
Structures of J6 and J7.

Figure 2.
Fluorescence intensity changes of (a) J6 and (b) J7 upon the addition of various metal ions.
Figure 2.
Fluorescence intensity changes of (a) J6 and (b) J7 upon the addition of various metal ions.

Figure 3.
Selectivity of (a) J6 and (b) J7 to Cu2+ in Cu2+-competing ions coexisting system with mixed solvents (V (EtOH): V (H2O) = 5: 5, Tris-HCl pH = 7.4) environment. (a) J6: from left to right (bar 1-20): K+, Na+, Ca2+, Mg2+, Ba2+, Al3+, Ni2+, Pb2+, Mn2+, Cr3+, Co2+, Ag+, Fe3+, Zn2+, Cu+, Fe2+, Cd2+, Sn2+, Hg2+ and Cu2+. (b) J7: from left to right (bar 1-20): K+, Na+, Ca2+, Mg2+, Ba2+, Al3+, Ni2+, Pb2+, Mn2+, Fe3+, Cr3+, Co2+, Ag+, Zn2+, Cu+, Fe2+, Cd2+, Sn2+, Hg2+ and Cu2+.

Figure 4.
Visible color changes of J6 (top) and J7 (bottom) after the addition of Cu2+.

Figure 5.
Fluorescence titration curve of (a) J6 and (b) J7 with Cu2+ (J6: 10 μmol L−1, J7: 10 μmol L−1).
Figure 5.
Fluorescence titration curve of (a) J6 and (b) J7 with Cu2+ (J6: 10 μmol L−1, J7: 10 μmol L−1).

Figure 6.
Association stoichiometry of (a) J6-Cu2+ and (b) J7-Cu2+.

Figure 7.
Semiquantitative test paper for Cu2+ by J7.

Figure 8.
The cytotoxicity of J6/J7 on ECV304 at 24 h.

Figure 9.
Recognition mechanism of the probe to Cu2+ (shown as J7).

Figure 10.
(a) Fluorescent images of ECV304 incubated with 10 μmol L−1 J6/J7 for 30 min; (b) a further incubation with 10 μmol L−1 copper ions for 2 h; (c) bright-field image of (b); (d) an overlay image of (b,c).
Figure 10.
(a) Fluorescent images of ECV304 incubated with 10 μmol L−1 J6/J7 for 30 min; (b) a further incubation with 10 μmol L−1 copper ions for 2 h; (c) bright-field image of (b); (d) an overlay image of (b,c).

Scheme 1.
Synthetic routes of J6 and J7. (a) 6-Hydroxyl-4-methylcoumarin, (b) 5-formyl-6-hydroxyl-4-methylcoumarin, (c) rhodamine 6G acylhydrazine
Scheme 1.
Synthetic routes of J6 and J7. (a) 6-Hydroxyl-4-methylcoumarin, (b) 5-formyl-6-hydroxyl-4-methylcoumarin, (c) rhodamine 6G acylhydrazine

Publisher’s Note: MDPI stays neutral with regard to jurisdictional claims in published maps and institutional affiliations. |
© 2021 by the authors. Licensee MDPI, Basel, Switzerland. This article is an open access article distributed under the terms and conditions of the Creative Commons Attribution (CC BY) license (http://creativecommons.org/licenses/by/4.0/).
Share and Cite
MDPI and ACS Style
He, H.; Cheng, Z.; Zheng, L.; Zhang, X. Evaluation of Fluorescent Cu2+ Probes: Instant Sensing, Cell Permeable Recognition and Quantitative Detection. Molecules 2021, 26, 512. https://0-doi-org.brum.beds.ac.uk/10.3390/molecules26020512
AMA Style
He H, Cheng Z, Zheng L, Zhang X. Evaluation of Fluorescent Cu2+ Probes: Instant Sensing, Cell Permeable Recognition and Quantitative Detection. Molecules. 2021; 26(2):512. https://0-doi-org.brum.beds.ac.uk/10.3390/molecules26020512
Chicago/Turabian StyleHe, Hao, Zhao Cheng, Lei Zheng, and Xuejiao Zhang. 2021. "Evaluation of Fluorescent Cu2+ Probes: Instant Sensing, Cell Permeable Recognition and Quantitative Detection" Molecules 26, no. 2: 512. https://0-doi-org.brum.beds.ac.uk/10.3390/molecules26020512