
Evaluation of the Anticancer Potential of Crude, Irradiated Cerastes cerastes Snake Venom and Propolis Ethanolic Extract & Related Biological Alterations

 ,
,  and
and 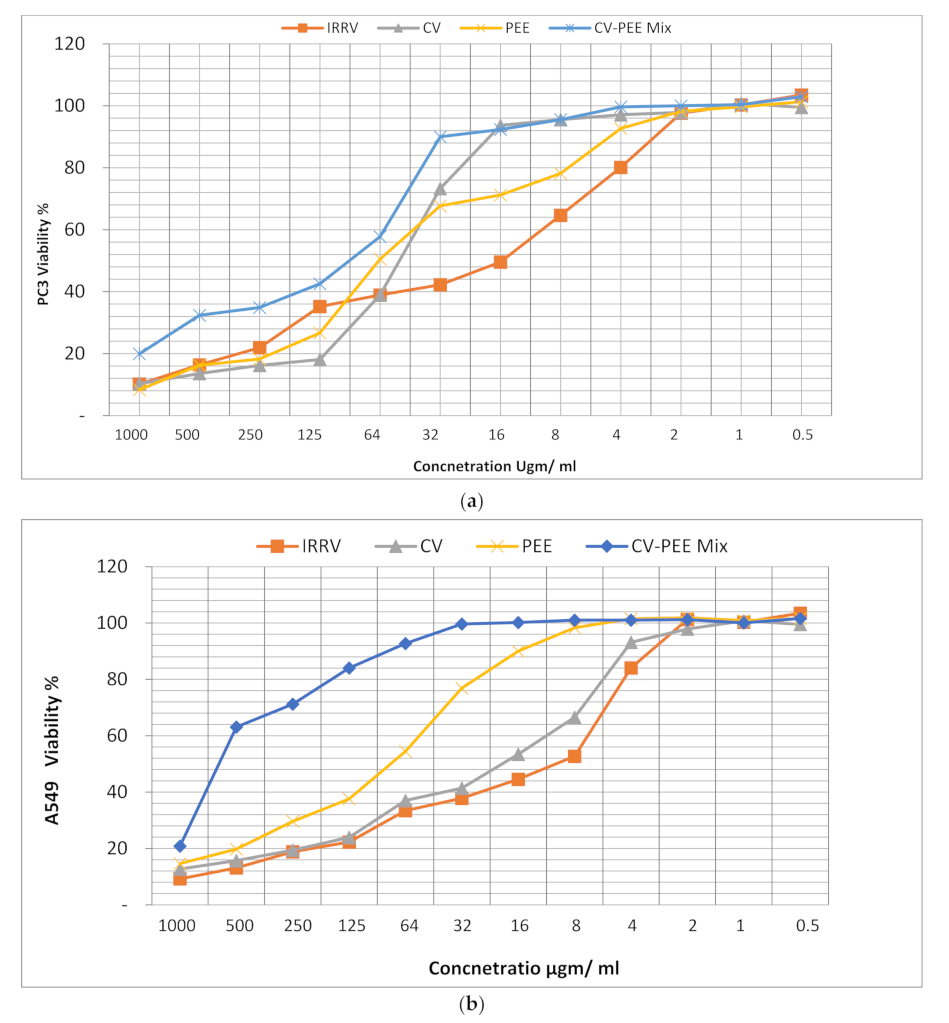
Abstract
:1. Introduction
2. Materials & Methods
2.1. Source of Venom
2.2. Irradiation of Crude Venom
2.3. Crude Propolis
2.4. Preparation of Ethanolic Extractof Propolis (PEE)
2.5. Evaluation of Total Proteins of Cerastes CerastesCV and IRRV
2.6. Cancer Cell Line
2.7. Cell Viability In Vitro (MTT Assay)
2.8. Cell Cycle Analysis
2.9. Isolation of RNA and Synthesis of cDNA
2.10. Real Time PCR-Quantitative
2.11. Biochemical Analysis
2.12. Spectrophotometric Analysis
2.13. Statistical Analysis
3. Results
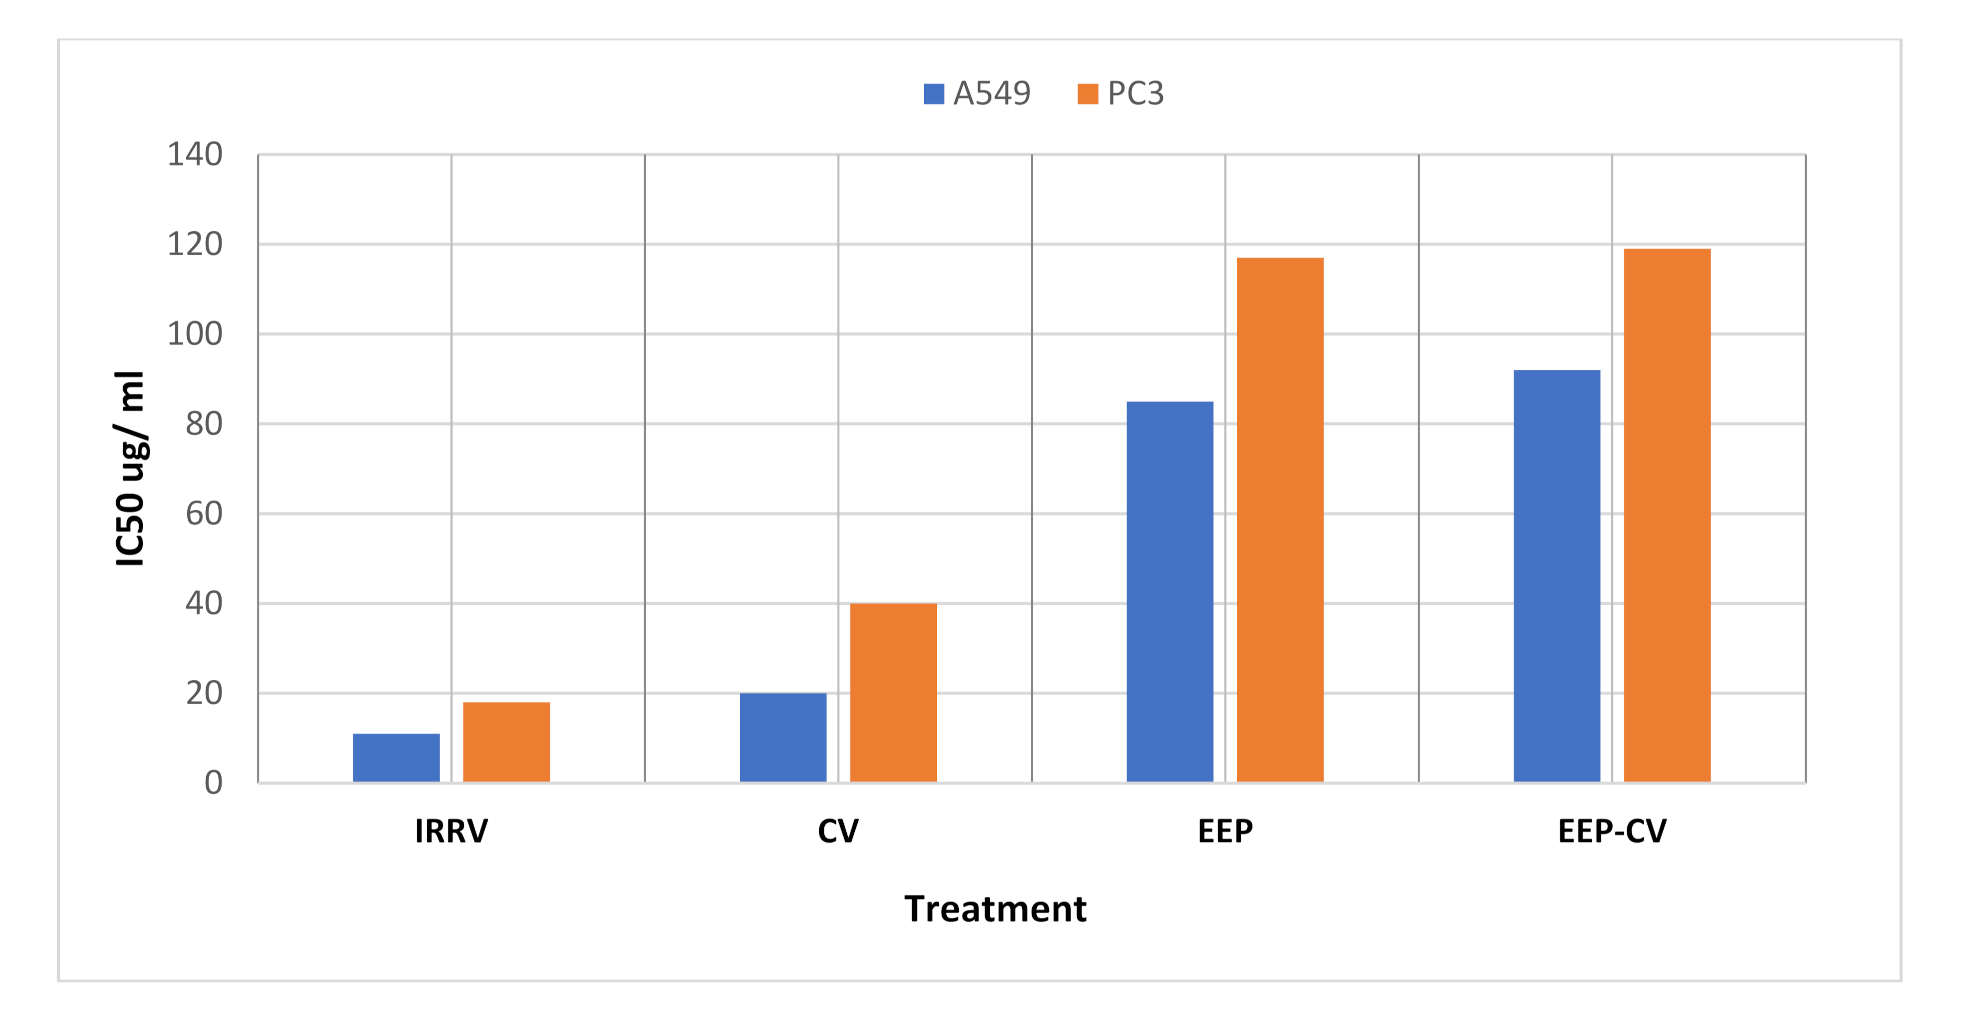
3.1. Cytotoxicity
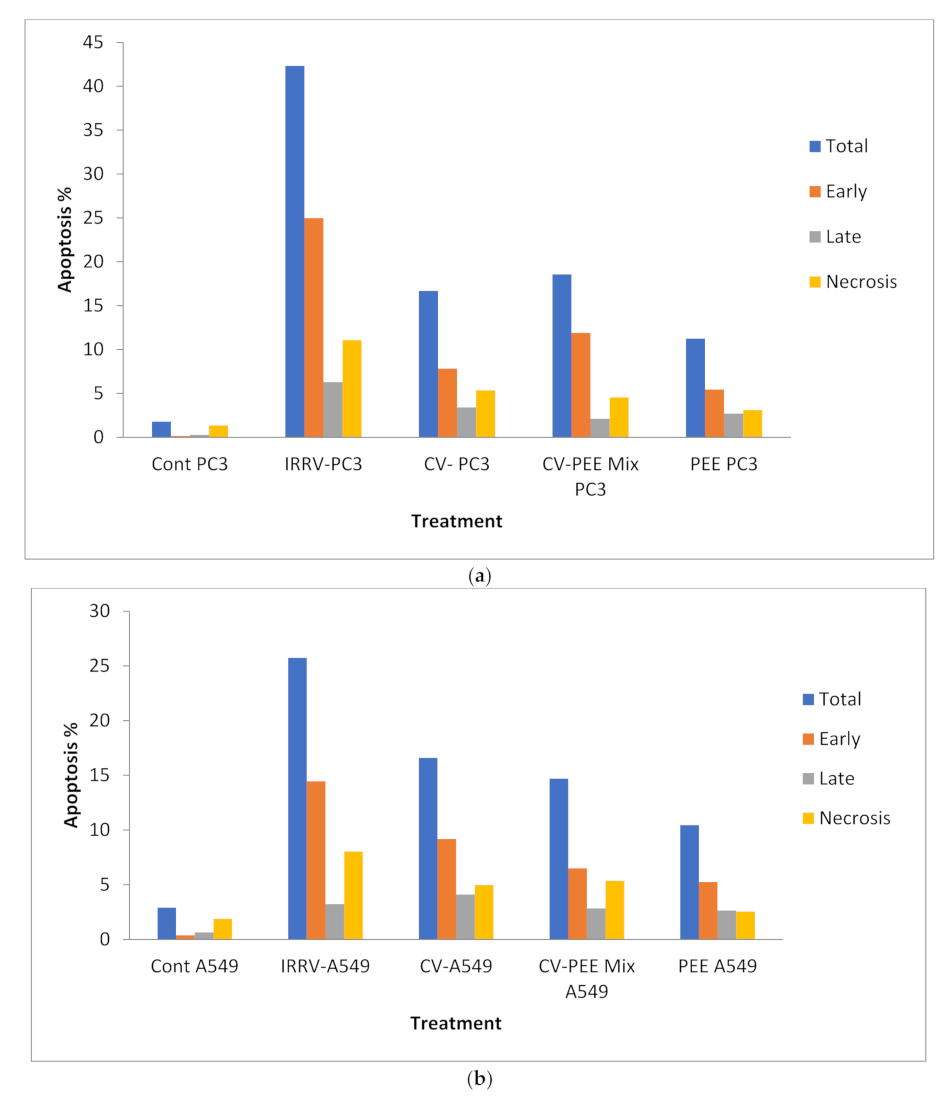
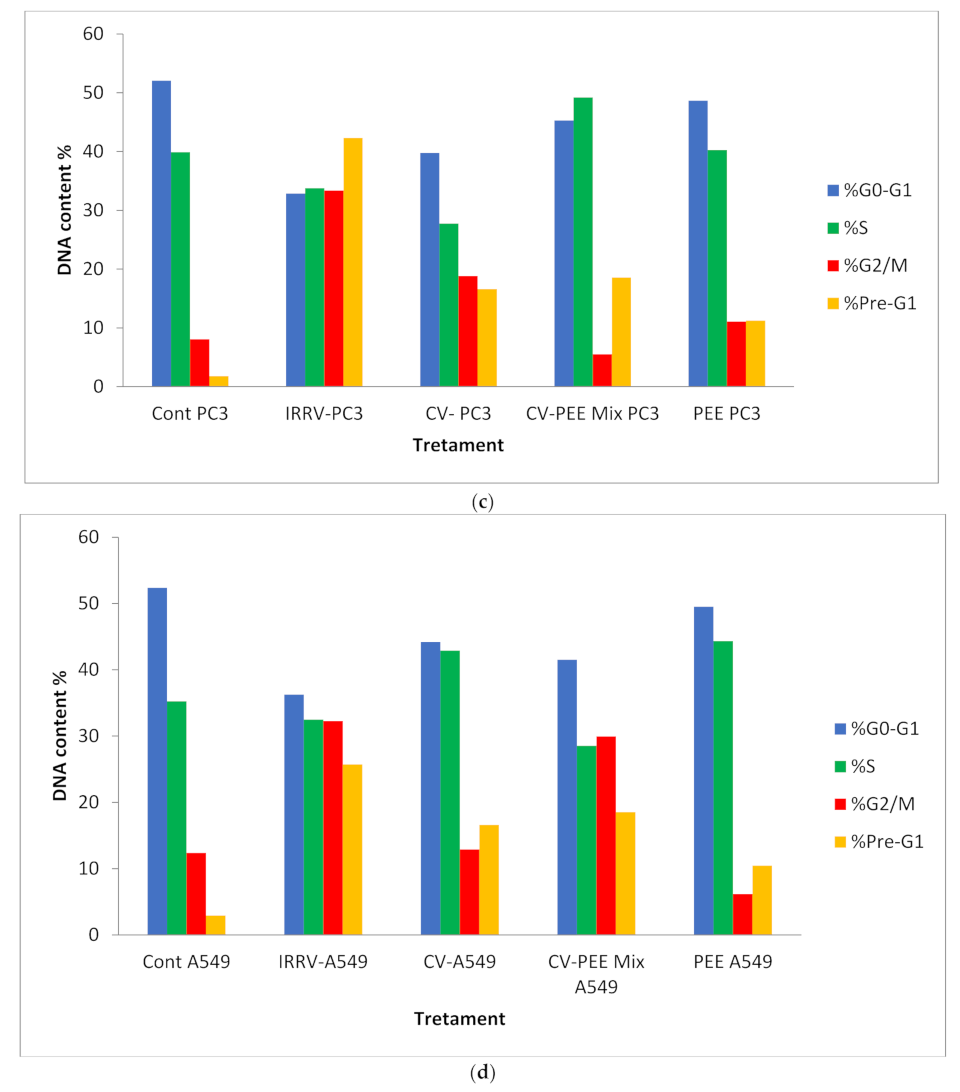
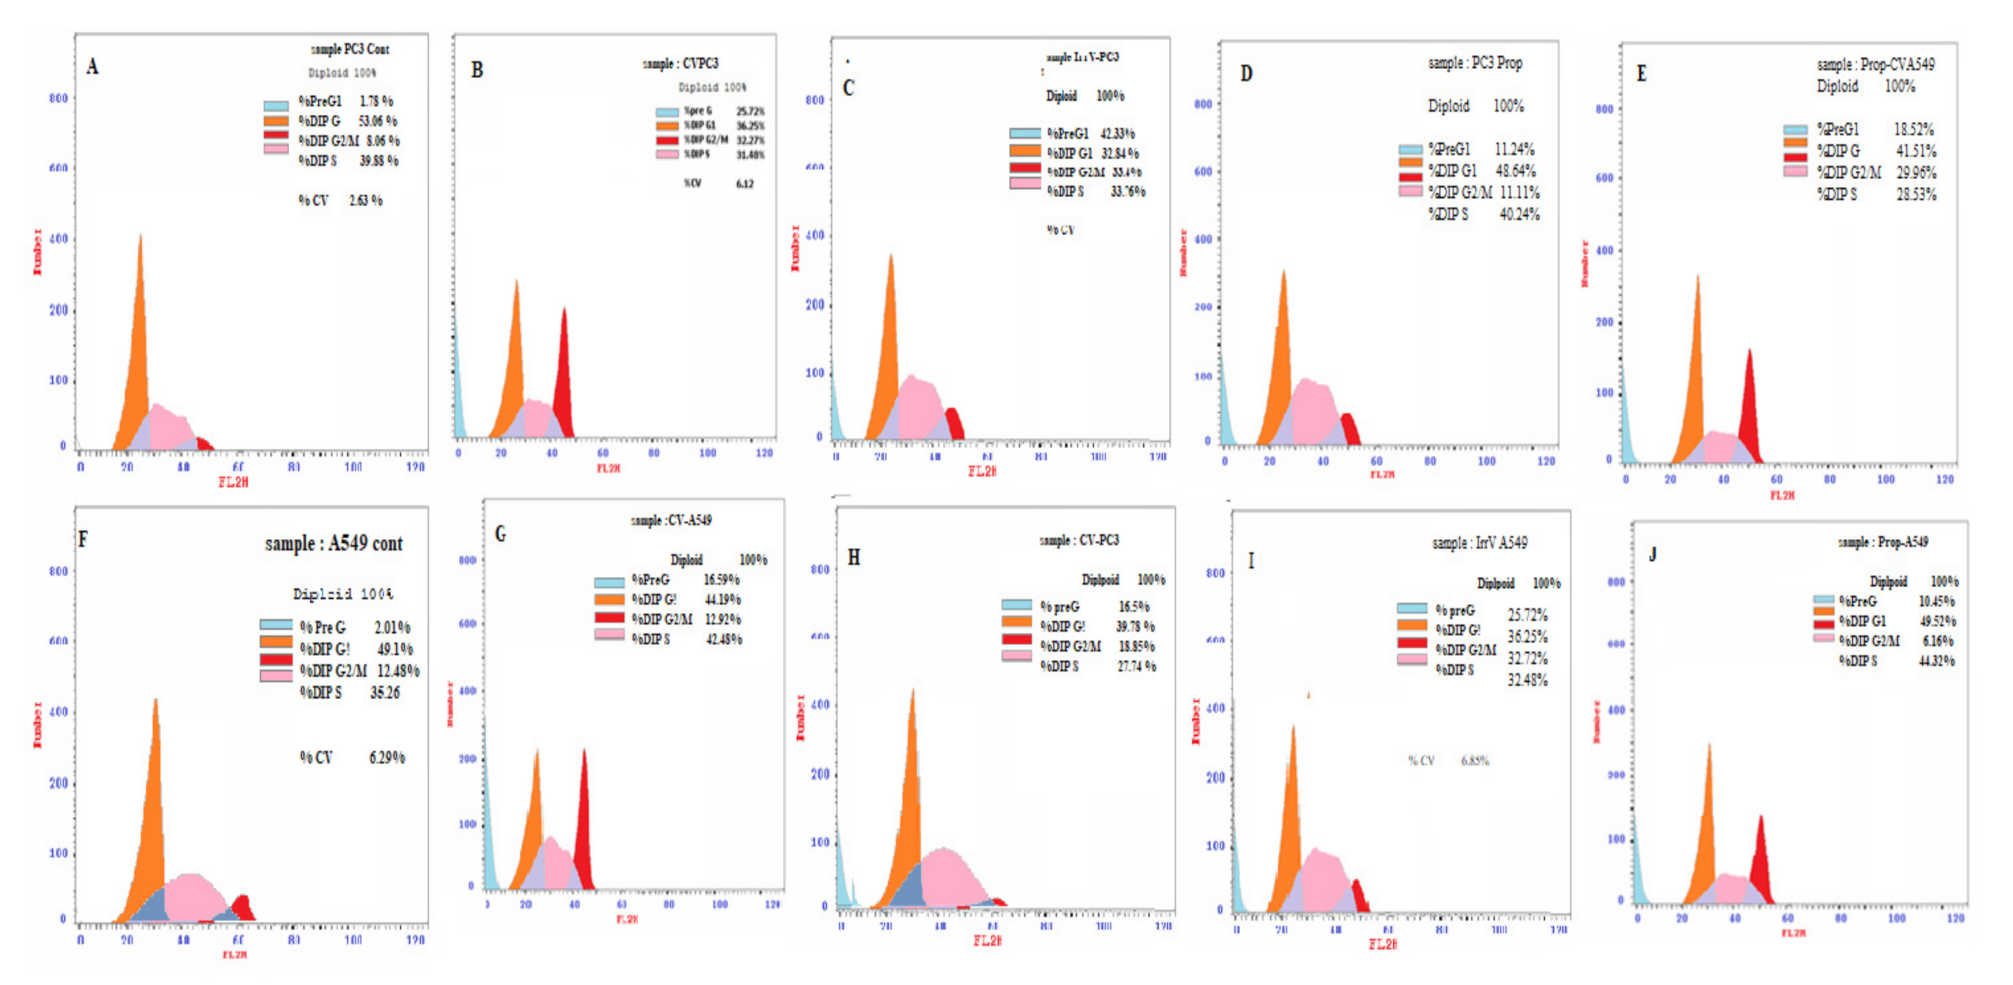
3.2. Cell Cycle
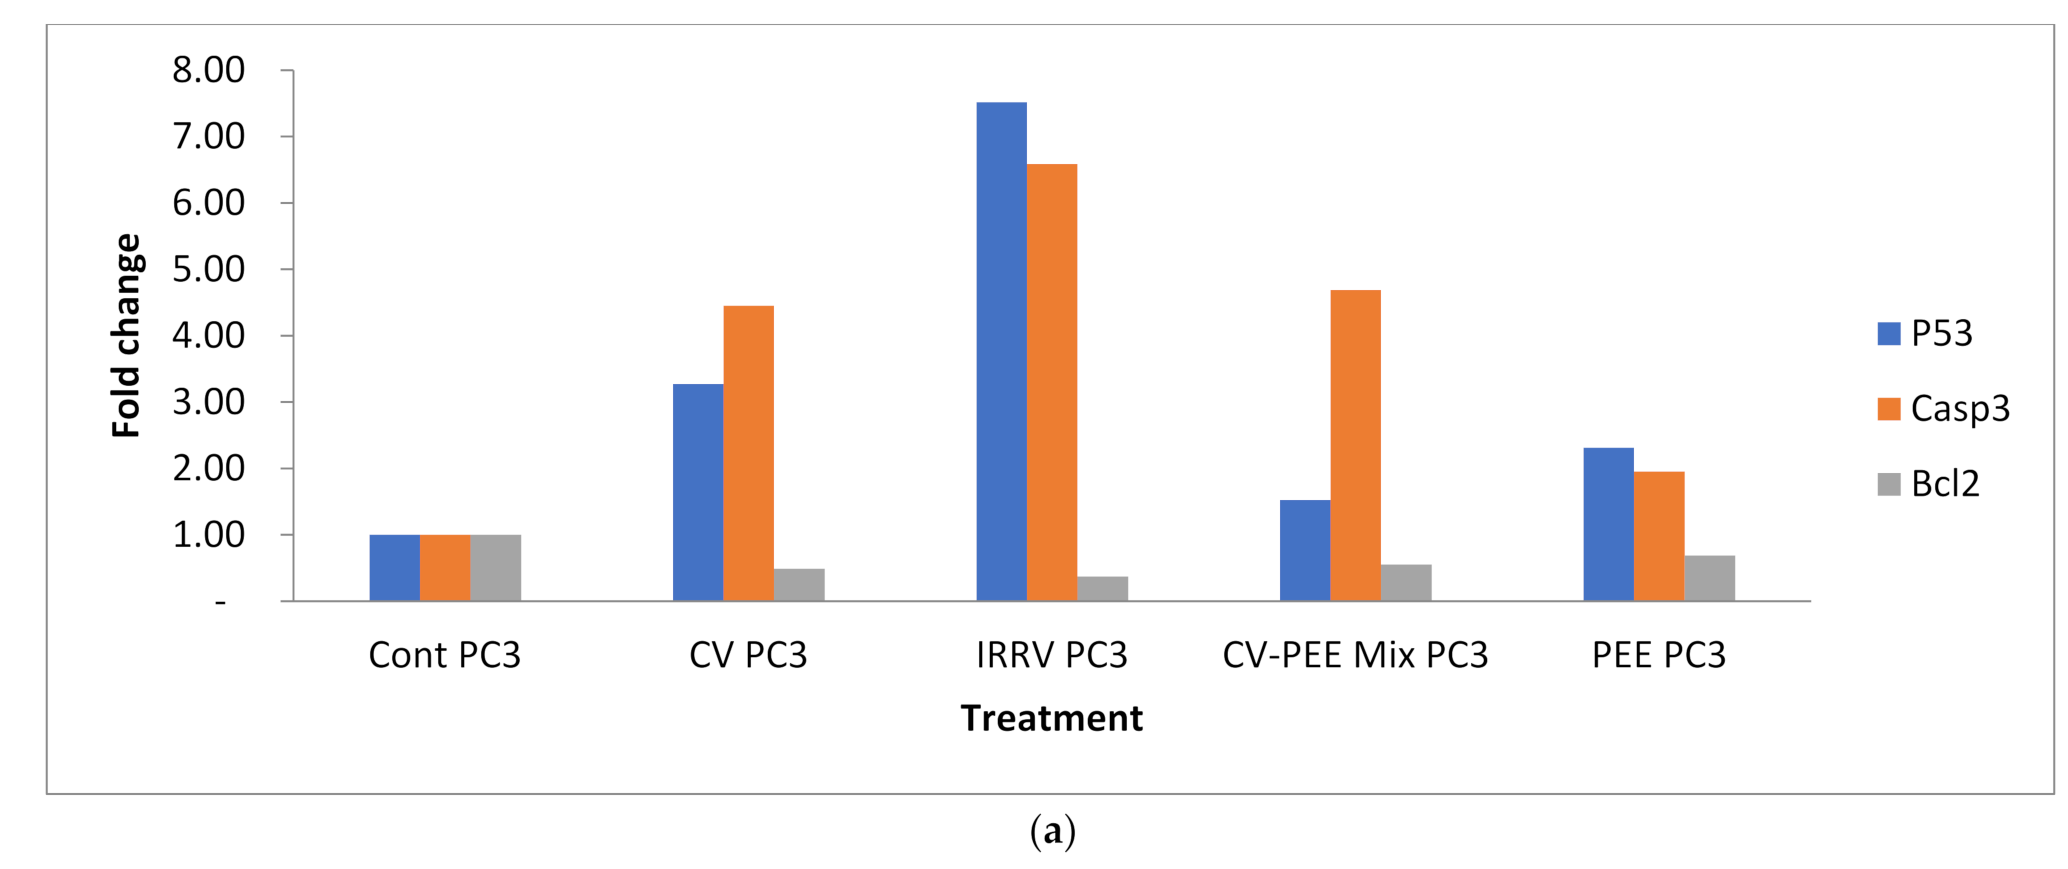
3.3. Gene Expression
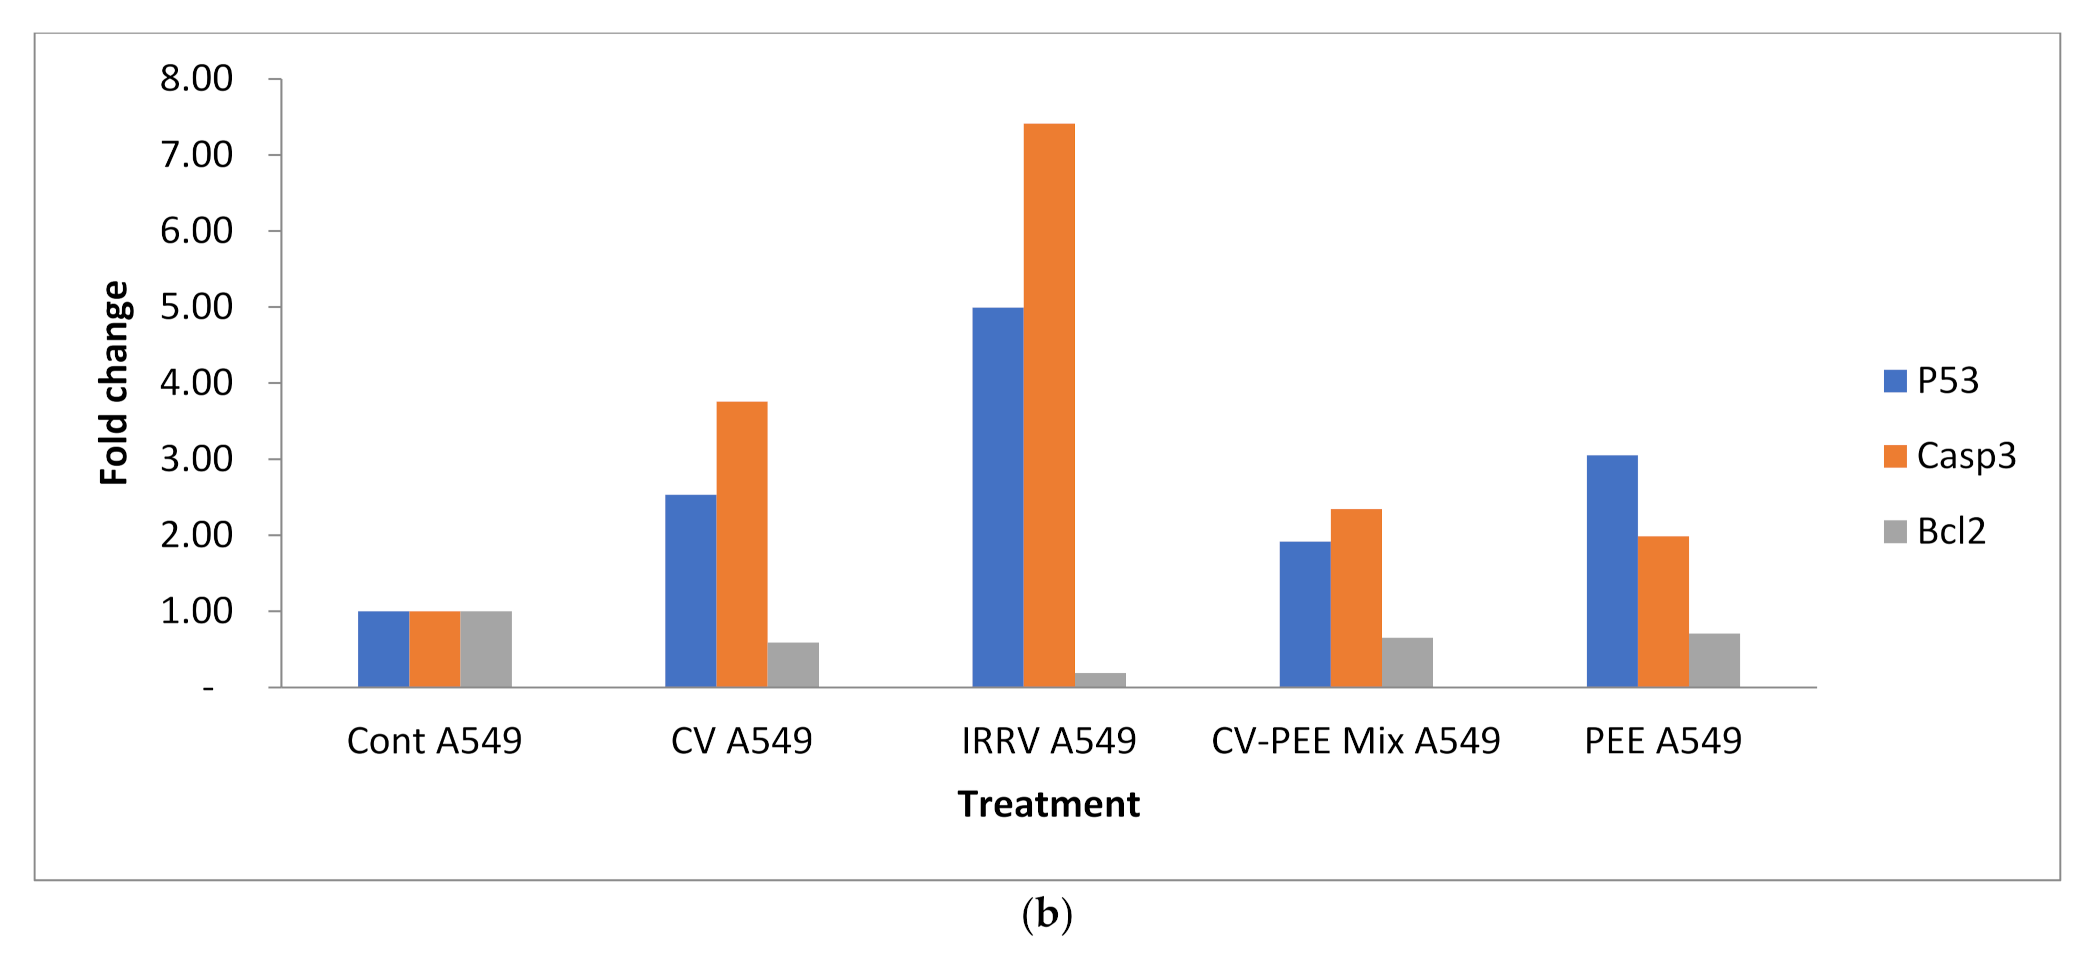
3.4. Biochemical Analysis
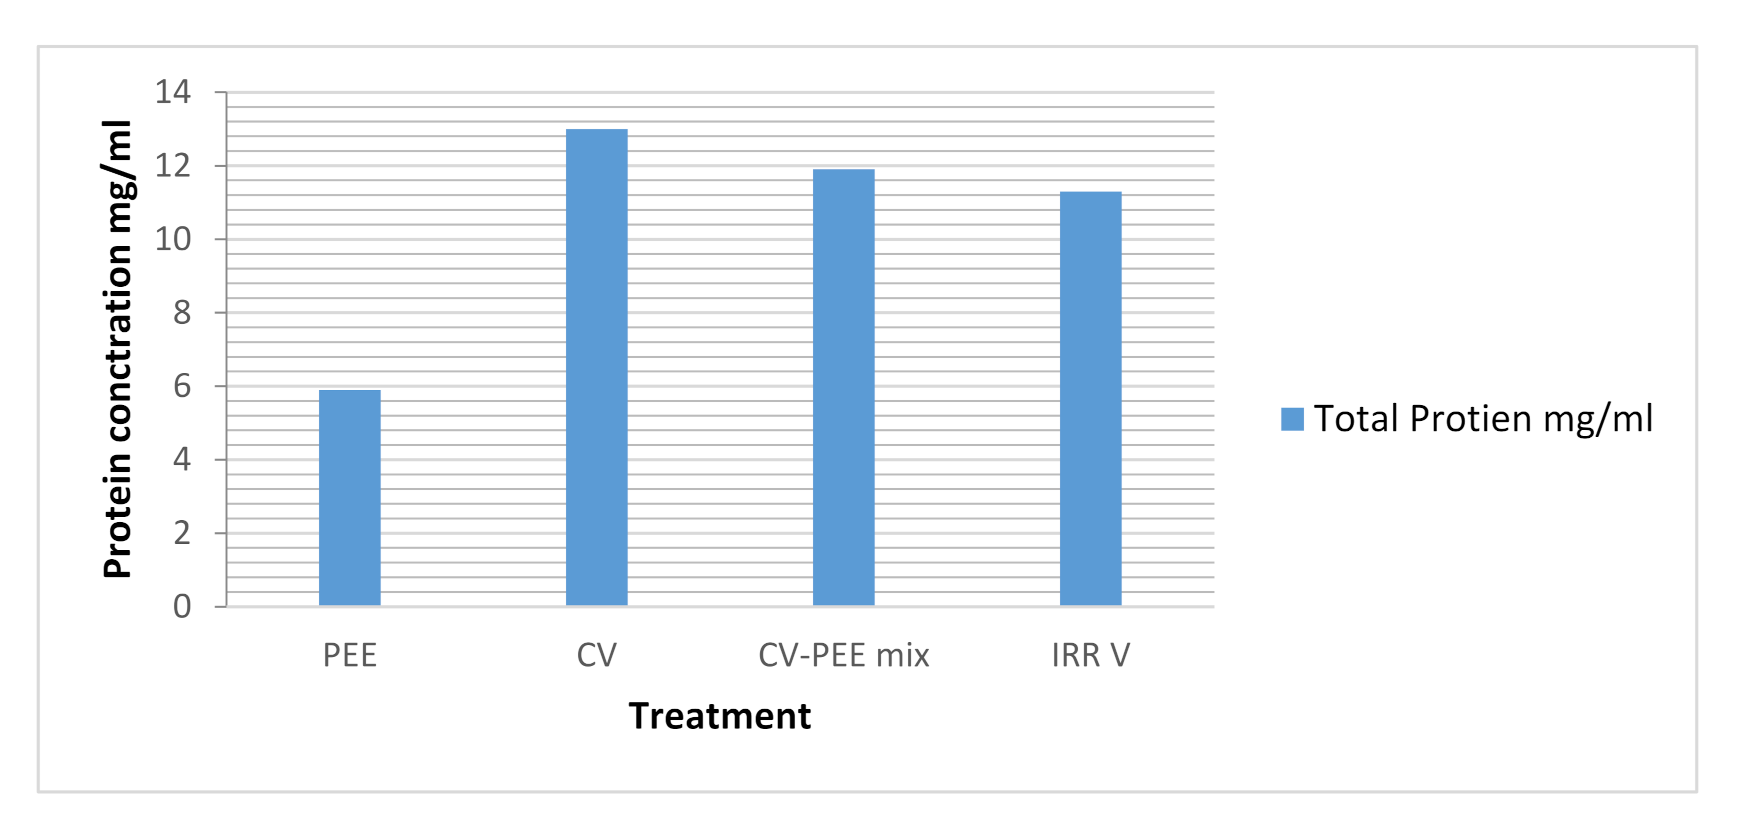
3.5. Evaluation of Total Protein
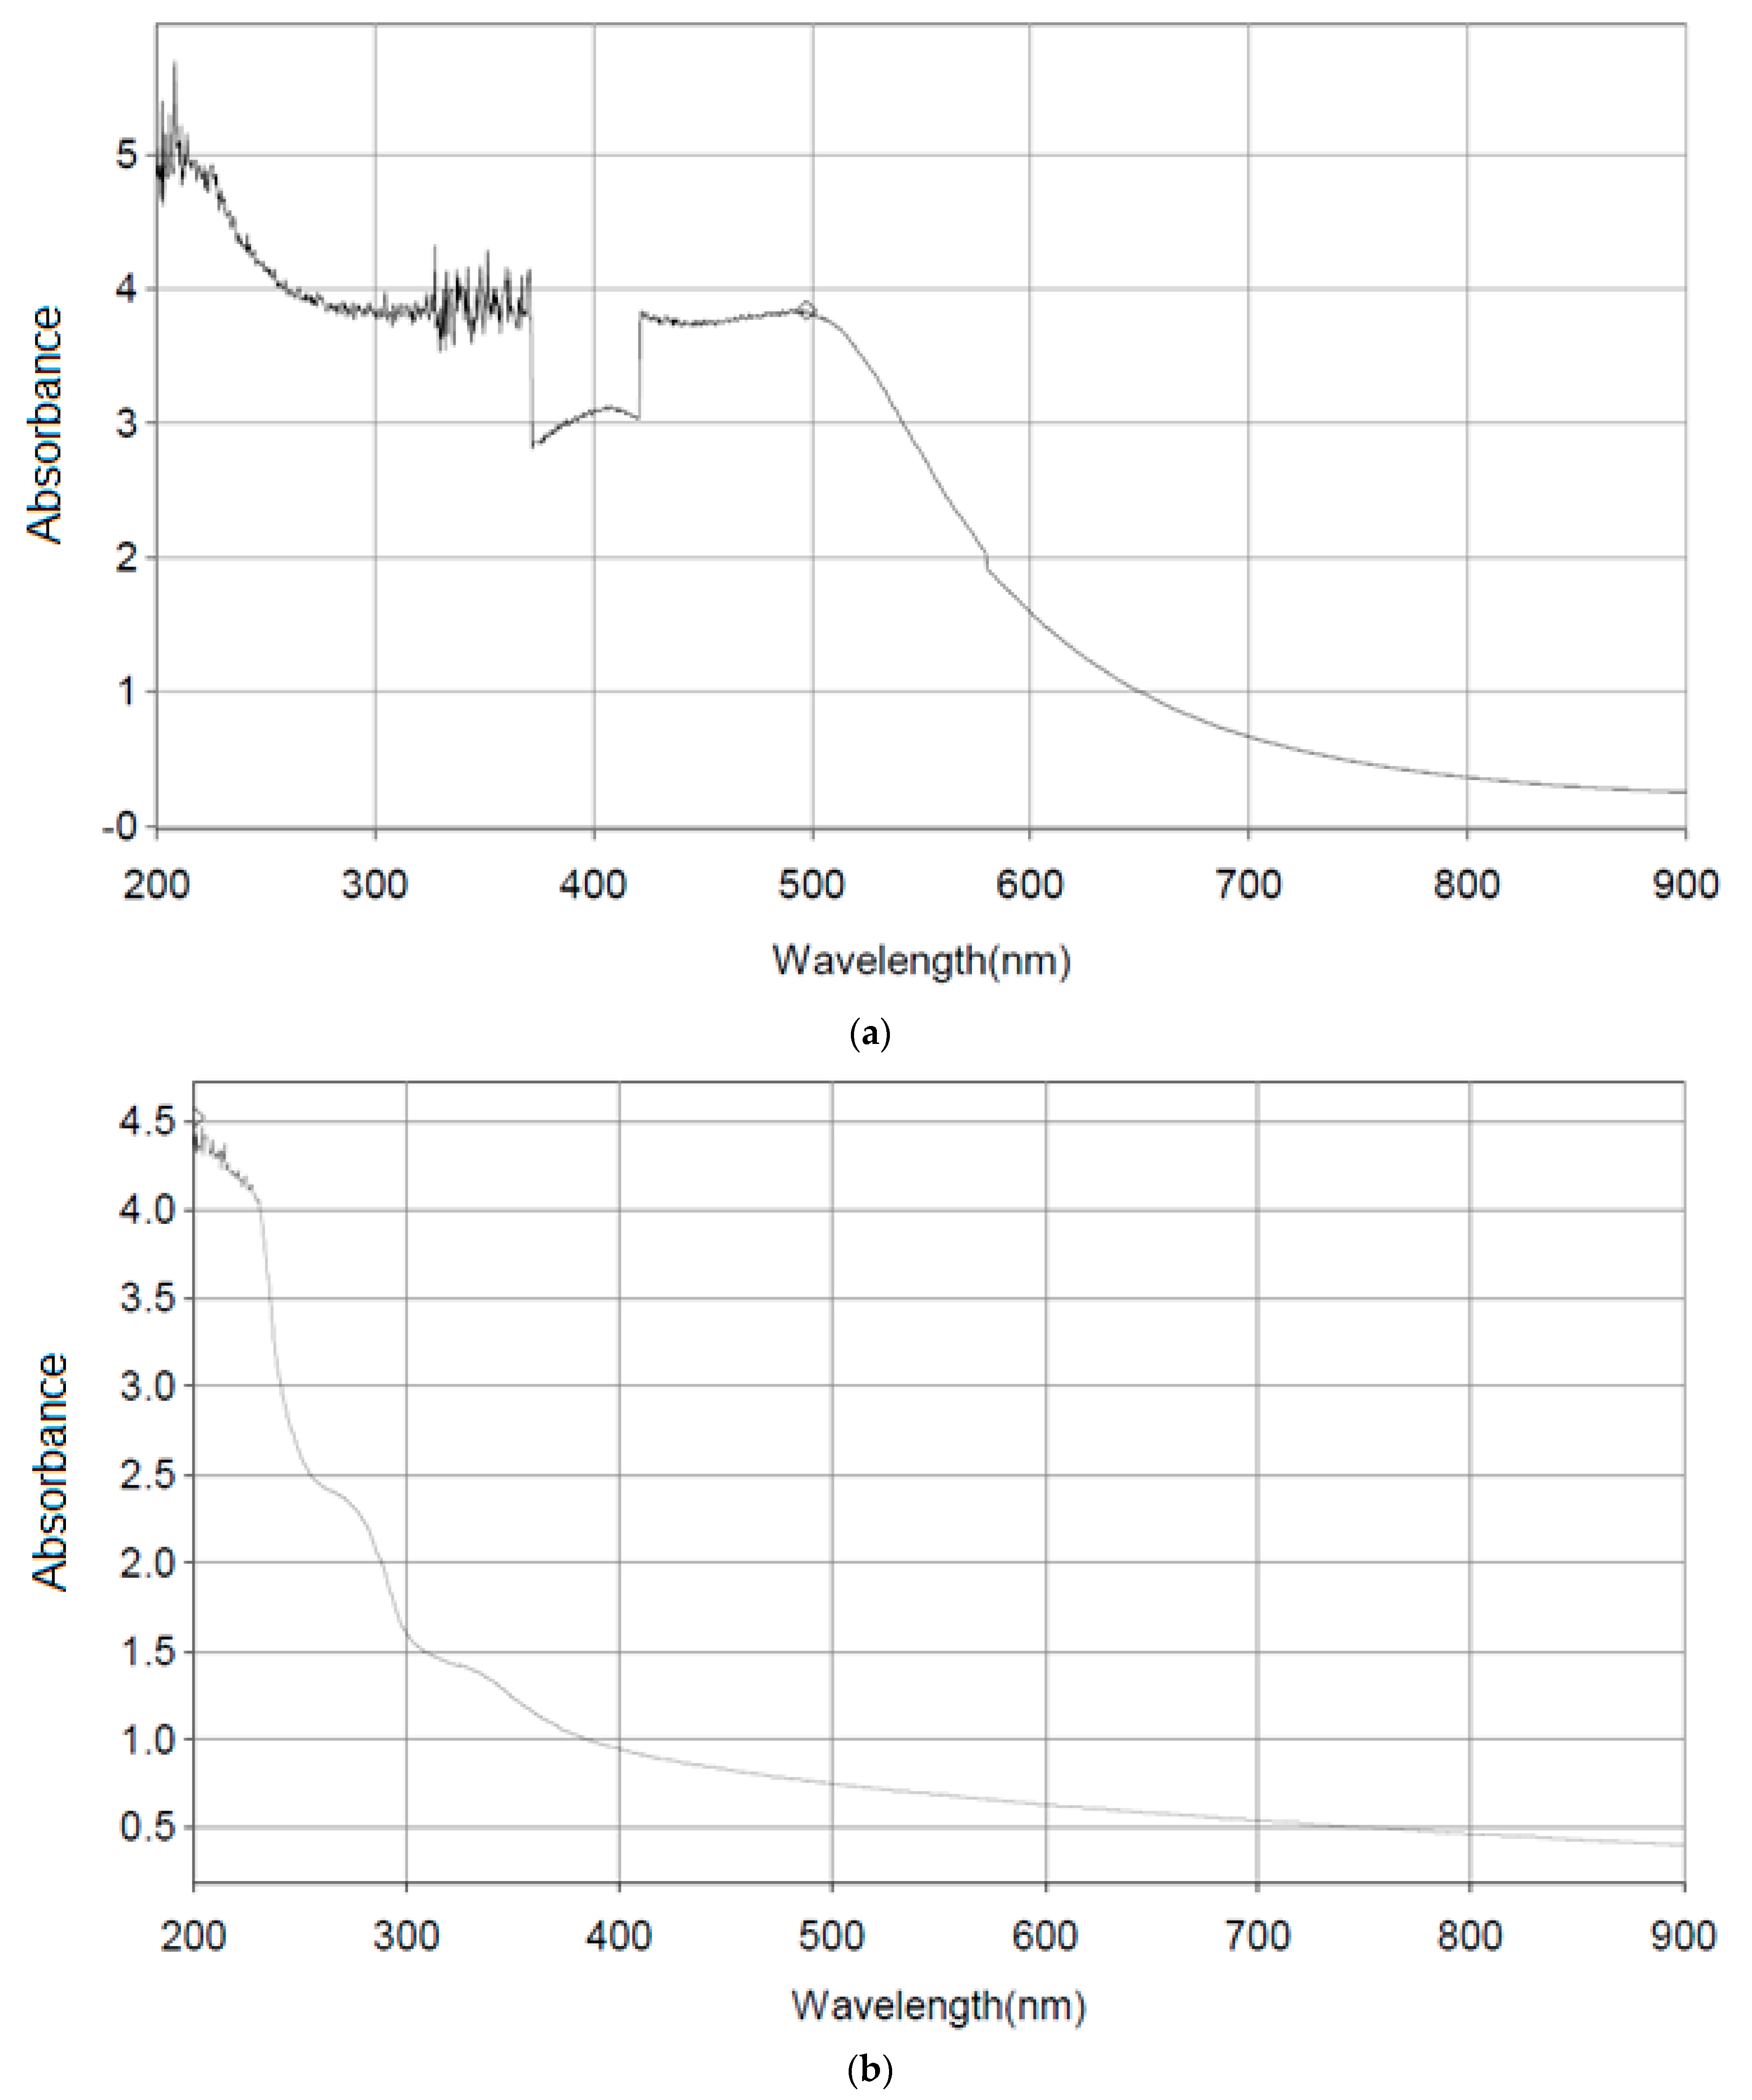
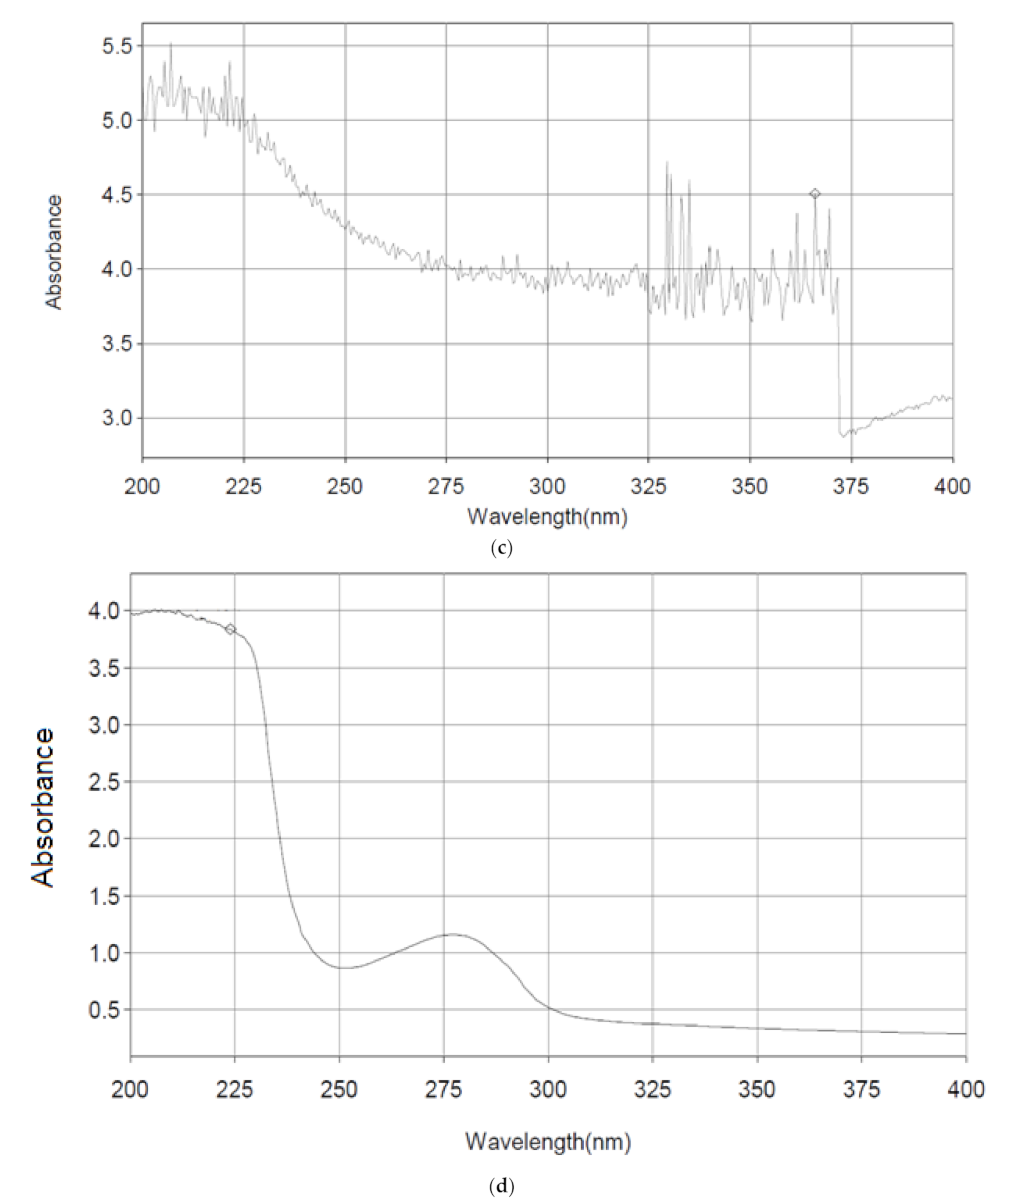
3.6. UV-Spectrophotometric Analysis
4. Discussion
5. Conclusions
Author Contributions
Funding
Institutional Review Board Statement
Informed Consent Statement
Data Availability Statement
Acknowledgments
Conflicts of Interest
Sample Availability
References
- Bradshaw, M.J.; Saviola, A.J.; Fesler, E.; Mackessy, S.P. Evaluation of cytotoxic activities of snake venoms toward breast (MCF-7) and skin cancer (A-375) cell lines. Cytotechnology 2016, 68, 687–700. [Google Scholar] [CrossRef] [Green Version]
- Martinez-Carreres, L.; Nasrallah, A.; Fajas, L. Cancer: Linking powerhouses to suicidal bags. Front. Oncol. 2017, 7, 204. [Google Scholar] [CrossRef]
- Kaufmann, S.H.; Earnshaw, W.C. Induction of apoptosis by cancer chemotherapy. Exp. Cell Res. 2000, 256, 42–49. [Google Scholar] [CrossRef] [PubMed]
- Kele, J.; Macêdo, A.; Fox, J.W.; de Souza Castro, M. Send Orders for Reprints to reprints@benthamscienceae Disintegrins from Snake Venoms and their Applications in Cancer Research and Therapy. Curr. Protein Pept. Sci. 2015, 16, 532–548. [Google Scholar]
- Bonjar, L.S. Design of a new therapy to treat snake envenomation. Drug Des. Dev. Ther. 2014, 8, 819–824. [Google Scholar] [CrossRef] [PubMed] [Green Version]
- Franchi, G.C.; Moraes, C.S.; Toreti, V.C.; Daugsch, A.; Nowill, A.E.; Park, Y.K. Comparison of effects of the ethanolic extracts of Brazilian propolis on human leukemic cells as assessed with the MTT assay. Evid.-Based Complementary Altern. Med. 2012, 2012, 918956. [Google Scholar] [CrossRef] [PubMed]
- Zhang, L.; Wei, L.J. ACTX-8, a cytotoxic l-amino acid oxidase isolated from Agkistrodon acutus snake venom, induces apoptosis in Hela cervical cancer cells. Life Sci. 2007, 80, 1189–1197. [Google Scholar] [CrossRef]
- Markiewicz-Żukowska, R.; Car, H.; Naliwajko, S.K.; Sawicka, D.; Szynaka, B.; Chyczewski, L.; Isidorov, V.; Borawska, M.H. Ethanolic extract of propolis, chrysin, CAPE inhibit human astroglia cells. Adv. Med. Sci. 2012, 57, 208–216. [Google Scholar] [CrossRef]
- K Vyas, V.; Chintha, C.; R Pandya, M. Biology and Medicinal Chemistry Approaches Towards Various Apoptosis Inducers. Anti-Cancer Agents Med. Chem. 2013, 13, 433–455. [Google Scholar] [CrossRef]
- Shaban, E.A. Influence of ionizing radiation on Cobra (Naja haje) and Cerastes cerastes venoms: Toxicological and immunological aspects. Egypt. J. Hosp. Med. 2003, 13, 99–111. [Google Scholar] [CrossRef]
- Cunha, I.B.S.; Sawaya, A.C.H.F.; Caetano, F.M.; Shimizu, M.T.; Marcucci, M.C.; Drezza, F.T.; Povia, G.S.; Carvalho, P.D.O. Factors that Influence the Yield and Composition of Brazilian Propolis Extracts. J. Braz. Chem. Soc. 2004, 15, 964–970. [Google Scholar] [CrossRef]
- Pucci, C.; Martinelli, C.; Ciofani, G. Innovative approaches for cancer treatment: Current perspectives and new challenges. Ecancermedicalscience 2019, 13. [Google Scholar] [CrossRef] [PubMed]
- Schirrmacher, V. From chemotherapy to biological therapy: A review of novel concepts to reduce the side effects of systemic cancer treatment (Review). Int. J. Oncol. 2019, 54, 407–419. [Google Scholar] [CrossRef]
- Pal, S.K.; Gomes, A.; Dasgupta, S.C.; Gomes, A. Snake venom as therapeutic agents: From toxin to drug development. Indian J. Exp. Biol. 2002, 40, 1353–1358. [Google Scholar]
- Li, L.; Huang, J.; Lin, Y. Snake venoms in cancer therapy: Past, present and future. Toxins 2018, 10, 346. [Google Scholar] [CrossRef] [Green Version]
- Pistritto, G.; Trisciuoglio, D.; Ceci, C.; Garufi, A.; D’Orazi, G. Apoptosis as anticancer mechanism: Function and dysfunction of its modulators and targeted therapeutic strategies. Aging 2016, 8, 603. [Google Scholar] [CrossRef] [Green Version]
- Choi, S.H.; Park, J.Y.; Kang, W.; Kim, S.U.; Kim, D.Y.; Ahn, S.H.; Ro, S.W.; Han, K.H. Knockdown of HIF-1α and IL-8 induced apoptosis of hepatocellular carcinoma triggers apoptosis of vascular endothelial cells. Apoptosis 2016, 21, 85–95. [Google Scholar] [CrossRef]
- Shi, M.D.; Shiao, C.K.; Lee, Y.C.; Shih, Y.W. Apigenin, a dietary flavonoid, inhibits proliferation of human bladder cancer T-24 cells via blocking cell cycle progression and inducing apoptosis. Cancer Cell Int. 2015, 15, 33. [Google Scholar] [CrossRef] [PubMed] [Green Version]
- Juan, M.E.; Wenzel, U.; Daniel, H.; Planas, J.M. Resveratrol induces apoptosis through ROS-dependent mitochondria pathway in HT-29 human colorectal carcinoma cells. J. Agric. Food Chem. 2008, 56, 4813–4818. [Google Scholar] [CrossRef] [PubMed]
- Izidoro, L.F.M.; Sobrinho, J.C.; Mendes, M.M.; Costa, T.R.; Grabner, A.N.; Rodrigues, V.M.; da Silva, S.L.; Zanchi, F.B.; Zuliani, J.P.; Fernandes, C.F.C.; et al. Snake venom L-amino acid oxidases: Trends in pharmacology and biochemistry. BioMed Res. Int. 2014, 2014, 196754. [Google Scholar] [CrossRef] [PubMed] [Green Version]
- Brentnall, M.; Rodriguez-Menocal, L.; de Guevara, R.L.; Cepero, E.; Boise, L.H. Caspase-9, caspase-3 and caspase-7 have distinct roles during intrinsic apoptosis. BMC Cell Biol. 2013, 14, 32. [Google Scholar] [CrossRef] [Green Version]
- Ali, S.A.; Jackson, T.N.W.; Casewell, N.R.; Low, D.H.W.; Rossi, S.; Baumann, K.; Fathinia, B.; Visser, J.; Nouwens, A.; Hendrikx, I.; et al. Extreme venom variation in Middle Eastern vipers: A proteomics comparison of Eristicophis macmahonii, Pseudocerastes fieldi and Pseudocerastes persicus. J. Proteom. 2015, 116, 106–113. [Google Scholar] [CrossRef]
- Calderon, L.A.; Sobrinho, J.C.; Zaqueo, K.D.; de Moura, A.A.; Grabner, A.N.; Mazzi, M.V.; Marcussi, S.; Nomizo, A.; Fernandes, C.F.C.; Zuliani, J.P.; et al. Antitumoral activity of snake venom proteins: New trends in cancer therapy. BioMed Res. Int. 2014, 2014, 203639. [Google Scholar] [CrossRef] [Green Version]
- Al-Asmari, A.K.; Riyasdeen, A.; Al-Shahrani, M.H.; Islam, M. Snake venom causes apoptosis by increasing the reactive oxygen species in colorectal and breast cancer cell lines. OncoTargets Ther. 2016, 9, 6485–6498. [Google Scholar] [CrossRef] [Green Version]
- Pelicano, H.; Carney, D.; Huang, P. ROS stress in cancer cells and therapeutic implications. Drug Resist. Updates 2004, 7, 97–110. [Google Scholar] [CrossRef]
- Schumacker, P.T. Reactive oxygen species in cancer cells: Live by the sword, die by the sword. Cancer Cell 2006, 10, 175–176. [Google Scholar] [CrossRef] [Green Version]
- Aitken, J.B.; Naumovski, N.; Curry, B.; Grupen, C.G.; Gibb, Z.; Aitken, R.J. Characterization of an L-amino acid oxidase in equine spermatozoa. Biol. Reprod. 2015, 92, 1–13. [Google Scholar] [CrossRef] [PubMed]
- Lin, M.-T.; Juan, C.-Y.; Chang, K.-J.; Chen, W.-J.; Kuo, M.-L. IL-6 inhibits apoptosis and retains oxidative DNA lesions in human gastric cancer AGS cells through up-regulation of anti-apoptotic gene mcl-1. Carcinogenesis 2001, 22, 1947–1953. [Google Scholar] [CrossRef] [PubMed] [Green Version]
- Park, M.H.; Son, D.J.; Kwak, D.H.; Song, H.S.; Oh, K.W.; Yoo, H.S.; Lee, Y.M.; Song, M.J.; Hong, J.T. Snake venom toxin inhibits cell growth through induction of apoptosis in neuroblastoma cells. Arch. Pharmaca. Res. 2009, 32, 1545–1554. [Google Scholar] [CrossRef] [PubMed]
- Seyhan, M.F.; Yılmaz, E.; Timirci-Kahraman, Ö.; Saygılı, N.; Kısakesen, H.İ.; Gazioğlu, S.; Gören, A.C.; Eronat, A.P.; Begüm Ceviz, A.; Öztürk, T.; et al. Different propolis samples, phenolic content, and breast cancer cell lines: Variable cytotoxicity ranging from ineffective to potent. IUBMB Life 2019, 71, 619–631. [Google Scholar] [CrossRef]


Publisher’s Note: MDPI stays neutral with regard to jurisdictional claims in published maps and institutional affiliations. |
© 2021 by the authors. Licensee MDPI, Basel, Switzerland. This article is an open access article distributed under the terms and conditions of the Creative Commons Attribution (CC BY) license (https://creativecommons.org/licenses/by/4.0/).
Share and Cite
Abdelglil, M.I.; Abdallah, S.O.; El-Desouky, M.A.; Alfaifi, M.Y.; Elbehairi, S.E.I.; Mohamed, A.F. Evaluation of the Anticancer Potential of Crude, Irradiated Cerastes cerastes Snake Venom and Propolis Ethanolic Extract & Related Biological Alterations. Molecules 2021, 26, 7057. https://0-doi-org.brum.beds.ac.uk/10.3390/molecules26227057
Abdelglil MI, Abdallah SO, El-Desouky MA, Alfaifi MY, Elbehairi SEI, Mohamed AF. Evaluation of the Anticancer Potential of Crude, Irradiated Cerastes cerastes Snake Venom and Propolis Ethanolic Extract & Related Biological Alterations. Molecules. 2021; 26(22):7057. https://0-doi-org.brum.beds.ac.uk/10.3390/molecules26227057
Chicago/Turabian StyleAbdelglil, Mostafa I., Sanaa O. Abdallah, Mohamed A. El-Desouky, Mohammad Y. Alfaifi, Serag Eldin I. Elbehairi, and Aly F. Mohamed. 2021. "Evaluation of the Anticancer Potential of Crude, Irradiated Cerastes cerastes Snake Venom and Propolis Ethanolic Extract & Related Biological Alterations" Molecules 26, no. 22: 7057. https://0-doi-org.brum.beds.ac.uk/10.3390/molecules26227057