
Preparation and Optimization of PEGylated Nano Graphene Oxide-Based Delivery System for Drugs with Different Molecular Structures Using Design of Experiment (DoE)

 ,
,  , and
, and 
Abstract
:
1. Introduction
2. Results and Discussion
2.1. Particle Size Distribution Analysis and PDI
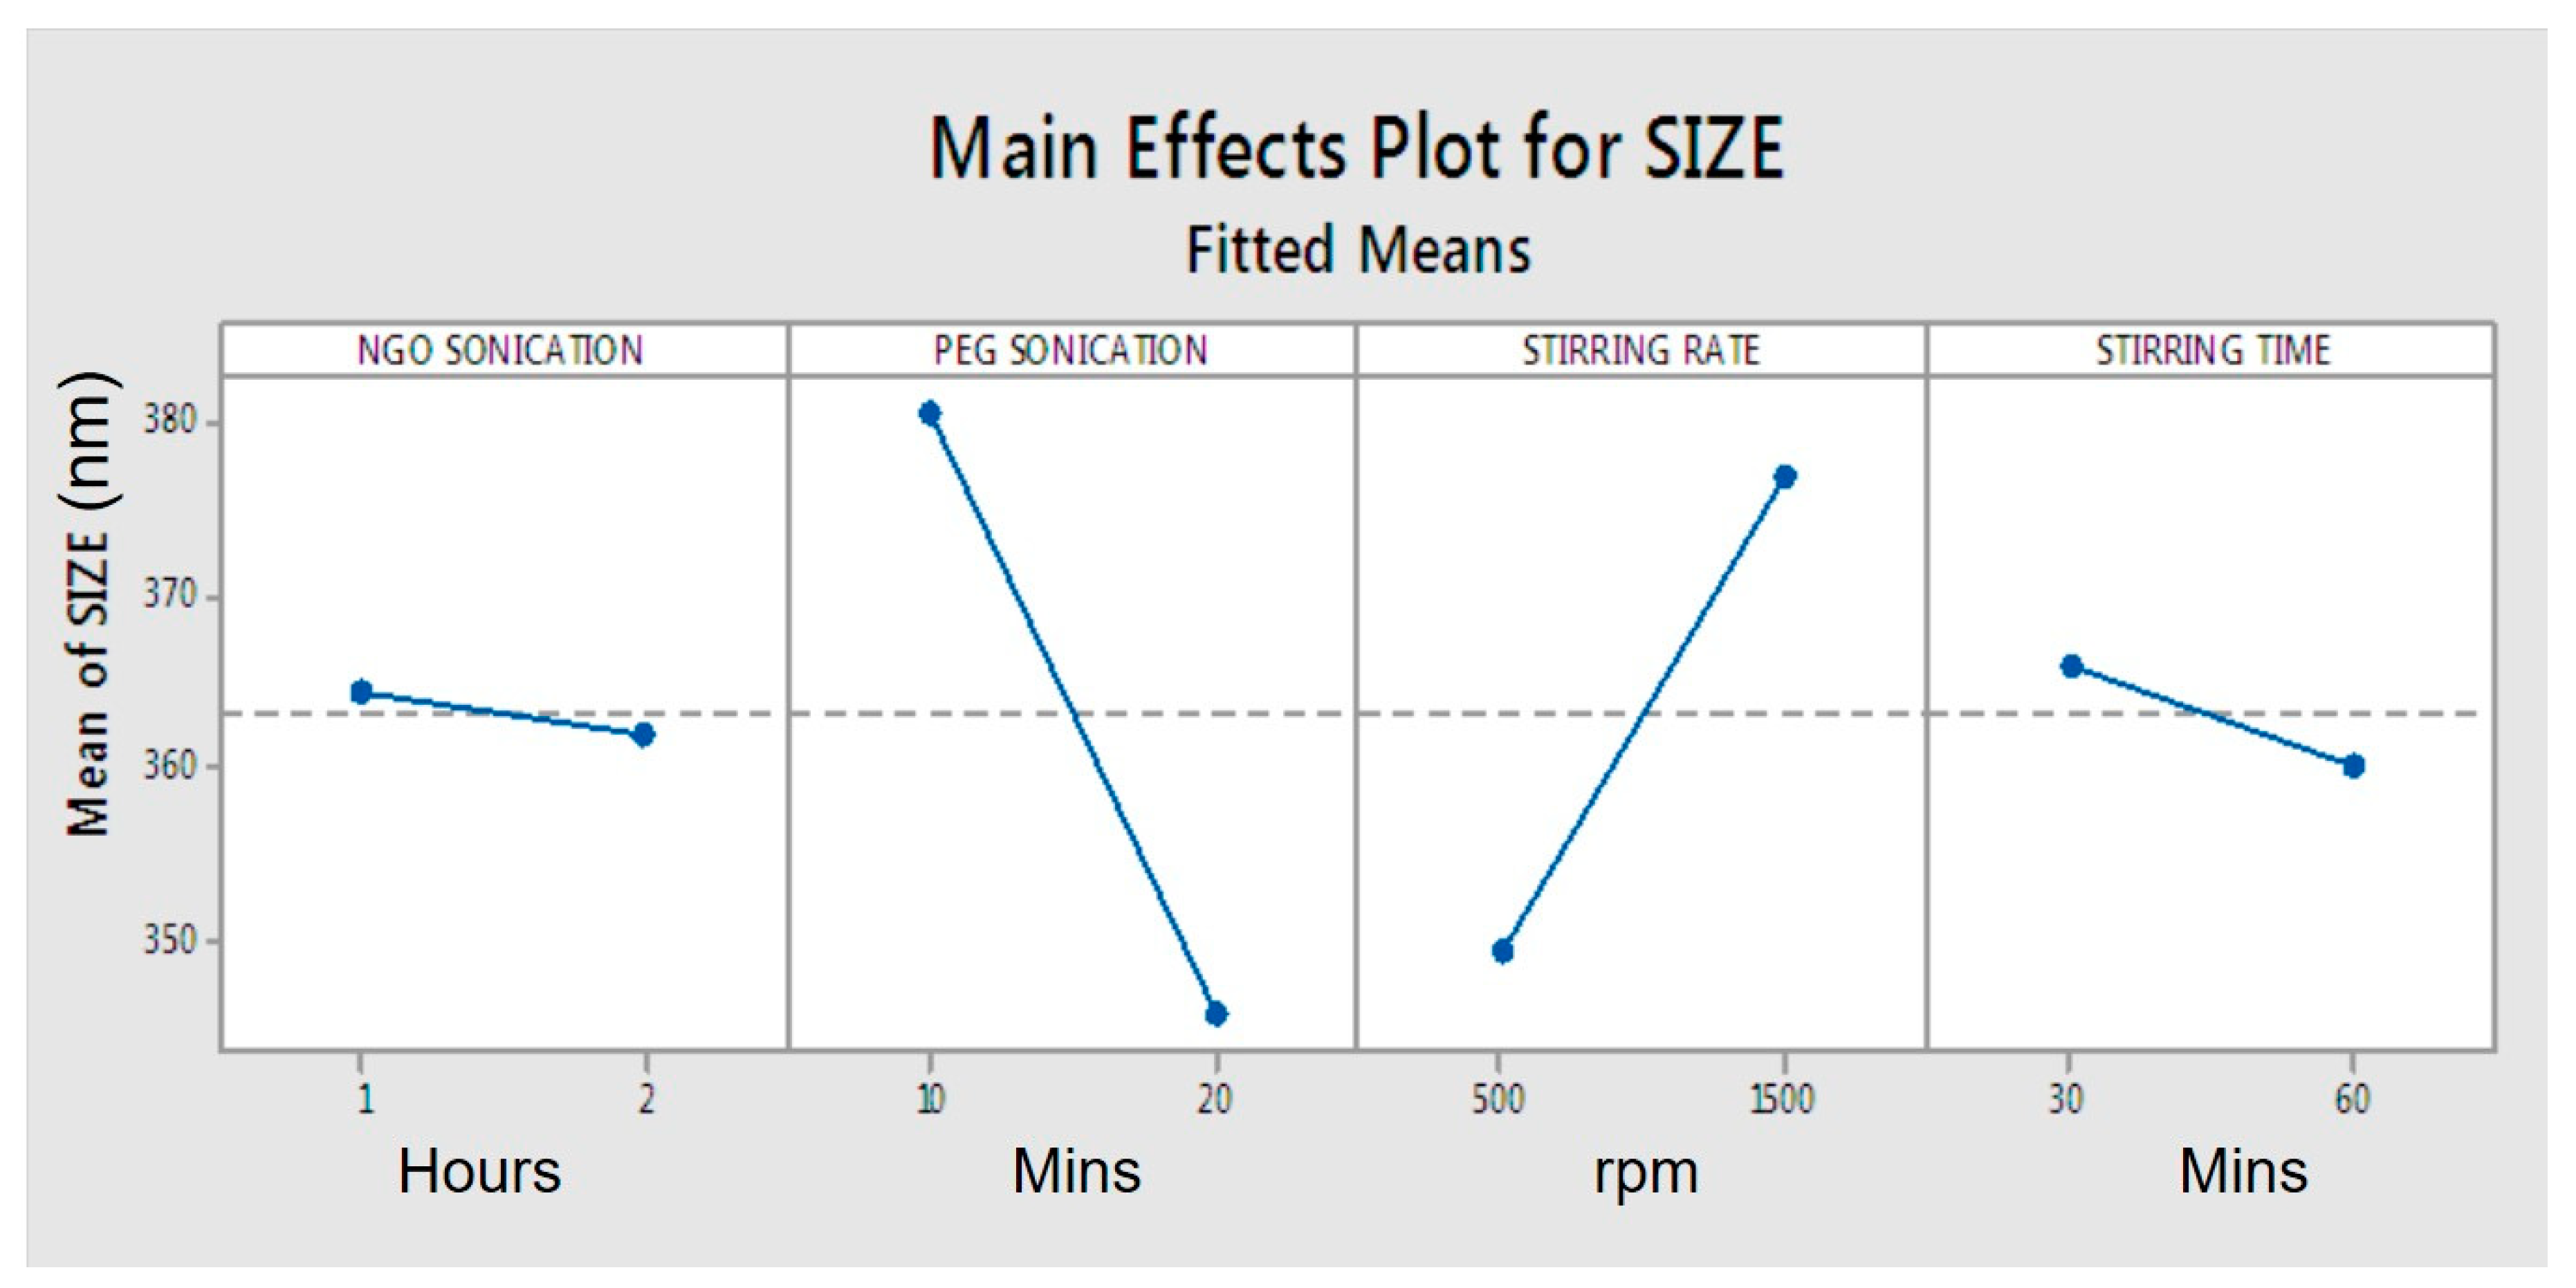
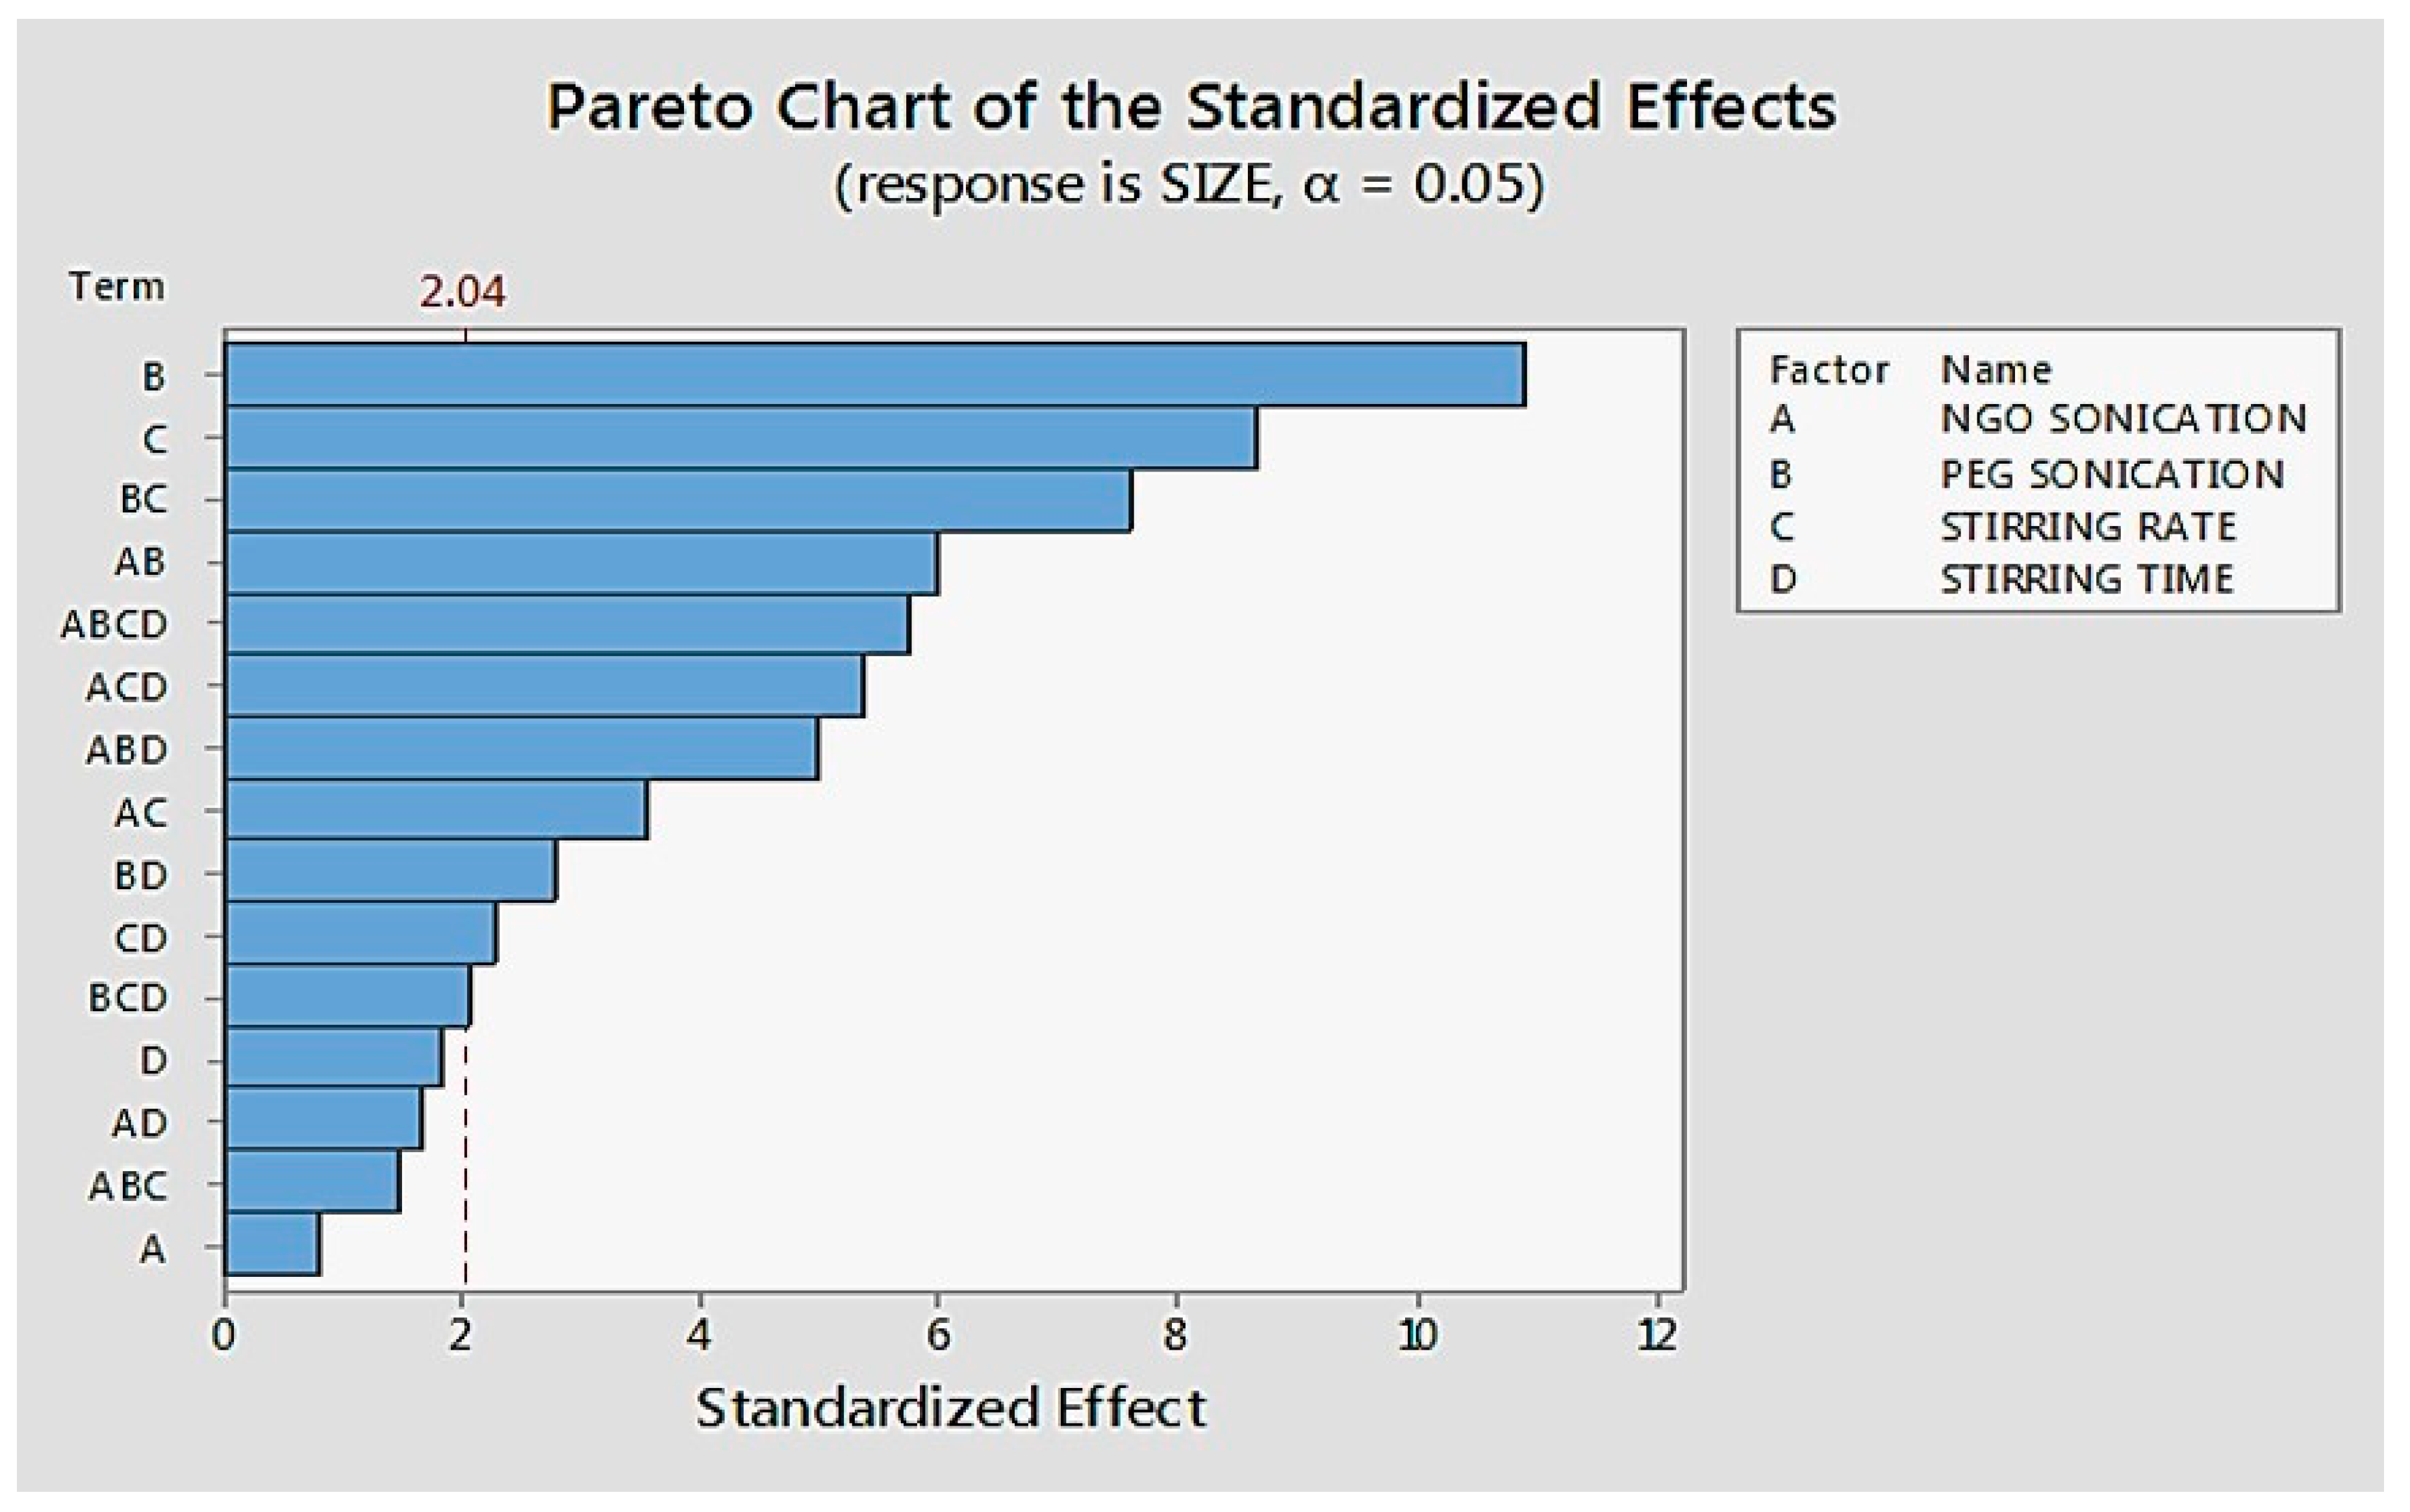
2.2. Effect of Process Parameters on the Average Size of GO Nanoparticles
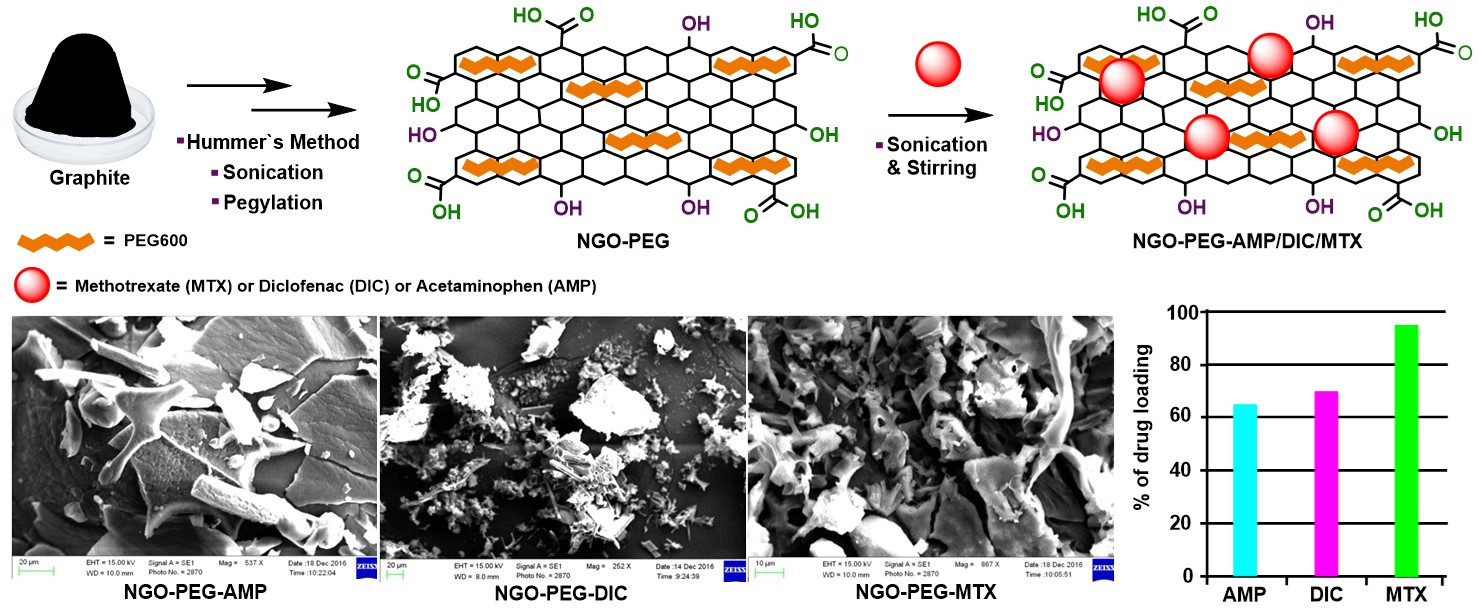
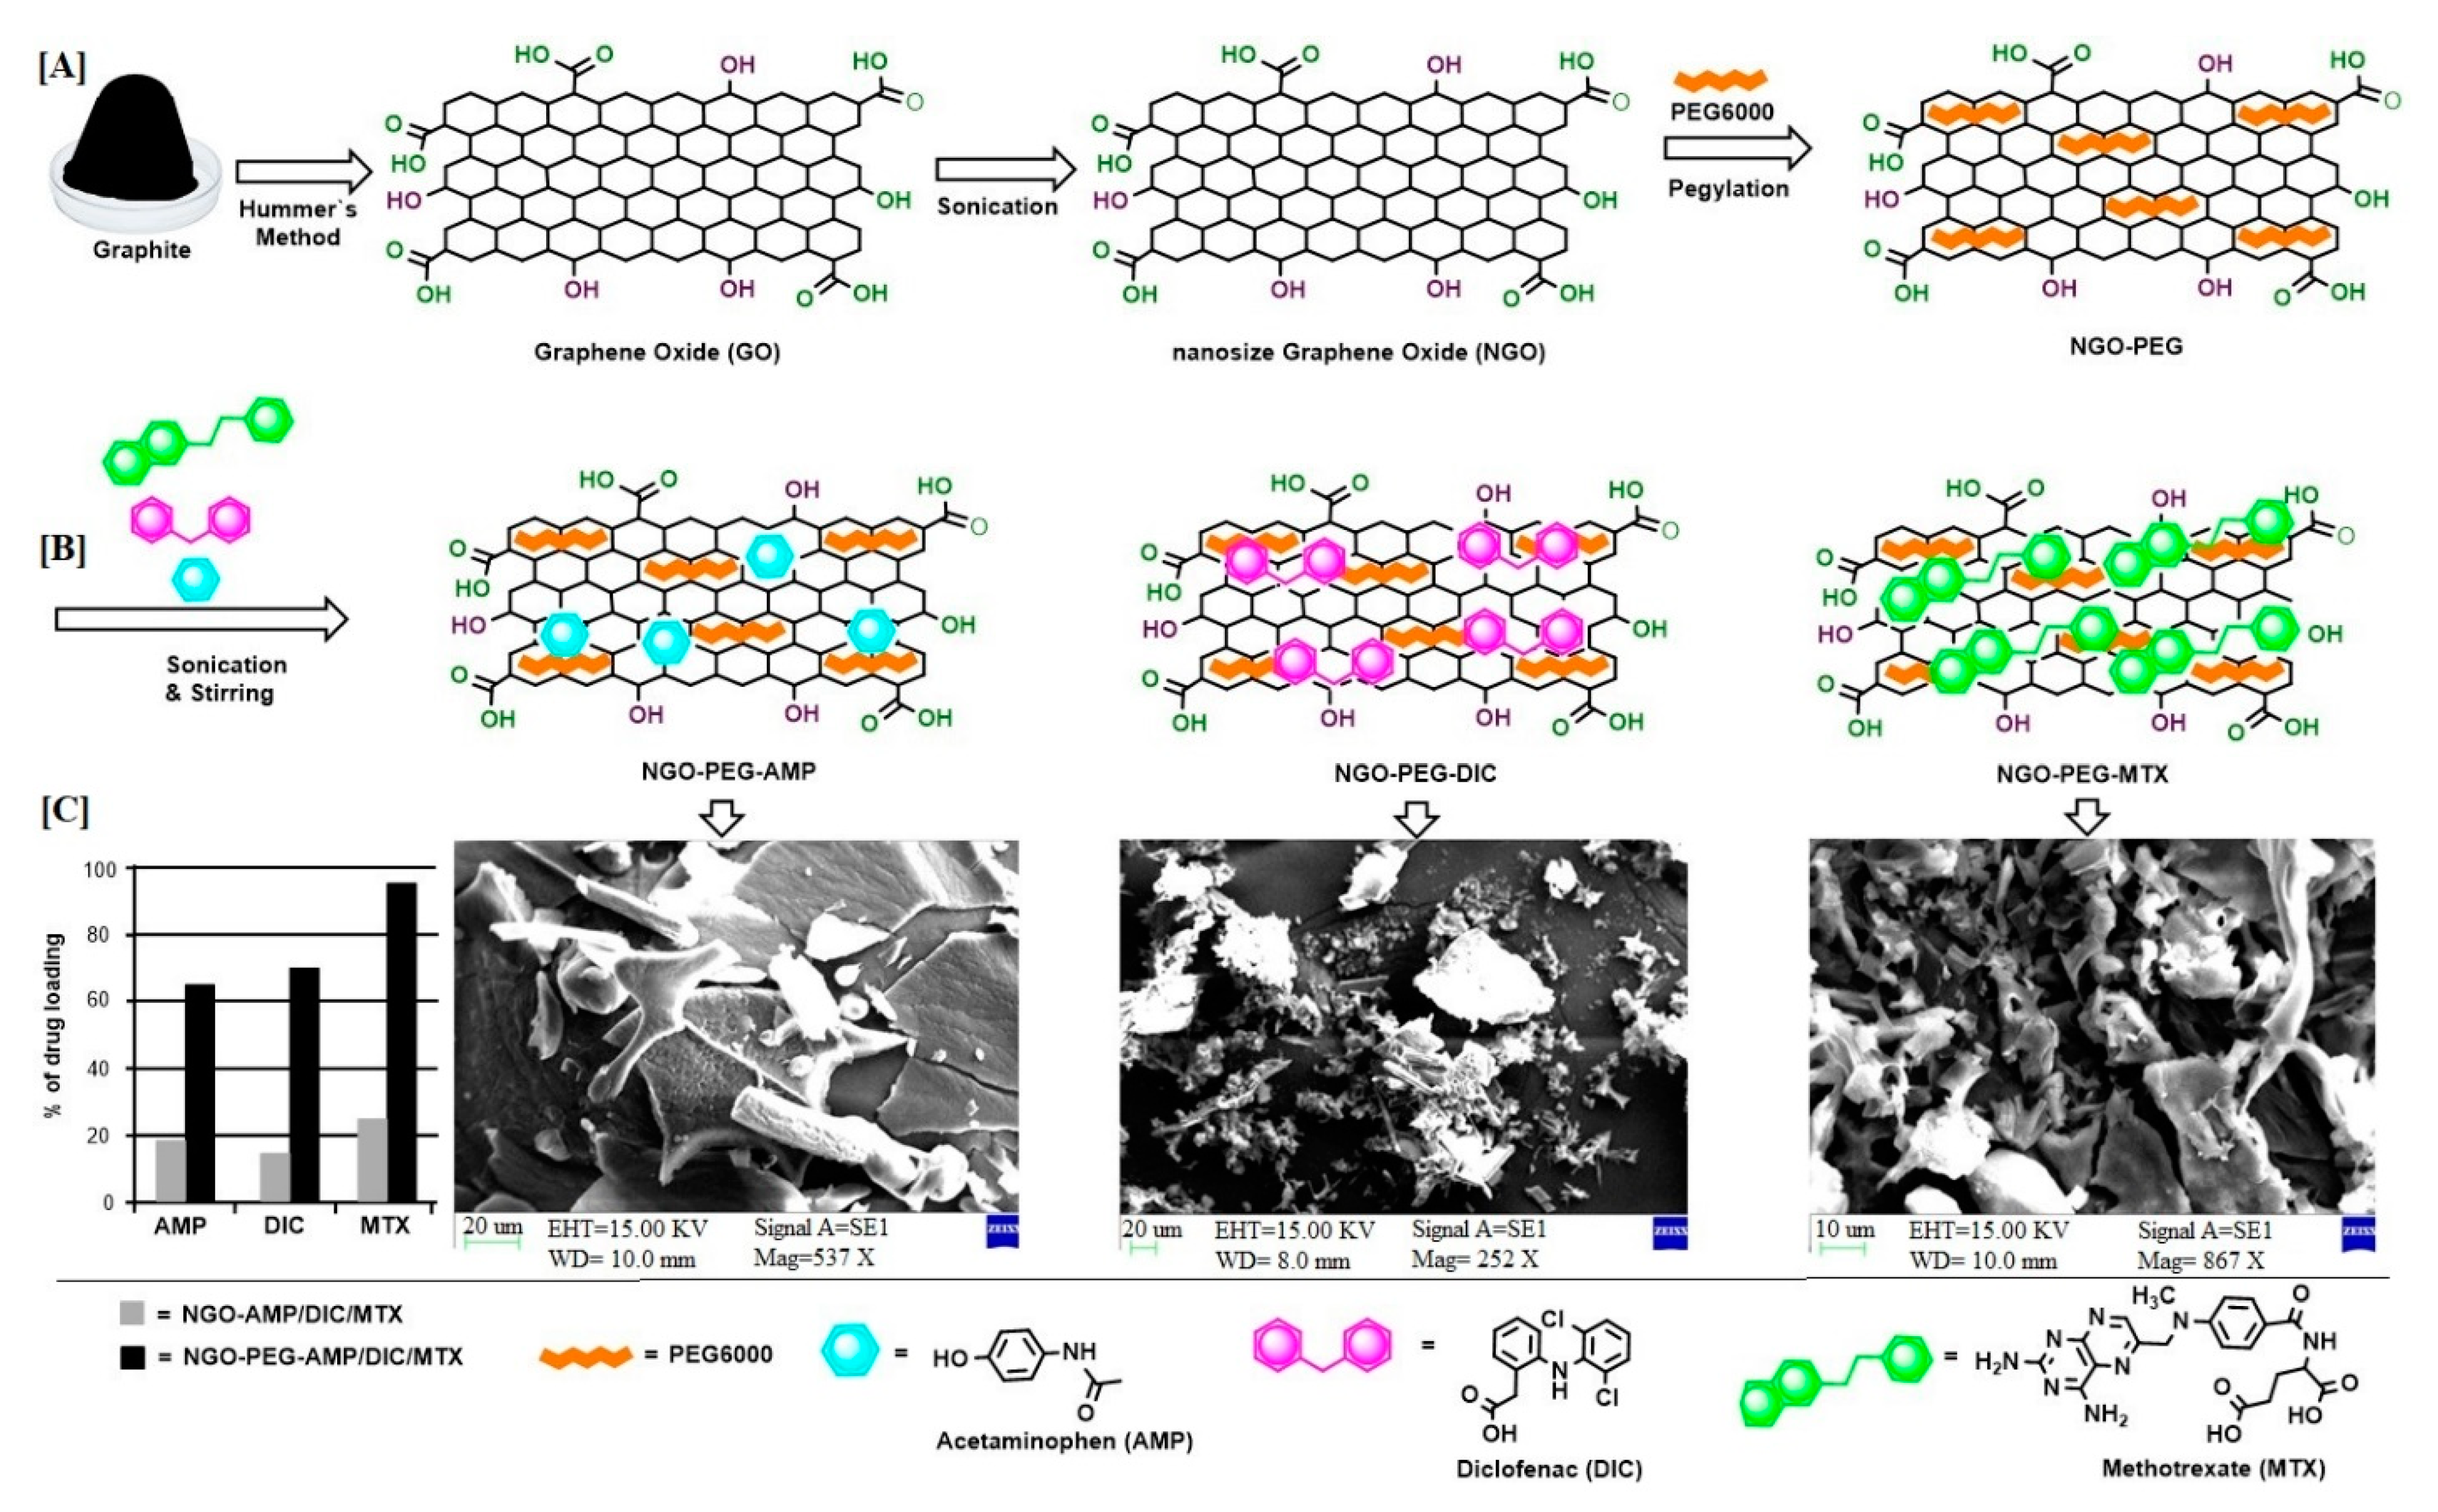
2.3. Drug Loading Efficiency
2.4. SEM
2.5. FTIR
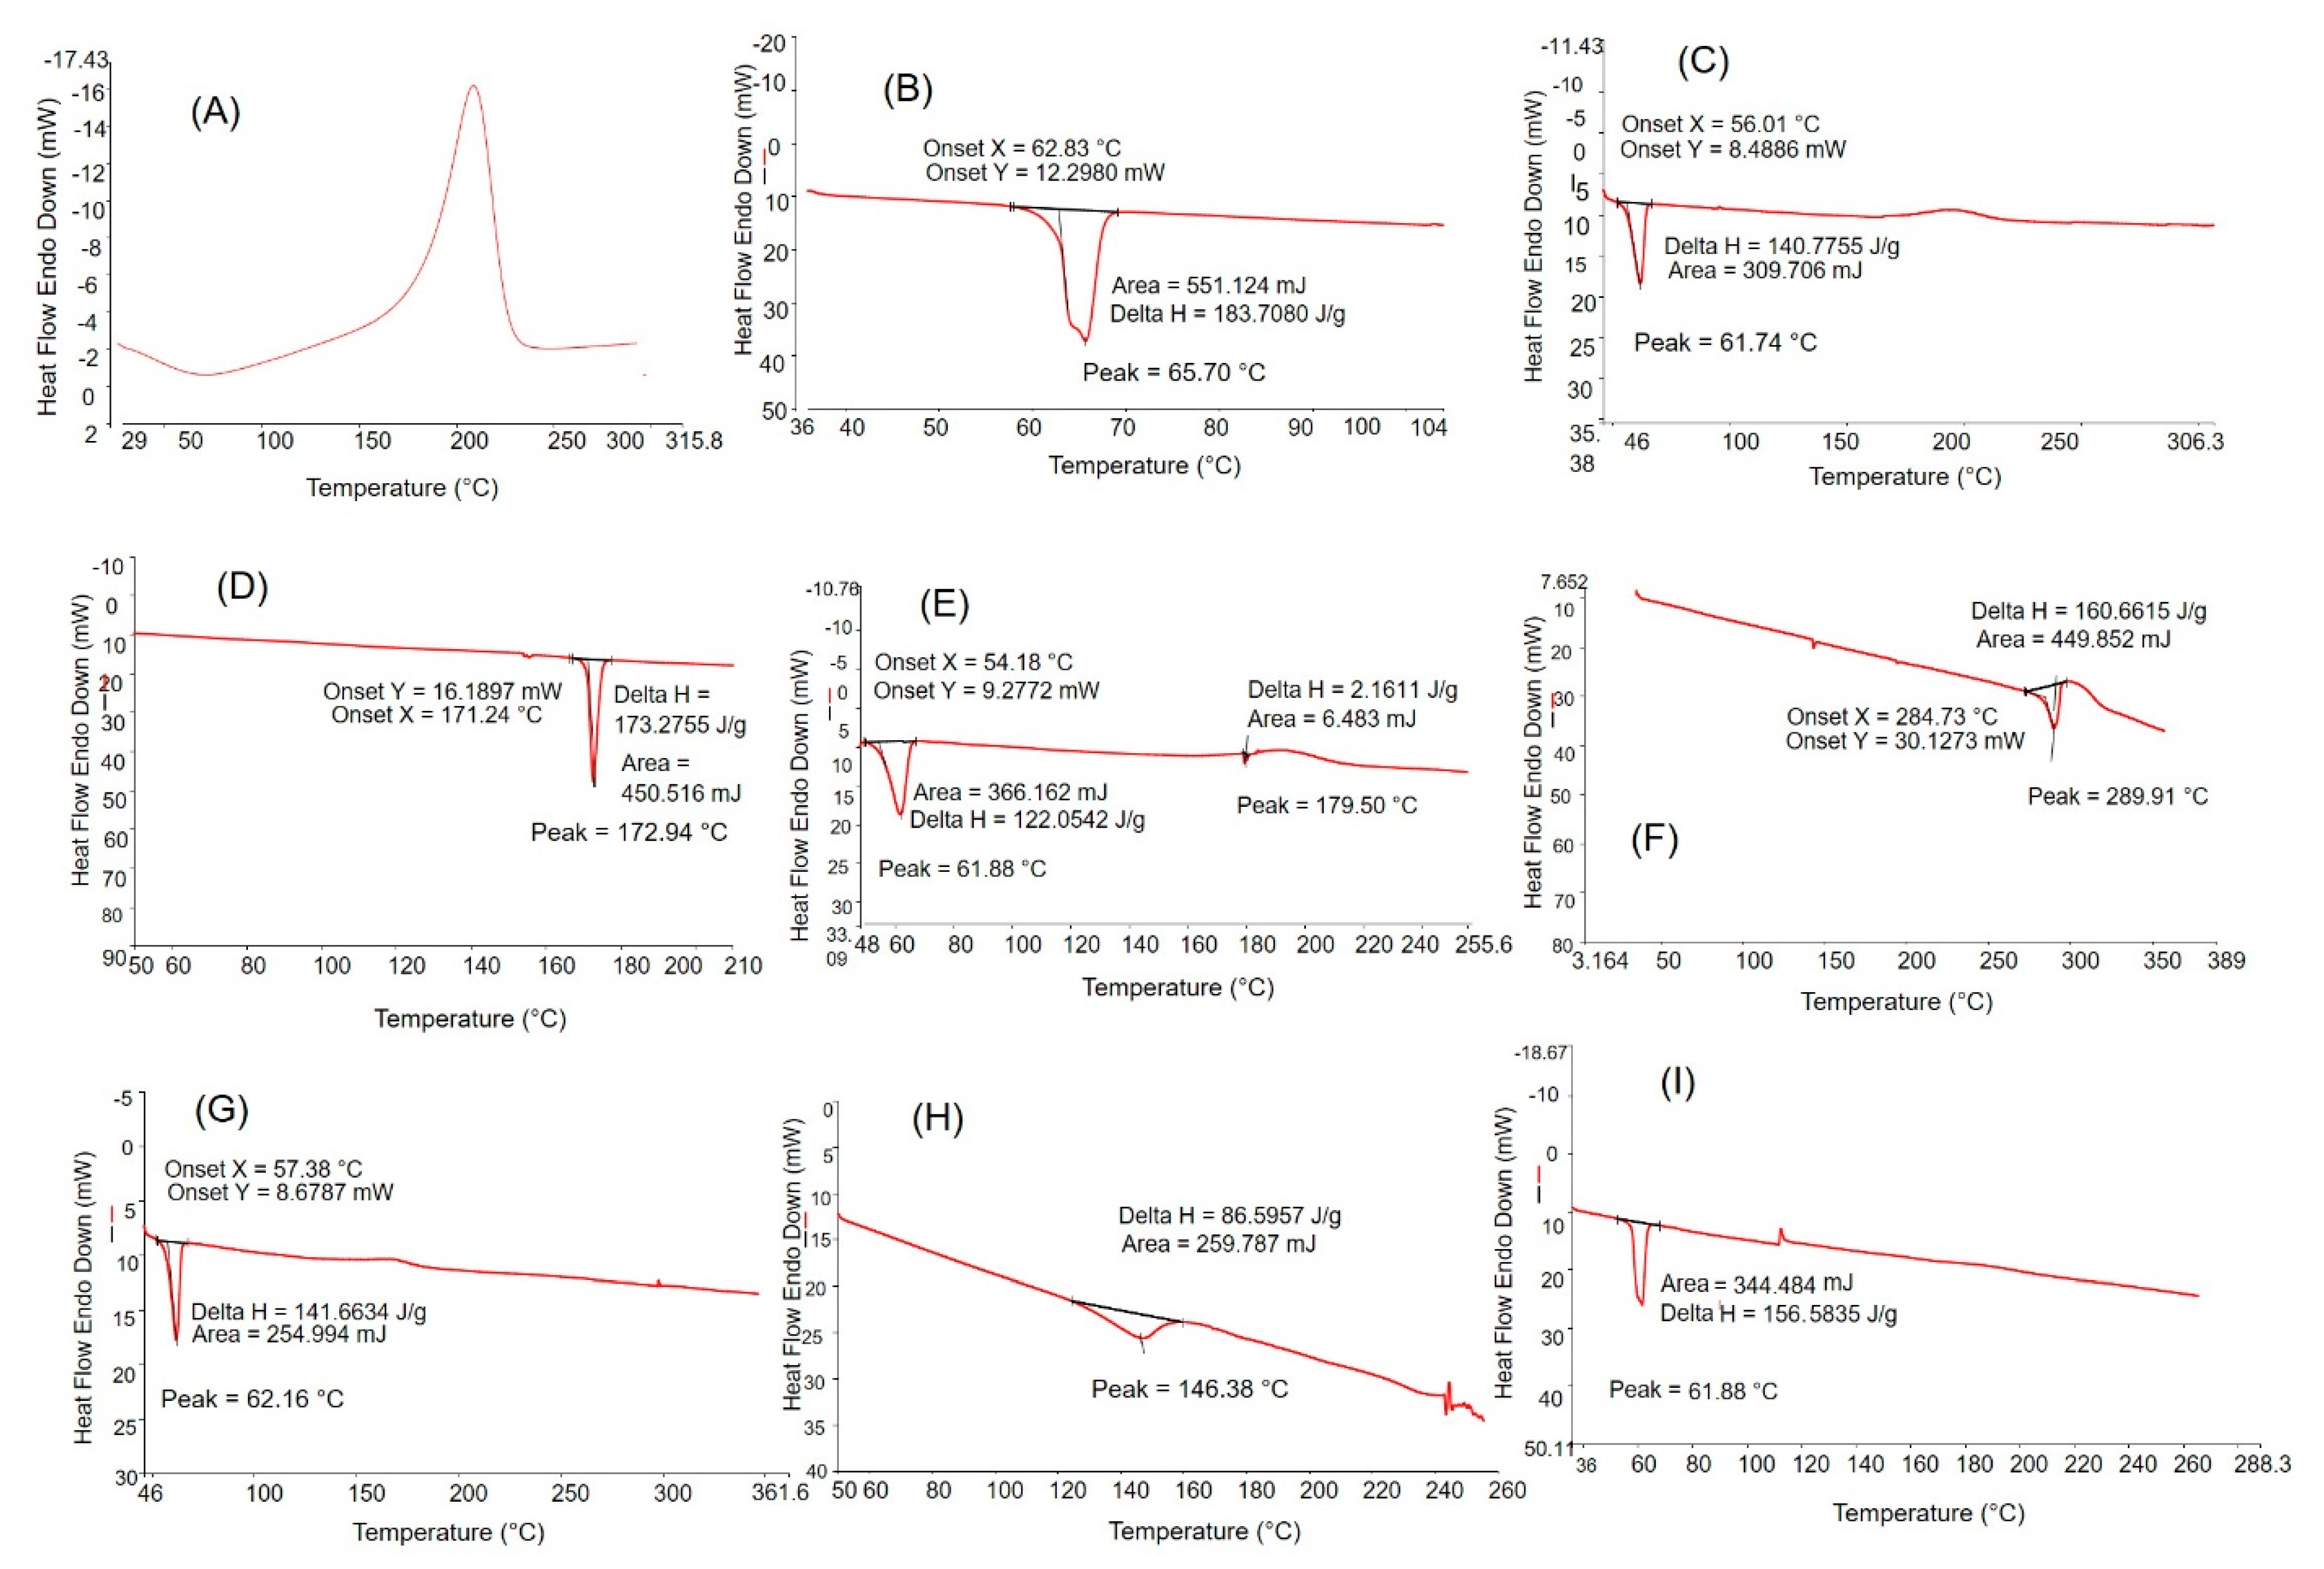
2.6. DSC
2.7. X-ray Diffraction (XRD)
3. Materials and Methods
3.1. Materials
3.2. Methods
3.2.1. Preparation of Graphene Oxide (GO)
3.2.2. Preparation of NGO Particles
3.2.3. Preparation of PEGylated NGO
3.2.4. Preparation Process of Drug Loaded PEGylated NGO Using Design of Experiment (DoE)
3.2.5. Drug Loading Efficiency
3.2.6. Particle Size Analysis and Determination of Polydispersity Index (PDI) by Dynamic Light Scattering (DLS)
3.2.7. Scanning Electron Microscopy (SEM)
3.2.8. Fourier Transform Infrared (FTIR) Spectroscopy
3.2.9. Differential Scanning Calorimetry (DSC)
3.2.10. X-ray Diffraction (XRD)
4. Conclusions
Author Contributions
Funding
Data Availability Statement
Acknowledgments
Conflicts of Interest
Sample Availability
References
- Tarn, D.; Ashley, C.E.; Xue, M.; Carnes, E.C.; Zink, J.I.; Brinker, C.J. Mesoporous silica nanoparticle nanocarriers: Biofunctionality and biocompatibility. Acc. Chem. Res. 2013, 46, 792–801. [Google Scholar] [CrossRef] [PubMed] [Green Version]
- Schwendener, R.A. Liposomes in Biology and Medicine, in Bio-applications of Nanoparticles. In Advances in Experimental Medicine and Biology; Springer: New York, NY, USA, 2017. [Google Scholar]
- Yin, F.; Yang, C.; Wang, Q.; Zeng, S.; Hu, R.; Lin, G.; Tian, J.; Hu, S.; Lan, R.F.; Yoon, H.S.; et al. A light-driven therapy of pancreatic adenocarcinoma using gold nanorods-based nanocarriers for co-delivery of doxorubicin and siRNA. Theranostics 2015, 5, 818–833. [Google Scholar] [CrossRef] [Green Version]
- Bekyarova, E.; Ni, Y.; Malarkey, E.B.; Montana, V.; McWilliams, J.L.; Haddon, R.C.; Parpura, V. Applications of carbon nanotubes in biotechnology and biomedicine. J. Biomed. Nanotechnol. 2005, 1, 3–17. [Google Scholar] [CrossRef] [Green Version]
- Iijima, S. Helical microtubules of graphitic carbon. Nature 1991, 354, 56–58. [Google Scholar] [CrossRef]
- Novoselov, K.S.; Geim, A.K.; Morozov, S.V.; Jiang, D.; Zhang, Y.; Dubonos, S.V.; Grigorieva, I.V.; Firsov, A.A. Electric field effect in atomically thin carbon films. Science 2004, 306, 666–669. [Google Scholar] [CrossRef] [PubMed] [Green Version]
- Ando, Y. Carbon nanotube: The inside story. J. Nanosci. Nanotechnol. 2010, 10, 3726–3738. [Google Scholar] [CrossRef] [Green Version]
- Loh, K.P.; Bao, Q.; Eda, G.; Chhowalla, M. Graphene oxide as a chemically tunable platform for optical applications. Nat. Chem. 2010, 2, 1015. [Google Scholar] [CrossRef] [PubMed]
- Bai, S.; Shen, X. Graphene–inorganic nanocomposites. RSC Adv. 2012, 2, 64–98. [Google Scholar] [CrossRef]
- Markovic, Z.M.; Harhaji-Trajkovic, L.M.; Todorovic-Markovic, B.M.; Kepić, D.P.; Arsikin, K.M.; Jovanović, S.P.; Pantovic, A.C.; Dramićanin, M.D.; Trajkovic, V.S. In vitro comparison of the photothermal anticancer activity of graphene nanoparticles and carbon nanotubes. Biomaterials 2011, 32, 1121–1129. [Google Scholar] [CrossRef] [PubMed]
- Liu, Z.; Robinson, J.T.; Sun, X.; Dai, H. PEGylated nanographene oxide for delivery of water-insoluble cancer drugs. J. Am. Chem. Soc. 2008, 130, 10876–10877. [Google Scholar] [CrossRef] [Green Version]
- Zhou, K.; Zhu, Y.; Yang, X.; Li, C. One-pot preparation of graphene/Fe3O4 composites by a solvothermal reaction. New J. Chem. 2010, 34, 2950–2955. [Google Scholar] [CrossRef]
- Pan, Y.; Sahoo, N.G.; Li, L. The application of graphene oxide in drug delivery. Expert Opin. Drug Deliv. 2012, 9, 1365–1376. [Google Scholar] [CrossRef] [PubMed]
- Jin, Z.; Nackashi, D.; Lu, W.; Kittrell, C.; Tour, J.M. Decoration, migration, and aggregation of palladium nanoparticles on graphene sheets. Chem. Mater. 2010, 22, 5695–5699. [Google Scholar] [CrossRef]
- Yu, S.; Wang, X.; Yao, W.; Wang, J.; Ji, Y.; Ai, Y.; Alsaedi, A.; Hayat, T.; Wang, X. Macroscopic, spectroscopic, and theoretical investigation for the interaction of phenol and naphthol on reduced graphene oxide. Env. Sci. Technol. 2017, 51, 3278–3286. [Google Scholar] [CrossRef]
- Li, C.; Wang, X.; Chen, F.; Zhang, C.; Zhi, X.; Wang, K.; Cui, D. The antifungal activity of graphene oxide–silver nanocomposites. Biomaterials 2013, 34, 3882–3890. [Google Scholar] [CrossRef]
- Sanchez, V.C.; Jachak, A.; Hurt, R.H.; Kane, A.B. Biological interactions of graphene-family nanomaterials: An interdisciplinary review. Chem. Res. Toxicol. 2012, 25, 15–34. [Google Scholar] [CrossRef] [Green Version]
- Das, S.; Sudhagar, P.; Kang, Y.S.; Choi, W. Graphene synthesis and application for solar cells. J. Mater. Res. Technol. 2014, 29, 299–319. [Google Scholar] [CrossRef] [Green Version]
- Xu, X.; Zhang, Z.; Qiu, L.; Zhuang, J.; Zhang, L.; Wang, H.; Liao, C.; Song, H.; Qiao, R.; Gao, P. Ultrafast growth of single-crystal graphene assisted by a continuous oxygen supply. Nat. Nanotechnol. 2016, 11, 930–935. [Google Scholar] [CrossRef] [PubMed]
- Zhang, X.; Deng, L.; Huang, C.; Zhang, J.; Hou, X.; Wu, P.; Liu, J. Frontispiece: Photosensitization of molecular oxygen on graphene oxide for ultrasensitive signal amplification. Chem. Eur. J. Chem. 2018, 24, 2602–2608. [Google Scholar] [CrossRef] [PubMed]
- Cao, T.; You, P.; Zhou, X.; Luo, J.; Xu, X.; Zhou, Z.; Yang, S.; Zhang, Y.; Yang, H.; Wang, M. Visualization of size-dependent tumour retention of PEGylated nanographene oxide via SPECT imaging. J. Mater. Chem. B 2016, 4, 6446–6453. [Google Scholar] [CrossRef]
- Tu, Z.; Achazi, K.; Schulz, A.; Mülhaupt, R.; Thierbach, S.; Rühl, E.; Adeli, M.; Haag, R. Combination of surface charge and size controls the cellular uptake of functionalized graphene sheets. Adv. Funct. Mater. 2017, 27, 1701837. [Google Scholar] [CrossRef]
- Reina, G.; González-Domínguez, J.M.; Criado, A.; Vázquez, E.; Bianco, A.; Prato, M. Promises, facts and challenges for graphene in biomedical applications. Chem. Soc. Rev. 2017, 46, 4400–4416. [Google Scholar] [CrossRef] [Green Version]
- Bitounis, D.; Ali-Boucetta, H.; Hong, B.H.; Min, D.H.; Kostarelos, K. Prospects and challenges of graphene in biomedical applications. Adv. Mater. 2013, 25, 2258–2268. [Google Scholar] [CrossRef]
- Cheng, S.-J.; Chiu, H.-Y.; Kumar, P.V.; Hsieh, K.Y.; Yang, J.-W.; Lin, Y.-R.; Shen, Y.-C.; Chen, G.-Y. Simultaneous drug delivery and cellular imaging using graphene oxide. Biomater. Sci. 2018, 6, 813–819. [Google Scholar] [CrossRef] [PubMed]
- Chai, D.; Hao, B.; Hu, R.; Zhang, F.; Yan, J.; Sun, Y.; Huang, X.; Zhang, Q.; Jiang, H. Delivery of oridonin and methotrexate via PEGylated graphene oxide. ACS Appl. Mater. Interfaces 2019, 11, 22915–22924. [Google Scholar] [CrossRef]
- Xu, Z.; Zhu, S.; Wang, M.; Li, Y.; Shi, P.; Huang, X. Delivery of paclitaxel using PEGylated graphene oxide as a nanocarrier. Acs Appl. Mater. Interfaces 2015, 7, 1355–1363. [Google Scholar] [CrossRef]
- Turecek, P.L.; Bossard, M.J.; Schoetens, F.; Ivens, I.A. PEGylation of biopharmaceuticals: A review of chemistry and nonclinical safety information of approved drugs. J. Pharm. Sci. 2016, 105, 460–475. [Google Scholar] [CrossRef] [Green Version]
- Ibrahim, K.; Starck, P.; Löfgren, B.; Seppälä, J. Synthesis and characterization of amphiphilic triblock copolymers by iron-mediated atom transfer radical polymerization. J. Polym. Sci. Part A Polym. Chem. 2005, 43, 5049–5061. [Google Scholar] [CrossRef]
- Hooftman, G.; Herman, S.; Schacht, E. Poly (ethylene glycol) s with reactive endgroups. II. Practical consideration for the preparation of protein-PEG conjugates. J. Bioact. Compat. Polym. 1996, 11, 135–159. [Google Scholar]
- Liu, Y.; Yu, D.; Zeng, C.; Miao, Z.; Dai, L. Biocompatible graphene oxide-based glucose biosensors. Langmuir 2010, 26, 6158–6160. [Google Scholar] [CrossRef]
- Rahmanian, N.; Hamishehkar, H.; Dolatabadi, J.E.N.; Arsalani, N. Nano graphene oxide: A novel carrier for oral delivery of flavonoids. Colloids Surf. B 2014, 123, 331–338. [Google Scholar] [CrossRef] [PubMed]
- Yu, S.; Wang, X.; Ai, Y.; Tan, X.; Hayat, T.; Hu, W.; Wang, X. Experimental and theoretical studies on competitive adsorption of aromatic compounds on reduced graphene oxides. J. Mater. Chem. A 2016, 4, 5654–5662. [Google Scholar] [CrossRef]
- Tang, H.; Zhao, Y.; Shan, S.; Yang, X.; Liu, D.; Cui, F.; Xing, B. Theoretical insight into the adsorption of aromatic compounds on graphene oxide. Environ. Sci. Nano 2018, 5, 2357–2367. [Google Scholar] [CrossRef]
- Rochefort, A.; Wuest, J.D. Interaction of substituted aromatic compounds with graphene. Langmuir 2009, 25, 210–215. [Google Scholar] [CrossRef] [PubMed]
- Shariare, M.H.; Leusen, F.J.J.; de Matas, M.; York, P.; Anwar, J. Prediction of the mechanical behaviour of crystalline solids. Pharm. Res. 2012, 29, 319–331. [Google Scholar] [CrossRef]
- Szabó, T.; Berkesi, O.; Forgó, P.; Josepovits, K.; Sanakis, Y.; Petridis, D.; Dékány, I. Evolution of surface functional groups in a series of progressively oxidized graphite oxides. Chem. Mater. 2006, 18, 2740–2749. [Google Scholar] [CrossRef]
- Sun, X.; Liu, Z.; Welsher, K.; Robinson, J.T.; Goodwin, A.; Zaric, S.; Dai, H. Nano-graphene oxide for cellular imaging and drug delivery. Nano Res. 2008, 1, 203–212. [Google Scholar] [CrossRef] [Green Version]
- Patil, M.P.; Gaikwad, N.J. Characterization of gliclazide-polyethylene glycol solid dispersion and its effect on dissolution. Braz. J. Pharm. Sci. 2011, 47, 161–166. [Google Scholar]
- Traina, M.; Pegoretti, A. In situ reduction of graphene oxide dispersed in a polymer matrix. J. Nanopart. Res. 2012, 14, 801. [Google Scholar] [CrossRef]
- Biswal, S.; Sahoo, J.; Murthy, P.N.; Giradkar, R.P.; Avari, J.G. Enhancement of dissolution rate of gliclazide using solid dispersions with polyethylene glycol 6000. Aaps Pharmscitech 2008, 9, 563–570. [Google Scholar] [CrossRef] [Green Version]
- Doshi, D.H.; Ravis, W.R.; Betageri, G.V. Carbamazepine and polyethylene glycol solid dispersions: Preparation, in vitro dissolution, and characterization. Drug Dev. Ind. Pharm. 1997, 23, 1167–1176. [Google Scholar] [CrossRef]
- Shin, S.-C.; Kim, J. Physicochemical characterization of solid dispersion of furosemide with TPGS. Int. J. Pharm. 2003, 251, 79–84. [Google Scholar] [CrossRef]
- Damian, F.; Blaton, N.; Naesens, L.; Balzarini, J.; Kinget, R.; Augustijns, P.; Van den Mooter, G. Physicochemical characterization of solid dispersions of the antiviral agent UC-781 with polyethylene glycol 6000 and Gelucire 44/14. Eur. J. Pharm. Sci. 2000, 10, 311–322. [Google Scholar] [CrossRef]
- Nakajima, T.; Mabuchi, A.; Hagiwara, R. A new structure model of graphite oxide. Carbon 1988, 26, 357–361. [Google Scholar] [CrossRef]
- Valizadeh, H.; Nokhodchi, A.; Qarakhani, N.; Zakeri-Milani, P.; Azarmi, S.; Hassanzadeh, D.; Löbenberg, R. Physicochemical characterization of solid dispersions of indomethacin with PEG 6000, Myrj 52, Lactose, Sorbitol, Dextrin, and Eudragit® E100. Drug Dev. Ind. Pharm. 2004, 30, 303–317. [Google Scholar] [CrossRef] [PubMed]
- Kusrini, E.; Suhrowati, A.; Usman, A.; Degirmenci, V.; Khalil, M. Synthesis and characterization of graphite oxide, graphene oxide and reduced graphene oxide from graphite waste using modified Hummers’s method and zinc as reducing agent. Int. J. Technol. 2019, 10, 1093. [Google Scholar] [CrossRef] [Green Version]


| No. | NGO Sonication Time (hrs) | PEGylation Sonication Time (mins) | Stirring Time (mins) | Stirring Rate (rpm) | Average Size (nm) | Standard Deviation (SD) | PDI |
|---|---|---|---|---|---|---|---|
| 1 | 2 | 20 | 30 | 1500 | 209.1 | 3.0 | 0.18 |
| 2 | 2 | 20 | 30 | 500 | 1129.0 | 35.4 | 0.76 |
| 3 | 2 | 10 | 30 | 1500 | 880.8 | 31.2 | 0.40 |
| 4 | 2 | 10 | 30 | 500 | 1356.0 | 56.0 | 0.83 |
| 5 | 1 | 20 | 30 | 1500 | 278.3 | 8.3 | 0.37 |
| 6 | 1 | 20 | 30 | 500 | 641.9 | 14.3 | 0.26 |
| 7 | 1 | 10 | 30 | 1500 | 749.9 | 27.8 | 0.63 |
| 8 | 1 | 10 | 30 | 500 | 834.5 | 21.0 | 0.80 |
| Batch | Sonication Duration to Produce Nano GO | Sonication Duration to Produce PEGylated Nano GO | Stirring Rate | Stirring Time |
|---|---|---|---|---|
| 1 | H | H | H | H |
| 2 | H | H | H | L |
| 3 | H | H | L | L |
| 4 | H | L | L | L |
| 5 | L | L | L | L |
| 6 | L | L | L | H |
| 7 | L | L | H | H |
| 8 | L | H | H | H |
| 9 | H | L | H | H |
| 10 | H | L | H | L |
| 11 | H | L | L | H |
| 12 | L | H | L | H |
| 13 | L | H | H | L |
| 14 | L | L | H | L |
| 15 | H | H | L | H |
| 16 | L | H | L | L |
Publisher’s Note: MDPI stays neutral with regard to jurisdictional claims in published maps and institutional affiliations. |
© 2021 by the authors. Licensee MDPI, Basel, Switzerland. This article is an open access article distributed under the terms and conditions of the Creative Commons Attribution (CC BY) license (http://creativecommons.org/licenses/by/4.0/).
Share and Cite
Shariare, M.H.; Masum, A.-A.; Alshehri, S.; Alanazi, F.K.; Uddin, J.; Kazi, M. Preparation and Optimization of PEGylated Nano Graphene Oxide-Based Delivery System for Drugs with Different Molecular Structures Using Design of Experiment (DoE). Molecules 2021, 26, 1457. https://0-doi-org.brum.beds.ac.uk/10.3390/molecules26051457
Shariare MH, Masum A-A, Alshehri S, Alanazi FK, Uddin J, Kazi M. Preparation and Optimization of PEGylated Nano Graphene Oxide-Based Delivery System for Drugs with Different Molecular Structures Using Design of Experiment (DoE). Molecules. 2021; 26(5):1457. https://0-doi-org.brum.beds.ac.uk/10.3390/molecules26051457
Chicago/Turabian StyleShariare, Mohammad Hossain, Abdullah-Al Masum, Sultan Alshehri, Fars K. Alanazi, Jamal Uddin, and Mohsin Kazi. 2021. "Preparation and Optimization of PEGylated Nano Graphene Oxide-Based Delivery System for Drugs with Different Molecular Structures Using Design of Experiment (DoE)" Molecules 26, no. 5: 1457. https://0-doi-org.brum.beds.ac.uk/10.3390/molecules26051457