
Equilibrium Studies of Iron (III) Complexes with Either Pyrazine, Quinoxaline, or Phenazine and Their Catecholase Activity in Methanol

Abstract
:
1. Introduction
2. Results and Discussion
2.1. Materials and Methods
2.2. Formation Constants of the Iron (III) Complexes with -Pyrazine, -Quinoxaline, and -Phenazine
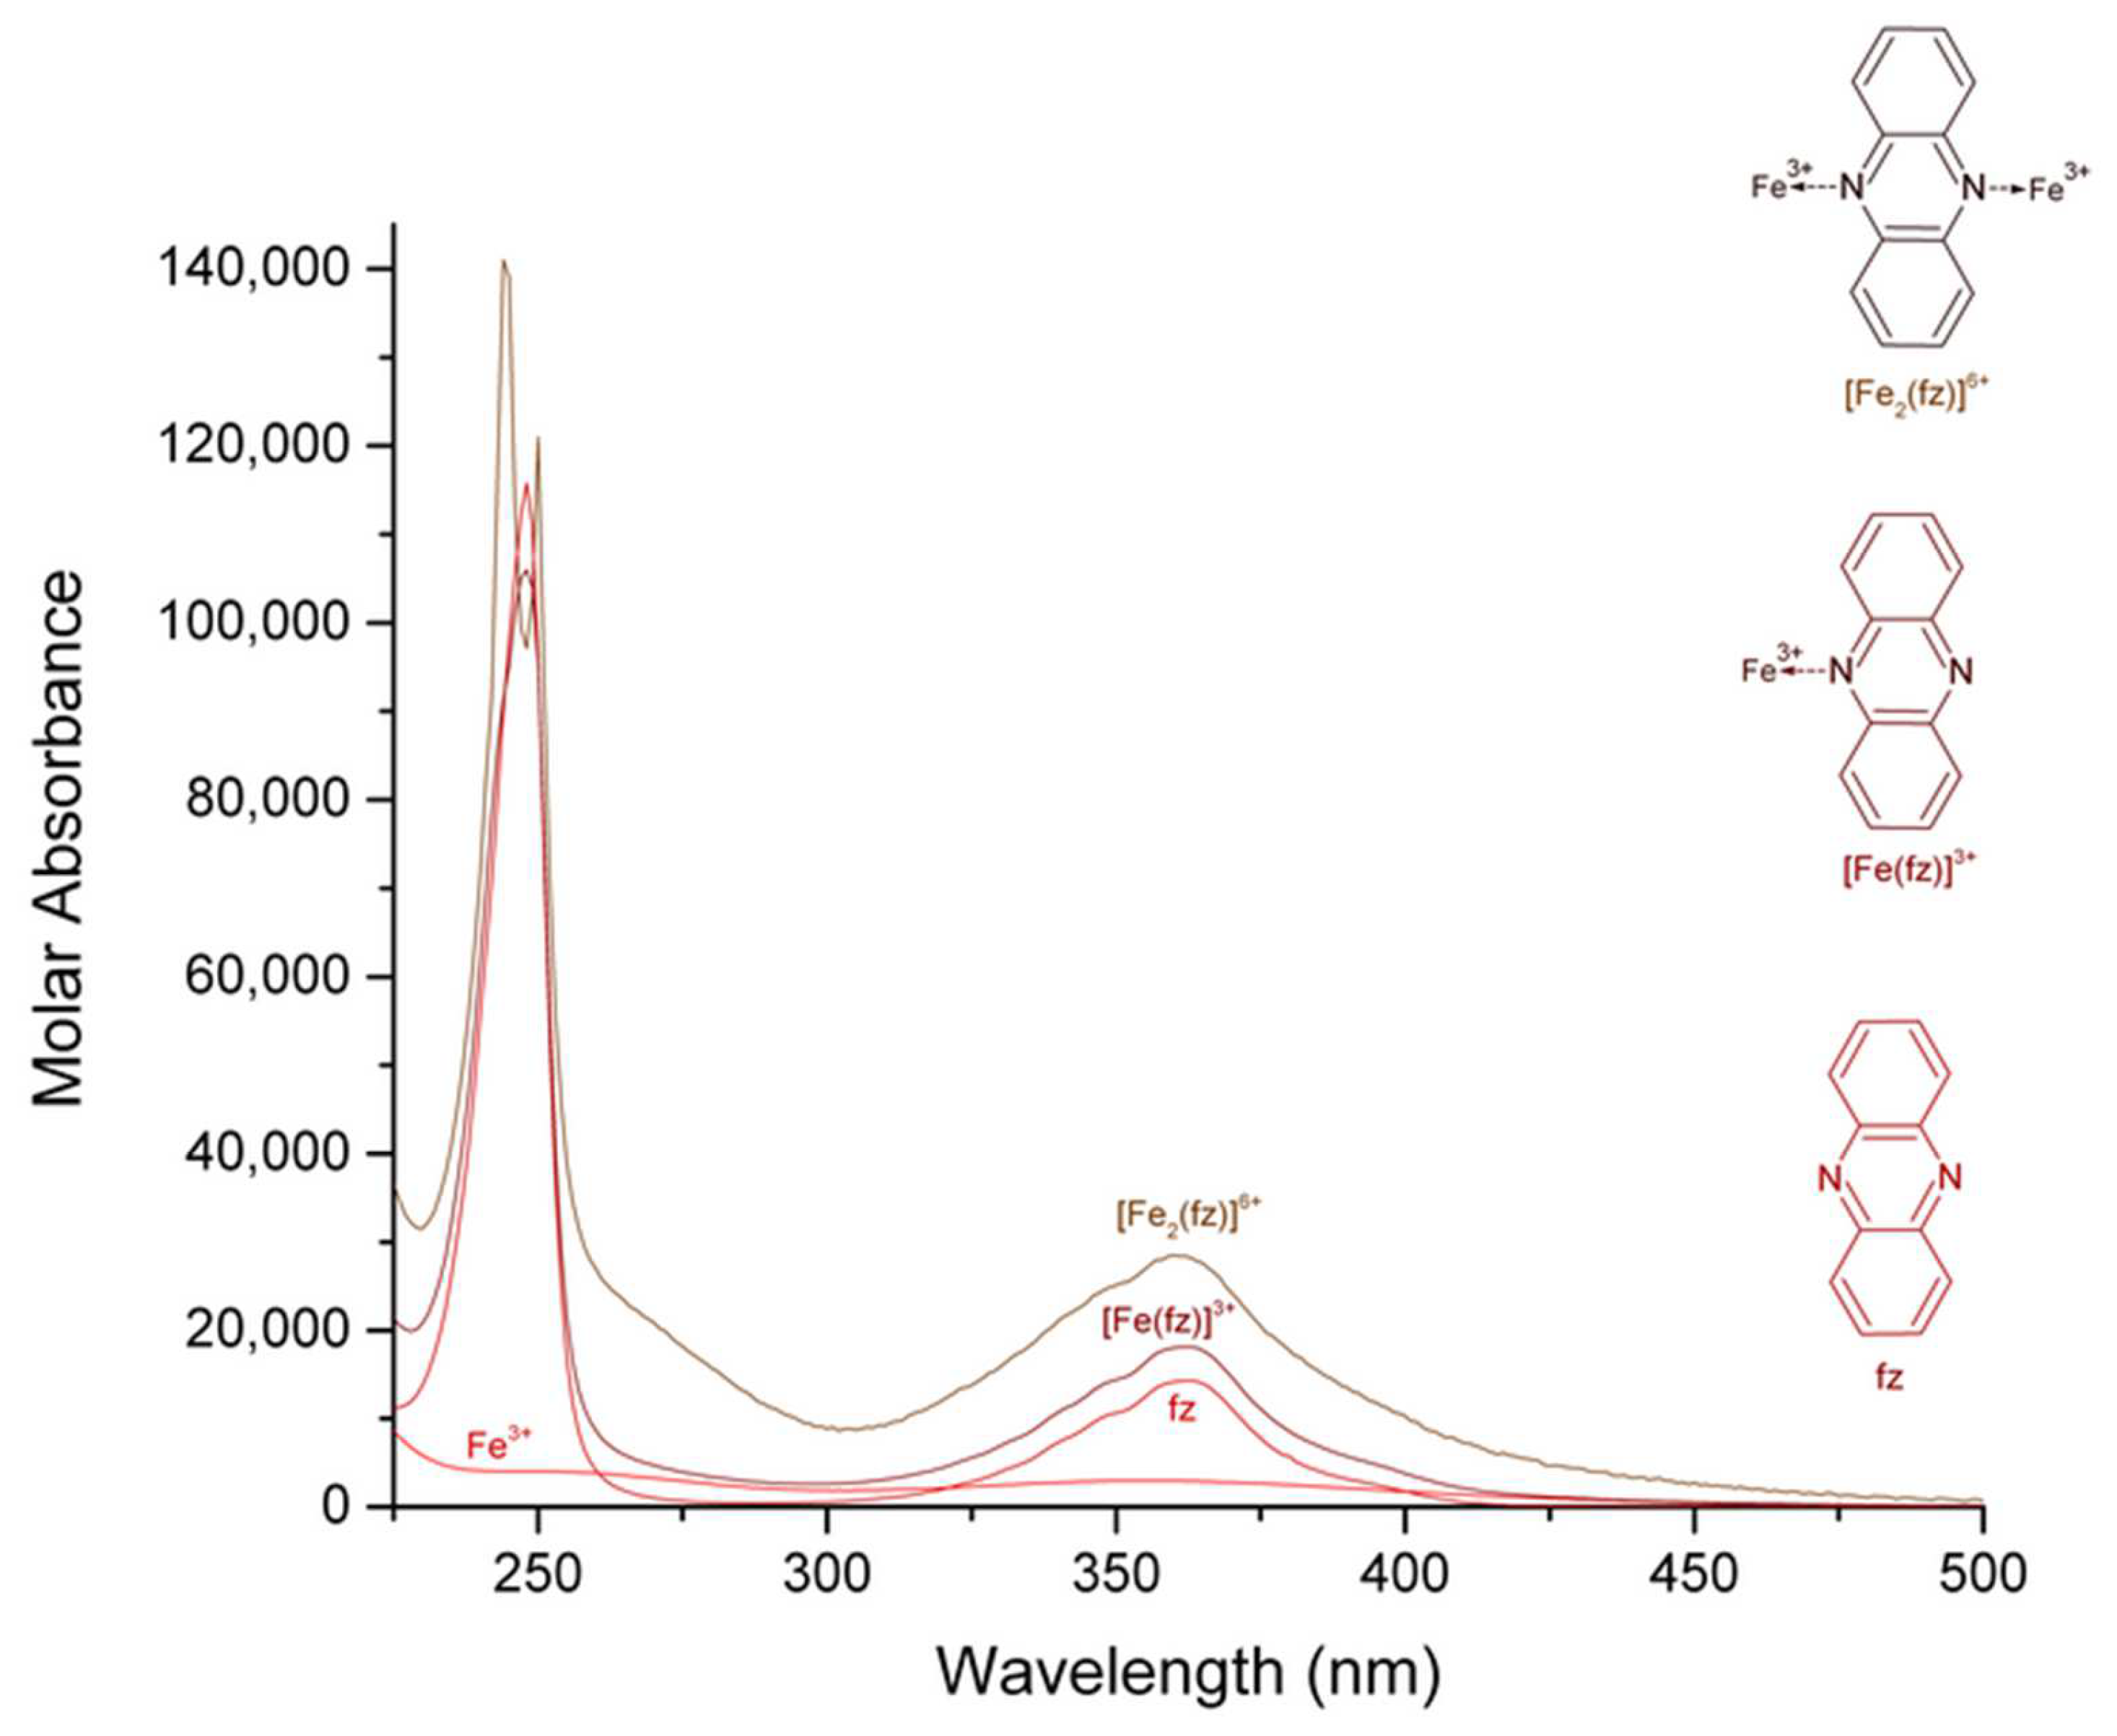
2.3. Distribution Curves of the Iron (III)-Complexes with -Pyrazine, -Quinoxaline, and -Phenazine
2.4. Far- and Mid-Infrared Spectrum of the Complexes [Fe (pz)]3+, [Fe (qx)]3+, [Fe (fz)]3+, [Fe2 (pz)]6+, [Fe2 (qx)]6+, and [Fe2 (fz)]6+
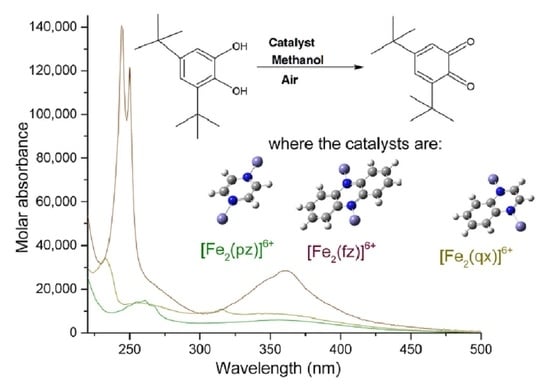
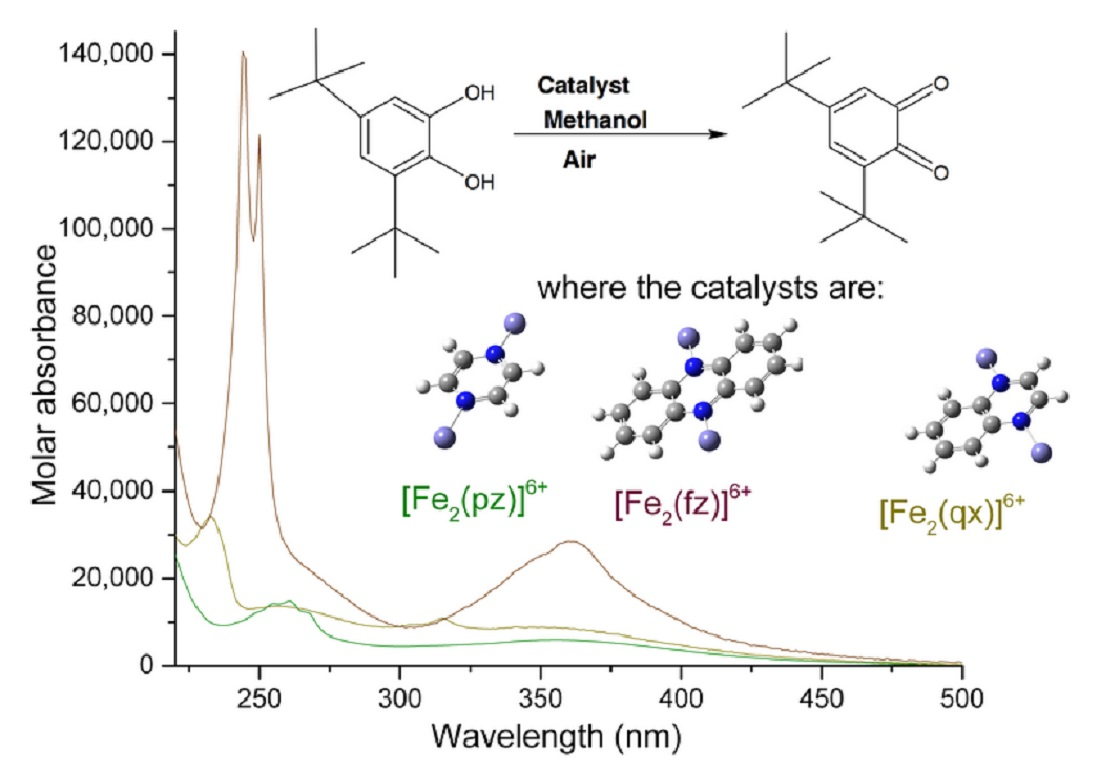
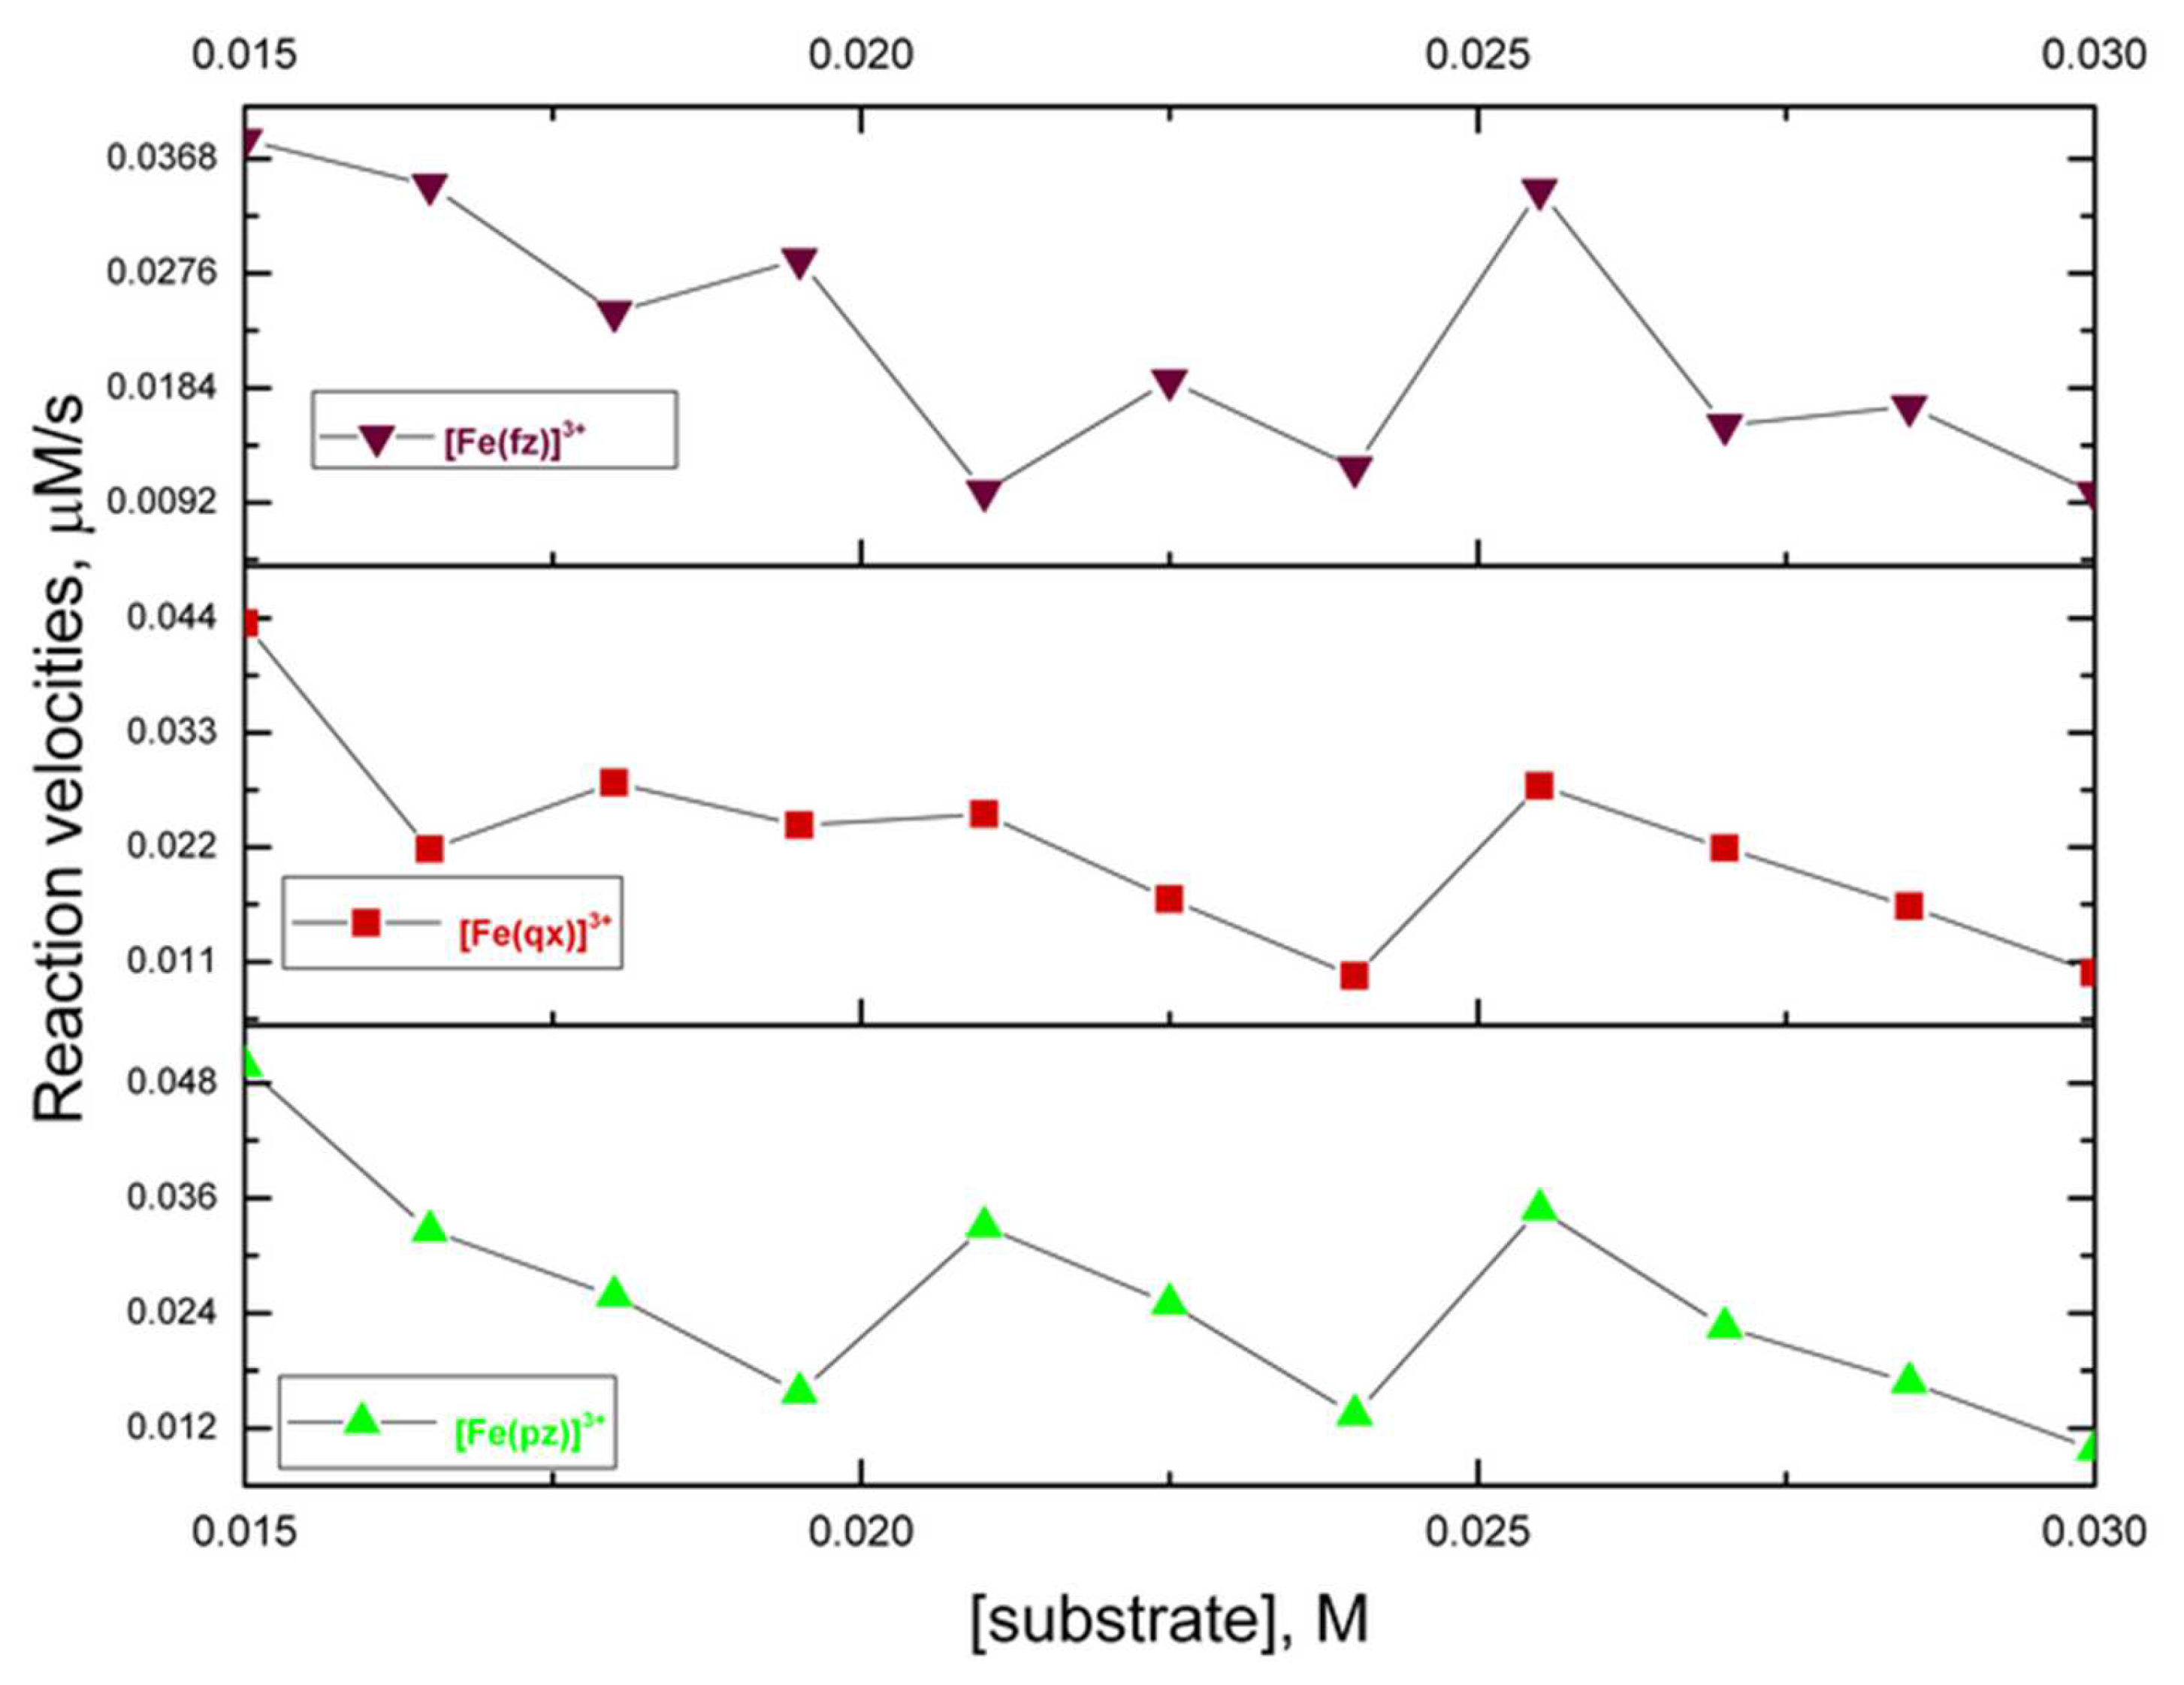
2.5. Catecholase Activity of the Complexes with Iron (III) and Pyrazine, Quinoxaline, and Phenazine
3. Experimental
3.1. Materials and Methods
3.2. Equilibrium Studies of Iron (III) with Pyrazine, Quinoxaline, or Phenazine
3.3. Synthesis of the Complexes: [Fe (pz)]3+, [Fe (qx)]3+, [Fe (fz)3+, [Fe2 (pz)]6+, [Fe2 (qx)]6+ and [Fe2 (fz)]6+ and Its Far- and Mid-Infrared Spectrum
3.4. Catecholase Activity of the Complexes with Iron (III) and Pyrazine, Quinoxaline, and Phenazine
4. Conclusions
Supplementary Materials
Author Contributions
Funding
Institutional Review Board Statement
Informed Consent Statement
Data Availability Statement
Conflicts of Interest
Sample Availability
References
- Dey, S.K.; Mukherjee, A. Catechol oxidase and phenoxazinone synthase: Biomimetic functional models and mechanistic studies. Coord. Chem. Rev. 2016, 310, 80–115. [Google Scholar] [CrossRef]
- Camargo, T.P.; Maia, F.F.; Chaves, C.; de Souza, B.; Bortoluzzi, A.J.; Castilho, N.; Bortolotto, T.; Terenzi, H.; Castellano, E.E.; Haase, W.; et al. Synthesis, characterization, hydrolase and catecholase activity of a dinuclear iron(III) complex: Catalytic promiscuity. J. Inorg. Biochem. 2015, 146, 77–88. [Google Scholar] [CrossRef] [PubMed]
- Alshabib, M.; Onaizi, S.A. A review on phenolic wastewater remediation using homogeneous and heterogeneous enzymatic processes: Current status and potential challenges. Sep. Purif. Technol. 2019, 219, 186–207. [Google Scholar] [CrossRef]
- Mishra, B.; Varjani, S.; Agrawal, D.C.; Mandal, S.K.; Ngo, H.H.; Taherzadeh, M.J.; Chang, J.-S.; You, S.; Guo, W. Engineering biocatalytic material for the remediation of pollutants: A comprehensive review. Environ. Technol. Innov. 2020, 20, 101063. [Google Scholar] [CrossRef]
- Lippard, S.J.; Berg, J.M.; Klatt, G.; Berg, U.J.M. Principles of Bioinorganic Chemistry; University Science Books: Mill Valley, CA, USA, 1994. [Google Scholar]
- Da Silva, J.J.R.F.; Williams, R.J.P. The Biological Chemistry of the Elements: The Inorganic Chemistry of Life; Oxford University Press: Oxford, UK, 2001. [Google Scholar]
- Ivano, B. Bioinorganic Chemistry; University Science Books: Mill Valley, CA, USA, 1994. [Google Scholar]
- Neves, A.; Bortoluzzi, A.J.; Jovito, R.; Peralta, R.A.; de Souza, B.; Szpoganicz, B.; Joussef, A.C.; Terenzi, H.; Severino, P.C.; Fischer, F.L.; et al. Catalytic Promiscuity: Catecholase-like Activity and Hydrolytic DNA Cleavage Promoted by a Mixed-Valence (FeFeII)-Fe-III Complex. J. Braz. Chem. Soc. 2010, 21, 1201–1212. [Google Scholar] [CrossRef] [Green Version]
- Maga, J.A.; Sizer, C.E. Pyrazines in foods. Review. J. Agric. Food Chem. 1973, 21, 22–30. [Google Scholar] [CrossRef]
- Adams, T.B.; Doull, J.; Feron, V.J.; Goodman, J.I.; Marnett, L.J.; Munro, I.C.; Newberne, P.M.; Portoghese, P.S.; Smith, R.L.; Waddell, W.J.; et al. The FEMA GRAS assessment of pyrazine derivatives used as flavor ingredients. Food Chem. Toxicol. 2002, 40, 429–451. [Google Scholar] [CrossRef]
- Pereira, J.A.; Pessoa, A.M.; Cordeiro, M.N.D.S.; Fernandes, R.; Prudêncio, C.; Noronha, J.P.; Vieira, M. Quinoxaline, its derivatives and applications: A State of the Art review. Eur. J. Med. Chem. 2015, 97, 664–672. [Google Scholar] [CrossRef] [Green Version]
- Krishnaiah, M.; de Almeida, N.R.; Udumula, V.; Song, Z.; Chhonker, Y.S.; Abdelmoaty, M.M.; do Nascimento, V.A.; Murry, D.J.; Conda-Sheridan, M. Synthesis, biological evaluation, and metabolic stability of phenazine derivatives as antibacterial agents. Eur. J. Med. Chem. 2018, 143, 936–947. [Google Scholar] [CrossRef]
- Wei, T.-B.; Yong, B.-R.; Dang, L.-R.; Zhang, Y.-M.; Yao, H.; Lin, Q. A simple water-soluble phenazine dye for colorimetric/ fluorogenic dual-mode detection and removal of Cu2+ in natural water and plant samples. Dye. Pigment. 2019, 171, 107707. [Google Scholar] [CrossRef]
- Stephenson, N.A.; Bell, A.T. Effects of Methanol on the Thermodynamics of Iron(III) [Tetrakis(pentafluorophenyl)]porphyrin Chloride Dissociation and the Creation of Catalytically Active Species for the Epoxidation of Cyclooctene. Inorg. Chem. 2006, 45, 5591–5599. [Google Scholar] [CrossRef] [PubMed]
- Mayer, U. Solvent effects on ion-pair equilibria. Coord. Chem. Rev. 1976, 21, 159–179. [Google Scholar] [CrossRef]
- Dinçalp, H.; Içli, S. Photoinduced electron transfer-catalyzed processes of sulfoamino perylene diimide under concentrated sun light. Sol. Energy 2006, 80, 332–346. [Google Scholar] [CrossRef]
- Gans, P.; Sabatini, A.; Vacca, A. HypSpec 2008 Software; Protonic Software: Leeds, UK; Florence, Italy, 2008. [Google Scholar]
- Gans, P.; Sabatini, A.; Vacca, A. Investigation of equilibria in solution. Determination of equilibrium constants with the HYPERQUAD suite of programs. Talanta 1996, 43, 1739–1753. [Google Scholar] [CrossRef]
- Gans, P.; Sabatini, A.; Vacca, A. Determination of equilibrium constants from spectrophometric data obtained from solutions of known pH: The program pHab. Ann. Chim. 1999, 89, 45–49. [Google Scholar]
- Segoviano-Garfias, J.J.N.; Zanor, G.A.; Ávila-Ramos, F.; Bivián-Castro, E.Y. Stability of Manganese(II)-Pyrazine, -Quinoxaline or -Phenazine Complexes and Their Potential as Carbonate Sequestration Agents. Molecules 2022, 27, 1648. [Google Scholar] [CrossRef]
- Collinson, S.; Alcock, N.W.; Raghunathan, A.; Kahol, P.K.; Busch, D.H. Synthesis and Properties of Iron(II) and Manganese(II) Complexes Derived from a Topologically Constrained Pentadentate Ligand. Inorg. Chem. 2000, 39, 757–764. [Google Scholar] [CrossRef]
- Zheng, H.; Langner, K.M.; Shields, G.P.; Hou, J.; Kowiel, M.; Allen, F.H.; Murshudov, G.; Minor, W. Data mining of iron(II) and iron(III) bond-valence parameters, and their relevance for macromolecular crystallography. Acta Crystallogr. Sect. D 2017, 73, 316–325. [Google Scholar] [CrossRef] [Green Version]
- Pearson, R.G. Hard and soft acids and bases, HSAB, part 1: Fundamental principles. J. Chem. Educ. 1968, 45, 581. [Google Scholar] [CrossRef]
- Miessler, G.L.; Tarr, D.A. Inorganic Chemistry; Pearson Education: Bergen, NJ, USA, 2004. [Google Scholar]
- Sreekanth, A.; Fun, H.-K.; Prathapachandra Kurup, M.R. Structural and spectral studies of an iron(III) complex [Fe(Pranthas)2][FeCl4] derived from 2-acetylpyridine-N(4), N(4)-(butane-1, 4-diyl) thiosemicarbazone (HPranthas). J. Mol. Struct. 2005, 737, 61–67. [Google Scholar] [CrossRef]
- Sreekanth, A.; Kurup, M.R.P. Synthesis, EPR and Mössbauer spectral studies of new iron(III) complexes with 2-benzoylpyridine-N(4), N(4)-(butane-1,4-diyl) thiosemicarbazone (HBpypTsc): X-ray structure of [Fe(BpypTsc)2]FeCl4·2H2O and the free ligand. Polyhedron 2004, 23, 969–978. [Google Scholar] [CrossRef]
- Prodi, L.; Montalti, M.; Zaccheroni, N.; Pickaert, G.; Charbonnière, L.; Ziessel, R. New europium(iii) complexes containing hybrid ligands with hard and soft complexation centres. New J. Chem. 2003, 27, 134–139. [Google Scholar] [CrossRef]
- Al-Shaalan, N.H. Synthesis, Characterization and Biological Activities of Cu(II), Co(II), Mn(II), Fe(II), and UO2(VI) Complexes with a New Schiff Base Hydrazone: O-Hydroxyacetophenone-7-chloro-4-quinoline Hydrazone. Molecules 2011, 16, 8629–8645. [Google Scholar] [CrossRef] [PubMed] [Green Version]
- Singh, D.P.; Grover, V.; Kumar, R.; Jain, K. Template synthesis of macrocyclic complexes and their spectroscopic and antibacterial studies. J. Enzym. Inhib. Med. Chem. 2010, 25, 445–449. [Google Scholar] [CrossRef] [PubMed] [Green Version]
- Singh, D.P.; Kumar, R.; Singh, J. Synthesis and spectroscopic studies of biologically active compounds derived from oxalyldihydrazide and benzil, and their Cr(III), Fe(III) and Mn(III) complexes. Eur. J. Med. Chem. 2009, 44, 1731–1736. [Google Scholar] [CrossRef]
- Singh, D.P.; Kumar, R.; Singh, J. Antibacterial activity and spectral studies of trivalent chromium, manganese, iron macrocyclic complexes derived from oxalyldihydrazide and glyoxal. J. Enzym. Inhib. Med. Chem. 2009, 24, 883–889. [Google Scholar] [CrossRef] [Green Version]
- Murakami, Y.; Matsuda, Y.; Sakata, K.; Harada, K. Transition-metal Complexes of Pyrrole Pigments. IX. Divalent and Trivalent Iron Chelates of Dipyrromethenes. Bull. Chem. Soc. Jpn. 1974, 47, 458–462. [Google Scholar] [CrossRef] [Green Version]
- Armentano, D.; de Munno, G.; Guerra, F.; Faus, J.; Lloret, F.; Julve, M. 2,2′-Bipyrimidine- and 2,3-bis(2-pyridyl)pyrazine-containing manganese(ii) compounds: Structural and magnetic properties. Dalton Trans. 2003, 24, 4626–4634. [Google Scholar] [CrossRef]
- Gan, F.; Wu, K.; Ma, F.; Du, C. In Situ Determination of Nitrate in Water Using Fourier Transform Mid-Infrared Attenuated Total Reflectance Spectroscopy Coupled with Deconvolution Algorithm. Molecules 2020, 25, 5838. [Google Scholar] [CrossRef]
- Kanugala, S.; Jinka, S.; Puvvada, N.; Banerjee, R.; Kumar, C.G. Phenazine-1-carboxamide functionalized mesoporous silica nanoparticles as antimicrobial coatings on silicone urethral catheters. Sci. Rep. 2019, 9, 6198. [Google Scholar] [CrossRef] [Green Version]
- Chakraborty, S.; Mukherjee, S.; Mahapatra, S.; Das, P.K. Infrared Spectral Assignment of Pyrimidine and Pyrazine in the CH Stretching Region by an Effective Spectroscopic Hamiltonian. Vib. Spectrosc. 2018, 99, 196–203. [Google Scholar] [CrossRef]
- Reuveni, S.; Urbakh, M.; Klafter, J. Role of substrate unbinding in Michaelis–Menten enzymatic reactions. Proc. Natl. Acad. Sci. USA 2014, 111, 4391–4396. [Google Scholar] [CrossRef] [PubMed] [Green Version]
- Achelle, S.; Baudequin, C.; Plé, N. Luminescent materials incorporating pyrazine or quinoxaline moieties. Dye. Pigment. 2013, 98, 575. [Google Scholar] [CrossRef] [Green Version]
- Alderighi, L.; Gans, P.; Ienco, A.; Peters, D.; Sabatini, A.; Vacca, A. Hyperquad simulation and speciation (HySS): A utility program for the investigation of equilibria involving soluble and partially soluble species. Coord. Chem. Rev. 1999, 184, 311–318. [Google Scholar] [CrossRef]
- Seth, P.; Das, L.K.; Drew, M.G.B.; Ghosh, A. Synthesis, Crystal Structure, and Catecholase Activity of Three Trinuclear Heterometallic NiII2–MnII Complexes Derived from a Salen-Type Schiff Base Ligand. Eur. J. Inorg. Chem. 2012, 2012, 2232–2242. [Google Scholar] [CrossRef]


| Solution Composition | [TL] Constant at 50 and 75 µmol L−1 [TM] Range from 7.5 to 148.8 and 11 to 212 µmol L−1 | ||
|---|---|---|---|
| Ionic strength, electrolyte | Not used | ||
| pH range | Not used | ||
| Experimental method | Spectrophotometric titration | ||
| Temperature | 298 K | ||
| Total number of data points | Fe complexation: 27 solution spectra | ||
| Method of calculation | HypSpec | ||
| Species | Equilibrium | Log β | σ |
| [Fe (pz)]3+ [Fe2 (pz)]6+ | Fe3+ + pz ⇌ [Fe (pz)]3+ 2Fe3+ + pz ⇌ [Fe2 (pz)]6+ | log β110 = 3.2 ± 0.1 log β210 = 6.9 ± 0.1 | 0.0019 |
| Solution composition | [TL] constant at 24.85 and 36.87 µmol L−1 [TM] range from 2.6 to 74.5 and 4.0 to 114.8 µmol L−1 | ||
| Ionic strength, electrolyte | Not used | ||
| pH range | Not used | ||
| Experimental method | Spectrophotometric titration | ||
| Temperature | 298 K | ||
| Total number of data points | Fe complexation: 27 solution spectra | ||
| Method of calculation | HypSpec | ||
| Species | Equilibrium | Log β | σ |
| [Fe (qx)]3+ [Fe2 (qx)]3+ | Fe3+ + qx ⇌ [Fe (qx)]3+ 2Fe3+ + qx ⇌ [Fe2 (qx)]6+ | log β110 = 4.4 ± 0.1 log β210 = 8.3 ± 0.1 | 0.0019 |
| Solution composition | [TL] constant at 24.85 and 36.87 µmol L−1 [TM] range from 2.6 to 74.5 and 4.0 to 114.8 µmol L−1 | ||
| Ionic strength, electrolyte | Not used | ||
| pH range | Not used | ||
| Experimental method | Spectrophotometric titration | ||
| Temperature | 298 K | ||
| Total number of data points | Fe complexation: 27 solution spectra | ||
| Method of calculation | HypSpec | ||
| Species | Equilibrium | Log β | σ |
| [Fe (fz)]3+ [Fe2 (fz)]3+ | Fe3+ + fz ⇌ [Fe (fz)]3+ 2Fe3+ + fz ⇌ [Fe2 (fz)]6+ | log β110 = 6.4 ± 0.2 log β210 = 9.9 ± 0.2 | 0.0017 |
| Complex | Maximum Wavelength (nm); Molar Absorbance (L mol−1 cm−1) | Assignment, Reference | Maximum Wavelength (nm); Molar Absorbance (L mol−1 cm−1) | Assignment, Reference |
|---|---|---|---|---|
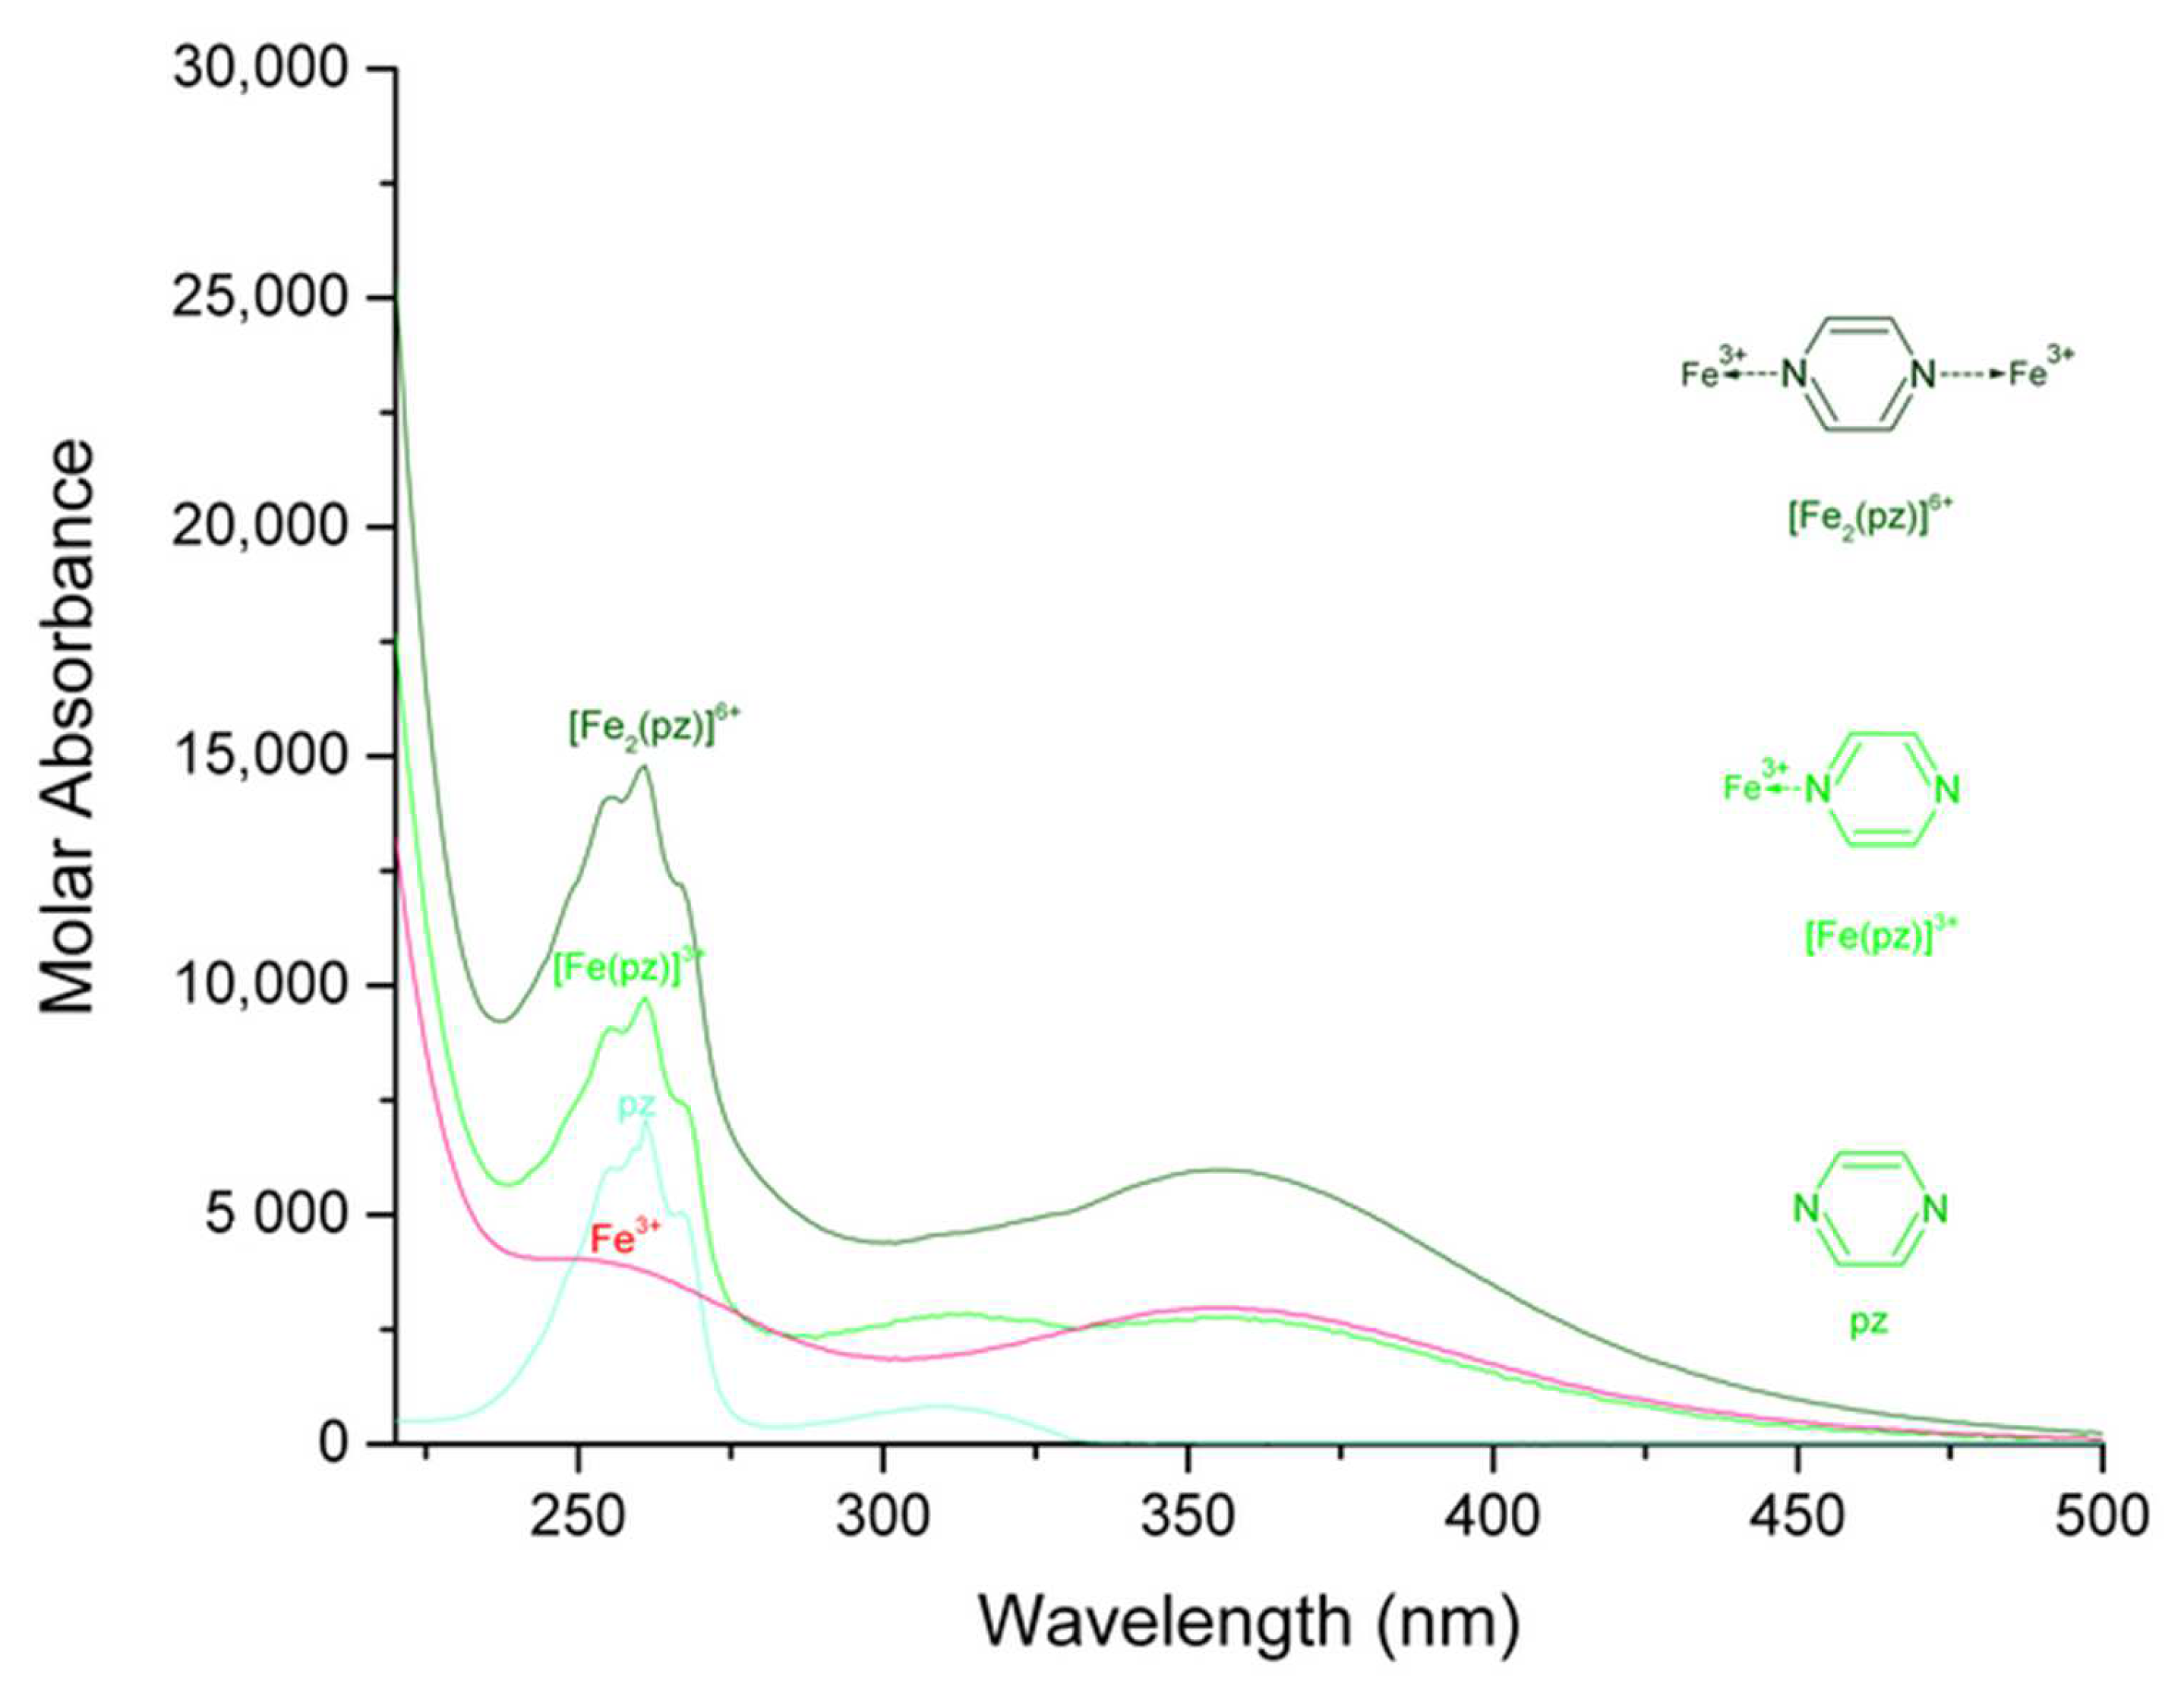
| [Fe (pz)]3+ | 261; 9736 | π→π* [25,26] | 352; 2770 | n→π* [25,26] |
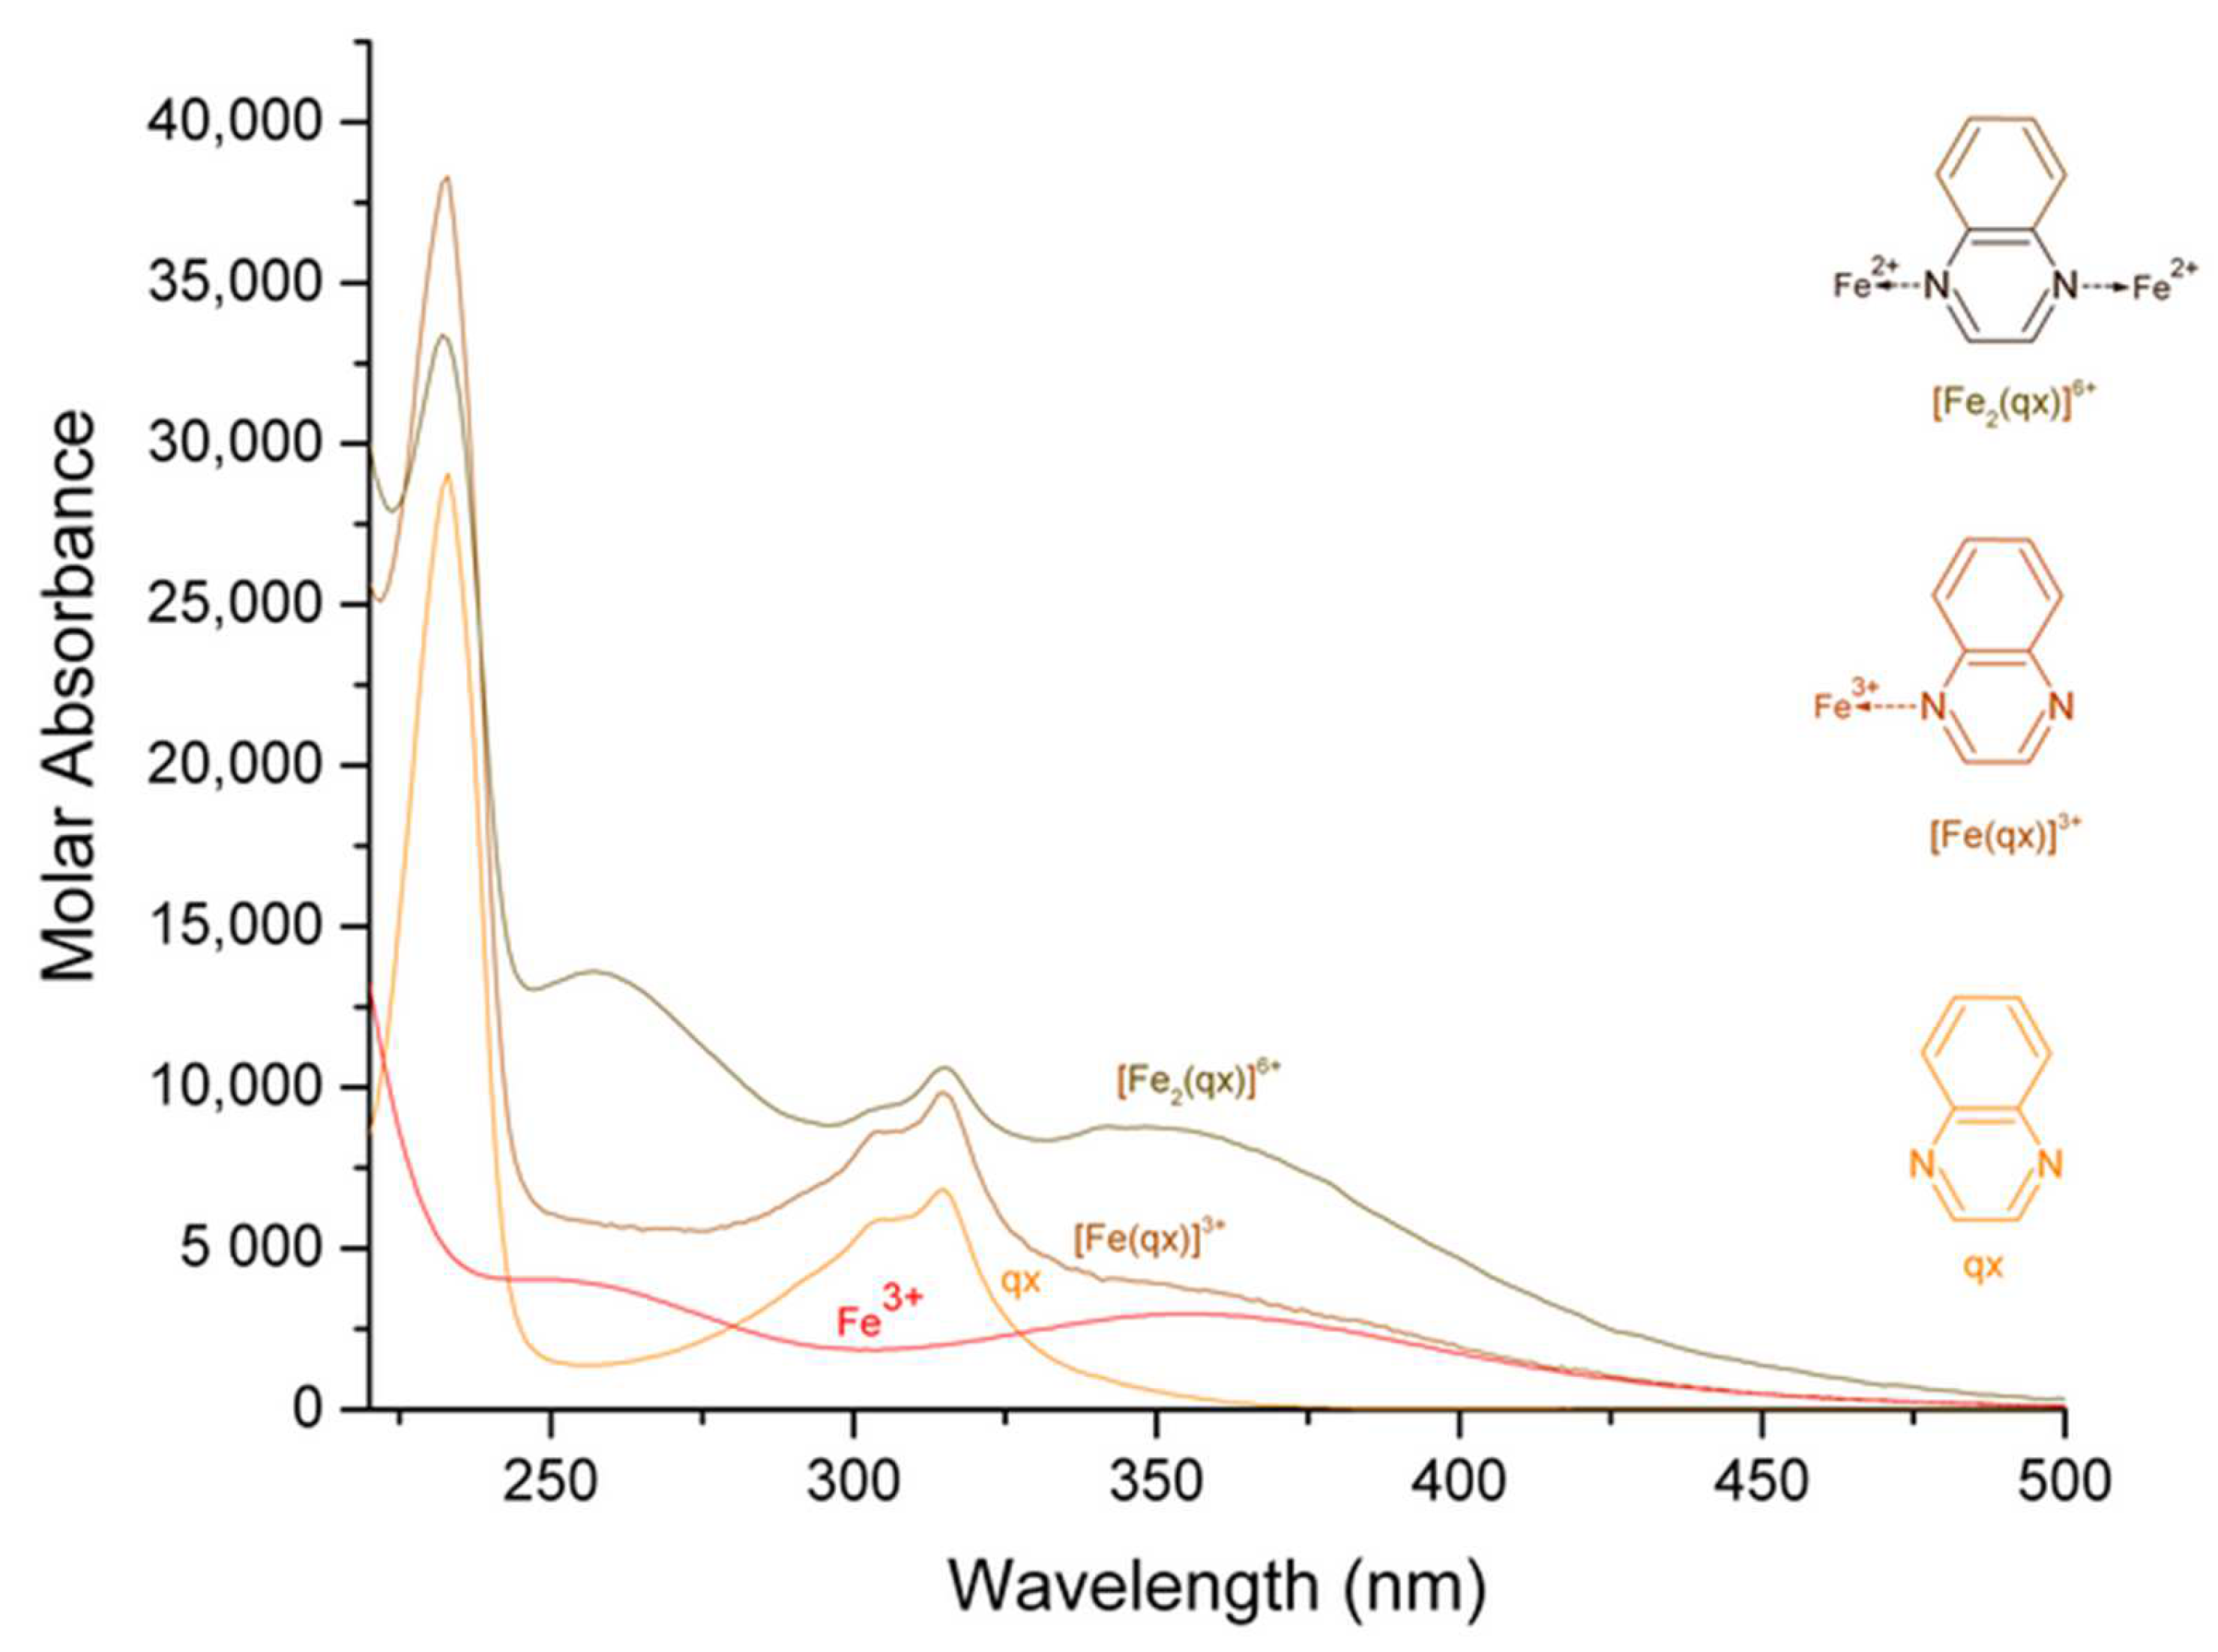
| [Fe (qx)]3+ | 233; 38,251 | 315; 9819 | ||
| [Fe (fz)]3+ | 248; 105,850 | 362; 18,147 | ||
| [Fe2 (pz)]6+ | 261; 14,797 | 356; 5983 | ||
| [Fe2 (qx)]6+ | 233, 256; 34,175, 13,637 | 315, 346; 10,931, 8820 | ||
| [Fe2 (fz)]6+ | 244, 250; 140,570, 121,270 | 360; 28,460 |
Publisher’s Note: MDPI stays neutral with regard to jurisdictional claims in published maps and institutional affiliations. |
© 2022 by the authors. Licensee MDPI, Basel, Switzerland. This article is an open access article distributed under the terms and conditions of the Creative Commons Attribution (CC BY) license (https://creativecommons.org/licenses/by/4.0/).
Share and Cite
Segoviano-Garfias, J.J.N.; Zanor, G.A.; Ávila-Ramos, F.; Bivián-Castro, E.Y. Equilibrium Studies of Iron (III) Complexes with Either Pyrazine, Quinoxaline, or Phenazine and Their Catecholase Activity in Methanol. Molecules 2022, 27, 3257. https://0-doi-org.brum.beds.ac.uk/10.3390/molecules27103257
Segoviano-Garfias JJN, Zanor GA, Ávila-Ramos F, Bivián-Castro EY. Equilibrium Studies of Iron (III) Complexes with Either Pyrazine, Quinoxaline, or Phenazine and Their Catecholase Activity in Methanol. Molecules. 2022; 27(10):3257. https://0-doi-org.brum.beds.ac.uk/10.3390/molecules27103257
Chicago/Turabian StyleSegoviano-Garfias, José J. N., Gabriela A. Zanor, Fidel Ávila-Ramos, and Egla Yareth Bivián-Castro. 2022. "Equilibrium Studies of Iron (III) Complexes with Either Pyrazine, Quinoxaline, or Phenazine and Their Catecholase Activity in Methanol" Molecules 27, no. 10: 3257. https://0-doi-org.brum.beds.ac.uk/10.3390/molecules27103257