
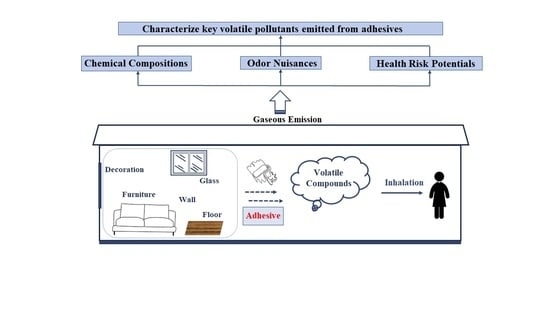
Characterizing Key Volatile Pollutants Emitted from Adhesives by Chemical Compositions, Odor Contributions and Health Risks


Abstract
:
1. Introduction
2. Results and Discussion
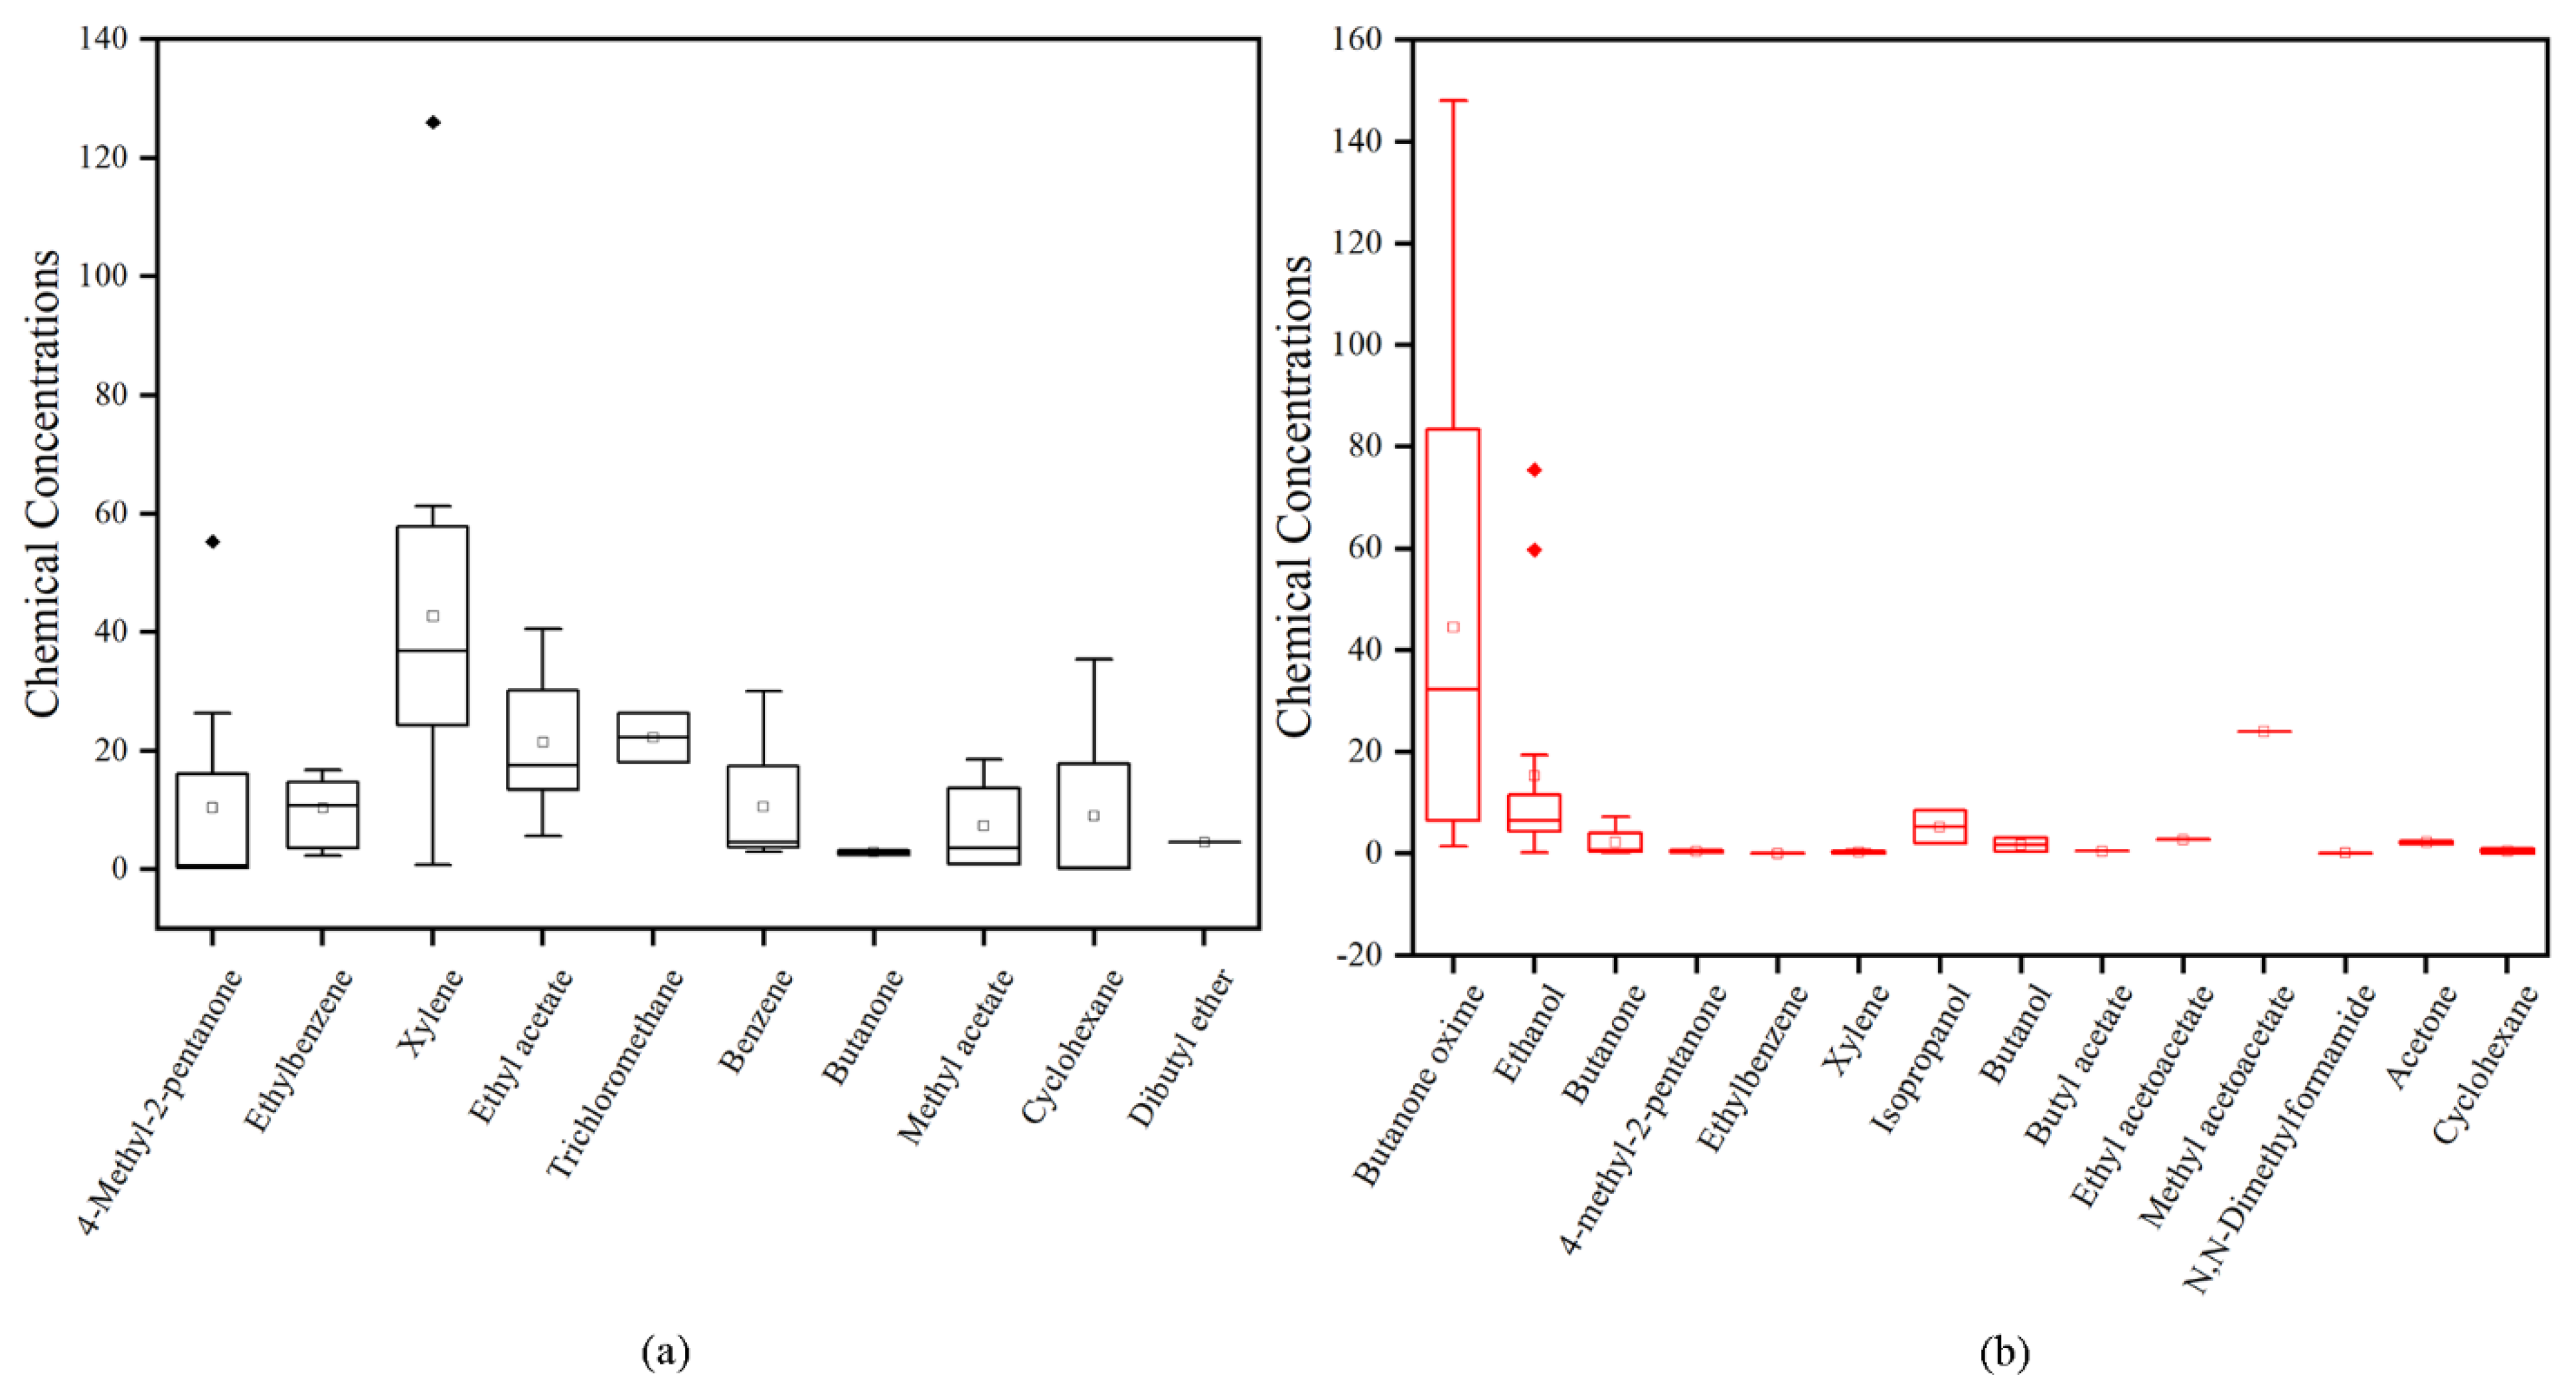
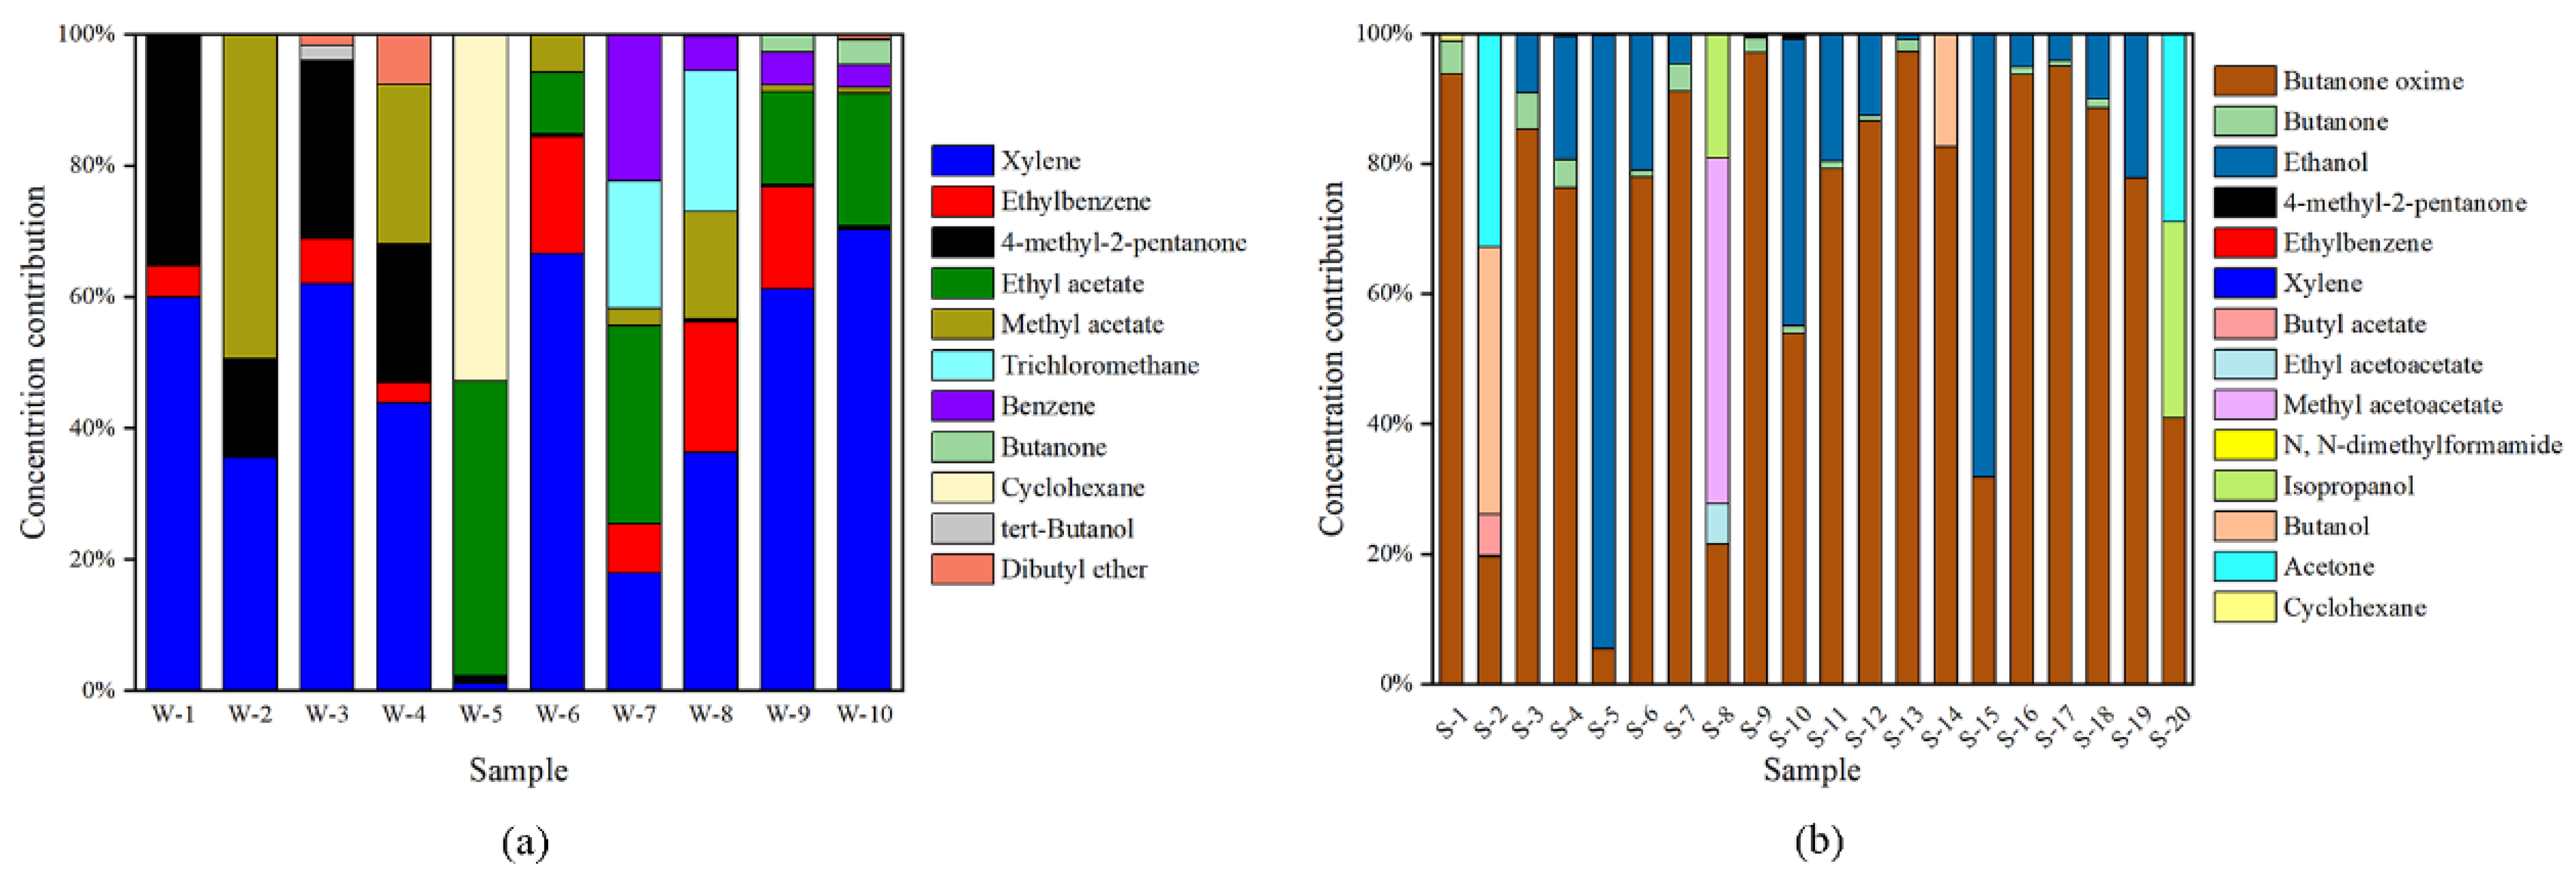
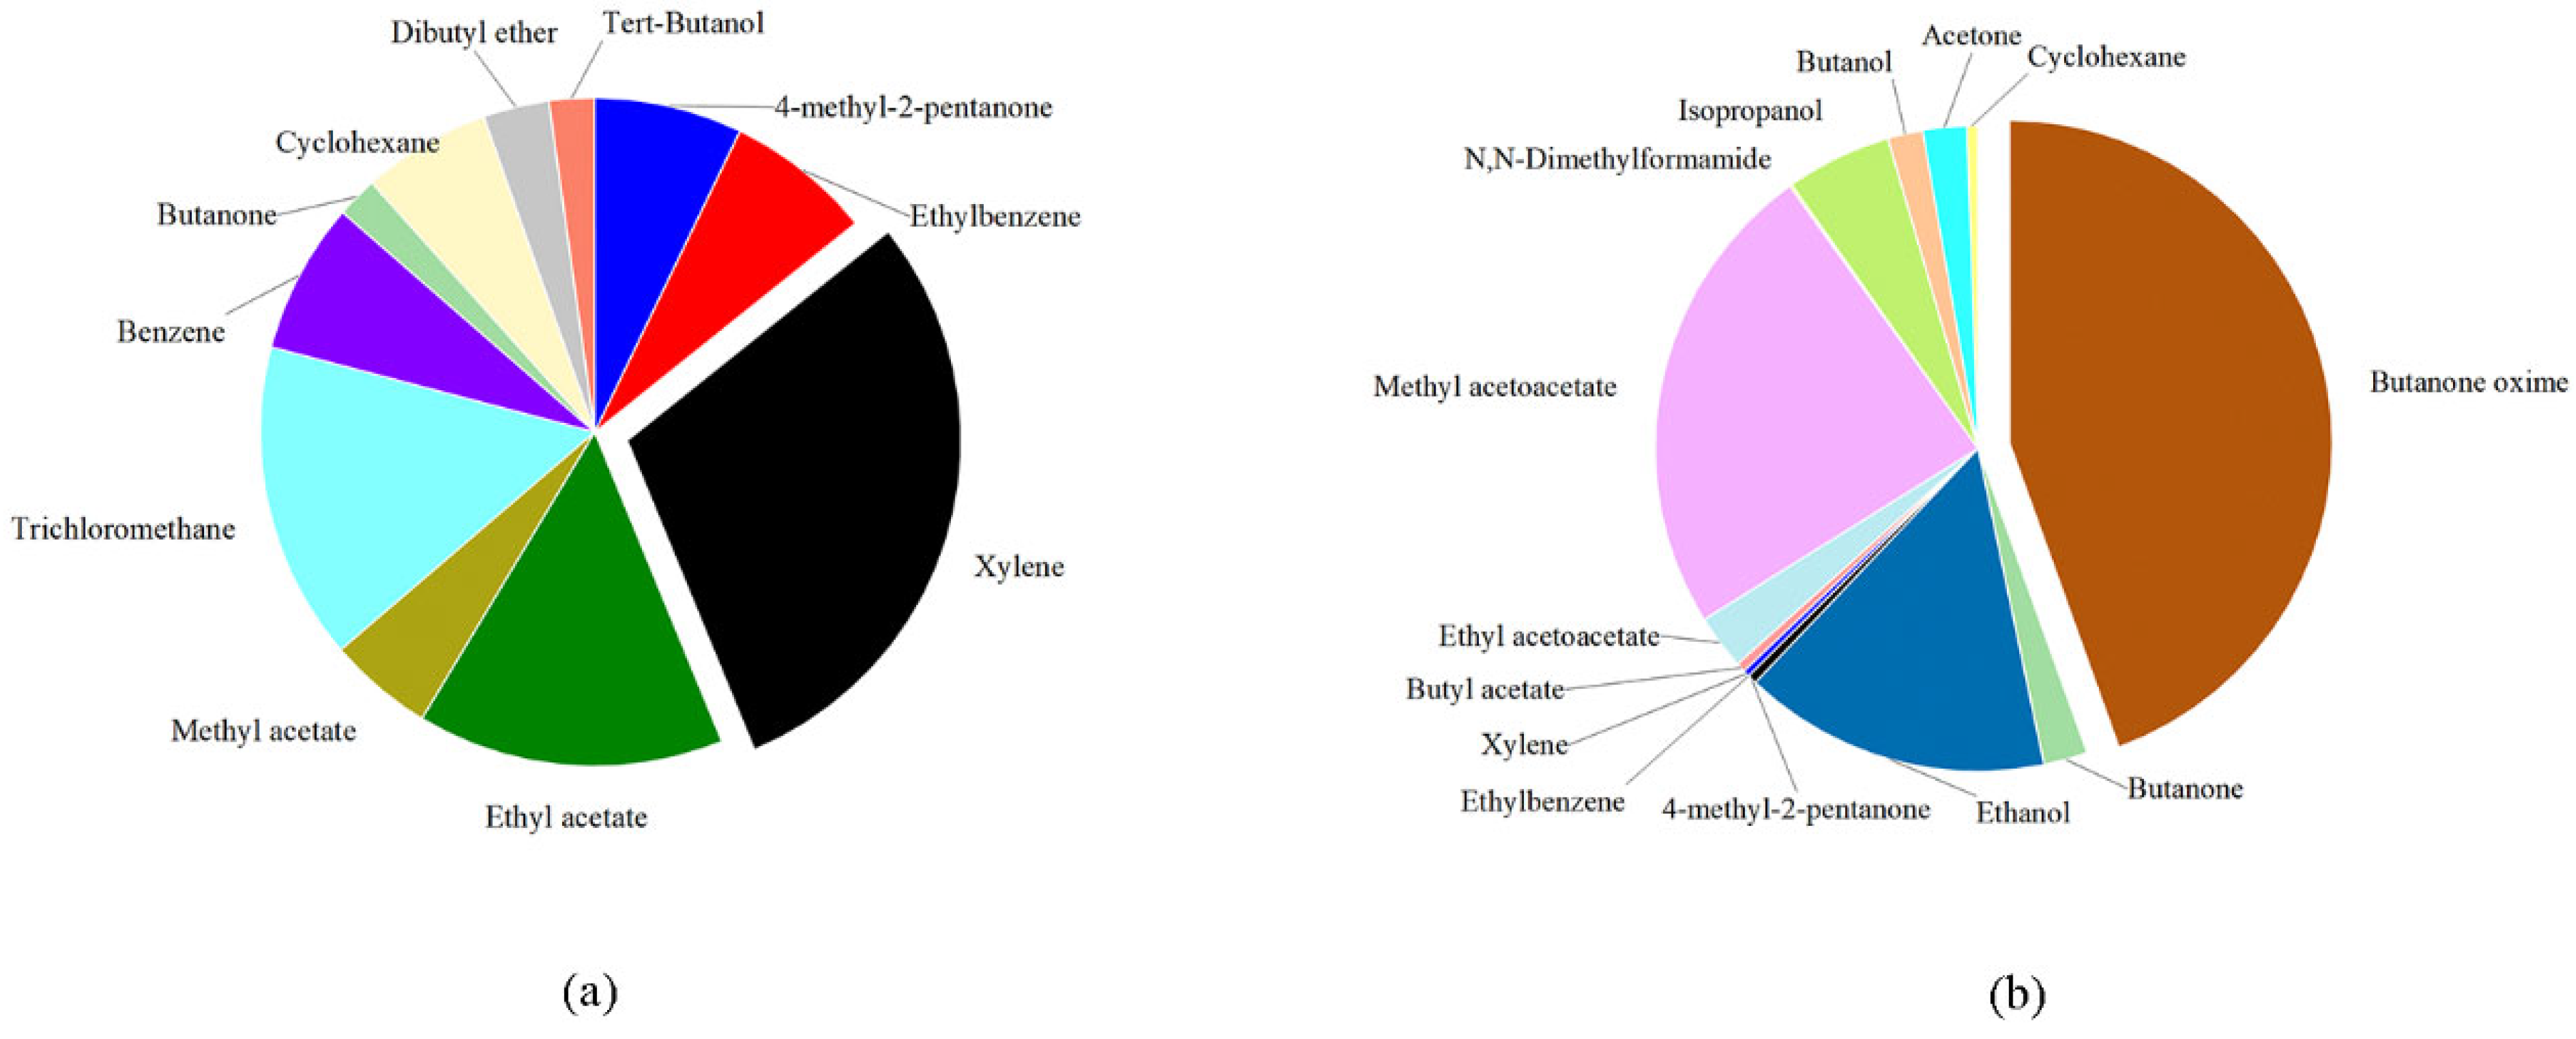
2.1. Identification of VOCs Emitted from the Adhesives
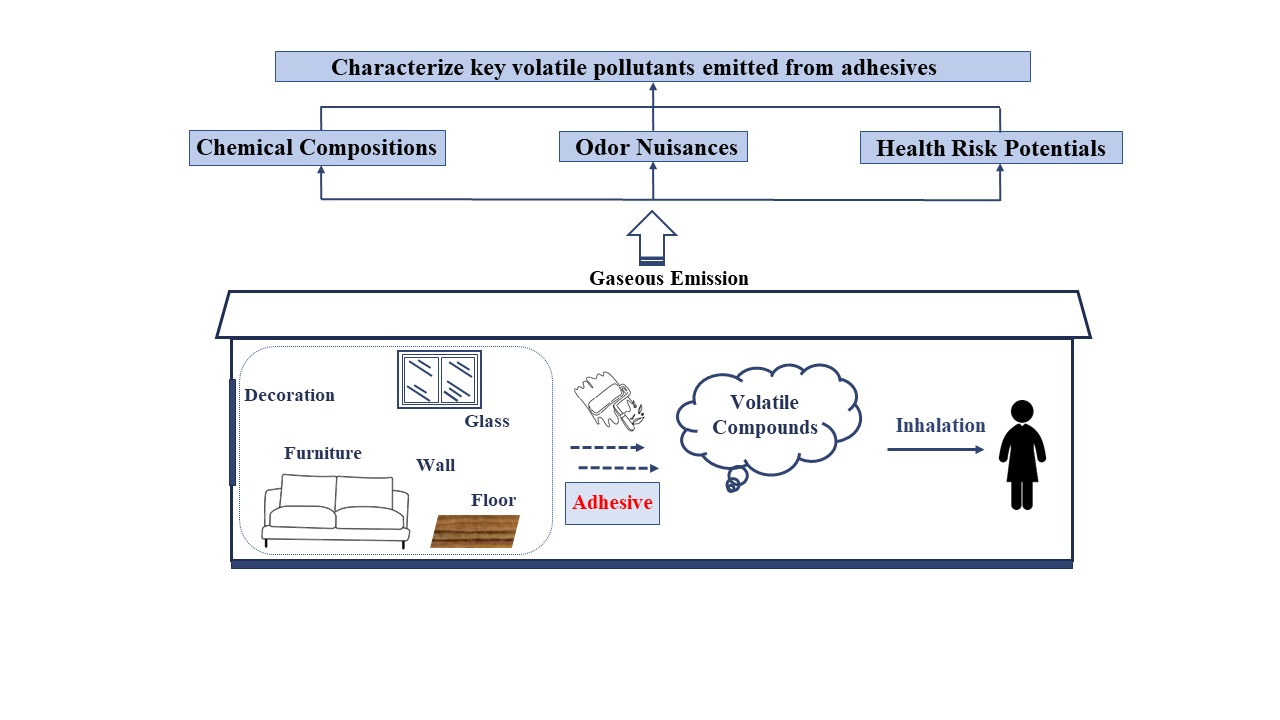
2.1.1. White Emulsion Adhesives
2.1.2. Silicone Adhesives
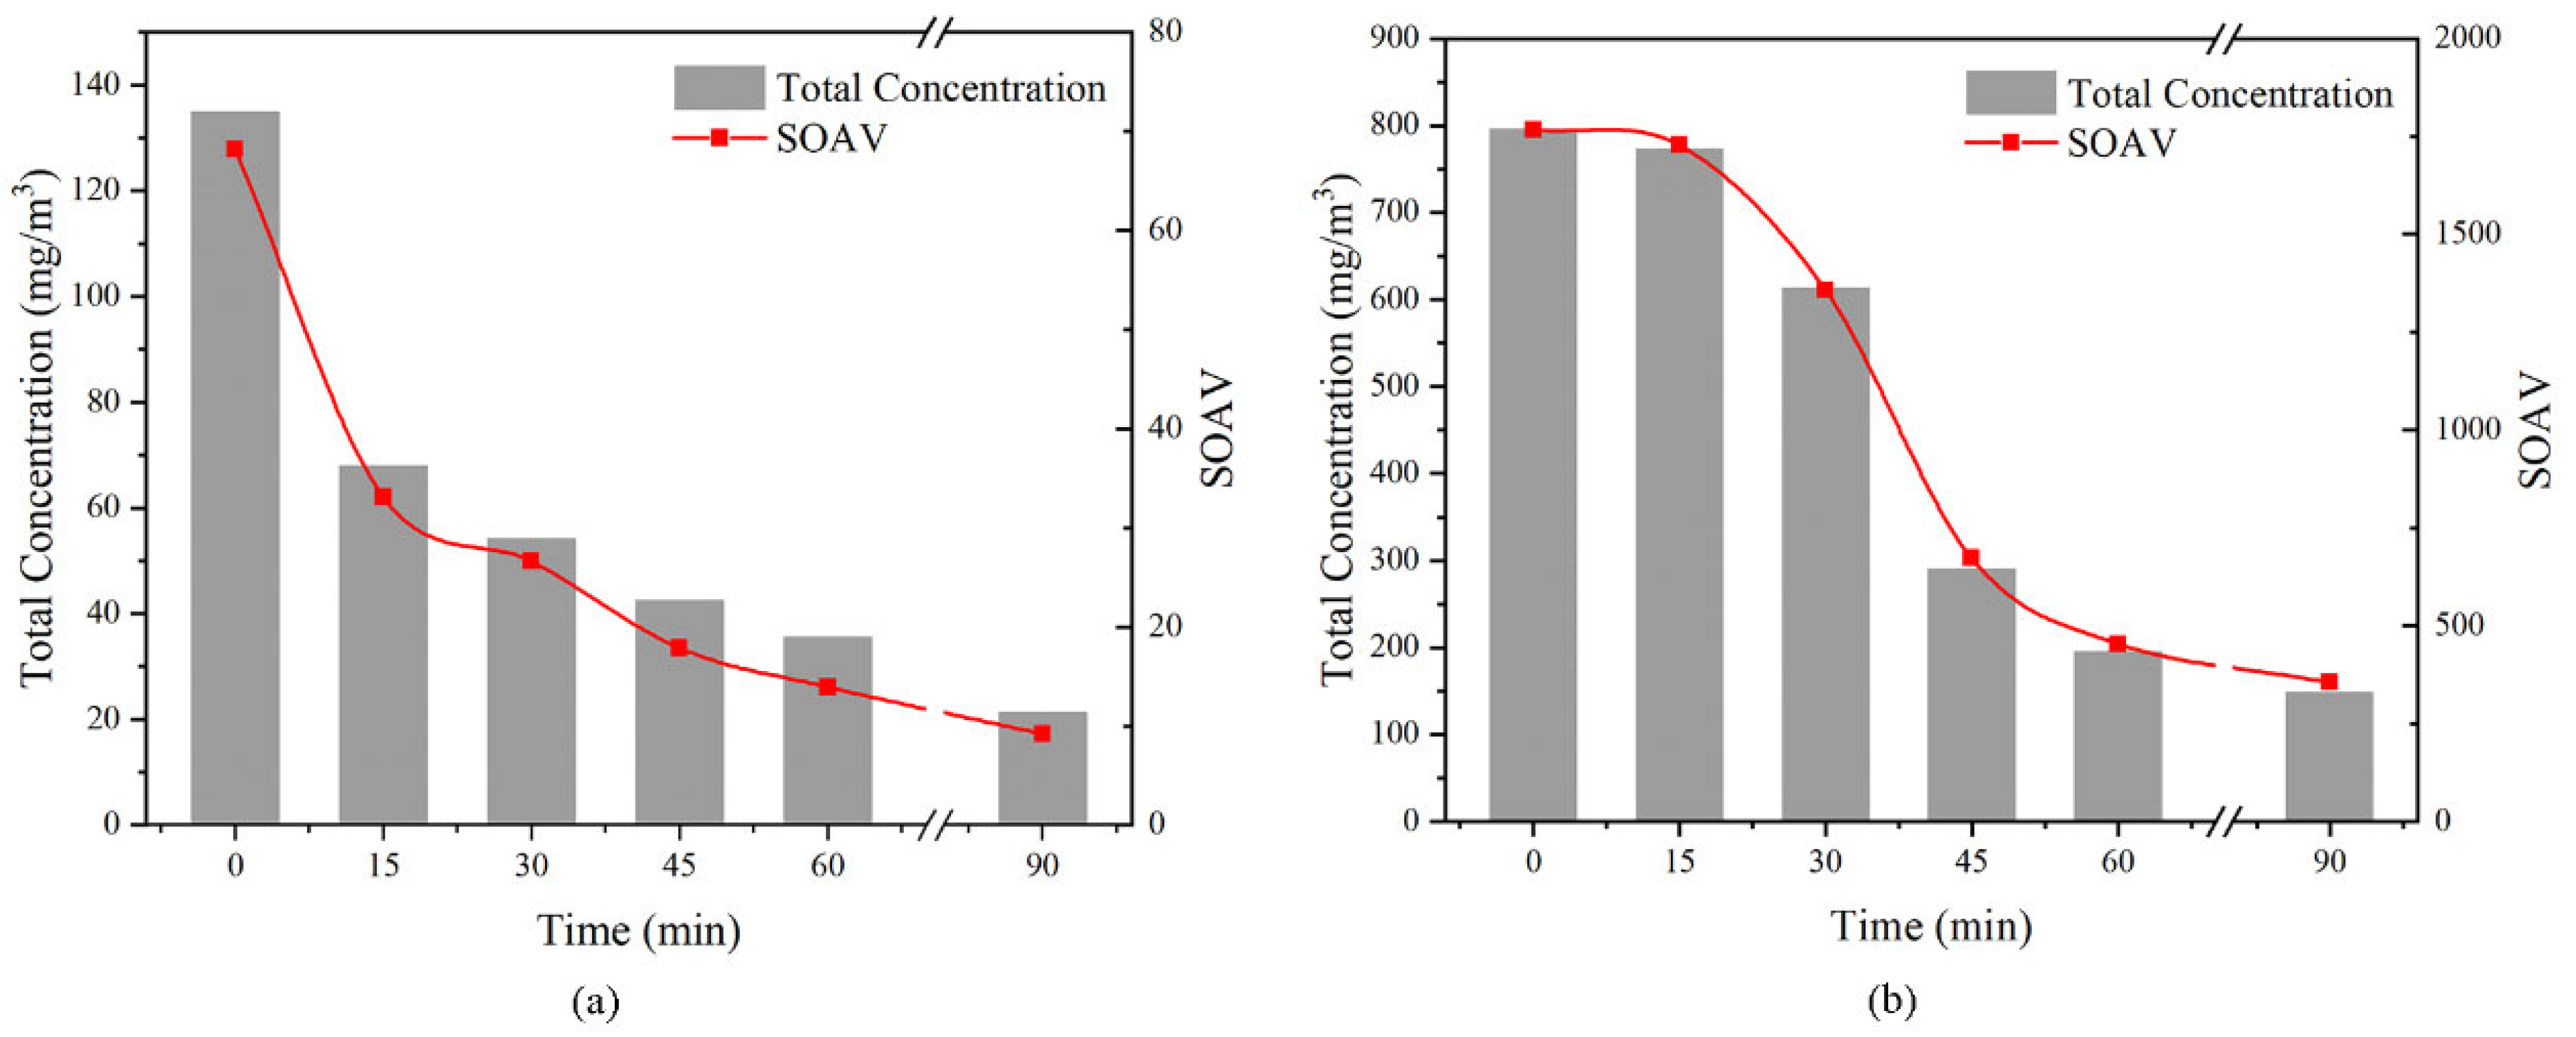
2.2. Trends in Concentrations and Odor Potentials with the Pre-Emission Time
2.3. Identification of the Key Volatile Pollutants from the Perspectives of Odor Nuisances and Health Risks
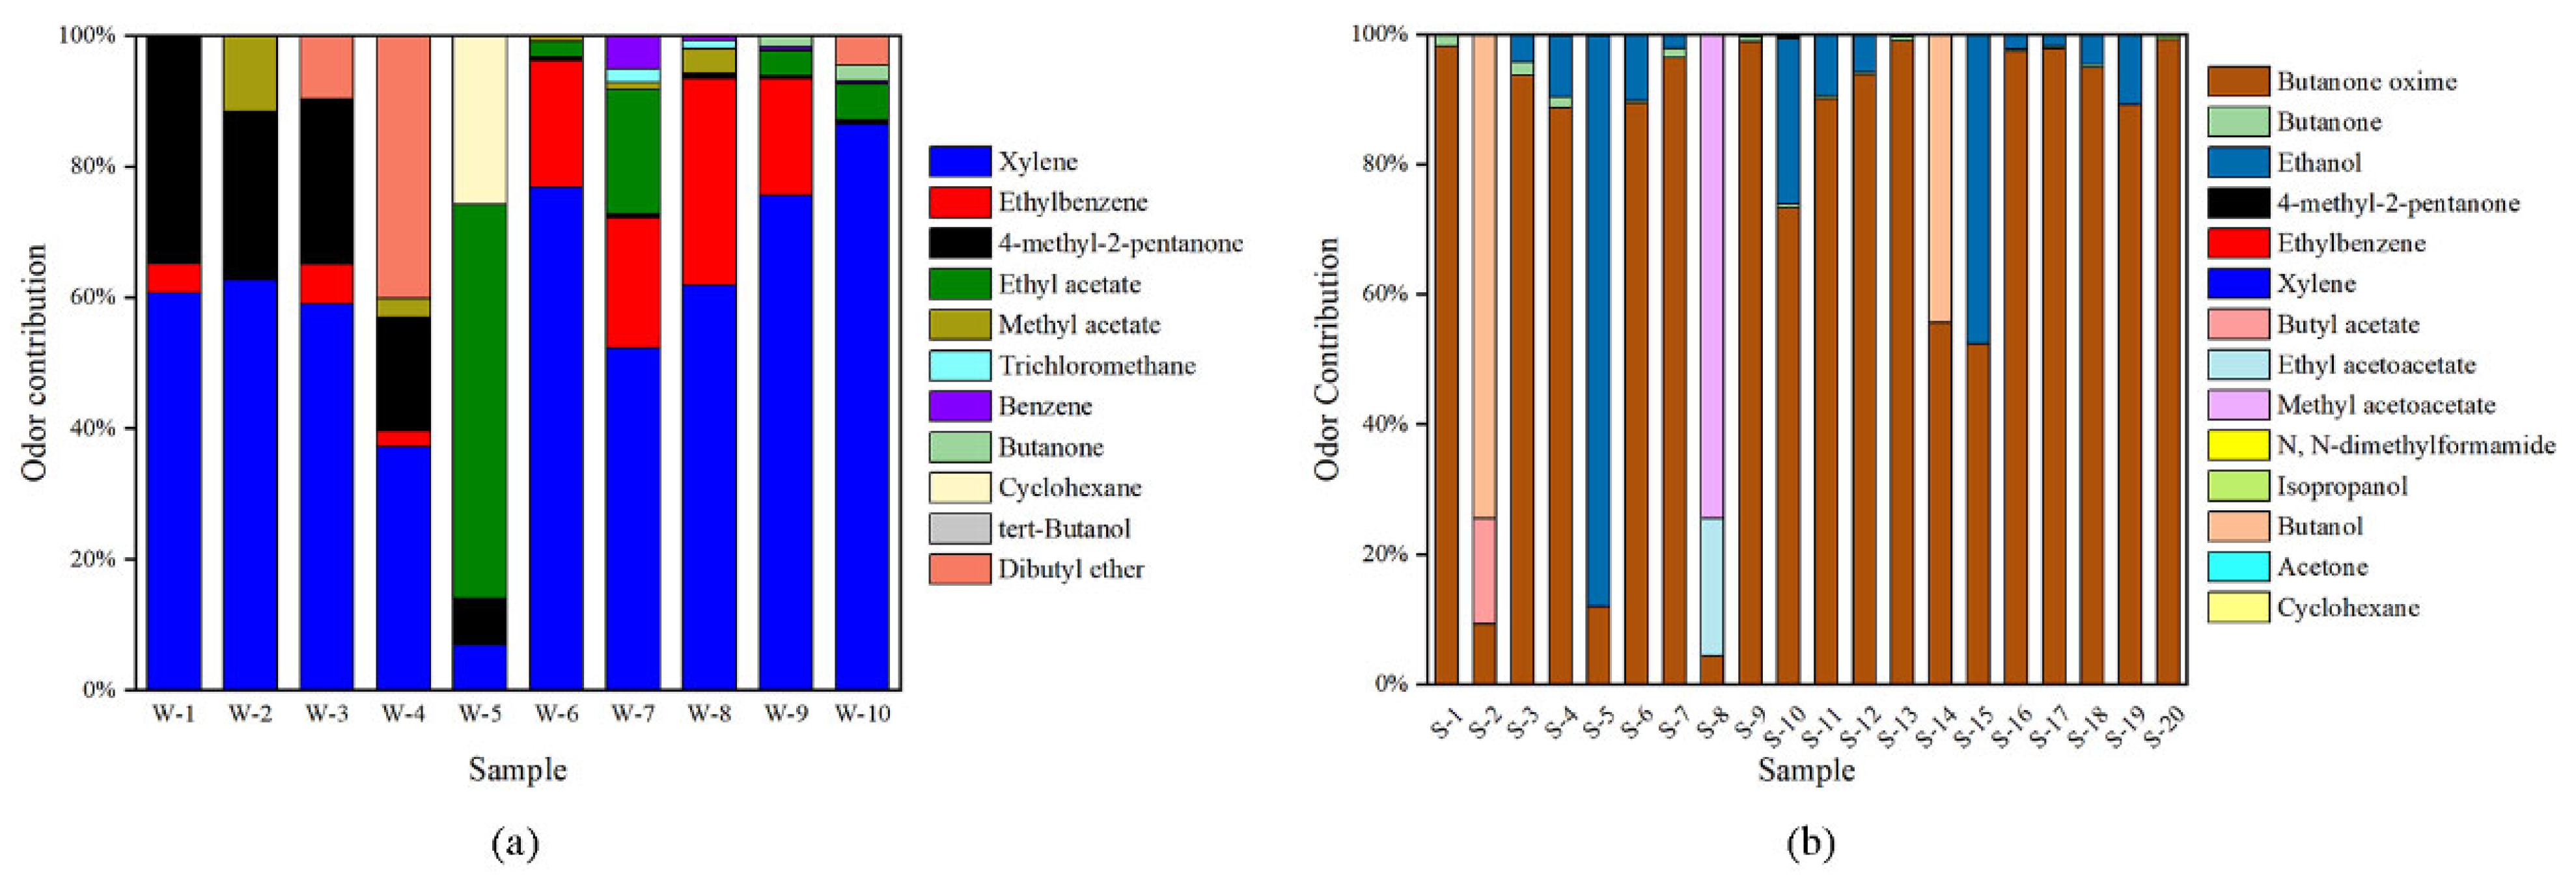
2.3.1. Odor Contribution of VOCs Emitted from the Adhesives
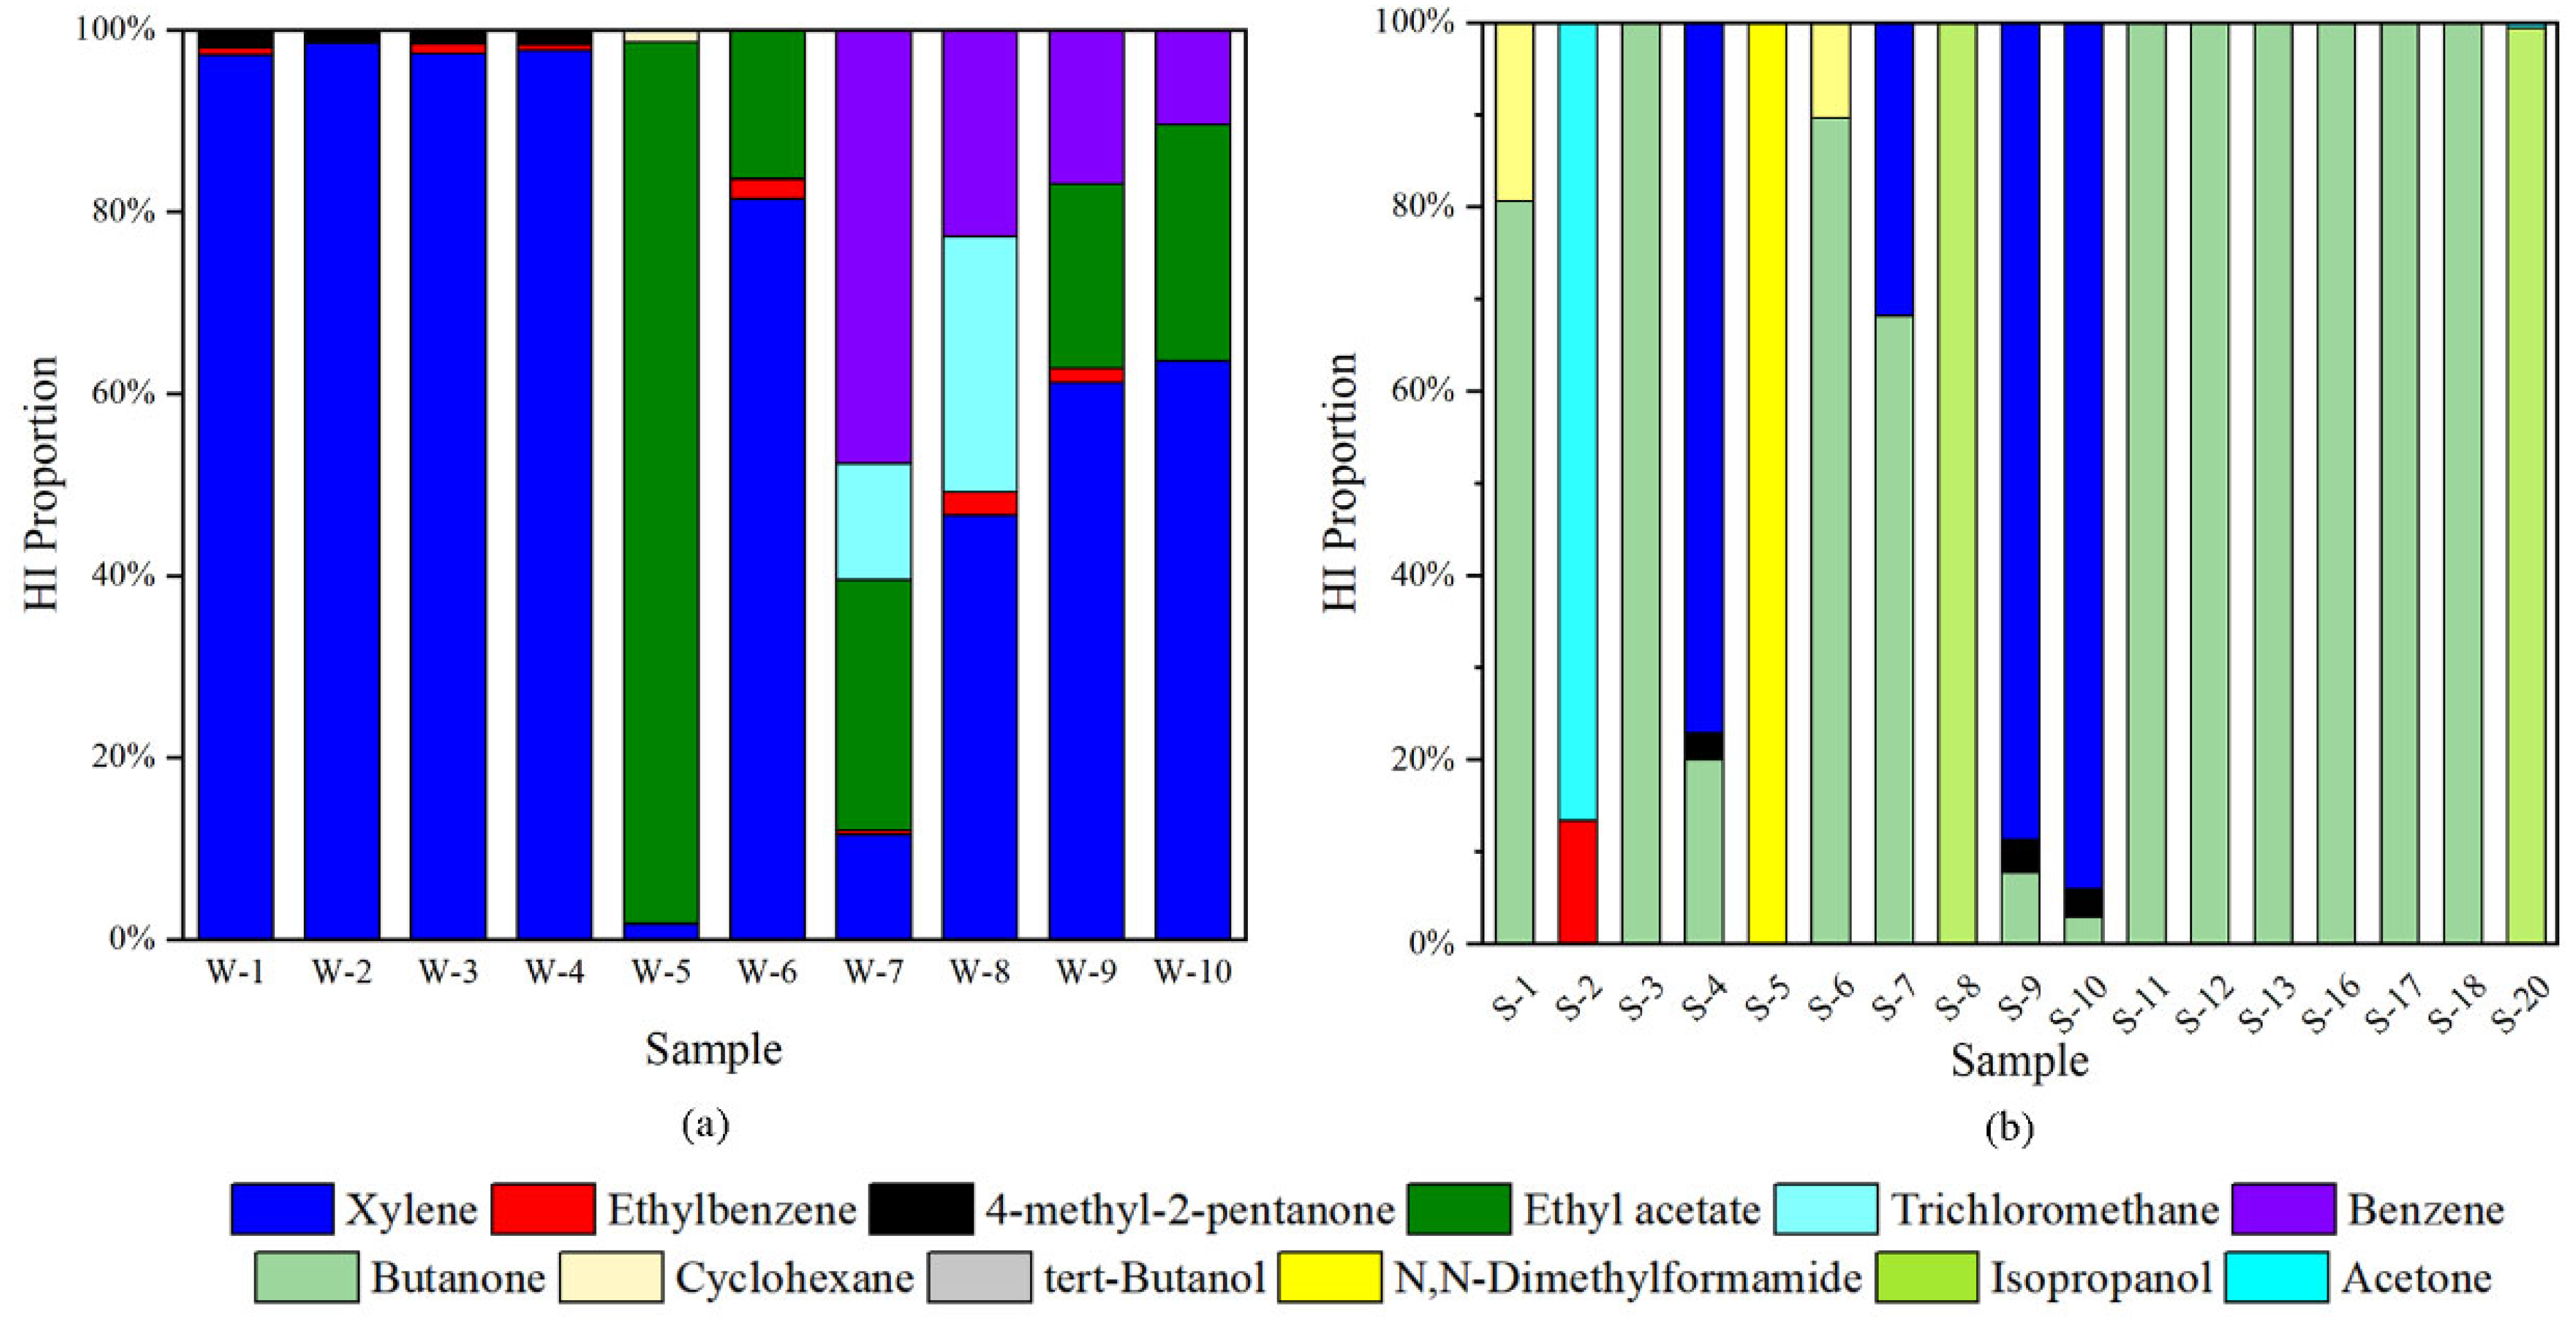
2.3.2. Health Risk Potentials
3. Materials and Methods
3.1. Sample Description
3.2. Gas Preparation
3.3. Chemical Analysis
3.4. Odor Analysis
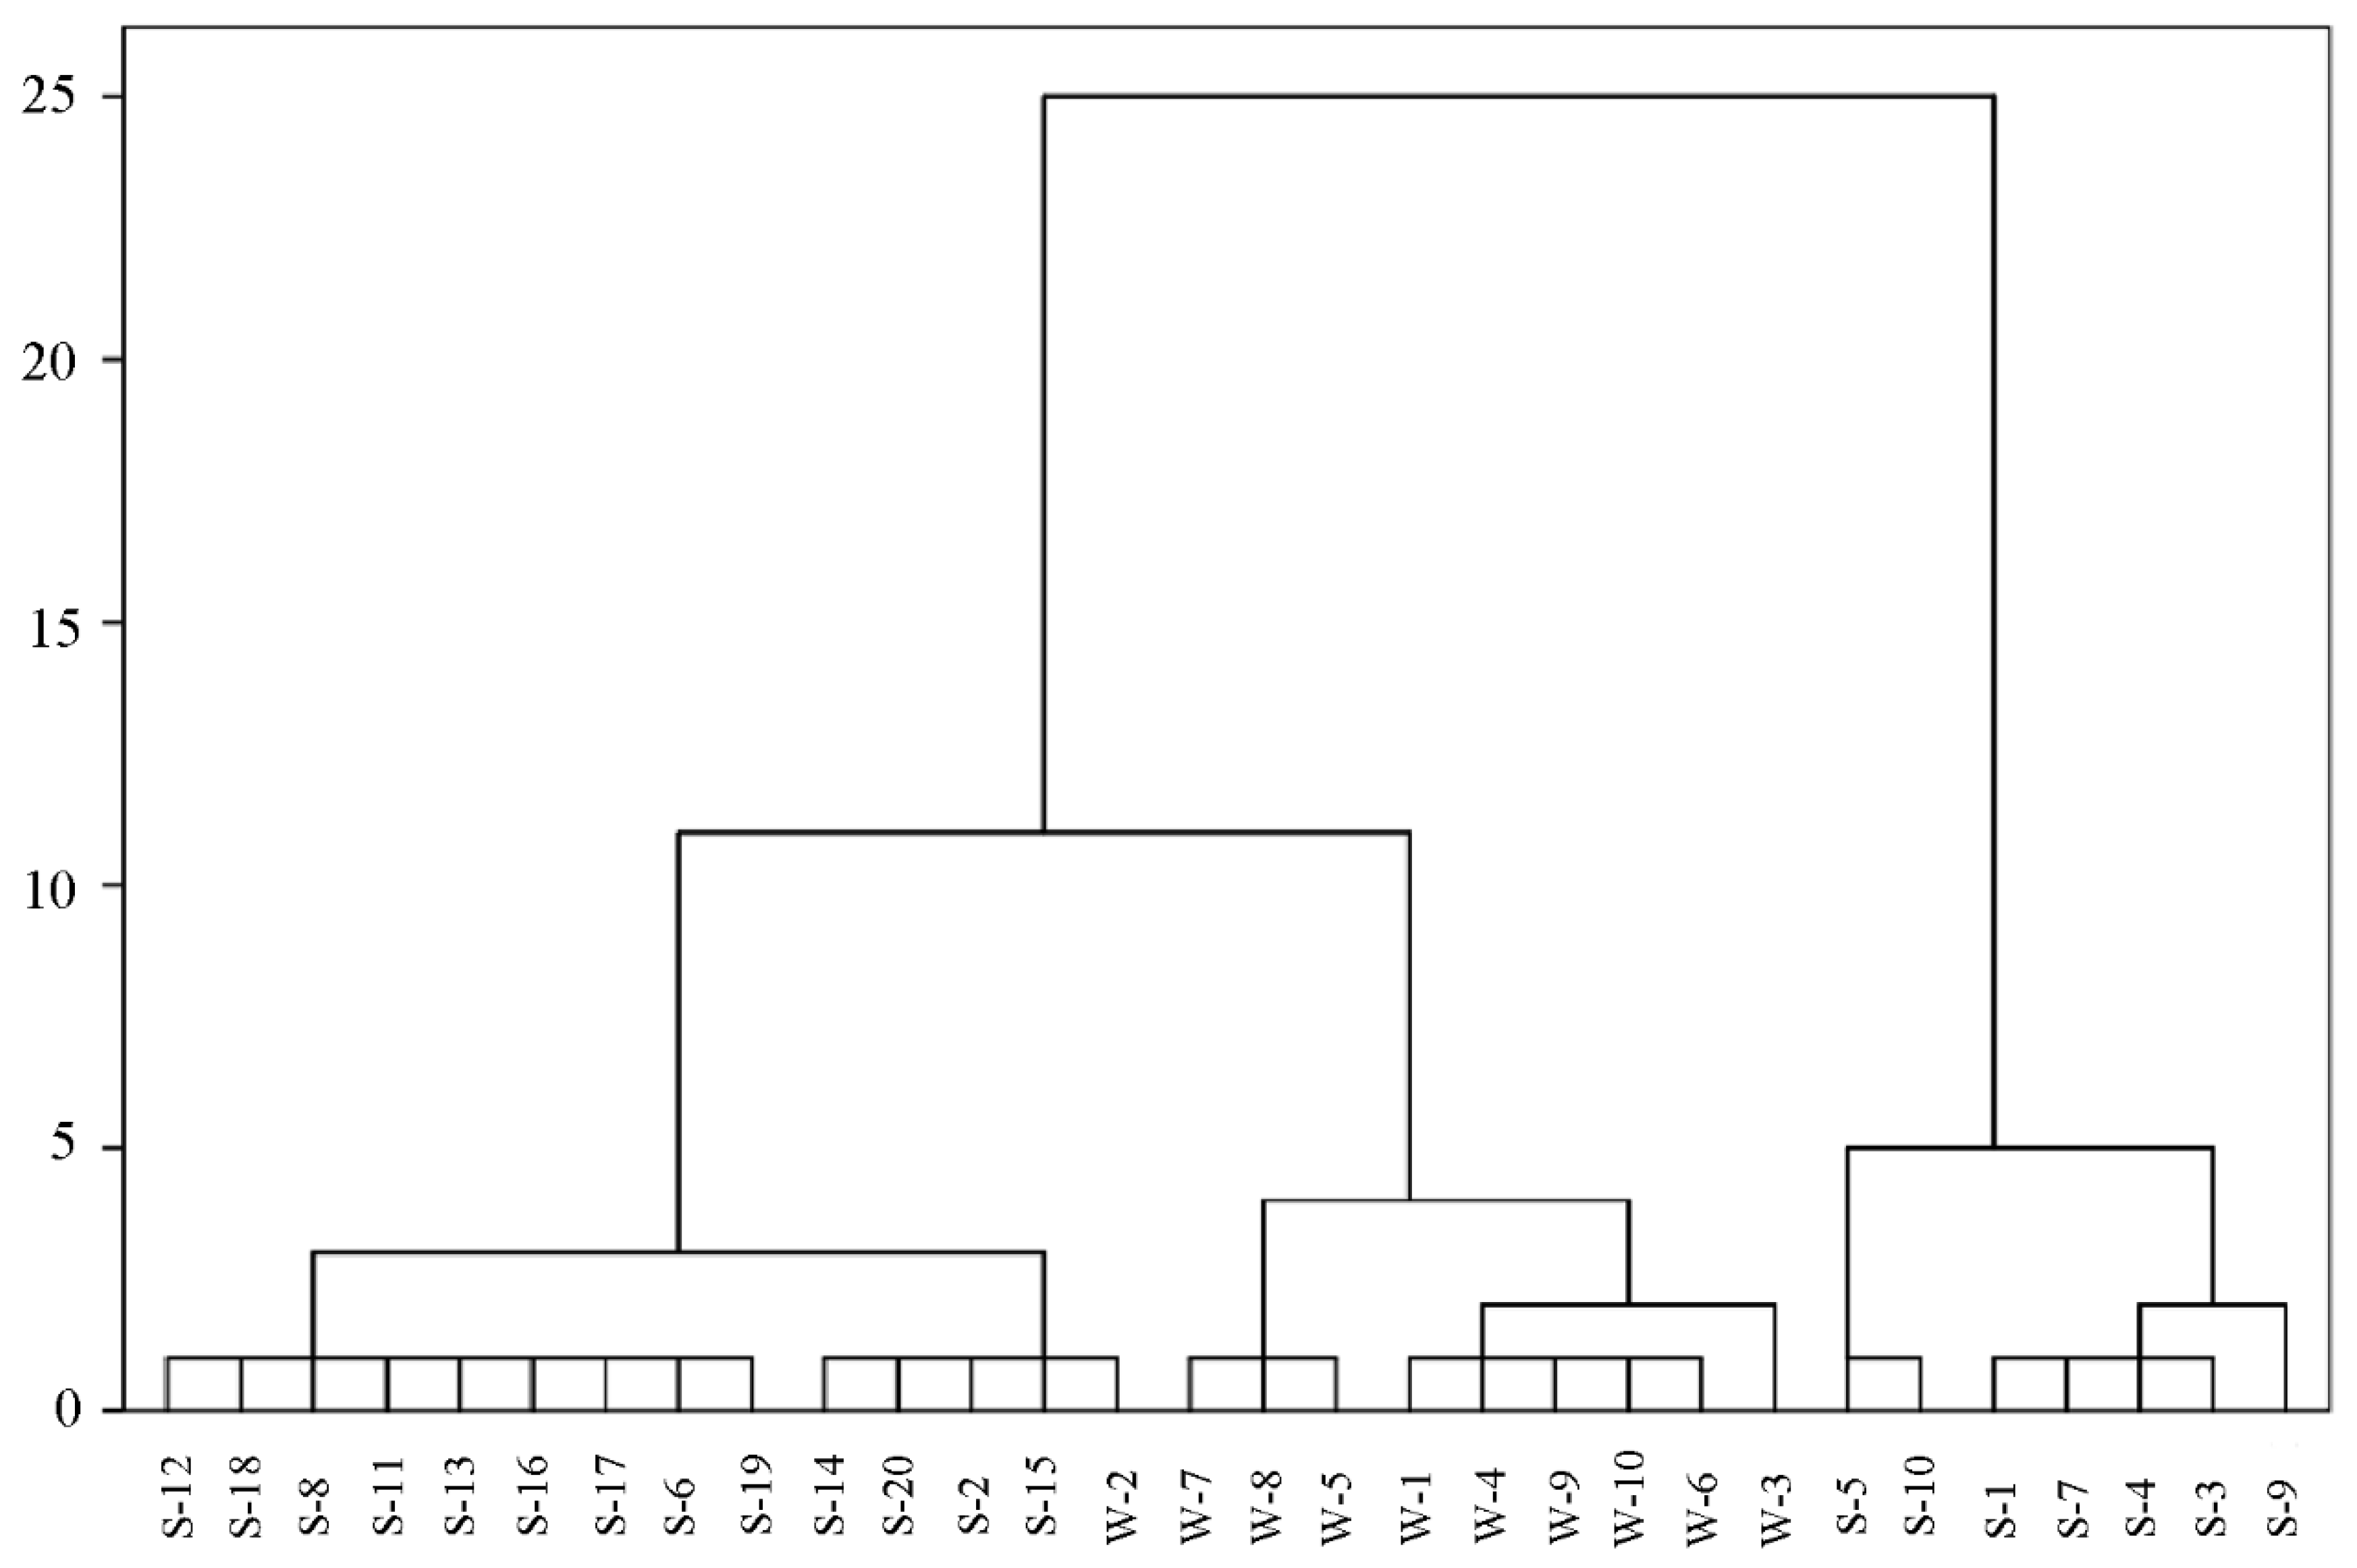
3.5. Data Analysis
4. Conclusions
Supplementary Materials
Author Contributions
Funding
Institutional Review Board Statement
Informed Consent Statement
Data Availability Statement
Conflicts of Interest
Sample Availability
References
- Gao, M.; Teng, W.; Du, Z.; Nie, L.; An, X.; Liu, W.; Sun, X.; Shen, Z.; Shi, A. Source profiles and emission factors of VOCs from solvent-based architectural coatings and their contributions to ozone and secondary organic aerosol formation in China. Chemosphere 2021, 275, 129815. [Google Scholar] [CrossRef] [PubMed]
- Wu, X.; Apte, M.G.; Maddalena, R.; Bennett, D.H. Volatile Organic Compounds in Small- and Medium-Sized Commercial Buildings in California. Environ. Sci. Technol. 2011, 45, 9075–9083. [Google Scholar] [CrossRef] [PubMed]
- Liang, W.; Wang, C.; Yang, C.; Yang, X. Volatile organic compounds in different interior construction stages of an apartment. Build. Environ. 2014, 81, 380–387. [Google Scholar] [CrossRef]
- Zhang, X.L.; Li, X.F.; Wang, Z.C.; Deng, G.F.; Wang, Z.Y. Exposure level and influential factors of HCHO, BTX and TVOC from the interior redecoration of residences. Build. Environ. 2020, 168, 106494. [Google Scholar] [CrossRef]
- Schieweck, A. Very volatile organic compounds (VVOC) as emissions from wooden materials and in indoor air of new prefabricated wooden houses. Build. Environ. 2021, 190, 107537. [Google Scholar] [CrossRef]
- Du, Z.; Mo, J.; Zhang, Y. Risk assessment of population inhalation exposure to volatile organic compounds and carbonyls in urban China. Environ. Int. 2014, 73, 33–45. [Google Scholar] [CrossRef]
- Andrade, A.; Dominski, F.H. Indoor air quality of environments used for physical exercise and sports practice: Systematic review. J. Environ. Manag. 2018, 206, 577–586. [Google Scholar] [CrossRef]
- Alomirah, H.F.; Moda, H.M. Assessment of Indoor Air Quality and Users Perception of a Renovated Office Building in Manchester. Int. J. Environ. Res. Public Health 2020, 17, 1972. [Google Scholar] [CrossRef] [Green Version]
- Azuma, K.; Ikeda, K.; Kagi, N.; Yanagi, U.; Osawa, H. Physicochemical risk factors for building-related symptoms in air-conditioned office buildings: Ambient particles and combined exposure to indoor air pollutants. Sci. Total Environ. 2018, 616, 1649–1655. [Google Scholar] [CrossRef]
- Sun, Y.X.; Zhang, Y.F.; Bao, L.J.; Fan, Z.G.; Wang, D.S.; Sundell, J. Effects of gender and dormitory environment on sick building syndrome symptoms among college students in Tianjin, China. Build. Environ. 2013, 68, 134–139. [Google Scholar] [CrossRef]
- Chino, S.; Kato, S.; Seo, J.; Ataka, Y. Study on emission of decomposed chemicals of esters contained in PVC flooring and adhesive. Build. Environ. 2009, 44, 1337–1342. [Google Scholar] [CrossRef] [Green Version]
- Du, Z.; Mo, J.; Zhang, Y.; Xu, Q. Benzene, toluene and xylenes in newly renovated homes and associated health risk in Guangzhou, China. Build. Environ. 2014, 72, 75–81. [Google Scholar] [CrossRef]
- Sarigiannis, D.A.; Karakitsios, S.P.; Gotti, A.; Liakos, I.L.; Katsoyiannis, A. Exposure to major volatile organic compounds and carbonyls in European indoor environments and associated health risk. Environ. Int. 2011, 37, 743–765. [Google Scholar] [CrossRef]
- Hazrati, S.; Rostami, R.; Fazlzadeh, M. BTEX in indoor air of waterpipe cafes: Levels and factors influencing their concentrations. Sci. Total Environ. 2015, 524, 347–353. [Google Scholar] [CrossRef]
- Xu, H.; Li, Y.; Feng, R.; He, K.; Ho, S.S.H.; Wang, Z.; Ho, K.F.; Sun, J.; Chen, J.; Wang, Y.; et al. Comprehensive characterization and health assessment of occupational exposures to volatile organic compounds (VOCs) in Xi’an, a major city of northwestern China. Atmos. Environ. 2021, 246, 118085. [Google Scholar] [CrossRef]
- Zhang, Z.-F.; Zhang, X.; Zhang, X.-M.; Liu, L.-Y.; Li, Y.-F.; Sun, W. Indoor occurrence and health risk of formaldehyde, toluene, xylene and total volatile organic compounds derived from an extensive monitoring campaign in Harbin, a megacity of China. Chemosphere 2020, 250, 126324. [Google Scholar] [CrossRef]
- Koivisto, A.J.; Kling, K.I.; Hanninen, O.; Jayjock, M.; Londahl, J.; Wierzbicka, A.; Fonseca, A.S.; Uhrbrand, K.; Boor, B.E.; Jimenez, A.S.; et al. Source specific exposure and risk assessment for indoor aerosols. Sci. Total Environ. 2019, 668, 13–24. [Google Scholar] [CrossRef] [PubMed]
- Norris, C.; Fang, L.; Barkjohn, K.K.; Carlson, D.; Zhang, Y.; Mo, J.; Li, Z.; Zhang, J.; Cui, X.; Schauer, J.J.; et al. Sources of volatile organic compounds in suburban homes in Shanghai, China, and the impact of air filtration on compound concentrations. Chemosphere 2019, 231, 256–268. [Google Scholar] [CrossRef] [PubMed]
- Plaisance, H.; Mocho, P.; Sauvat, N.; Vignau-Laulhere, J.; Raulin, K.; Desauziers, V. Using the chemical mass balance model to estimate VOC source contributions in newly built timber frame houses: A case study. Environ. Sci. Pollut. Res. 2017, 24, 24156–24166. [Google Scholar] [CrossRef] [PubMed]
- Shin, S.-H.; Jo, W.-K. Longitudinal variations in indoor VOC concentrations after moving into new apartments and indoor source characterization. Environ. Sci. Pollut. Res. 2013, 20, 3696–3707. [Google Scholar] [CrossRef]
- Jiang, C.J.; Li, D.D.; Zhang, P.Y.; Li, J.G.; Wang, J.; Yu, J.G. Formaldehyde and volatile organic compound (VOC) emissions from particleboard: Identification of odorous compounds and effects of heat treatment. Build. Environ. 2017, 117, 118–126. [Google Scholar] [CrossRef]
- Liang, W. Volatile organic compounds, odor, and inhalation health risks during interior construction of a fully furnished residential unit in Nanjing, China. Build. Environ. 2020, 186, 107366. [Google Scholar] [CrossRef]
- Jia, S.; Sankaran, G.; Wang, B.; Shang, H.; Tan, S.T.; Yap, H.M.; Shen, J.; Gutierrez, R.A.; Fang, W.; Liu, M.; et al. Exposure and risk assessment of volatile organic compounds and airborne phthalates in Singapore’s Child Care Centers. Chemosphere 2019, 224, 85–92. [Google Scholar] [CrossRef] [PubMed]
- Fang, L.; Norris, C.; Johnson, K.; Cui, X.; Sun, J.; Teng, Y.; Tian, E.; Xu, W.; Lig, Z.; Mo, J.; et al. Toxic volatile organic compounds in 20 homes in Shanghai: Concentrations, inhalation health risks, and the impacts of household air cleaning. Build. Environ. 2019, 157, 309–318. [Google Scholar] [CrossRef]
- Zhang, Z.C.; Xu, J.D.; Ye, T.L.; Chen, L.X.; Chen, H.; Yao, J. Distributions and temporal changes of benzene, toluene, ethylbenzene, and xylene concentrations in newly decorated rooms in southeastern China, and the health risks posed. Atmos. Environ. 2021, 246, 309–318. [Google Scholar] [CrossRef]
- Masih, A.; La, A.S.; Taneja, A.; Singhvi, R. Exposure profiles, seasonal variation and health risk assessment of BTEX in indoor air of homes at different microenvironments of a terai province of northern India. Chemosphere 2017, 176, 8–17. [Google Scholar] [CrossRef]
- Hadei, M.; Hopke, P.K.; Rafiee, M.; Rastkari, N.; Yarahmadi, M.; Kermani, M.; Shahsavani, A. Indoor and outdoor concentrations of BTEX and formaldehyde in Tehran, Iran: Effects of building characteristics and health risk assessment. Environ. Sci. Pollut. Res. 2018, 25, 27423–27437. [Google Scholar] [CrossRef]
- Missia, D.A.; Demetriou, E.; Michael, N.; Tolis, E.I.; Bartzis, J.G. Indoor exposure from building materials: A field study. Atmos. Environ. 2010, 44, 4388–4395. [Google Scholar] [CrossRef]
- Huang, L.; Wei, Y.; Zhang, L.; Ma, Z.; Zhao, W. Estimates of emission strengths of 43 VOCs in wintertime residential indoor environments, Beijing. Sci. Total Environ. 2021, 793, 148623. [Google Scholar] [CrossRef] [PubMed]
- Huang, Y.; Su, T.; Wang, L.; Wang, N.; Xue, Y.; Dai, W.; Lee, S.C.; Cao, J.; Ho, S.S.H. Evaluation and characterization of volatile air toxics indoors in a heavy polluted city of northwestern China in wintertime. Sci. Total Environ. 2019, 662, 470–480. [Google Scholar] [CrossRef]
- Trantallidi, M.; Dimitroulopoulou, C.; Wolkoff, P.; Kephalopoulos, S.; Carrer, P. EPHECT III: Health risk assessment of exposure to household consumer products. Sci. Total Environ. 2015, 536, 903–913. [Google Scholar] [CrossRef] [PubMed]
- Marchand, C.; Buillot, B.; Le Calve, S.; Mirabel, P. Aldehyde measurements in indoor environments in Strasbourg (France). Atmos. Environ. 2006, 40, 1336–1345. [Google Scholar] [CrossRef]
- Hormigos-Jimenez, S.; Padilla-Marcos, M.A.; Meiss, A.; Gonzalez-Lezcano, R.A.; Feijo-Munoz, J. Ventilation rate determination method for residential buildings according to TVOC emissions from building materials. Build. Environ. 2017, 123, 555–563. [Google Scholar] [CrossRef]
- Wilke, O.; Jann, O.; Brodner, D. VOG and SVOC-emissions from adhesives, floor coverings and complete floor structures. Indoor Air. 2004, 14, 98–107. [Google Scholar] [CrossRef]
- Guo, H. Evaluation of total volatile organic compound emissions from adhesives based on chamber tests. J. Air Waste Manag. Assoc. 2000, 50, 199–206. [Google Scholar] [CrossRef] [Green Version]
- Kim, S.; Cho, B. Influence of VOC and formaldehyde emission from tile adhesives on their indoor concentrations in buildings. J. Adhes. Sci. Technol. 2013, 27, 699–709. [Google Scholar] [CrossRef]
- Shin, S.H.; Jo, W.K. Volatile organic compound concentrations, emission rates, and source apportionment in newly-built apartments at pre-occupancy stage. Chemosphere 2012, 89, 569–578. [Google Scholar] [CrossRef]
- Liang, X.; Sun, X.; Lu, Q.; Ren, L.; Liu, M.; Su, Y.; Wang, S.; Lu, H.; Gao, B.; Zhao, W.; et al. VOC emission inventory of architectural coatings and adhesives for new buildings in China based on investigated and measured data. Atmos. Environ. 2021, 245, 118014. [Google Scholar] [CrossRef]
- Gao, M.; Liu, W.; Wang, H.; Shao, X.; Shi, A.; An, X.; Li, G.; Nie, L. Emission factors and characteristics of volatile organic compounds (VOCs) from adhesive application in indoor decoration in China. Sci. Total Environ. 2021, 779, 145169. [Google Scholar] [CrossRef]
- Kang, D.H.; Choi, D.H.; Seong, Y.B.; Yeo, M.S.; Kim, K.W. A numerical simulation of VOC emission and sorption behaviors of adhesive-bonded materials under floor heating condition. Build. Environ. 2013, 68, 193–201. [Google Scholar] [CrossRef]
- Jarnstrom, H.; Saarela, K.; Kalliokoski, P.; Pasanen, A.L. Comparison of VOC and ammonia emissions from individual PVC materials, adhesives and from complete structures. Environ. Int. 2008, 34, 420–427. [Google Scholar] [CrossRef] [PubMed]
- Jarnstrom, H.; Saarela, K.; Kalliokoski, P.; Pasanen, A.L. Reference values for indoor air pollutant concentrations in new, residential buildings in Finland. Atmos. Environ. 2006, 40, 7178–7191. [Google Scholar] [CrossRef]
- He, J.Z.; Lv, M.Q.; Yang, X.D. A one-dimensional VOC emission model of moisture-dominated cure adhesives. Build. Environ. 2019, 156, 171–177. [Google Scholar] [CrossRef]
- Wu, C.D.; Liu, J.M.; Zhao, P.; Li, W.H.; Yan, L.C.; Piringer, M.; Schauberger, G. Evaluation of the chemical composition and correlation between the calculated and measured odour concentration of odorous gases from a landfill in Beijing, China. Atmos. Environ. 2017, 164, 337–347. [Google Scholar] [CrossRef]
- Rincon, C.A.; De Guardia, A.; Couvert, A.; Le Roux, S.; Soutrel, I.; Daumoin, M.; Benoist, J.C. Chemical and odor characterization of gas emissions released during composting of solid wastes and digestates. J. Environ. Manag. 2019, 233, 39–53. [Google Scholar] [CrossRef] [PubMed]
- Wu, C.; Liu, J.; Zhao, P.; Piringer, M.; Schauberger, G. Conversion of the chemical concentration of odorous mixtures into odour concentration and odour intensity: A comparison of methods. Atmos. Environ. 2016, 127, 283–292. [Google Scholar] [CrossRef]
- Nie, E.Q.; Zheng, G.D.; Ma, C. Characterization of odorous pollution and health risk assessment of volatile organic compound emissions in swine facilities. Atmos. Environ. 2020, 223, 117233. [Google Scholar] [CrossRef]
- Wu, C.; Liu, J.; Liu, S.; Li, W.; Yan, L.; Shu, M.; Zhao, P.; Zhou, P.; Cao, W. Assessment of the health risks and odor concentration of volatile compounds from a municipal solid waste landfill in China. Chemosphere 2018, 202, 1–8. [Google Scholar] [CrossRef]
- Wang, Y.; Li, L.; Qiu, Z.; Yang, K.; Han, Y.; Chai, F.; Li, P.; Wang, Y. Trace volatile compounds in the air of domestic waste landfill site: Identification, olfactory effect and cancer risk. Chemosphere 2021, 272, 129582. [Google Scholar] [CrossRef]
- Wu, C.; Shu, M.; Liu, X.; Sang, Y.; Cai, H.; Qu, C.; Liu, J. Characterization of the volatile compounds emitted from municipal solid waste and identification of the key volatile pollutants. Waste. Manag. 2020, 103, 314–322. [Google Scholar] [CrossRef]


| Categories | Compounds | Concentrations (mg/m3) | Odor Threshold Value (mg/m3) | ||||
|---|---|---|---|---|---|---|---|
| Mean | Max | Med | Min | Fre (%) | |||
| White emulsion adhesives | 4-Methyl-2-pentanone | 10.35 | 55.34 | 0.66 | 0.25 | 100 | 0.7 |
| Ethylbenzene | 10.27 | 16.76 | 10.82 | 2.32 | 70 | 0.73 | |
| Xylene | 42.70 | 125.99 | 36.88 | 0.76 | 100 | 0.68 | |
| Ethyl acetate | 21.47 | 40.61 | 17.54 | 5.67 | 50 | 3.1 | |
| Trichloromethane | 22.23 | 26.38 | 22.23 | 18.08 | 20 | 19 | |
| Benzene | 29.69 | 66.78 | 18.34 | 15.29 | 40 | 8.6 | |
| Butanone | 2.85 | 3.30 | 2.85 | 2.41 | 20 | 1.3 | |
| Methyl acetate | 7.35 | 18.52 | 3.61 | 0.89 | 70 | 5.1 | |
| Cyclohexane | 9.01 | 35.47 | 0.22 | 0.12 | 30 | 8.5 | |
| Dibutyl ether | 3.18 | 5.76 | 3.26 | 0.50 | 30 | 0.11 | |
| Tert-Butanol | 4.62 | 4.62 | 4.62 | 4.62 | 10 | 14 | |
| Silicone adhesives | Butanone oxime | 668.34 | 2221.74 | 484.32 | 22.30 | 100 | 0.42 |
| Butanone | 33.17 | 108.81 | 10.04 | 4.13 | 65 | 1.3 | |
| 4-Methyl-2-pentanone | 6.95 | 10.28 | 7.36 | 3.22 | 15 | 0.7 | |
| Ethanol | 231.02 | 1132.35 | 98.69 | 2.59 | 70 | 0.99 | |
| Isopropanol | 79.30 | 128.33 | 79.30 | 30.27 | 10 | 65 | |
| Butanol | 26.41 | 46.72 | 26.41 | 6.09 | 10 | 0.11 | |
| Ethylbenzene | 0.18 | 0.18 | 0.18 | 0.18 | 5 | 0.73 | |
| Xylene | 4.75 | 10.03 | 4.34 | 0.30 | 20 | 0.68 | |
| Butyl acetate | 7.14 | 7.14 | 7.14 | 7.14 | 5 | 0.077 | |
| Ethyl acetoacetate | 41.34 | 41.34 | 41.34 | 41.34 | 5 | 0.025 | |
| Methyl acetoacetate | 360.00 | 360.00 | 360.00 | 360.00 | 5 | 0.062 | |
| N,N-Dimethylformamide | 1.89 | 1.89 | 1.89 | 1.89 | 5 | 0.79 | |
| Acetone | 33.03 | 37.10 | 33.03 | 28.96 | 10 | 10 | |
| Cyclohexane | 8.17 | 15.72 | 8.17 | 0.62 | 10 | 0.609 | |
Publisher’s Note: MDPI stays neutral with regard to jurisdictional claims in published maps and institutional affiliations. |
© 2022 by the authors. Licensee MDPI, Basel, Switzerland. This article is an open access article distributed under the terms and conditions of the Creative Commons Attribution (CC BY) license (https://creativecommons.org/licenses/by/4.0/).
Share and Cite
Zhao, Z.; Pei, Y.; Zhao, P.; Wu, C.; Qu, C.; Li, W.; Zhao, Y.; Liu, J. Characterizing Key Volatile Pollutants Emitted from Adhesives by Chemical Compositions, Odor Contributions and Health Risks. Molecules 2022, 27, 1125. https://0-doi-org.brum.beds.ac.uk/10.3390/molecules27031125
Zhao Z, Pei Y, Zhao P, Wu C, Qu C, Li W, Zhao Y, Liu J. Characterizing Key Volatile Pollutants Emitted from Adhesives by Chemical Compositions, Odor Contributions and Health Risks. Molecules. 2022; 27(3):1125. https://0-doi-org.brum.beds.ac.uk/10.3390/molecules27031125
Chicago/Turabian StyleZhao, Zixuan, Yipu Pei, Peng Zhao, Chuandong Wu, Chen Qu, Weifang Li, Yanjun Zhao, and Jiemin Liu. 2022. "Characterizing Key Volatile Pollutants Emitted from Adhesives by Chemical Compositions, Odor Contributions and Health Risks" Molecules 27, no. 3: 1125. https://0-doi-org.brum.beds.ac.uk/10.3390/molecules27031125