
Synthesis and Characterization of an α-Fe2O3-Decorated g-C3N4 Heterostructure for the Photocatalytic Removal of MO


Abstract
:1. Introduction
2. Results and Discussion
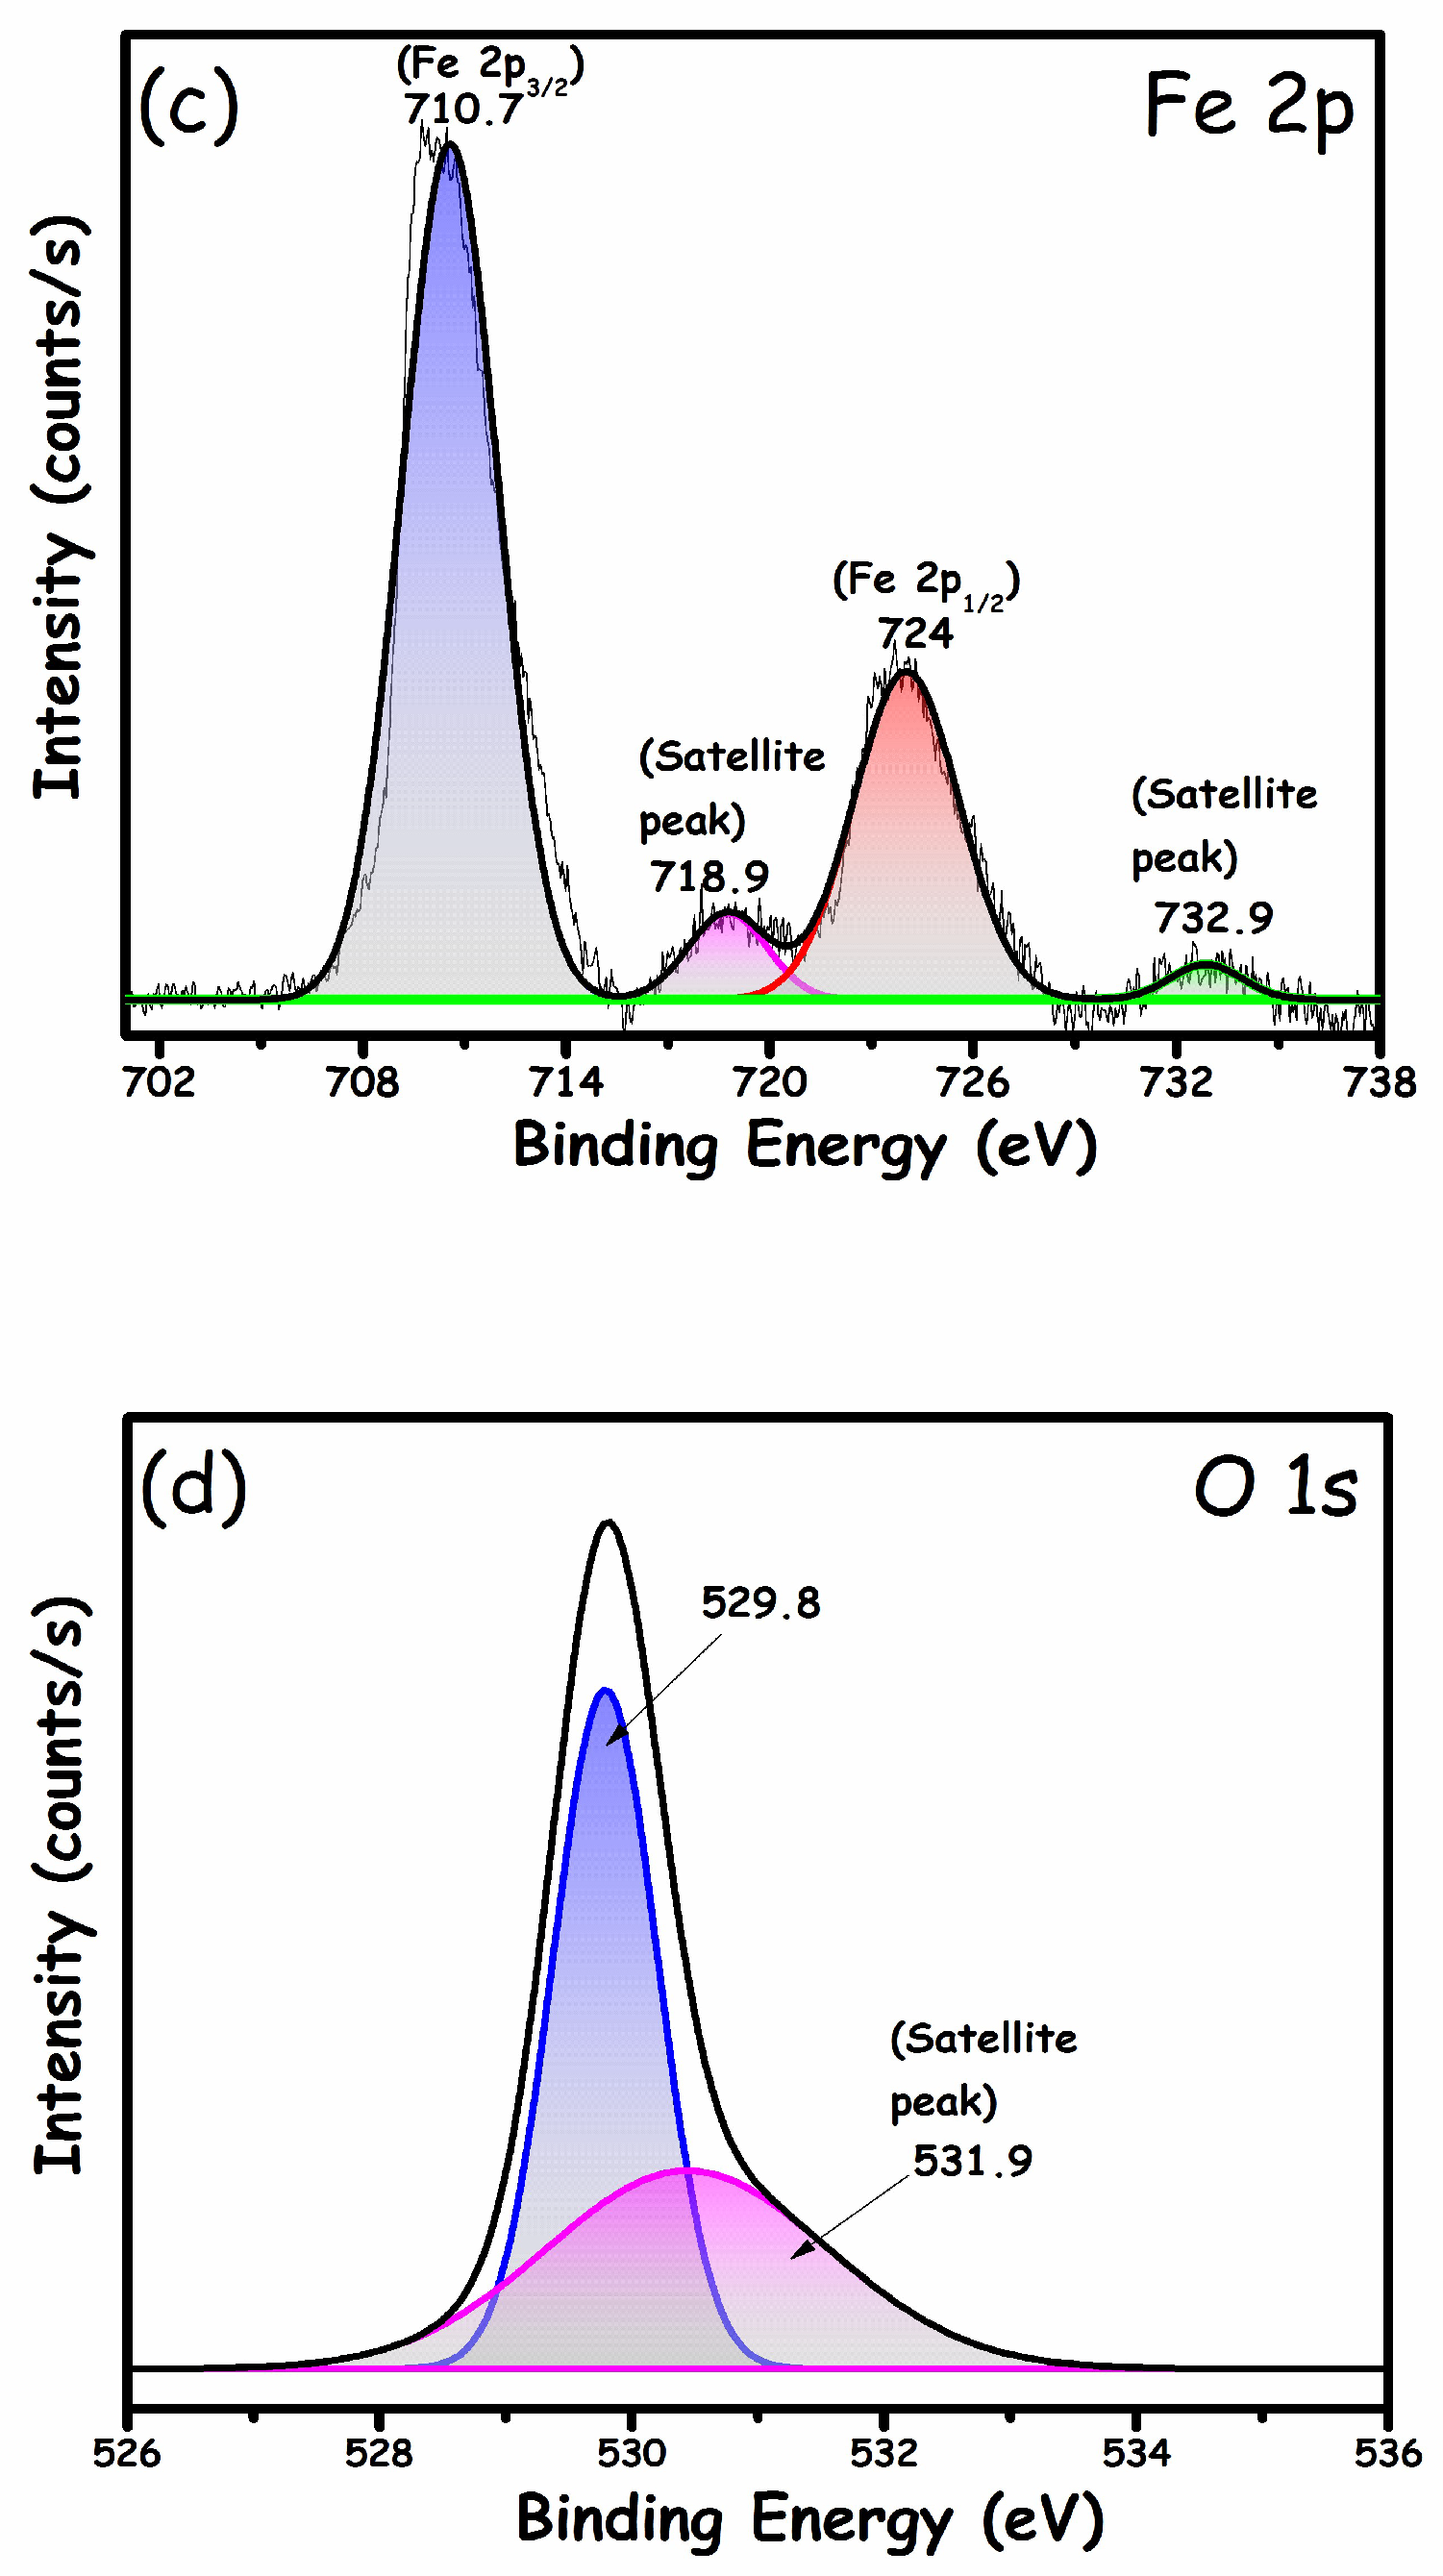
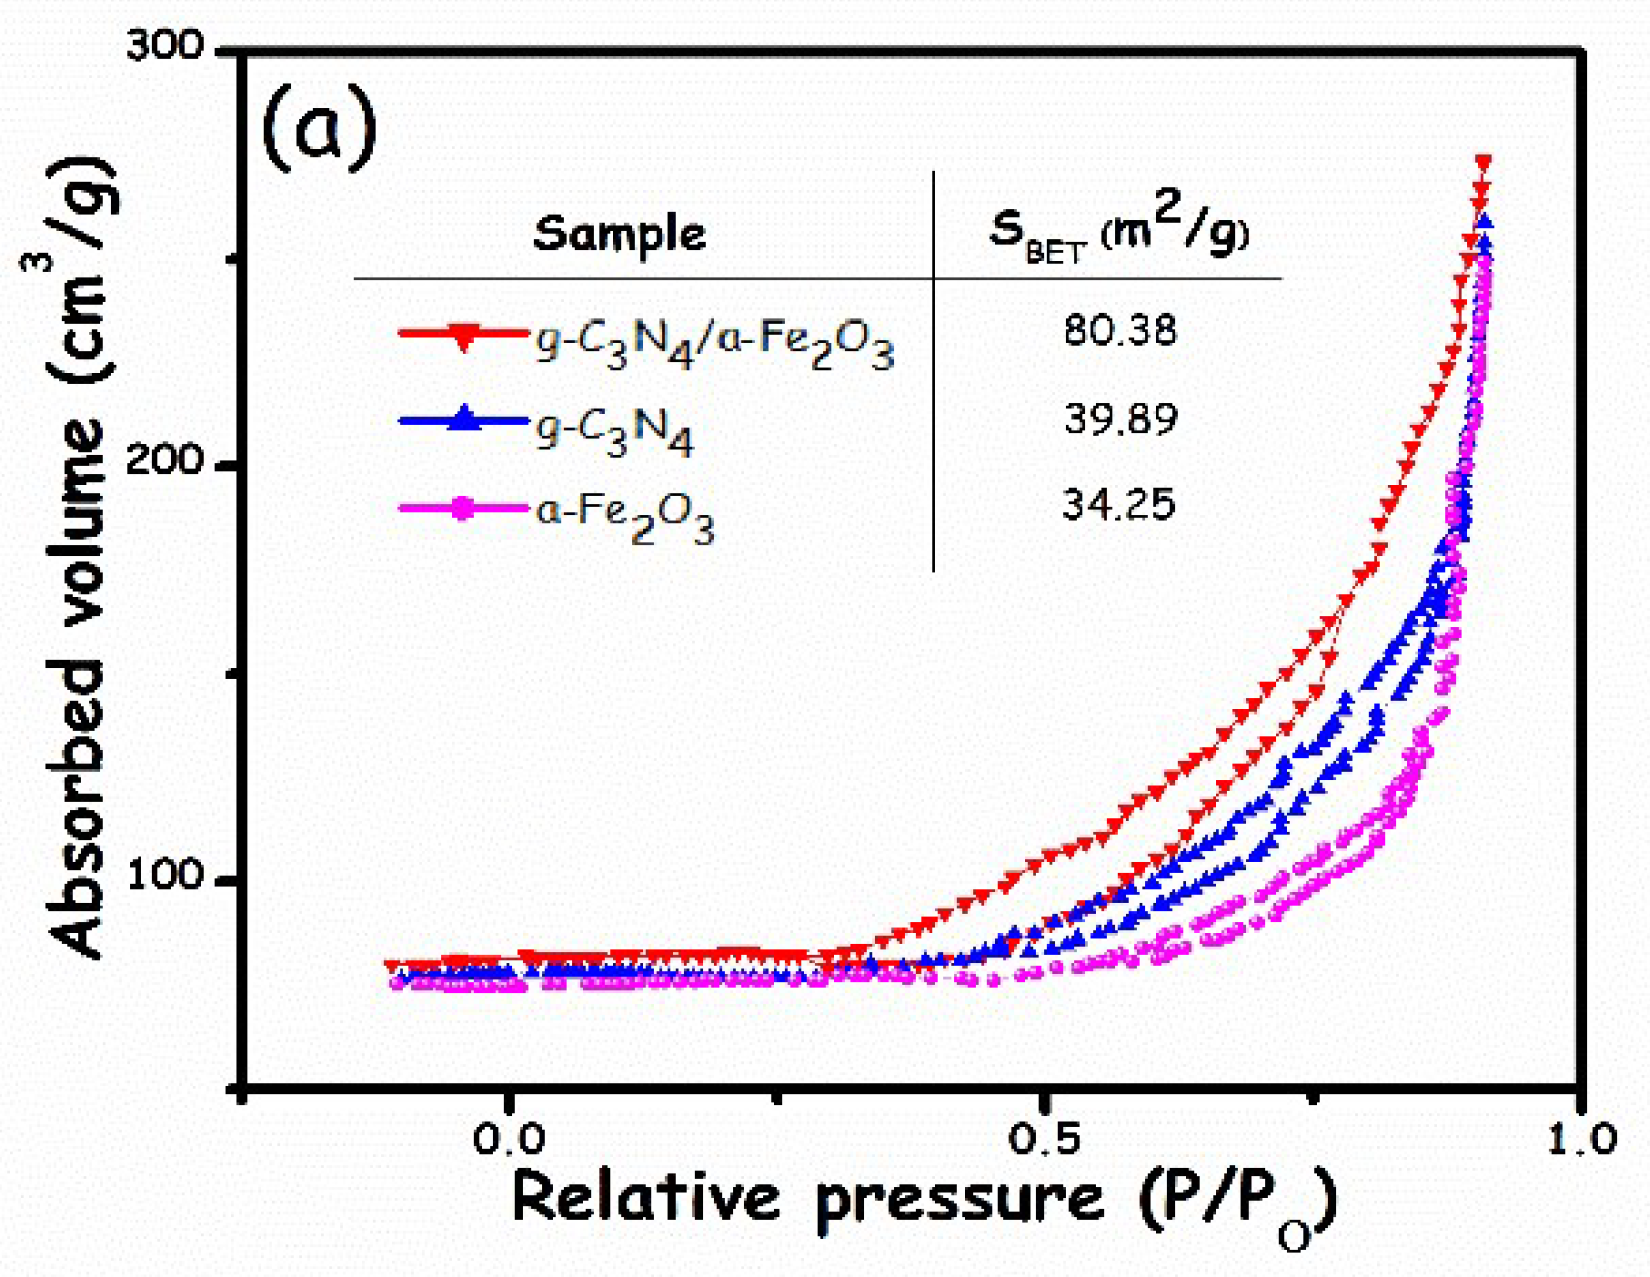
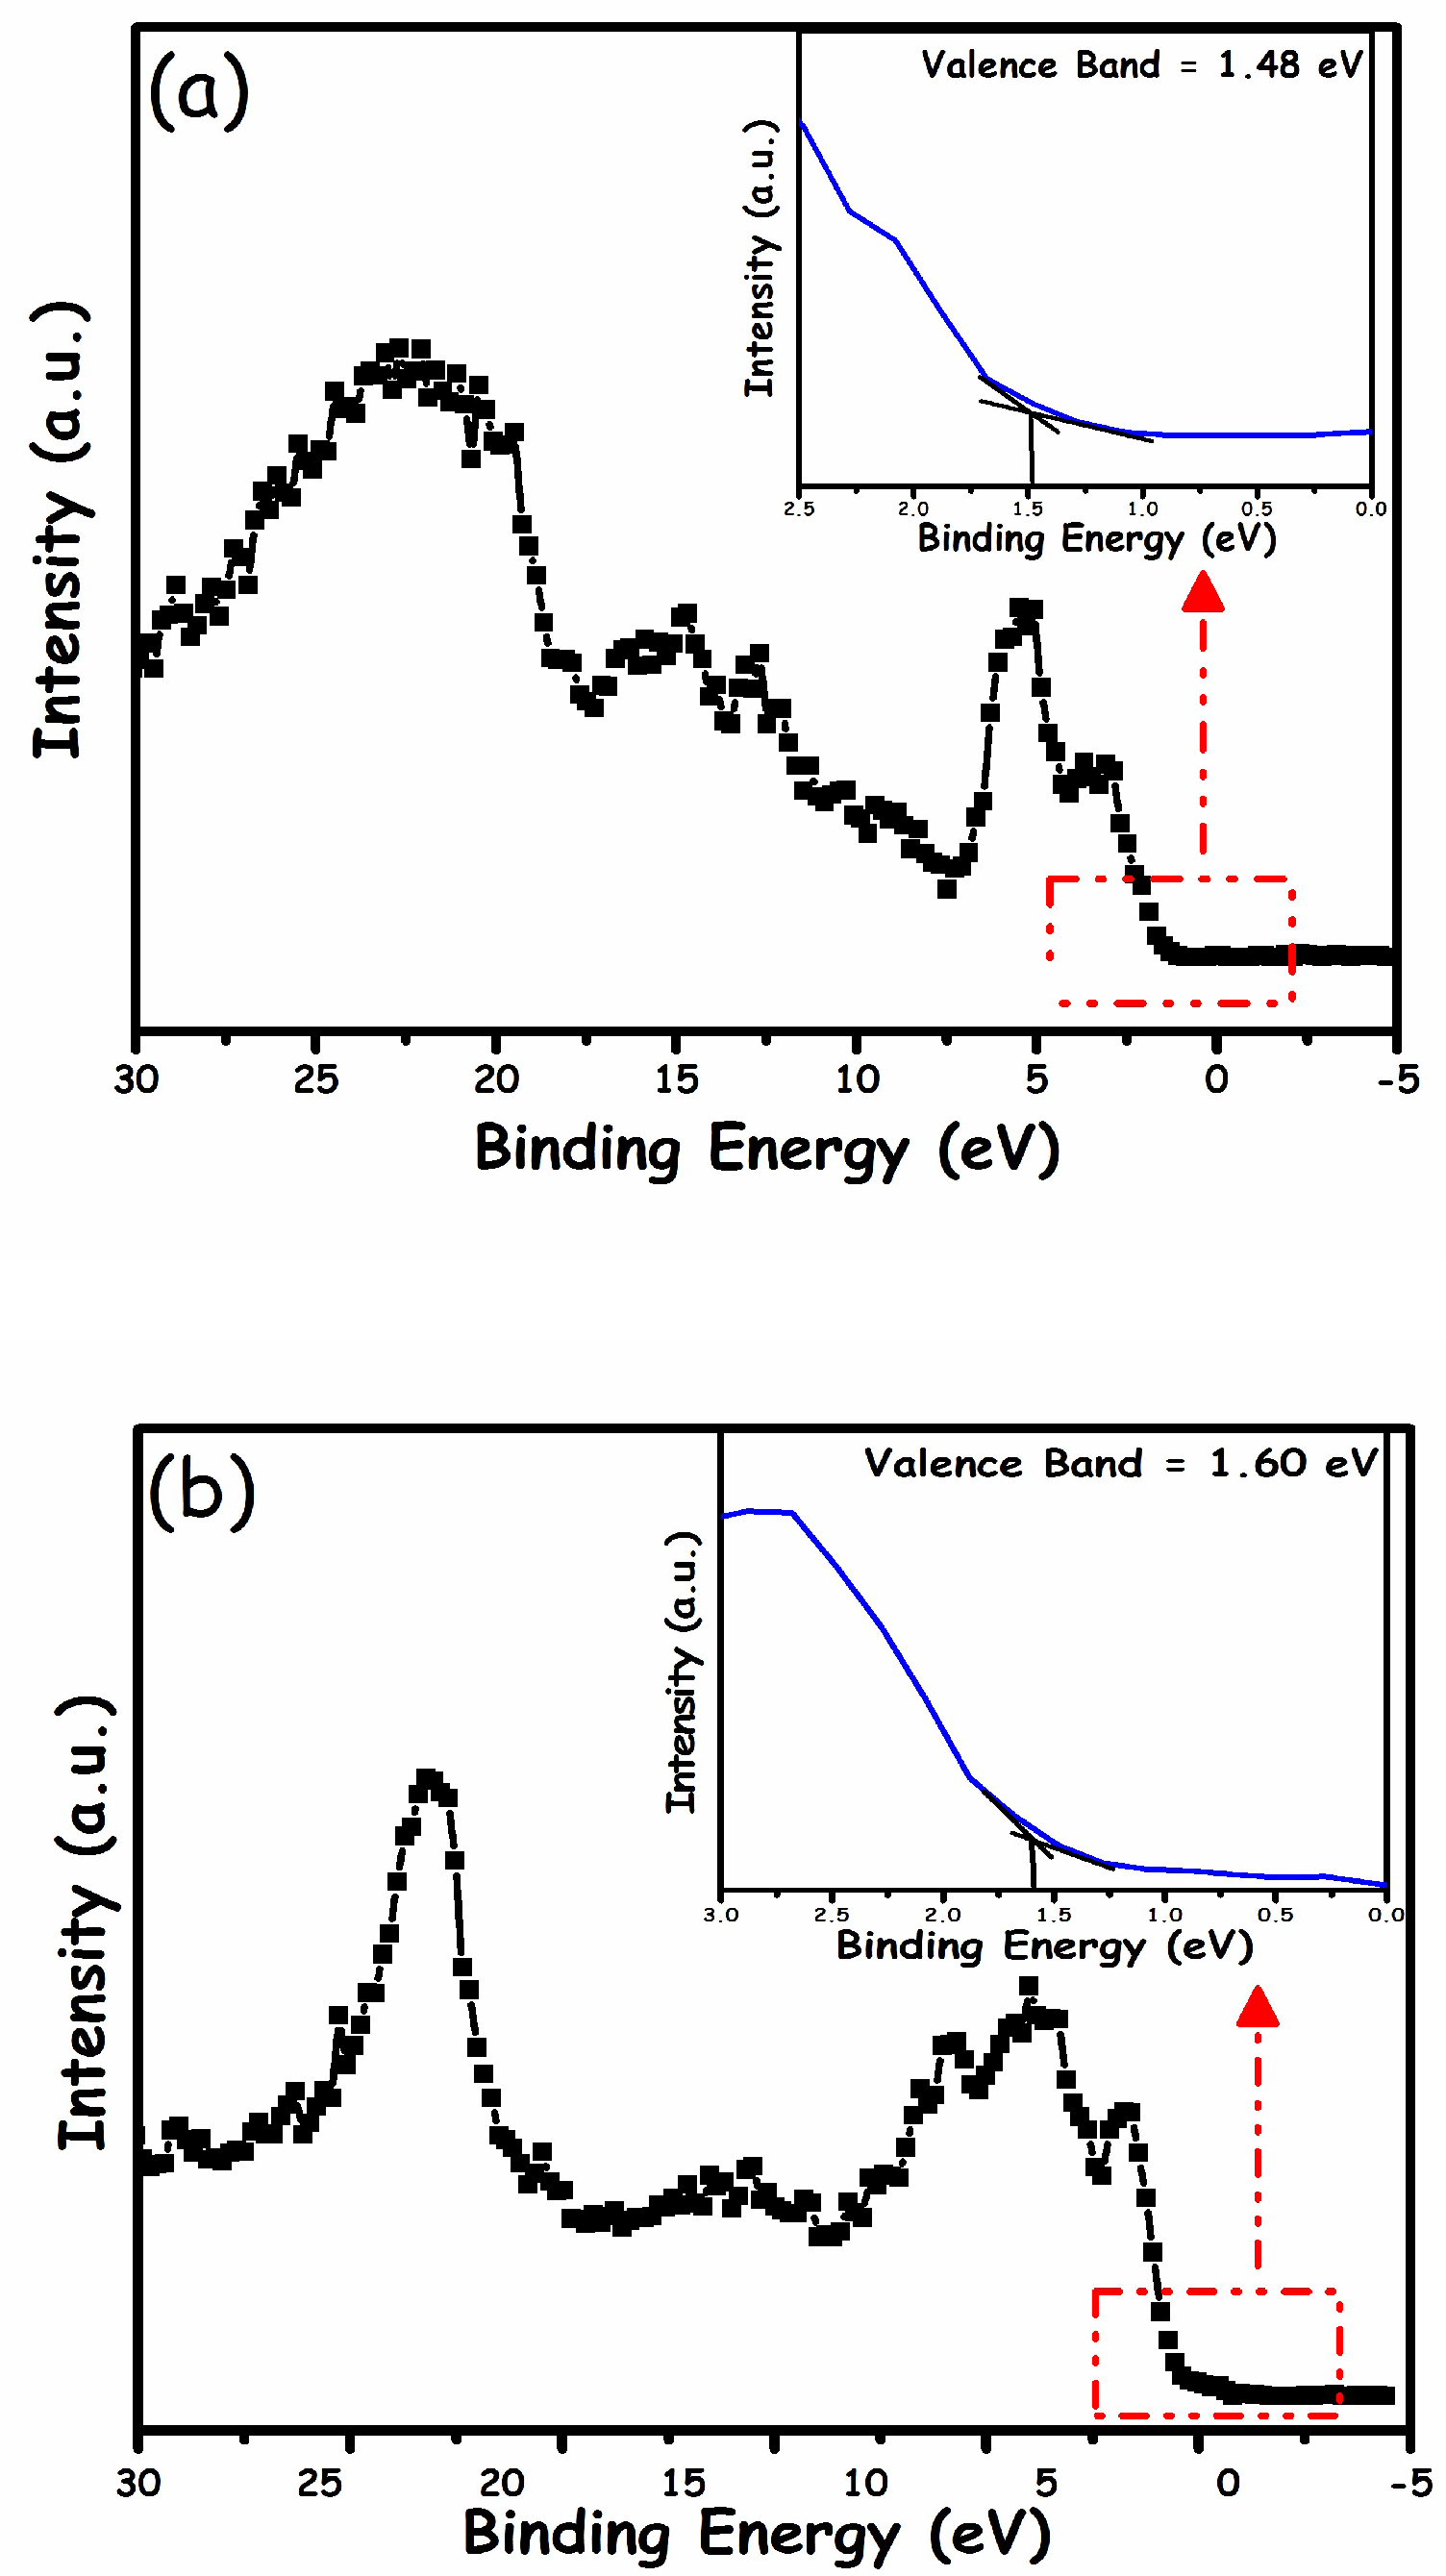
2.1. Physiochemical and Optoelectronic Properties of All the Synthesized Photocatalysts
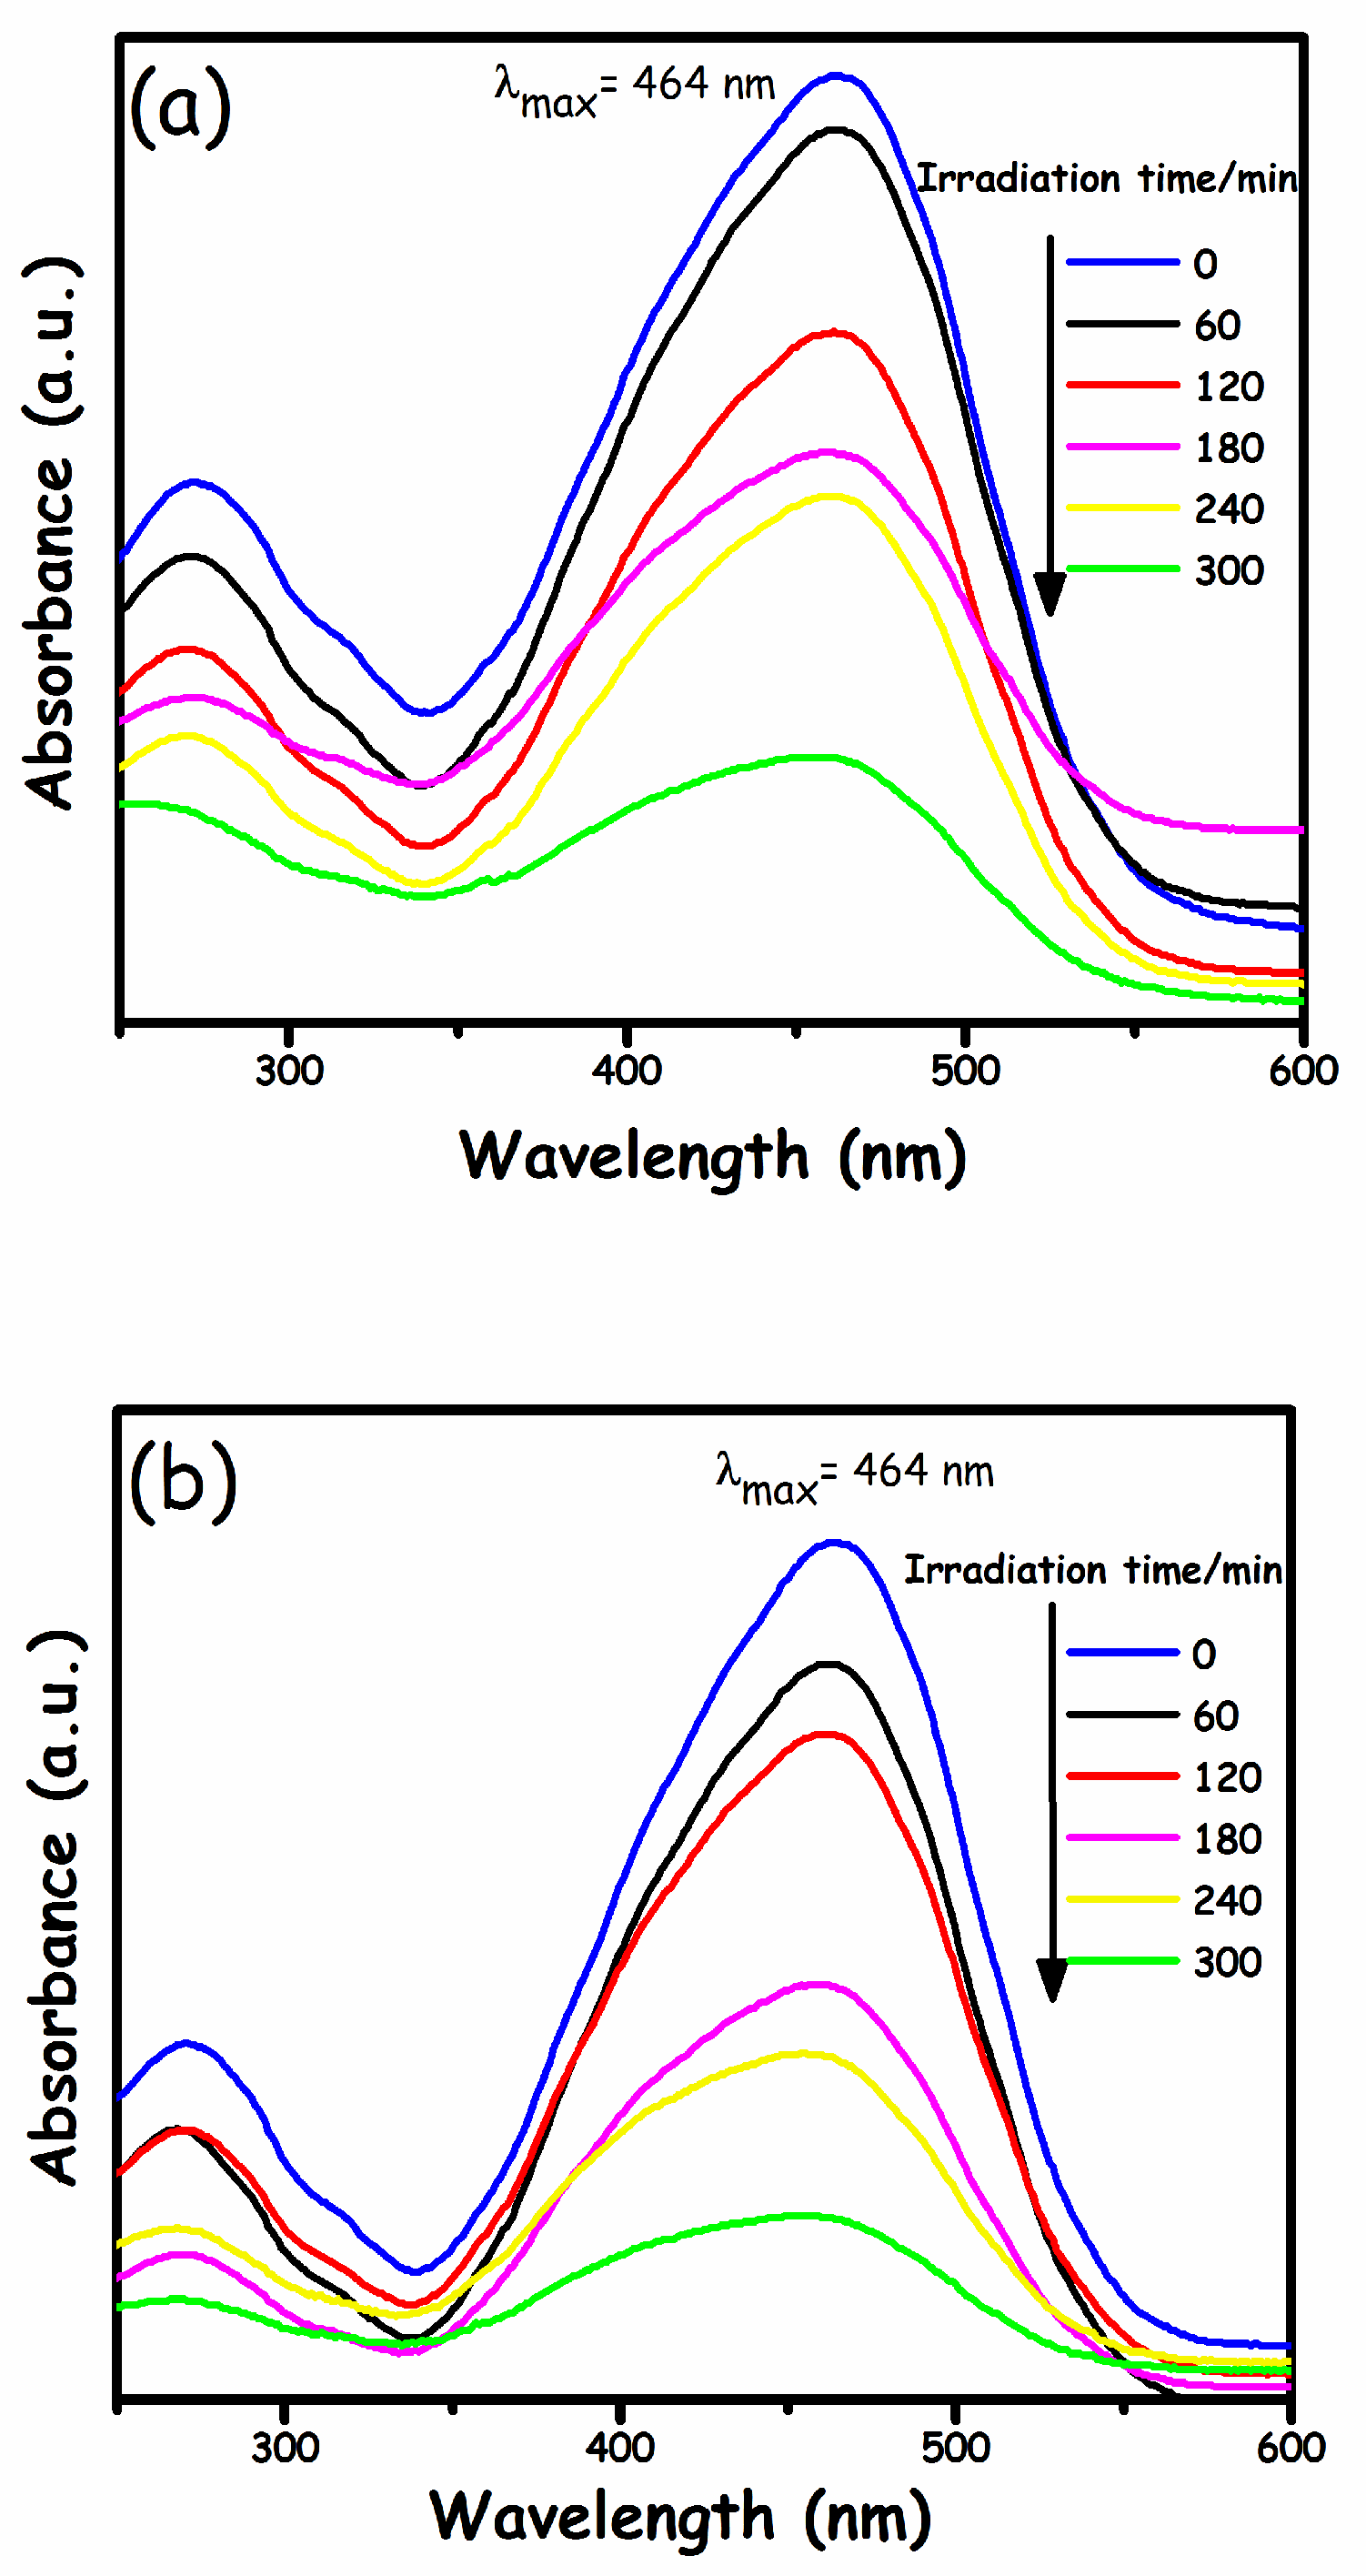
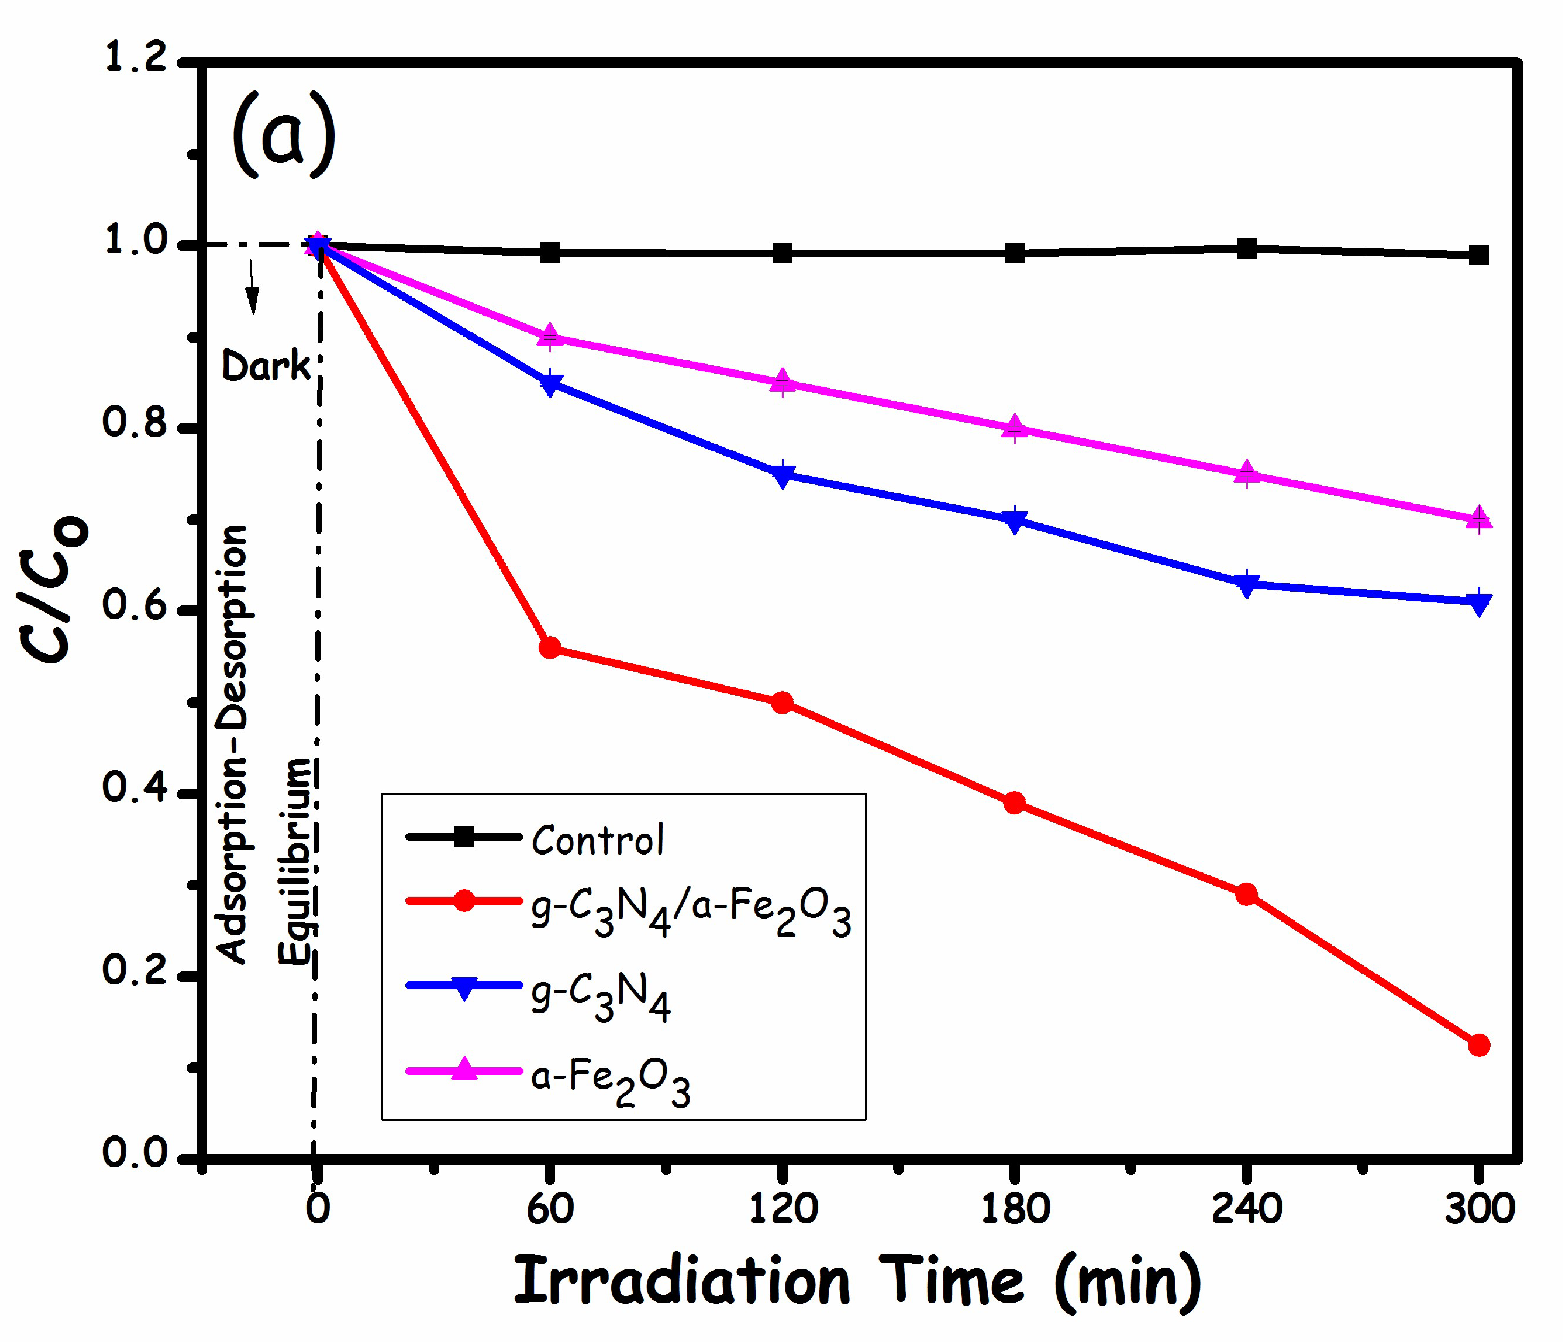
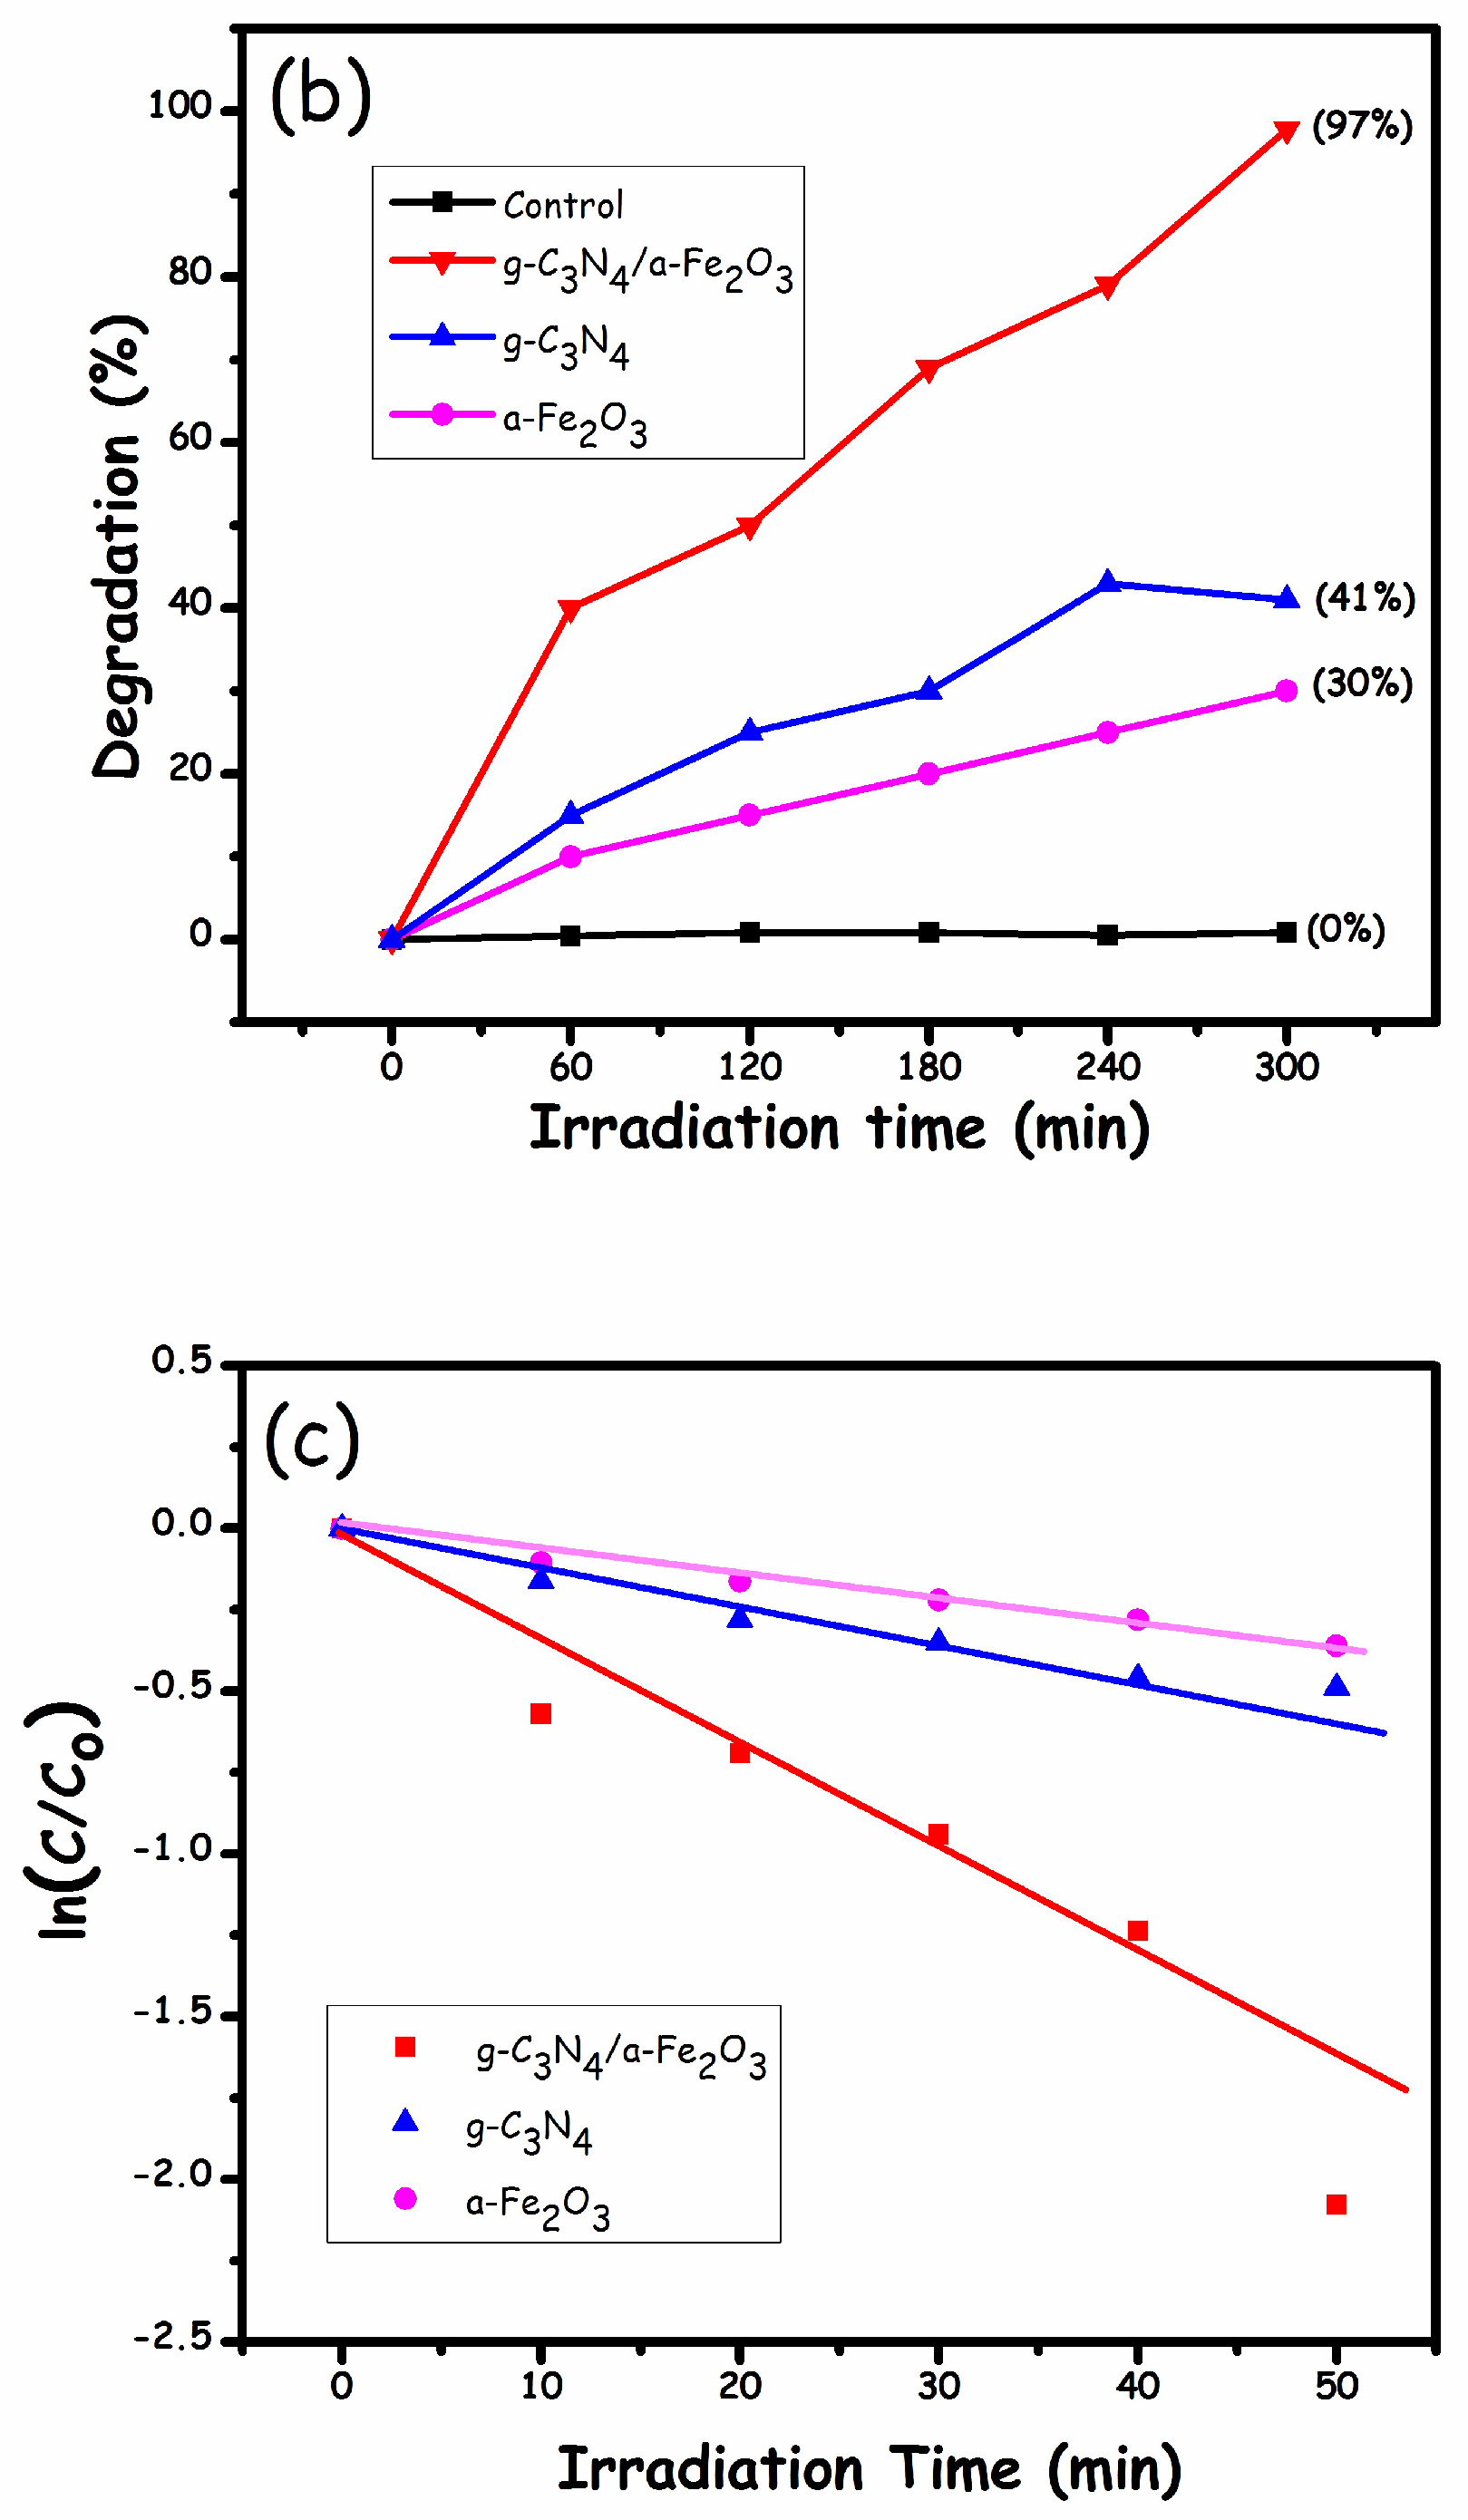
2.2. Photocatalytic Performance for MO Degradation
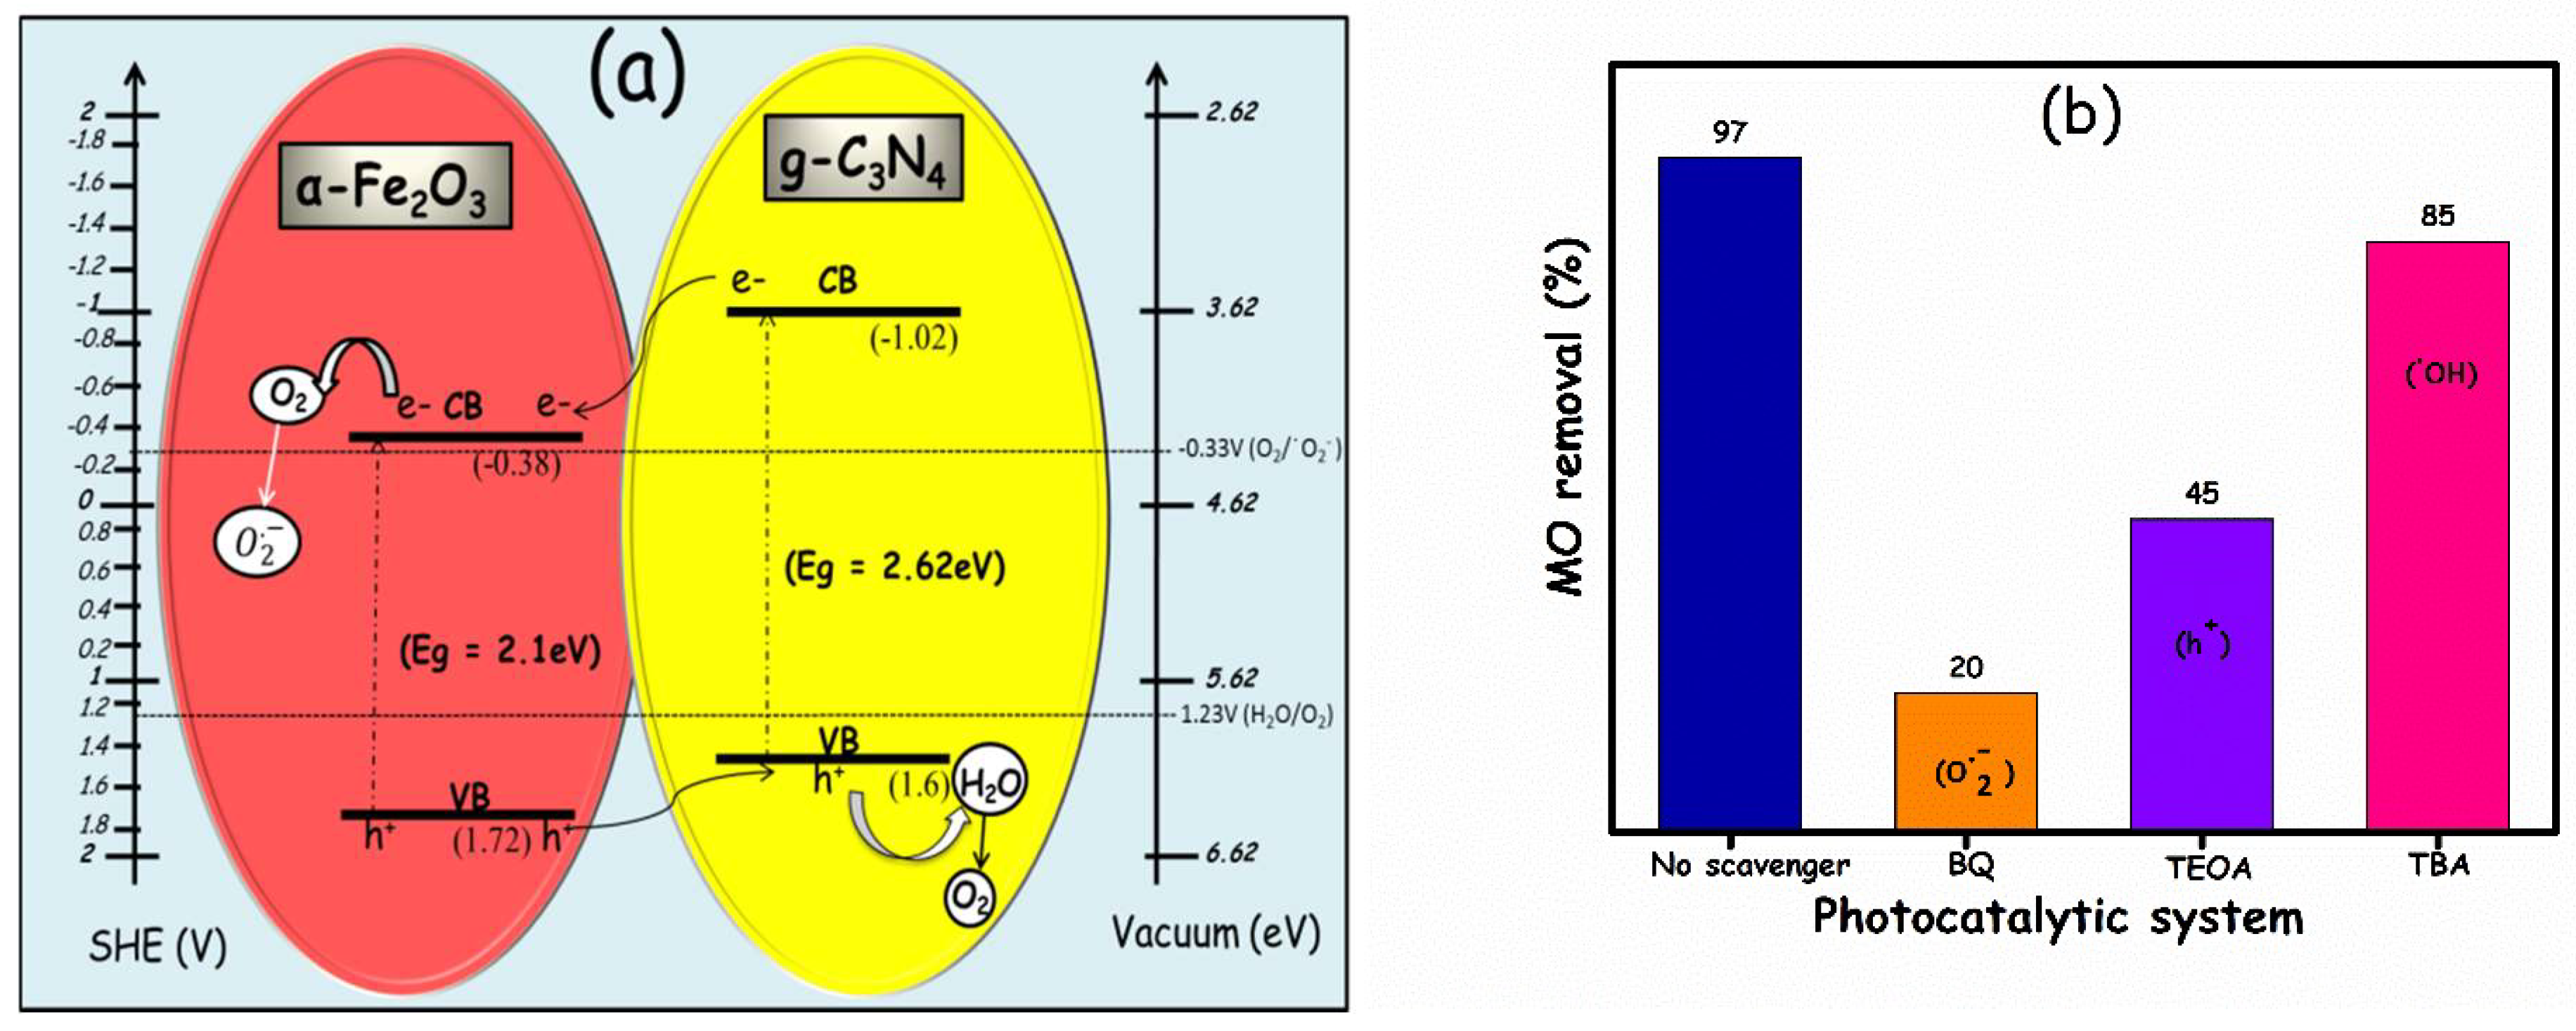
2.3. Photocatalytic MO Degradation Mechanism
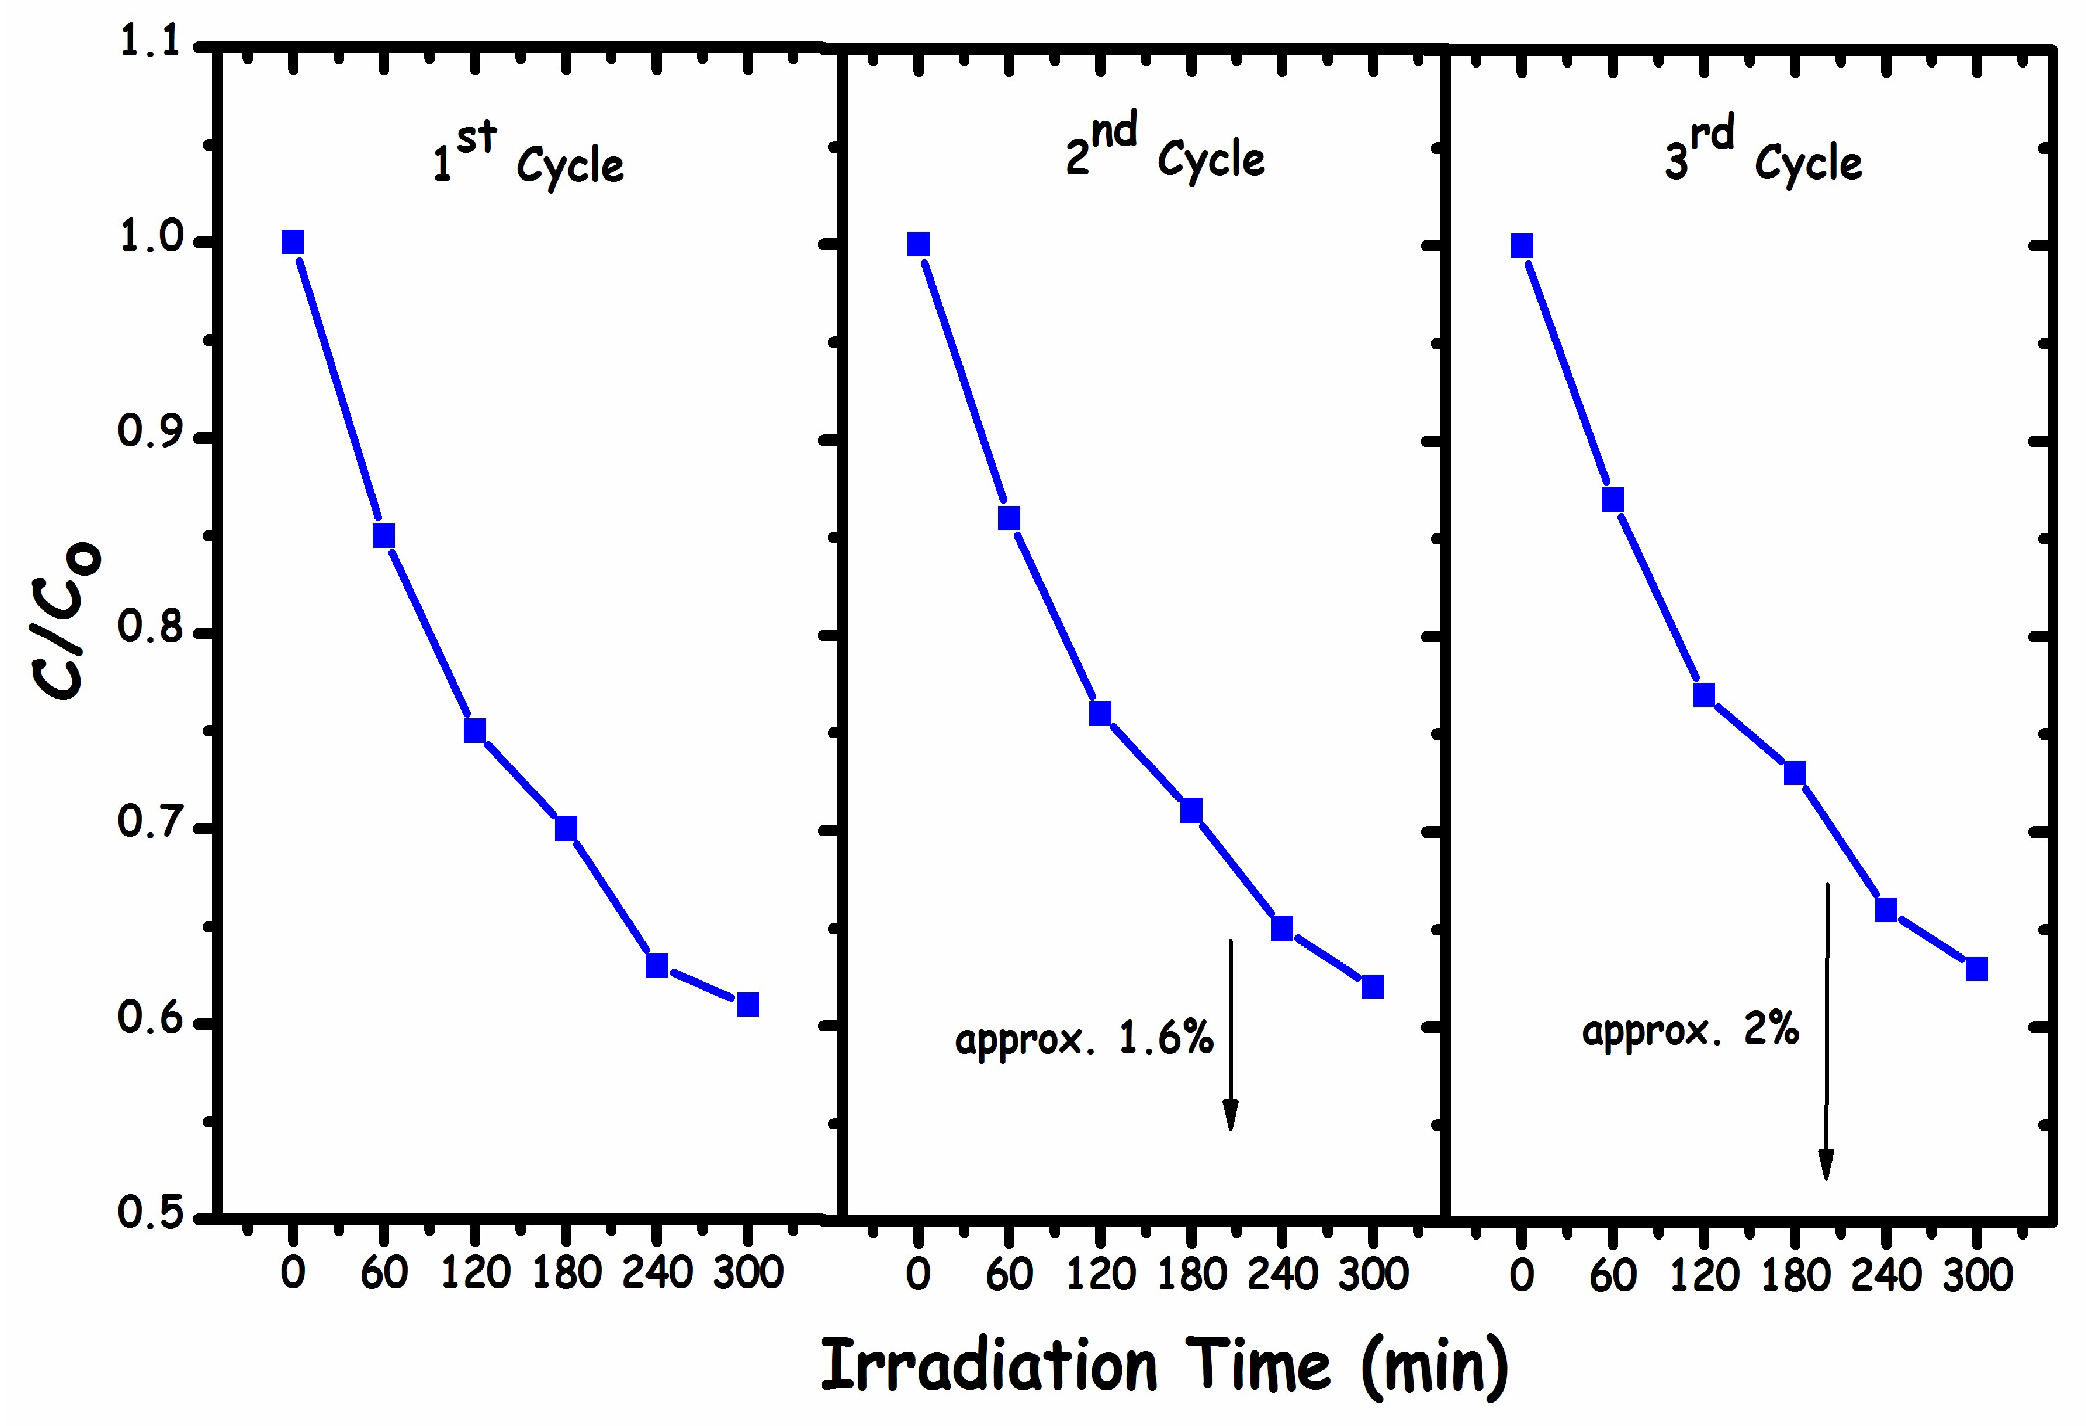
2.4. Photocatalyst Sustainability

| S. No. | Photocatalysts | Irradiation Source | Time | Conc. of Pollutant and Amount of Catalyst | Pollutant Degraded | Degradation Rate/Efficiency (%) | Ref. |
|---|---|---|---|---|---|---|---|
| 1 | Fe2O3/C3N4/Au nanocomposite | - | - | MO solution (25 mL, 3 × 10⁻³ M) and 10.0 mg of catalyst | MO | - | Nasri, A. et al. [20] |
| 2 | α-Fe2O3/g-C3N4 nanocomposite | 30 W LED lamp | 3 h | MB aqueous solution (2.12 × 10⁻⁵ M) and 5.5 mg L−1 of catalyst | MB | 66.79% | Navid Ghane et al. [49] |
| 3 | α-Fe2O3/g-C3N4 composite | UV lamps (254 nm, 6 W) | 90 min | 200 mL of 10 mg/L methylene blue solution | MB | 2.6 times higher than bare materials | Sangbin Lee [44] |
| 4 | α-Fe2O3/porous g-C3N4 heterojunction hybrids | 500 W Xe arc lamp with 420-nm cut-off filter) | 20 min | 50 mL of RhB solution and 10 mg/L of catalyst | RhB | 91.1% | Jirong Bai et al. [45] |
| 5 | ZnO-modified g-C3N4 | 200 W tungsten lamps | 90 min | - | MB | 90% | Paul, Devina Rattan et al. [50] |
| 7 | Fe2O3/g-C3N4 hybrid nanocomposite | 300 W Xe arc lamp | 4 h | 160 mL of aqueous solution containing 10 mg L−1 of MO | MO | Approx. 80% | Konstantinos C. Christoforidis [46] |
| 8 | g-C3N4/α-Fe2O3 nanocomposite | 300 W xenon lamp | 5 h | 0.01 g of catalyst powder in 50 mL dye solution | MO | 97% | This work |
3. Materials and Methods
3.1. Chemicals
3.2. Preparation of α-Fe2O3
3.3. Preparation of g-C3N4
3.4. Preparation of g-C3N4/α-Fe2O3
3.5. Characterization Techniques
3.6. MO Degradation Activity
4. Conclusions
Author Contributions
Funding
Institutional Review Board Statement
Informed Consent Statement
Data Availability Statement
Acknowledgments
Conflicts of Interest
Sample Availability
References
- Tkaczyk, A.; Mitrowska, K.; Posyniak, A. Synthetic organic dyes as contaminants of the aquatic environment and their implications for ecosystems: A review. Sci. Total Environ. 2020, 717, 137222. [Google Scholar] [CrossRef] [PubMed]
- Chang, J.-S.; Lin, C.-Y. Decolorization kinetics of a recombinant Escherichia coli strain harboring azo-dye-decolorizing determinants from Rhodococcus sp. Biotechnol. Lett. 2001, 23, 631–636. [Google Scholar] [CrossRef]
- Bai, Y.-N.; Wang, X.-N.; Zhang, F.; Wu, J.; Zhang, W.; Lu, Y.-Z.; Fu, L.; Lau, T.-C.; Zeng, R.J. High-rate anaerobic decolorization of methyl orange from synthetic azo dye wastewater in a methane-based hollow fiber membrane bioreactor. J. Hazard. Mater. 2020, 388, 121753. [Google Scholar] [CrossRef] [PubMed]
- Haque, M.M.; Haque, M.A.; Mosharaf, M.K.; Marcus, P.K. Decolorization, degradation and detoxification of carcinogenic sulfonated azo dye methyl orange by newly developed biofilm consortia. Saudi J. Biol. Sci. 2021, 28, 793–804. [Google Scholar] [CrossRef]
- Kant, R. Textile dyeing industry an environmental hazard. Nat. Sci. 2011, 4, 17027. [Google Scholar] [CrossRef] [Green Version]
- Khurram, R.; Javed, A.; Ke, R.; Lena, C.; Wang, Z. Visible Light-Driven GO/TiO2-CA Nano-Photocatalytic Membranes: Assessment of Photocatalytic Response, Antifouling Character and Self-Cleaning Ability. Nanomaterials 2021, 11, 2021. [Google Scholar] [CrossRef]
- Wang, X.; Maeda, K.; Thomas, A.; Takanabe, K.; Xin, G.; Carlsson, J.M.; Domen, K.; Antonietti, M. A metal-free polymeric photocatalyst for hydrogen production from water under visible light. Nat. Mater. 2009, 8, 76–80. [Google Scholar] [CrossRef]
- Xia, P.; Zhu, B.; Yu, J.; Cao, S.; Jaroniec, M. Ultra-thin nanosheet assemblies of graphitic carbon nitride for enhanced photocatalytic CO2 reduction. J. Mater. Chem. A 2017, 5, 3230–3238. [Google Scholar] [CrossRef]
- Masih, D.; Ma, Y.; Rohani, S. Graphitic C3N4 based noble-metal-free photocatalyst systems: A review. Appl. Catal. B Environ. 2017, 206, 556–588. [Google Scholar] [CrossRef]
- Fu, J.; Zhu, B.; Jiang, C.; Cheng, B.; You, W.; Yu, J. Hierarchical porous O-doped g-C3N4 with enhanced photocatalytic CO2 reduction activity. Small 2017, 13, 1603938. [Google Scholar] [CrossRef]
- Lin, L.; Ou, H.; Zhang, Y.; Wang, X. Tri-s-triazine-based crystalline graphitic carbon nitrides for highly efficient hydrogen evolution photocatalysis. ACS Catal. 2016, 6, 3921–3931. [Google Scholar] [CrossRef]
- Cheng, F.; Yin, H.; Xiang, Q. Low-temperature solid-state preparation of ternary CdS/g-C3N4/CuS nanocomposites for enhanced visible-light photocatalytic H2-production activity. Appl. Surf. Sci. 2017, 391, 432–439. [Google Scholar] [CrossRef]
- Li, K.; Su, F.-Y.; Zhang, W.-D. Modification of g-C3N4 nanosheets by carbon quantum dots for highly efficient photocatalytic generation of hydrogen. Appl. Surf. Sci. 2016, 375, 110–117. [Google Scholar] [CrossRef]
- Kang, Y.; Yang, Y.; Yin, L.C.; Kang, X.; Liu, G.; Cheng, H.M. An amorphous carbon nitride photocatalyst with greatly extended visible-light-responsive range for photocatalytic hydrogen generation. Adv. Mater. 2015, 27, 4572–4577. [Google Scholar] [CrossRef]
- Zhong, X.; Jin, M.; Dong, H.; Liu, L.; Wang, L.; Yu, H.; Leng, S.; Zhuang, G.; Li, X.; Wang, J.-G. TiO2 nanobelts with a uniform coating of g-C3N4 as a highly effective heterostructure for enhanced photocatalytic activities. J. Solid State Chem. 2014, 220, 54–59. [Google Scholar] [CrossRef]
- Nguyen, C.-C.; Do, T.-O. Engineering the high concentration of N3C nitrogen vacancies toward strong solar light-driven photocatalyst-based g-C3N4. ACS Appl. Energy Mater. 2018, 1, 4716–4723. [Google Scholar] [CrossRef]
- Sivula, K.; Le Formal, F.; Grätzel, M. Solar water splitting: Progress using hematite (α-Fe2O3) photoelectrodes. ChemSusChem 2011, 4, 432–449. [Google Scholar] [CrossRef]
- Spray, R.L.; McDonald, K.J.; Choi, K.-S. Enhancing photoresponse of nanoparticulate α-Fe2O3 electrodes by surface composition tuning. J. Phys. Chem. C 2011, 115, 3497–3506. [Google Scholar] [CrossRef]
- Al-Hajji, L.; Ismail, A.A.; Atitar, M.F.; Abdelfattah, I.; El-Toni, A.M. Construction of mesoporous g-C3N4/TiO2 nanocrystals with enhanced photonic efficiency. Ceram. Int. 2019, 45, 1265–1272. [Google Scholar] [CrossRef]
- Nasri, A.; Nezafat, Z.; Jaleh, B.; Orooji, Y.; Varma, R.S. Laser-assisted preparation of C3N4/Fe2O3/Au nanocomposite: A magnetic reusable catalyst for pollutant degradation. Clean Technol. Environ. Policy 2021, 23, 1797–1806. [Google Scholar] [CrossRef]
- Guo, H.; Chen, M.; Zhong, Q.; Wang, Y.; Ma, W.; Ding, J. Synthesis of Z-scheme α-Fe2O3/g-C3N4 composite with enhanced visible-light photocatalytic reduction of CO2 to CH3OH. J. CO2 Util. 2019, 33, 233–241. [Google Scholar] [CrossRef]
- Shen, Y.; Han, Q.; Hu, J.; Gao, W.; Wang, L.; Yang, L.; Gao, C.; Shen, Q.; Wu, C.; Wang, X. Artificial trees for artificial photosynthesis: Construction of dendrite-structured α-Fe2O3/g-C3N4 Z-Scheme system for efficient CO2 reduction into solar fuels. ACS Appl. Energy Mater. 2020, 3, 6561–6572. [Google Scholar] [CrossRef]
- Duan, B.; Mei, L. A Z-scheme Fe2O3/g-C3N4 heterojunction for carbon dioxide to hydrocarbon fuel under visible illuminance. J. Colloid Interface Sci. 2020, 575, 265–273. [Google Scholar] [CrossRef] [PubMed]
- Theerthagiri, J.; Senthil, R.; Priya, A.; Madhavan, J.; Michael, R.; Ashokkumar, M. Photocatalytic and photoelectrochemical studies of visible-light active α-Fe2O3–g-C3N4 nanocomposites. RSC Adv. 2014, 4, 38222–38229. [Google Scholar] [CrossRef]
- Alduhaish, O.; Ubaidullah, M.; Al-Enizi, A.M.; Alhokbany, N.; Alshehri, S.M.; Ahmed, J. Facile Synthesis of Mesoporous α-Fe2O3 @ g-C3N4-NCs for Efficient Bifunctional Electro-catalytic Activity (OER/ORR). Sci. Rep. 2019, 9, 1–10. [Google Scholar] [CrossRef] [PubMed]
- Kadi, M.W.; Mohamed, R.M.; Ismail, A.A.; Bahnemann, D.W. Performance of mesoporous α-Fe2O3/g-C3N4 heterojunction for photoreduction of Hg (II) under visible light illumination. Ceram. Int. 2020, 46, 23098–23106. [Google Scholar] [CrossRef]
- Xu, Q.; Zhu, B.; Jiang, C.; Cheng, B.; Yu, J. Constructing 2D/2D Fe2O3/g-C3N4 direct Z-scheme photocatalysts with enhanced H2 generation performance. Sol. RRL 2018, 2, 1800006. [Google Scholar] [CrossRef]
- Jiang, Z.; Wan, W.; Li, H.; Yuan, S.; Zhao, H.; Wong, P.K. A Hierarchical Z-Scheme α-Fe2O3/g-C3N4 Hybrid for Enhanced Photocatalytic CO2 Reduction. Adv. Mater. 2018, 30, 1706108. [Google Scholar] [CrossRef]
- Padervand, M.; Rhimi, B.; Wang, C. One-pot synthesis of novel ternary Fe3N/Fe2O3/C3N4 photocatalyst for efficient removal of rhodamine B and CO2 reduction. J. Alloys Compd. 2021, 852, 156955. [Google Scholar] [CrossRef]
- Liu, J.; Zhang, T.; Wang, Z.; Dawson, G.; Chen, W. Simple pyrolysis of urea into graphitic carbon nitride with recyclable adsorption and photocatalytic activity. J. Mater. Chem. 2011, 21, 14398–14401. [Google Scholar] [CrossRef]
- Wang, J.; Qin, C.; Wang, H.; Chu, M.; Zada, A.; Zhang, X.; Li, J.; Raziq, F.; Qu, Y.; Jing, L. Exceptional photocatalytic activities for CO2 conversion on AlO bridged g-C3N4/α-Fe2O3 z-scheme nanocomposites and mechanism insight with isotopesZ. Appl. Catal. B Environ. 2018, 221, 459–466. [Google Scholar] [CrossRef]
- Khurram, R.; Wang, Z.; Ehsan, M.F. α-Fe2O3-based nanocomposites: Synthesis, characterization, and photocatalytic response towards wastewater treatment. Environ. Sci. Pollut. Res. 2021, 28, 17697–17711. [Google Scholar] [CrossRef] [PubMed]
- Suwanboon, S.; Amornpitoksuk, P.; Muensit, N. Dependence of photocatalytic activity on structural and optical properties of nanocrystalline ZnO powders. Ceram. Int. 2011, 37, 2247–2253. [Google Scholar] [CrossRef]
- Wang, X.; Sø, L.; Su, R.; Wendt, S.; Hald, P.; Mamakhel, A.; Yang, C.; Huang, Y.; Iversen, B.B.; Besenbacher, F. The influence of crystallite size and crystallinity of anatase nanoparticles on the photo-degradation of phenol. J. Catal. 2014, 310, 100–108. [Google Scholar] [CrossRef]
- Devi, L.G.; Murthy, B.N.; Kumar, S.G. Photocatalytic activity of TiO2 doped with Zn2+ and V5+ transition metal ions: Influence of crystallite size and dopant electronic configuration on photocatalytic activity. Mater. Sci. Eng. B 2010, 166, 1–6. [Google Scholar] [CrossRef]
- Huang, Y.; Wang, Y.; Bi, Y.; Jin, J.; Ehsan, M.F.; Fu, M.; He, T. Preparation of 2D hydroxyl-rich carbon nitride nanosheets for photocatalytic reduction of CO2. RSC Adv. 2015, 5, 33254–33261. [Google Scholar] [CrossRef]
- Zhang, G.; Zhang, M.; Ye, X.; Qiu, X.; Lin, S.; Wang, X. Iodine modified carbon nitride semiconductors as visible light photocatalysts for hydrogen evolution. Adv. Mater. 2014, 26, 805–809. [Google Scholar] [CrossRef]
- Hao, Q.; Mo, Z.; Chen, Z.; She, X.; Xu, Y.; Song, Y.; Ji, H.; Wu, X.; Yuan, S.; Xu, H. 0D/2D Fe2O3 quantum dots/g-C3N4 for enhanced visible-light-driven photocatalysis. Colloids Surf. A Physicochem. Eng. Asp. 2018, 541, 188–194. [Google Scholar] [CrossRef]
- Thomas, A.; Fischer, A.; Goettmann, F.; Antonietti, M.; Müller, J.-O.; Schlögl, R.; Carlsson, J.M. Graphitic carbon nitride materials: Variation of structure and morphology and their use as metal-free catalysts. J. Mater. Chem. 2008, 18, 4893–4908. [Google Scholar] [CrossRef] [Green Version]
- Khurram, R.; Wang, Z.; Ehsan, M.F.; Peng, S.; Shafiq, M.; Khan, B. Synthesis and characterization of an α-Fe2O3/ZnTe heterostructure for photocatalytic degradation of Congo red, methyl orange and methylene blue. RSC Adv. 2020, 10, 44997–45007. [Google Scholar] [CrossRef]
- Li, Y.-P.; Li, F.-T.; Wang, X.-J.; Zhao, J.; Wei, J.-N.; Hao, Y.-J.; Liu, Y. Z-scheme electronic transfer of quantum-sized α-Fe2O3 modified g-C3N4 hybrids for enhanced photocatalytic hydrogen production. Int. J. Hydrogen Energy 2017, 42, 28327–28336. [Google Scholar] [CrossRef]
- Sun, S.; Ji, C.; Wu, L.; Chi, S.; Qu, R.; Li, Y.; Lu, Y.; Sun, C.; Xue, Z. Facile one-pot construction of α-Fe2O3/g-C3N4 heterojunction for arsenic removal by synchronous visible light catalysis oxidation and adsorption. Mater. Chem. Phys. 2017, 194, 1–8. [Google Scholar] [CrossRef]
- Zhang, Y.; Zhang, D.; Guo, W.; Chen, S. The α-Fe2O3/g-C3N4 heterostructural nanocomposites with enhanced ethanol gas sensing performance. J. Alloys Compd. 2016, 685, 84–90. [Google Scholar] [CrossRef]
- Lee, S.; Park, J.-W. Hematite/graphitic carbon nitride nanofilm for fenton and photocatalytic oxidation of methylene blue. Sustainability 2020, 12, 2866. [Google Scholar] [CrossRef] [Green Version]
- Bai, J.; Xu, H.; Chen, G.; Lv, W.; Ni, Z.; Wang, Z.; Yang, J.; Qin, H.; Zheng, Z.; Li, X. Facile fabrication of α-Fe2O3/porous g-C3N4 heterojunction hybrids with enhanced visible-light photocatalytic activity. Mater. Chem. Phys. 2019, 234, 75–80. [Google Scholar] [CrossRef]
- Christoforidis, K.C.; Montini, T.; Bontempi, E.; Zafeiratos, S.; Jaén, J.J.D.; Fornasiero, P. Synthesis and photocatalytic application of visible-light active β-Fe2O3/g-C3N4 hybrid nanocomposites. Appl. Catal. B Environ. 2016, 187, 171–180. [Google Scholar] [CrossRef]
- Liu, X.; Jin, A.; Jia, Y.; Jiang, J.; Hu, N.; Chen, X. Facile synthesis and enhanced visible-light photocatalytic activity of graphitic carbon nitride decorated with ultrafine Fe2O3 nanoparticles. RSC Adv. 2015, 5, 92033–92041. [Google Scholar] [CrossRef]
- Argyle, M.D.; Bartholomew, C.H. Heterogeneous catalyst deactivation and regeneration: A review. Catalysts 2015, 5, 145–269. [Google Scholar] [CrossRef] [Green Version]
- Ghane, N.; Sadrnezhaad, S. Combustion synthesis of g-C3N4/Fe2O3 nanocomposite for superior photoelectrochemical catalytic performance. Appl. Surf. Sci. 2020, 534, 147563. [Google Scholar] [CrossRef]
- Paul, D.R.; Gautam, S.; Panchal, P.; Nehra, S.P.; Choudhary, P.; Sharma, A. ZnO-modified g-C3N4: A potential photocatalyst for environmental application. ACS Omega 2020, 5, 3828–3838. [Google Scholar] [CrossRef] [Green Version]
- Zeng, S.; Tang, K.; Li, T.; Liang, Z.; Wang, D.; Wang, Y.; Zhou, W. Hematite hollow spindles and microspheres: Selective synthesis, growth mechanisms, and application in lithium ion battery and water treatment. J. Phys. Chem. C 2007, 111, 10217–10225. [Google Scholar] [CrossRef]
- Zhu, W.; Cui, X.; Liu, X.; Zhang, L.; Huang, J.-Q.; Piao, X.; Zhang, Q. Hydrothermal evolution, optical and electrochemical properties of hierarchical porous hematite nanoarchitectures. Nanoscale Res. Lett. 2013, 8, 1–14. [Google Scholar] [CrossRef] [PubMed] [Green Version]


| S# | Sample Code | EDX—Percentage Composition | XRD—Avg. Crystallite Size (nm) | DRS—Band Gap (eV) | BET—Surface Area (m2/g) | Photocatalytic Efficiency (%) | |||
|---|---|---|---|---|---|---|---|---|---|
| Atomic % of C | Atomic % of N | Atomic % of O | Atomic % of Fe | ||||||
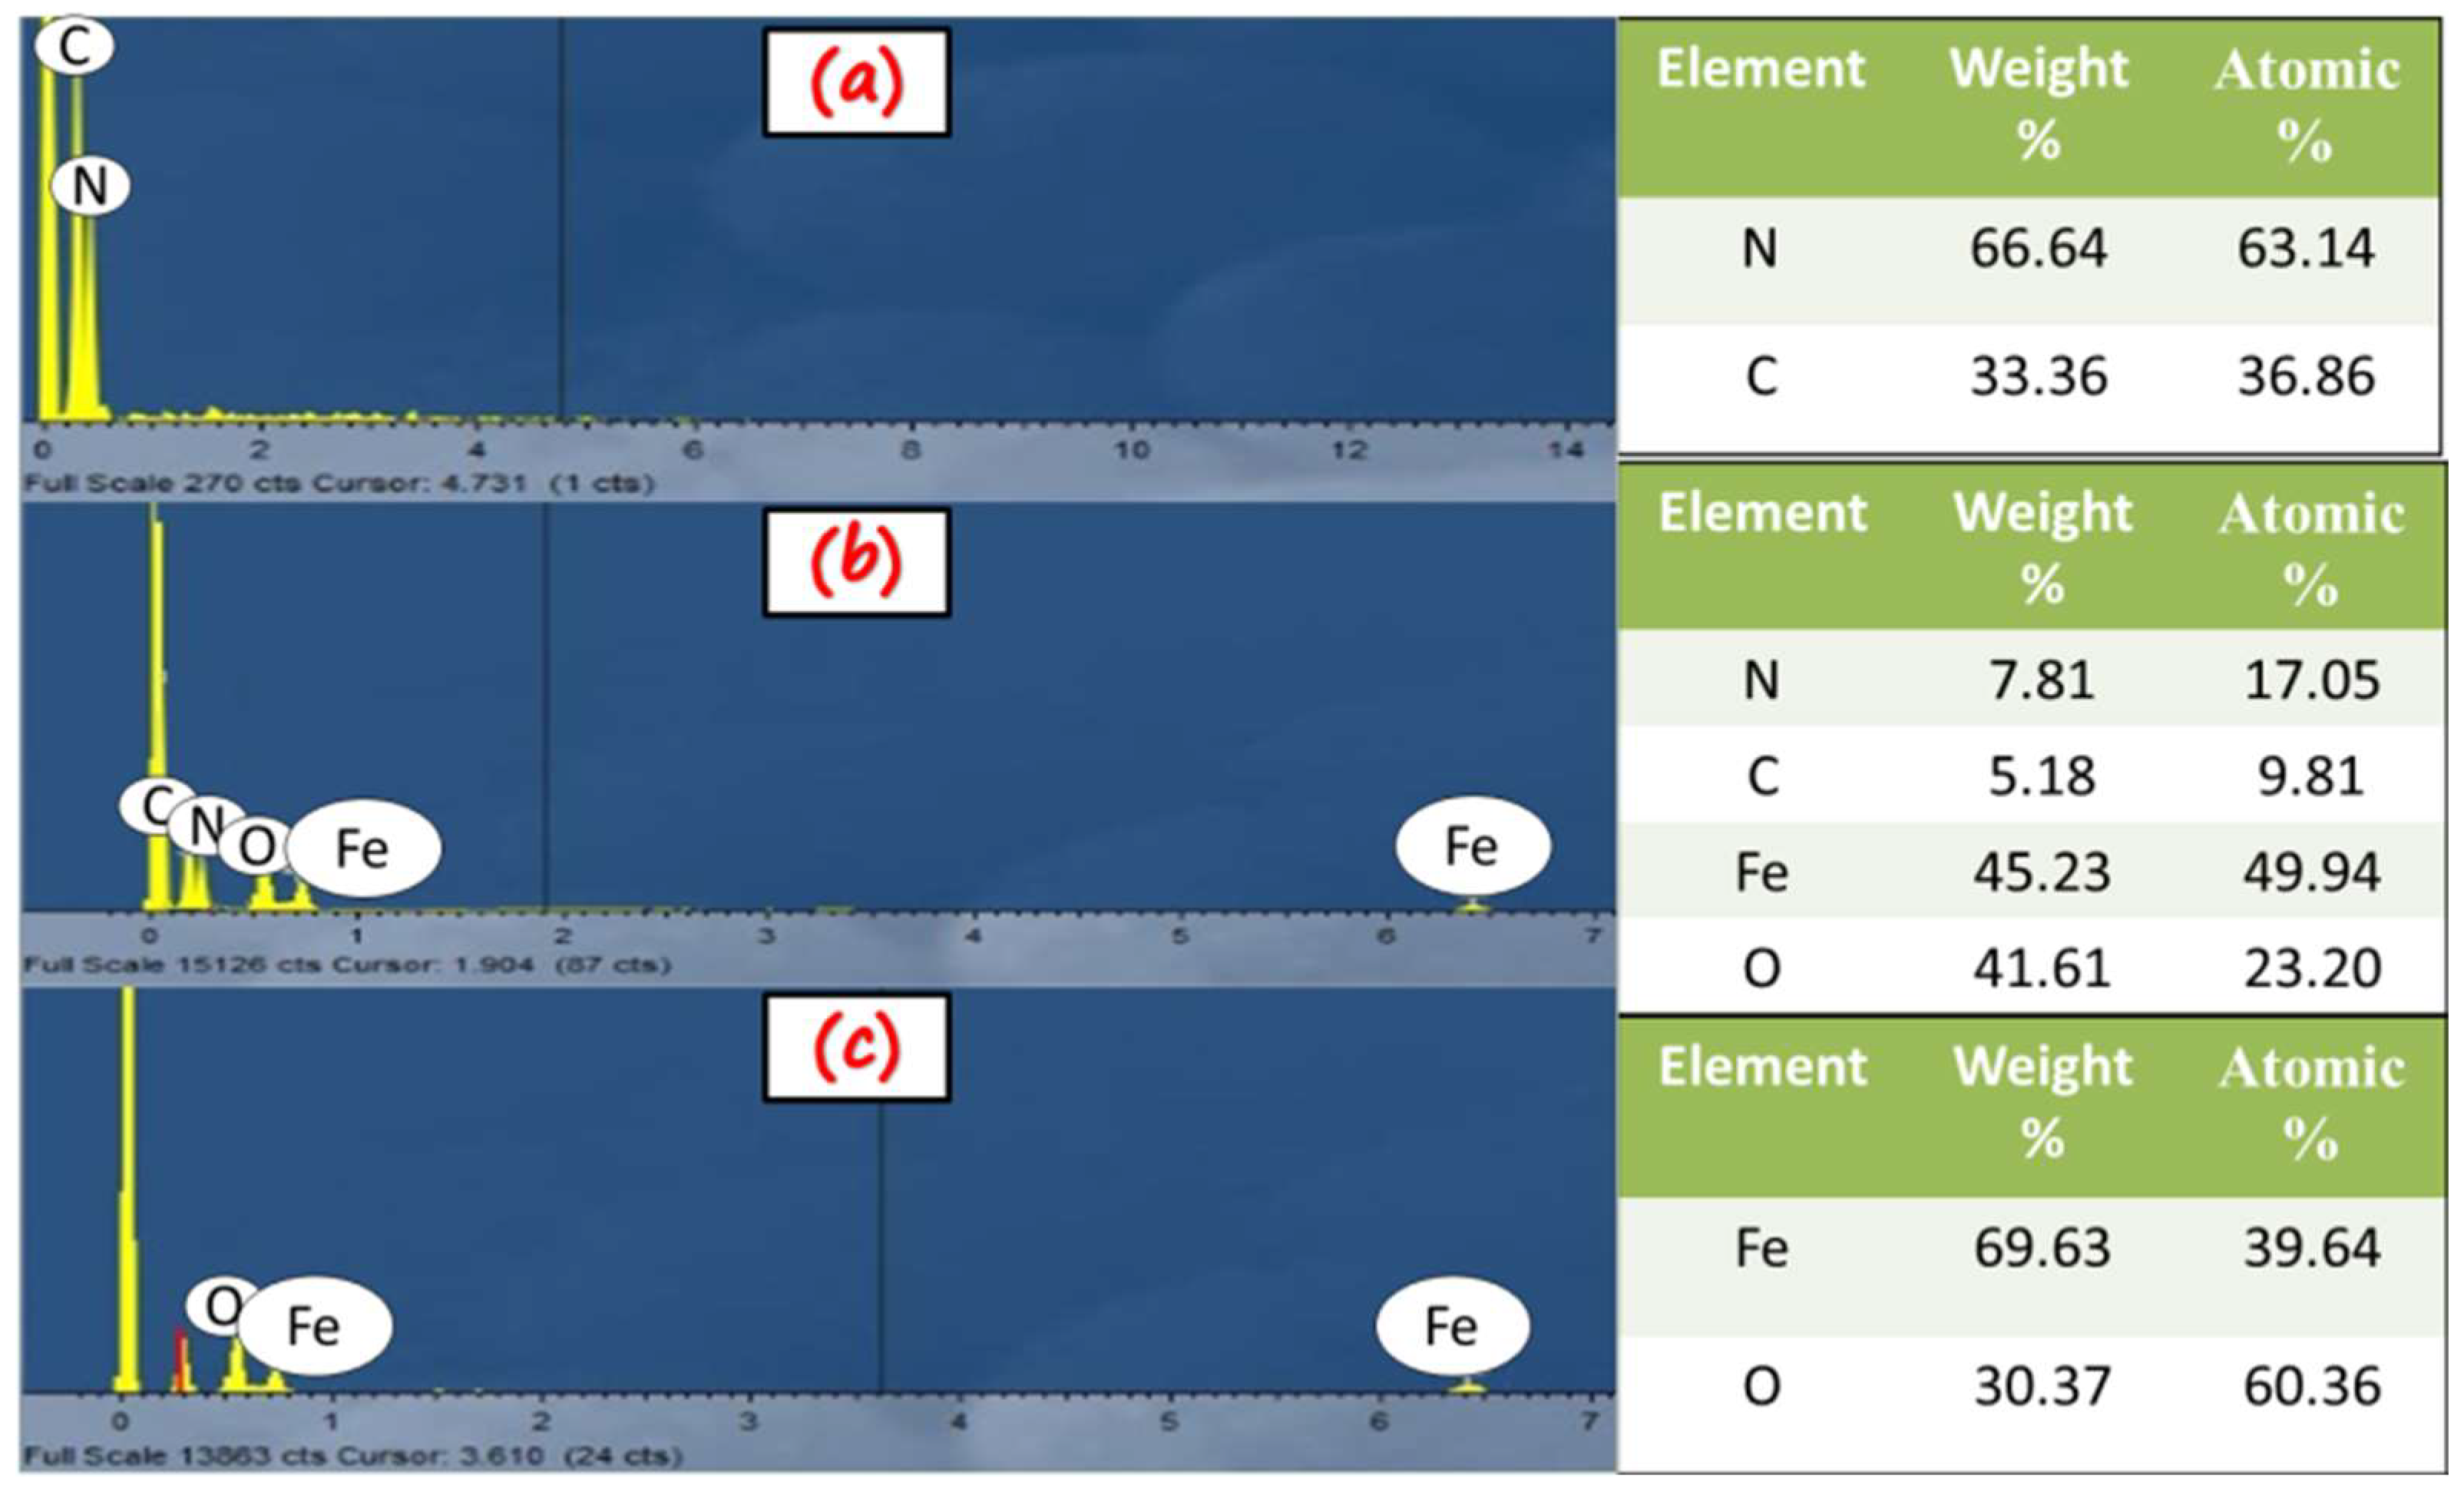
| 1 | g-C3N4 | 36.86 | 63.14 | ---- | ---- | 29.4 | 2.62 | 39.89 | 41 |
| 2 | α-Fe2O3 | ---- | ---- | 60.36 | 39.64 | 32.5 | 2.1 | 34.25 | 30 |
| 3 | g-C3N4/α-Fe2O3 | 9.81 | 17.05 | 23.20 | 49.94 | 60.5 | ---- | 80.38 | 97 |
Publisher’s Note: MDPI stays neutral with regard to jurisdictional claims in published maps and institutional affiliations. |
© 2022 by the authors. Licensee MDPI, Basel, Switzerland. This article is an open access article distributed under the terms and conditions of the Creative Commons Attribution (CC BY) license (https://creativecommons.org/licenses/by/4.0/).
Share and Cite
Khurram, R.; Nisa, Z.U.; Javed, A.; Wang, Z.; Hussien, M.A. Synthesis and Characterization of an α-Fe2O3-Decorated g-C3N4 Heterostructure for the Photocatalytic Removal of MO. Molecules 2022, 27, 1442. https://0-doi-org.brum.beds.ac.uk/10.3390/molecules27041442
Khurram R, Nisa ZU, Javed A, Wang Z, Hussien MA. Synthesis and Characterization of an α-Fe2O3-Decorated g-C3N4 Heterostructure for the Photocatalytic Removal of MO. Molecules. 2022; 27(4):1442. https://0-doi-org.brum.beds.ac.uk/10.3390/molecules27041442
Chicago/Turabian StyleKhurram, Rooha, Zaib Un Nisa, Aroosa Javed, Zhan Wang, and Mostafa A. Hussien. 2022. "Synthesis and Characterization of an α-Fe2O3-Decorated g-C3N4 Heterostructure for the Photocatalytic Removal of MO" Molecules 27, no. 4: 1442. https://0-doi-org.brum.beds.ac.uk/10.3390/molecules27041442