Article

A Comprehensive Investigation of Interactions between Antipsychotic Drug Quetiapine and Human Serum Albumin Using Multi-Spectroscopic, Biochemical, and Molecular Modeling Approaches

1
Department of Biochemistry, College of Science, King Saud University, P.O. Box 22452, Riyadh 11451, Saudi Arabia
2
Department of Pharmaceutical Chemistry, College of Pharmacy, King Saud University, P.O. Box 2457, Riyadh 11451, Saudi Arabia
*
Author to whom correspondence should be addressed.
Submission received: 14 March 2022 / Revised: 6 April 2022 / Accepted: 13 April 2022 / Published: 18 April 2022
(This article belongs to the Section Photochemistry)

Abstract

:
Quetiapine (QTP) is a short-acting atypical antipsychotic drug that treats schizophrenia or manic episodes of bipolar disorder. Human serum albumin (HSA) is an essential transport protein that transports hormones and various other ligands to their intended site of action. The interactions of QTP with HSA and their binding mechanism in the HSA-QTP system was studied using spectroscopic and molecular docking techniques. The UV-Vis absorption study shows hyperchromicity in the spectra of HSA on the addition of QTP, suggesting the complex formation and interactions between QTP and HSA. The results of intrinsic fluorescence indicate that QTP quenched the fluorescence of HSA and confirmed the complex formation between HSA and QTP, and this quenching mechanism was a static one. Thermodynamic analysis of the HSA-QTP system confirms the involvement of hydrophobic forces, and this complex formation is spontaneous. The competitive displacement and molecular docking experiments demonstrated that QTP is preferentially bound to HSA subdomain IB. Furthermore, the CD experiment results showed conformational changes in the HSA-QTP system. Besides this, the addition of QTP does not affect the esterase-like activity of HSA. This study will help further understand the credible mechanism of transport and delivery of QTP via HSA and design new QTP-based derivatives with greater efficacy.

1. Introduction

In recent years, psychoactive drug usage has increased worldwide due to the increasing incidence of related psychiatric disorders [1]. However, the most commonly prescribed psychoactive drugs, such as antidepressants, antipsychotics, and mood stabilizers, cause unwanted side effects (excessive systemic drug exposure) and toxicity to human systems [2,3].
Quetiapine (QTP Figure 1A) is a second generation (short-acting atypical) antipsychotic drug of dibenzothiazepine (class), which is used to treat schizophrenia, acute bipolar disorder, and major depression in adolescents and adults [4,5,6,7]. The exact mechanism of action of QTP is poorly understood. However, QTP is an antagonist of various neurotransmitter receptors in the brain, such as dopamine D1 and D2, adrenergic alpha receptors alpha1 and alpha2, histamine H1, and serotonin 5-HT1A and 5-HT2, respectively [8,9]. Specifically, the antipsychotic and antidepressant effects of QTP are believed to be due to the interactions of the above-mentioned neurotransmitter receptors dopamine (D1 and D2), adrenergic alpha receptors (α1 and α2), histamine (H1), and serotonin (5-HT1A and 5-HT2) [9].
Recent studies explore the insight of binding affinity and mechanism of plasma proteins and drug interactions [10,11,12,13,14,15]. Recently, nanotechnology has helped explore the interaction mechanisms [16,17]. However, the interaction between the drug proteins (plasma) and their mechanism is vital because they directly affect therapeutic drugs’ pharmacodynamic and pharmacokinetic properties in the human system [10]. Moreover, the drug proteins (plasma) interactions help to decipher the therapeutic efficacy, distribution, and bioavailability of therapeutic drugs and assist in enhancing solubility in plasma protein, reducing toxicity, and protecting against oxidation [18,19,20].
Human serum albumin (HSA) is a principal plasma protein with critical physiological functions and facilitates the transportation of many molecules and metabolites (Figure 1B) [21]. It is a monomeric chain globular plasma protein (585 amino acids residues), and its 3D structure consists of three homologous domains (I-III-A and B subdomains). The essential binding regions for drugs in the HSA are Sudlow’s site I (subdomains IIA) and Sudlow’s site II (subdomains IIIA) [22,23,24,25]. However, there is also Site III (subdomain IB), which is also believed to play an essential role in binding various drugs [26]. Therefore, HSA has multiple binding sites and can bind several different drugs, thus making it a fundamental functional drug carrier [27]. Furthermore, the binding of therapeutic drugs within HSA is commonly reversible via weak interactions such as hydrogen bonding, hydrophobic forces, ionic interactions, and van der Waal’s interactions [28].
To the best of our knowledge, the interaction binding mechanism of QTP and HSA has still not been investigated. Here, multi-spectroscopic techniques and biochemical and molecular docking approaches were applied to scrutinize the binding properties of QTP with HSA under physiological conditions. However, we considered the possibility of complexation between QTP-HSA, which would explore the pharmacodynamics and pharmacokinetics of QTP. The QTP-HSA interactions reported here would explain the binding mechanism at the molecular level and facilitate efforts to modify new therapeutic drugs that optimize their distribution within the human body.

2. Results and Discussion

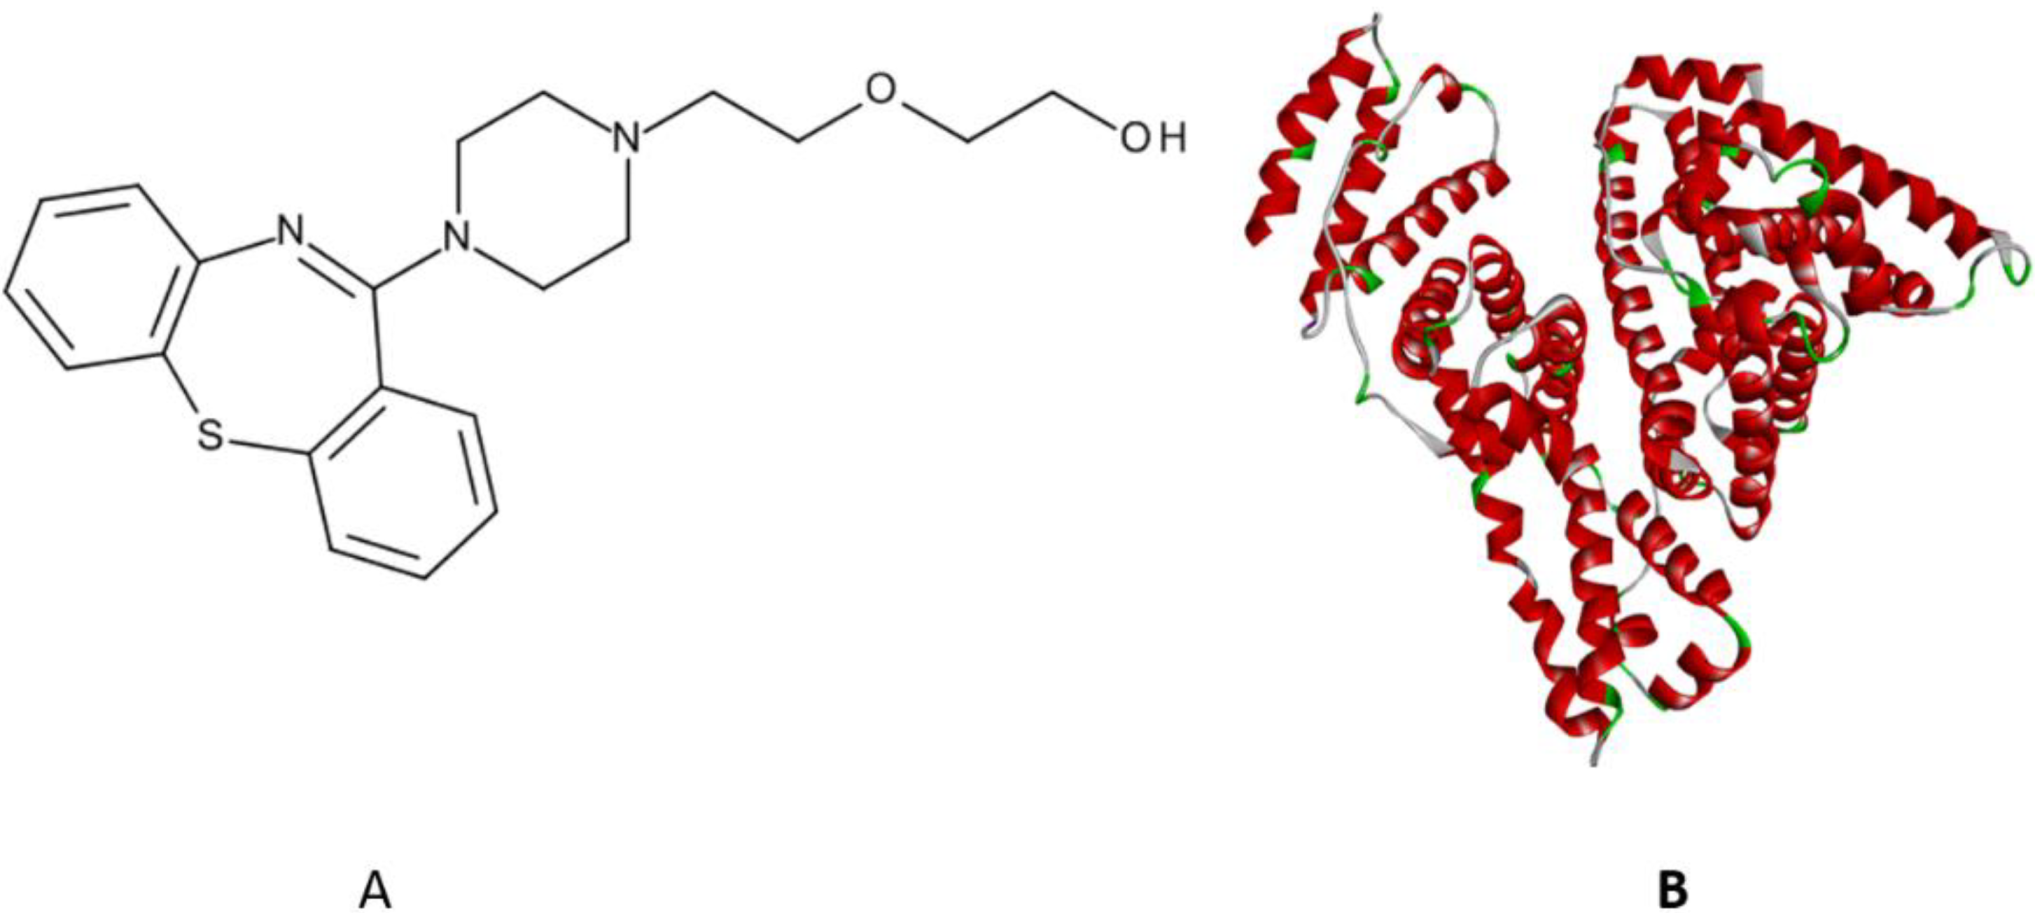
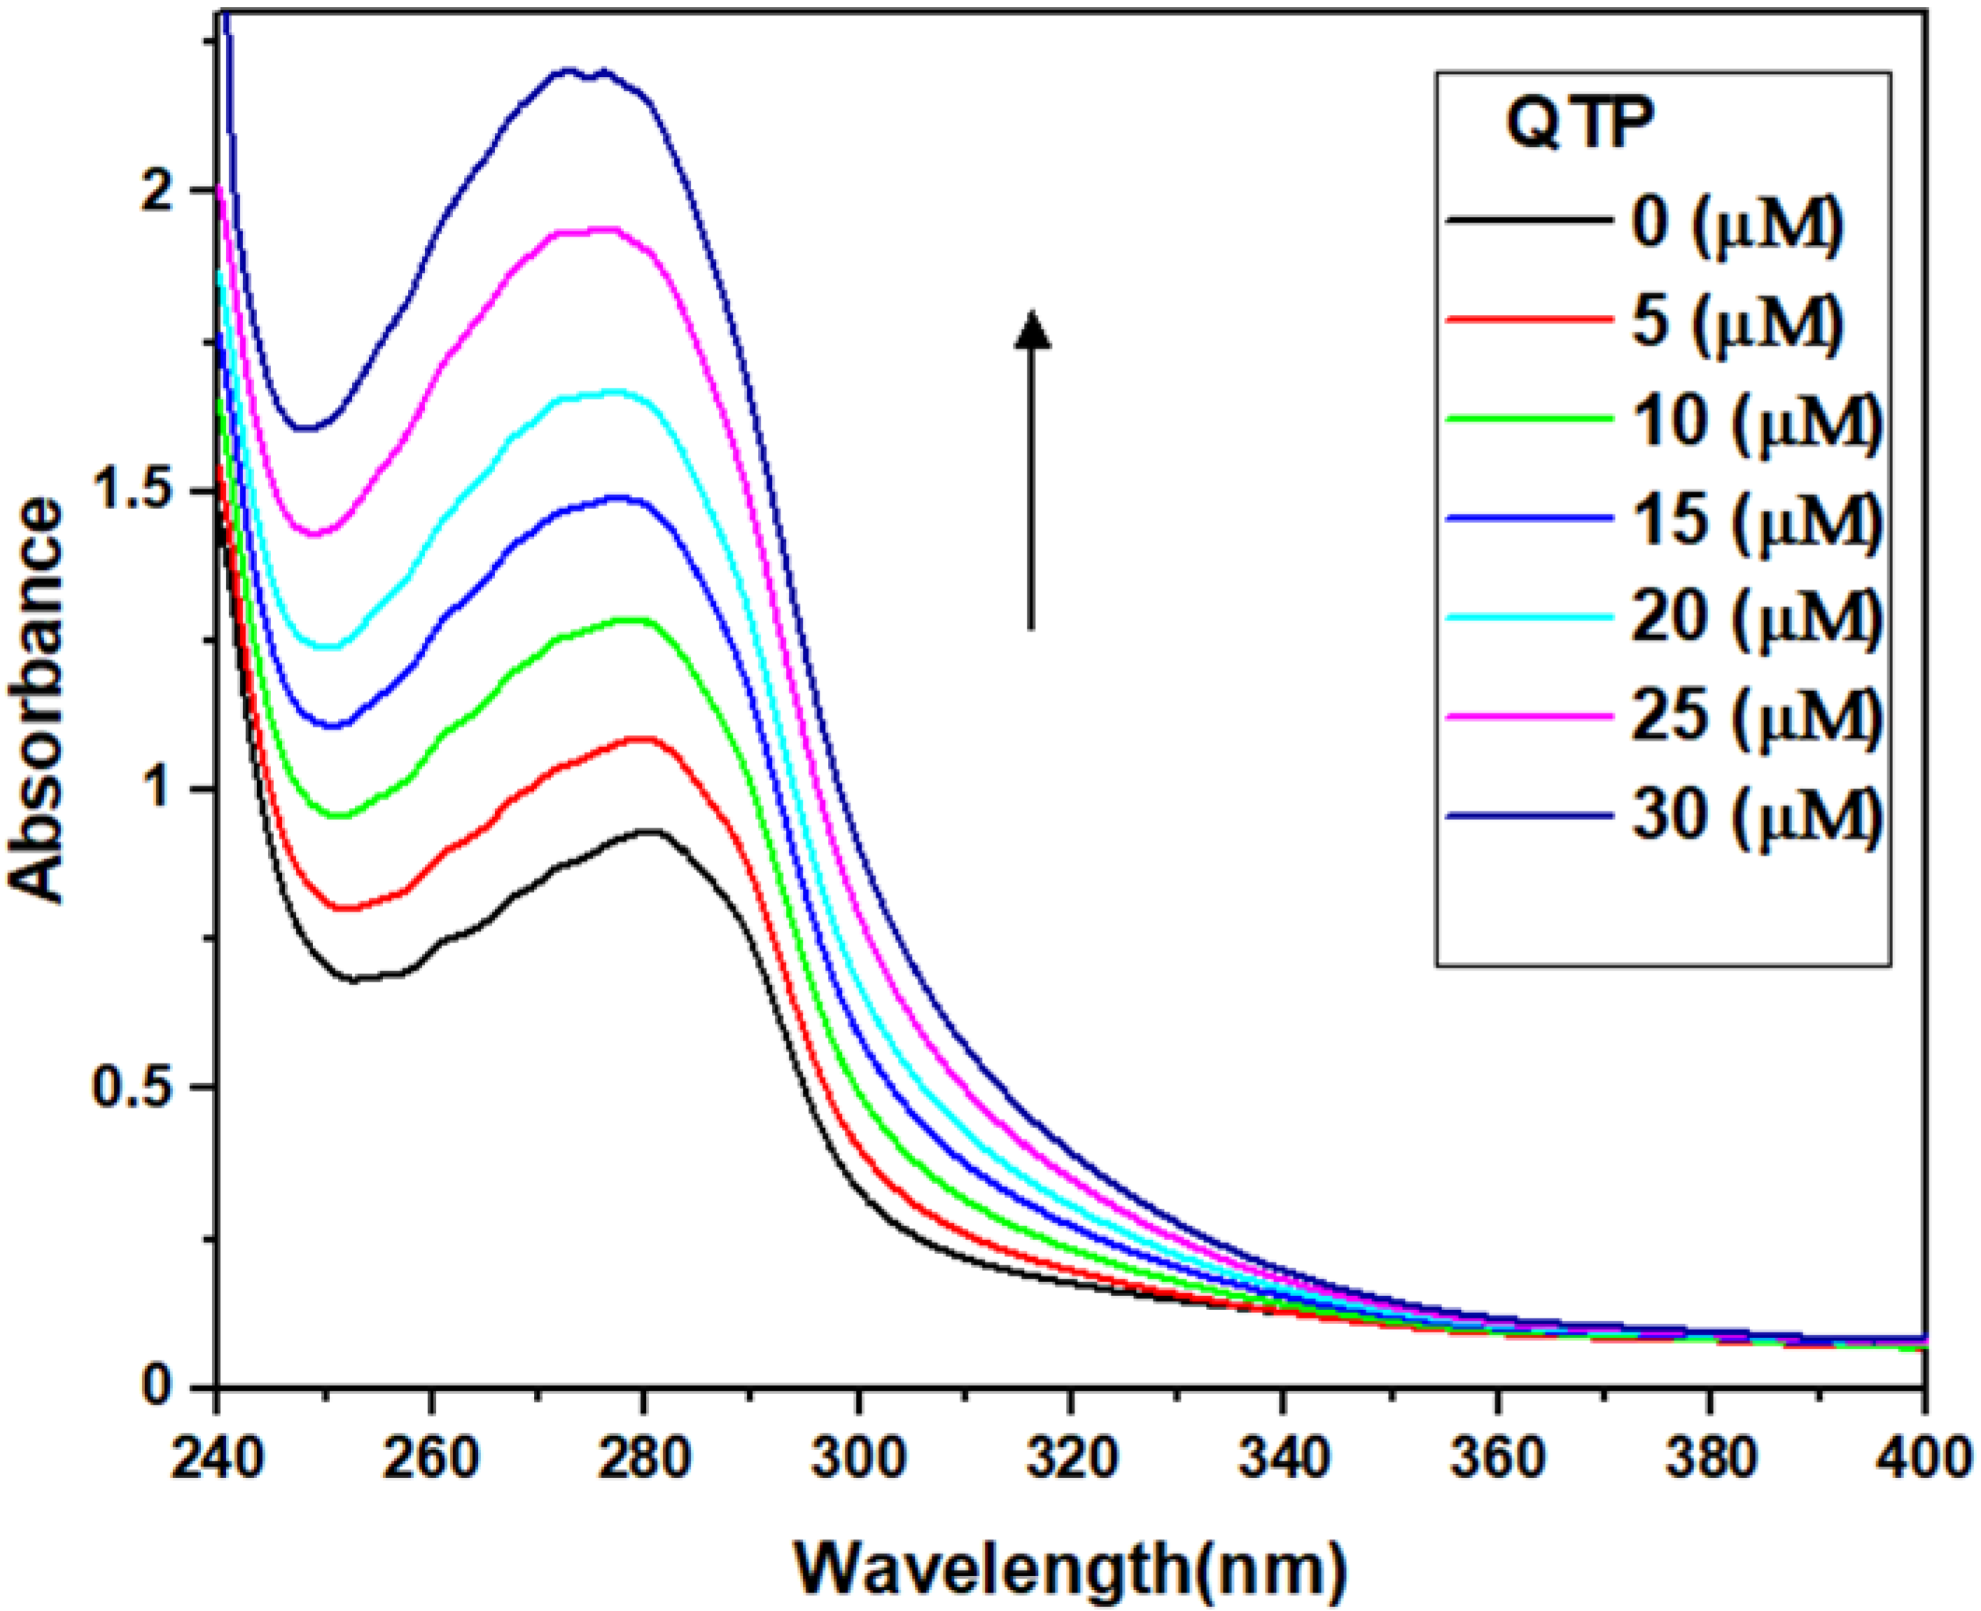
2.1. UV-Vis Absorption Spectroscopy

UV-Vis spectral analyses are carried out to observe the structural and conformational changes in the protein molecule induced by the binding ligands and thus to obtain information about their interaction mechanism. [29]. The UV-Vis absorption spectra of the HSA and HSA-QTP complex are shown in Figure 2. It is apparent from the spectra that HSA exhibits an absorption peak at 280 nm coming from the π-π* transition of the aromatic amino acids (tryptophan (W), tyrosine (Y), phenylalanine) [30]. An increase in QTP concentration was accompanied by a slight shift in the absorption wavelength. This blue shift indicates that QTP binding is associated with changes in the local environment of HSA. In addition, there is an increase in UV-absorption intensities of HSA at around 280 nm at increasing concentrations of QTP, and this hyperchromicity suggests the HSA-QTP system formation. Hyperchromicity at around 280 nm in HSA after QTP addition also confirms that the aromatic amino acid (W and Y) microenvironment changes due to the HSA-QTP complex formation [31,32].

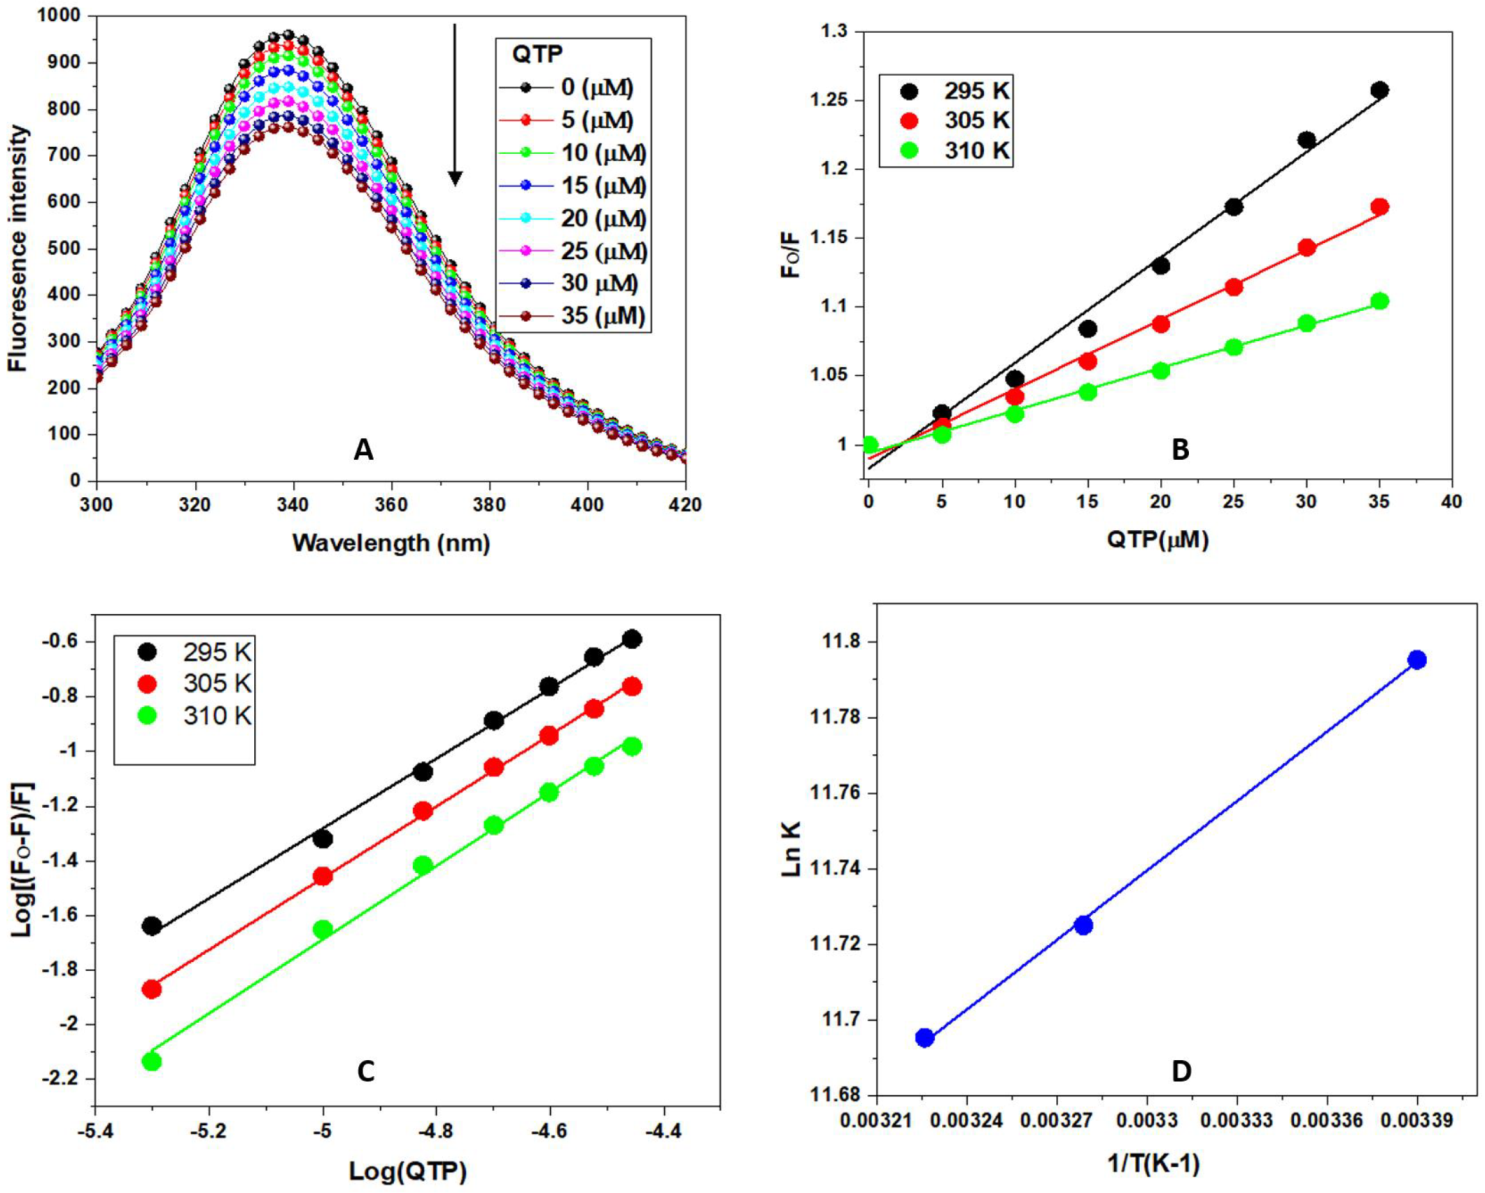
2.2. Fluorescence Emission Spectroscopy of the HSA-QTP Complex

Fluorescence emission spectroscopy is a multipurpose biophysical technique used to study the binding mechanism of protein-ligand interactions and to evaluate the binding parameters [10,12,26]. The fluorescence emission spectra of HSA alone and the HSA-QTP complex are given in Figure 3A. It is apparent from Figure 3A that HSA exhibits a strong emission peak at 340 nm upon excitation at 295 nm due to W-214 residue. Further, the addition of different concentrations of QTP (0–35 μM) leads to the quenching of HSA fluorescence intensity without changing the peak shape. This fluorescence quenching suggests the formation of the HSA-QTP system and suggests a possible microenvironmental alteration in HSA upon treatment with QTP [33,34].

2.2.1. Fluorescence Quenching Mechanism (FQM) of the Interactions of the HSA-QTP System

According to the literature, the protein’s fluorescence quenching mechanism (FQM) consists mainly of dynamic quenching and static quenching. In the case of dynamic quenching, the interaction of the fluorophore with the quencher is indirect. In contrast, in the case of static quenching, a ground state complex formation exists between the fluorophore and quencher [30]. Therefore, the FQM can be sorted out based on their temperature dependence. Furthermore, in the case of static quenching, Ksv values are inversely proportional to temperature, whereas in dynamic Ksv, the values are directly proportional to temperature. Therefore, the FQM of the HSA-QTP system was evaluated by recording the fluorescence spectra of HSA-QTP at different temperatures (295, 300, and 305 K), and the fluorescence quenching data of the HSA-QTP system was analyzed using the Stern-Volmer equation [30]:
F 0 F = 1 + K sv [ Q ]
where F0 and F represent the steady-state fluorescence of HSA and the HSA-QTP complex, respectively. [Q] represents the quencher concentration (QTP), and Ksv represents the Stern-Volmer constant. The Ksv plot for the HSA-QTP system obtained at various temperatures (295, 300, and 305 K) is given in Figure 3B. It is found that the Ksv values for the HSA-QTP system decreased with a temperature rise, confirming the static quenching mechanism for the HSA-QTP system (Table 1). In addition, the fluorescence mechanism (quenching) was also analyzed according to the bimolecular rate constant values using the equation:
k q = K sv / τ 0
where kq is the bimolecular rate constant, and τ0 is the average lifetime of the protein in the absence of the quencher and is valued at 10−8 for biopolymers [35]. The calculated bimolecular quenching rate constant value for the HSA-QTP system is presented in Table 1. The kq values were found to be higher than the value of the scattering collision constant (2 × 10¹⁰ M−1 s−1), which again suggests the involvement of a static quenching mechanism between the HSA-QTP system [36].

2.2.2. Evaluation of the Binding Constants and the Number of Binding Sites in the HSA-QTP System

Intrinsic fluorescence data at different temperatures (295, 300, and 305 K) were used to determine the binding constant (Kb) and binding stoichiometry (n) of the HSA-QTP system by using the following equation [10,30]:
log ( F 0 F ) F = log   K b + n   log [ Q ]
where F0 and F represent fluorescence intensities of HSA with or without the quencher (QTP), respectively. Kb and n represent the binding constant and binding stoichiometry in the HSA-QTP system. The double log plot of log [(F0 − F)/F] vs. log [Q] (Figure 3C) was used for the determination of the binding constant and binding stoichiometry. The values of Kb and n were calculated from the intercept and slope of the plot, as shown in Figure 3C. As per Figure 3C, Kb and n at different temperatures for the HSA-QTP system are presented in Table 2. A decrease in the binding constant was observed at higher temperatures for the HSA-QTP system. Further, the binding constants were ~104, suggesting a moderate binding between HSA and QTP.

2.2.3. Determination of the Binding Forces between HSA and QTP-Thermodynamic Analysis

The primary binding intermolecular forces that are involved in the drug-protein interactions were estimated via thermodynamic parameters. The protein-drug interactions are held together by hydrophobic interactions, hydrogen bonds, electrostatic forces, and van der Waal interactions. Moreover, the sign and magnitude of the enthalpy (ΔH0) and entropy (ΔS0) change to determine the nature of binding forces in the drug-protein complex. For the hydrophobic interactions, the sign and magnitude must have a positive value for ΔH0 and ΔS0. At the same time, in the case of van der Waals forces and hydrogen bonding, it must be negative for ΔH0 and ΔS0 [36,37]. Additionally, for the electrostatic interaction, ΔH0 should be negative and ΔS0 positive. The free energy (ΔG0) change of the HSA-QTP system can be determined by using the van ’t Hoff equation and the thermodynamic equation given below:
lnK b = Δ H 0 RT + Δ S 0   R
Δ G 0 = Δ H 0 T Δ S 0
where R represents the gas constant (8.314 J mol −1 K −1), T is the temperature in kelvins, and Kb represents the binding constant at the studied different temperatures. ΔH0 and ΔS0 are obtained from the slope and intercept of the plot between lnK and 1/T (Figure 3D). The results of ΔG0, ΔH0, and ΔS0 obtained from HSA-QTP interactions are summarized in Table 3. The positive values of ΔH0 and ΔS0 for the HSA-QTP system suggest that hydrophobic interactions played a significant role in the binding process of QTP to HSA. Thus, the formation of the HSA-QTP complex was exothermic and spontaneous [38].

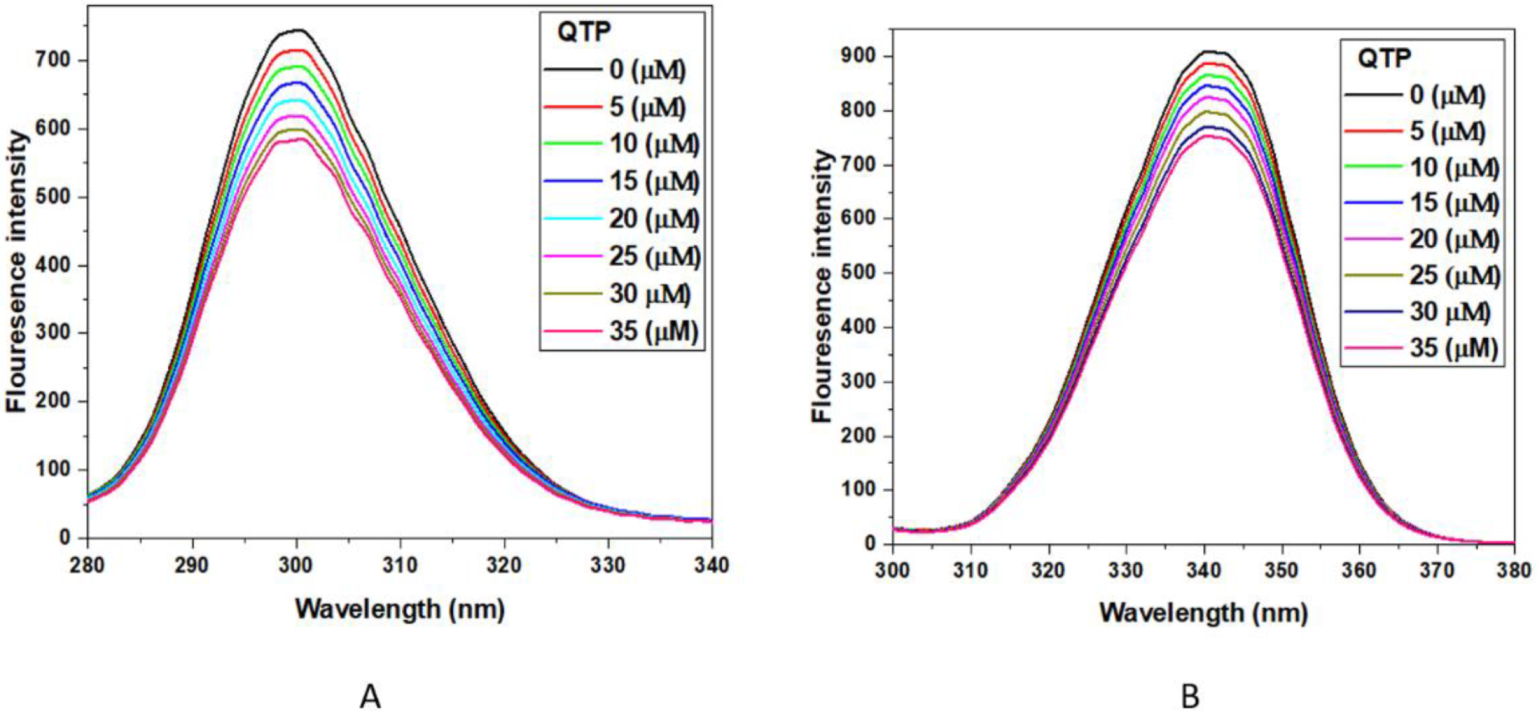
2.2.4. Synchronous Fluorescence Spectroscopy (SFS) Experiment

The synchronous fluorescence spectrometry helps to provide information about the local environment of proteins around W and Y residues upon interaction with ligands [30,39]. In this experiment, the fluorescence difference between excitation and emission wavelengths reflects the nature of the spectra. A difference of wavelength (Δλ) of 15 nm is characteristic for (Y), and 60 nm is typical of (W) residues. Therefore, any shift in the maximum emission wavelength reflects the local environment changes around aromatic amino acid residue (Y and W) [40]. The SFS emission spectra of the HSA-QTP complex are given in Figure 4A,B. It was clear from Figure 4 that the HSA fluorescence intensity of both (W and Y) regularly decreases with the addition of QTP. Further, no shift in the emission wavelength was observed for either of the spectra at Δλ = 15 nm or 60 nm. The HSA-QTP interaction did not lead to any microenvironmental change in the protein molecule upon interaction.

2.2.5. Binding and Prediction of Site Markers in the HSA-QTP System

A site marker displacement experiment was investigated to identify QTP binding site on HSA. In this experiment, here warfarin (WAR) for Sudlow’s site I (subdomain IIA), ibuprofen (IBU) for Sudlow’s Site II (subdomain IIIA), and hemin (HEM) for binding site III (subdomain IB) were used as HSA site marker probes; [10,26]. As a result, fluorescence spectra were recorded HSA-QTP system in the presence of site marker probes (0–30 μM). Moreover, the displacement percentage (I%) of QTP with the site markers is estimated by the following methods [40,41]:
I ( % ) = F 2 F 1 × 100
F1 and F2 represent the fluorescence emission intensities of the HSA-QTP system in the absence and presence of different site markers, respectively. However, the percentage of displacement values of the HSA-QTP complex against the different concentrations of site markers is shown in Figure 5. It is apparent from Figure 5 that the displacement percentage of QTP from HSA by hemin is appreciably higher than WAR and IBU. Thus, the binding site of QTP is predicted to be in site III (subdomain IB) of HSA.

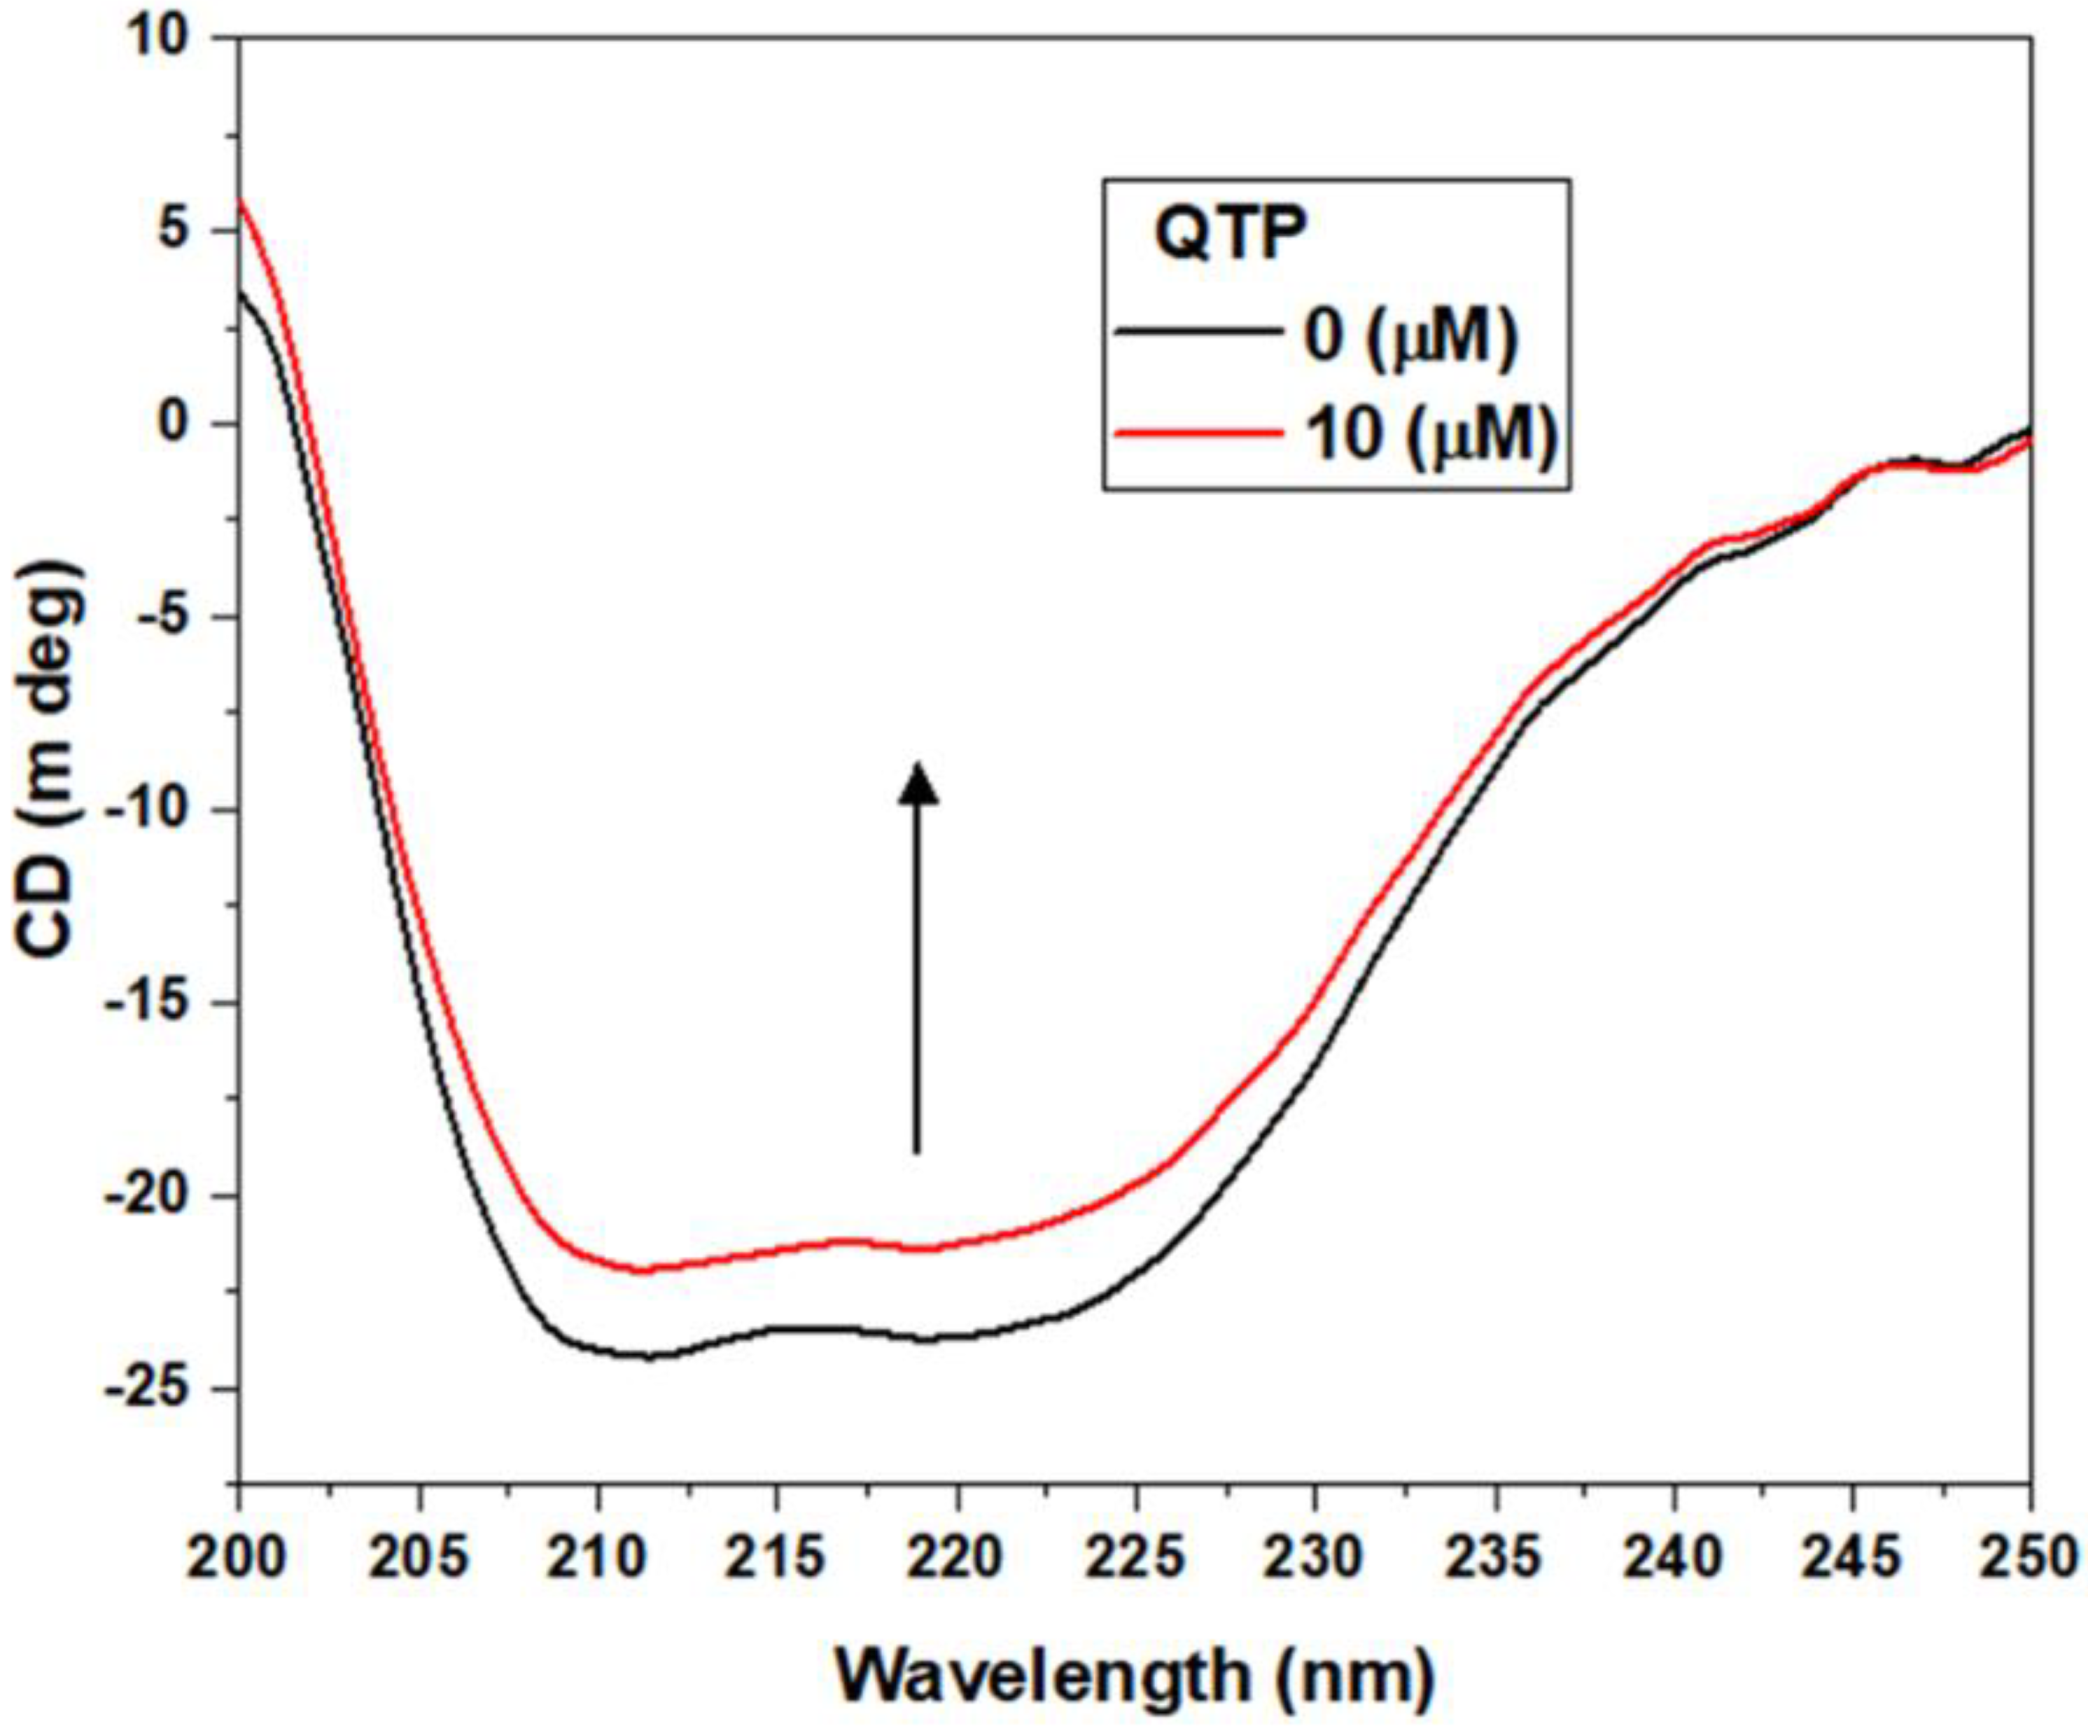
2.2.6. Circular Dichroism Spectra Changes in HSA upon QTP Binding

Circular dichroism (CD) spectroscopy is a versatile technique mainly used to detect structural and conformational changes in protein structure. The CD spectra of HSA have two negative peaks in the UV region, which reflect α-helix at around 208 and 222 nm of the protein [42]. Figure 6 represents the CD spectra of HSA alone and the HSA-QTP system at different molar ratios of 1:0–1:2. The addition of QTP leads to a decrease in the ellipticity of HSA, suggesting the loss of α-helical content. The CD results showed that the α-helix content of the HSA and QTP-HSA system was 55.92% and 48.88%, respectively. Therefore, these results suggest that the addition of QTP leads to secondary structure change of HSA α-helix content.

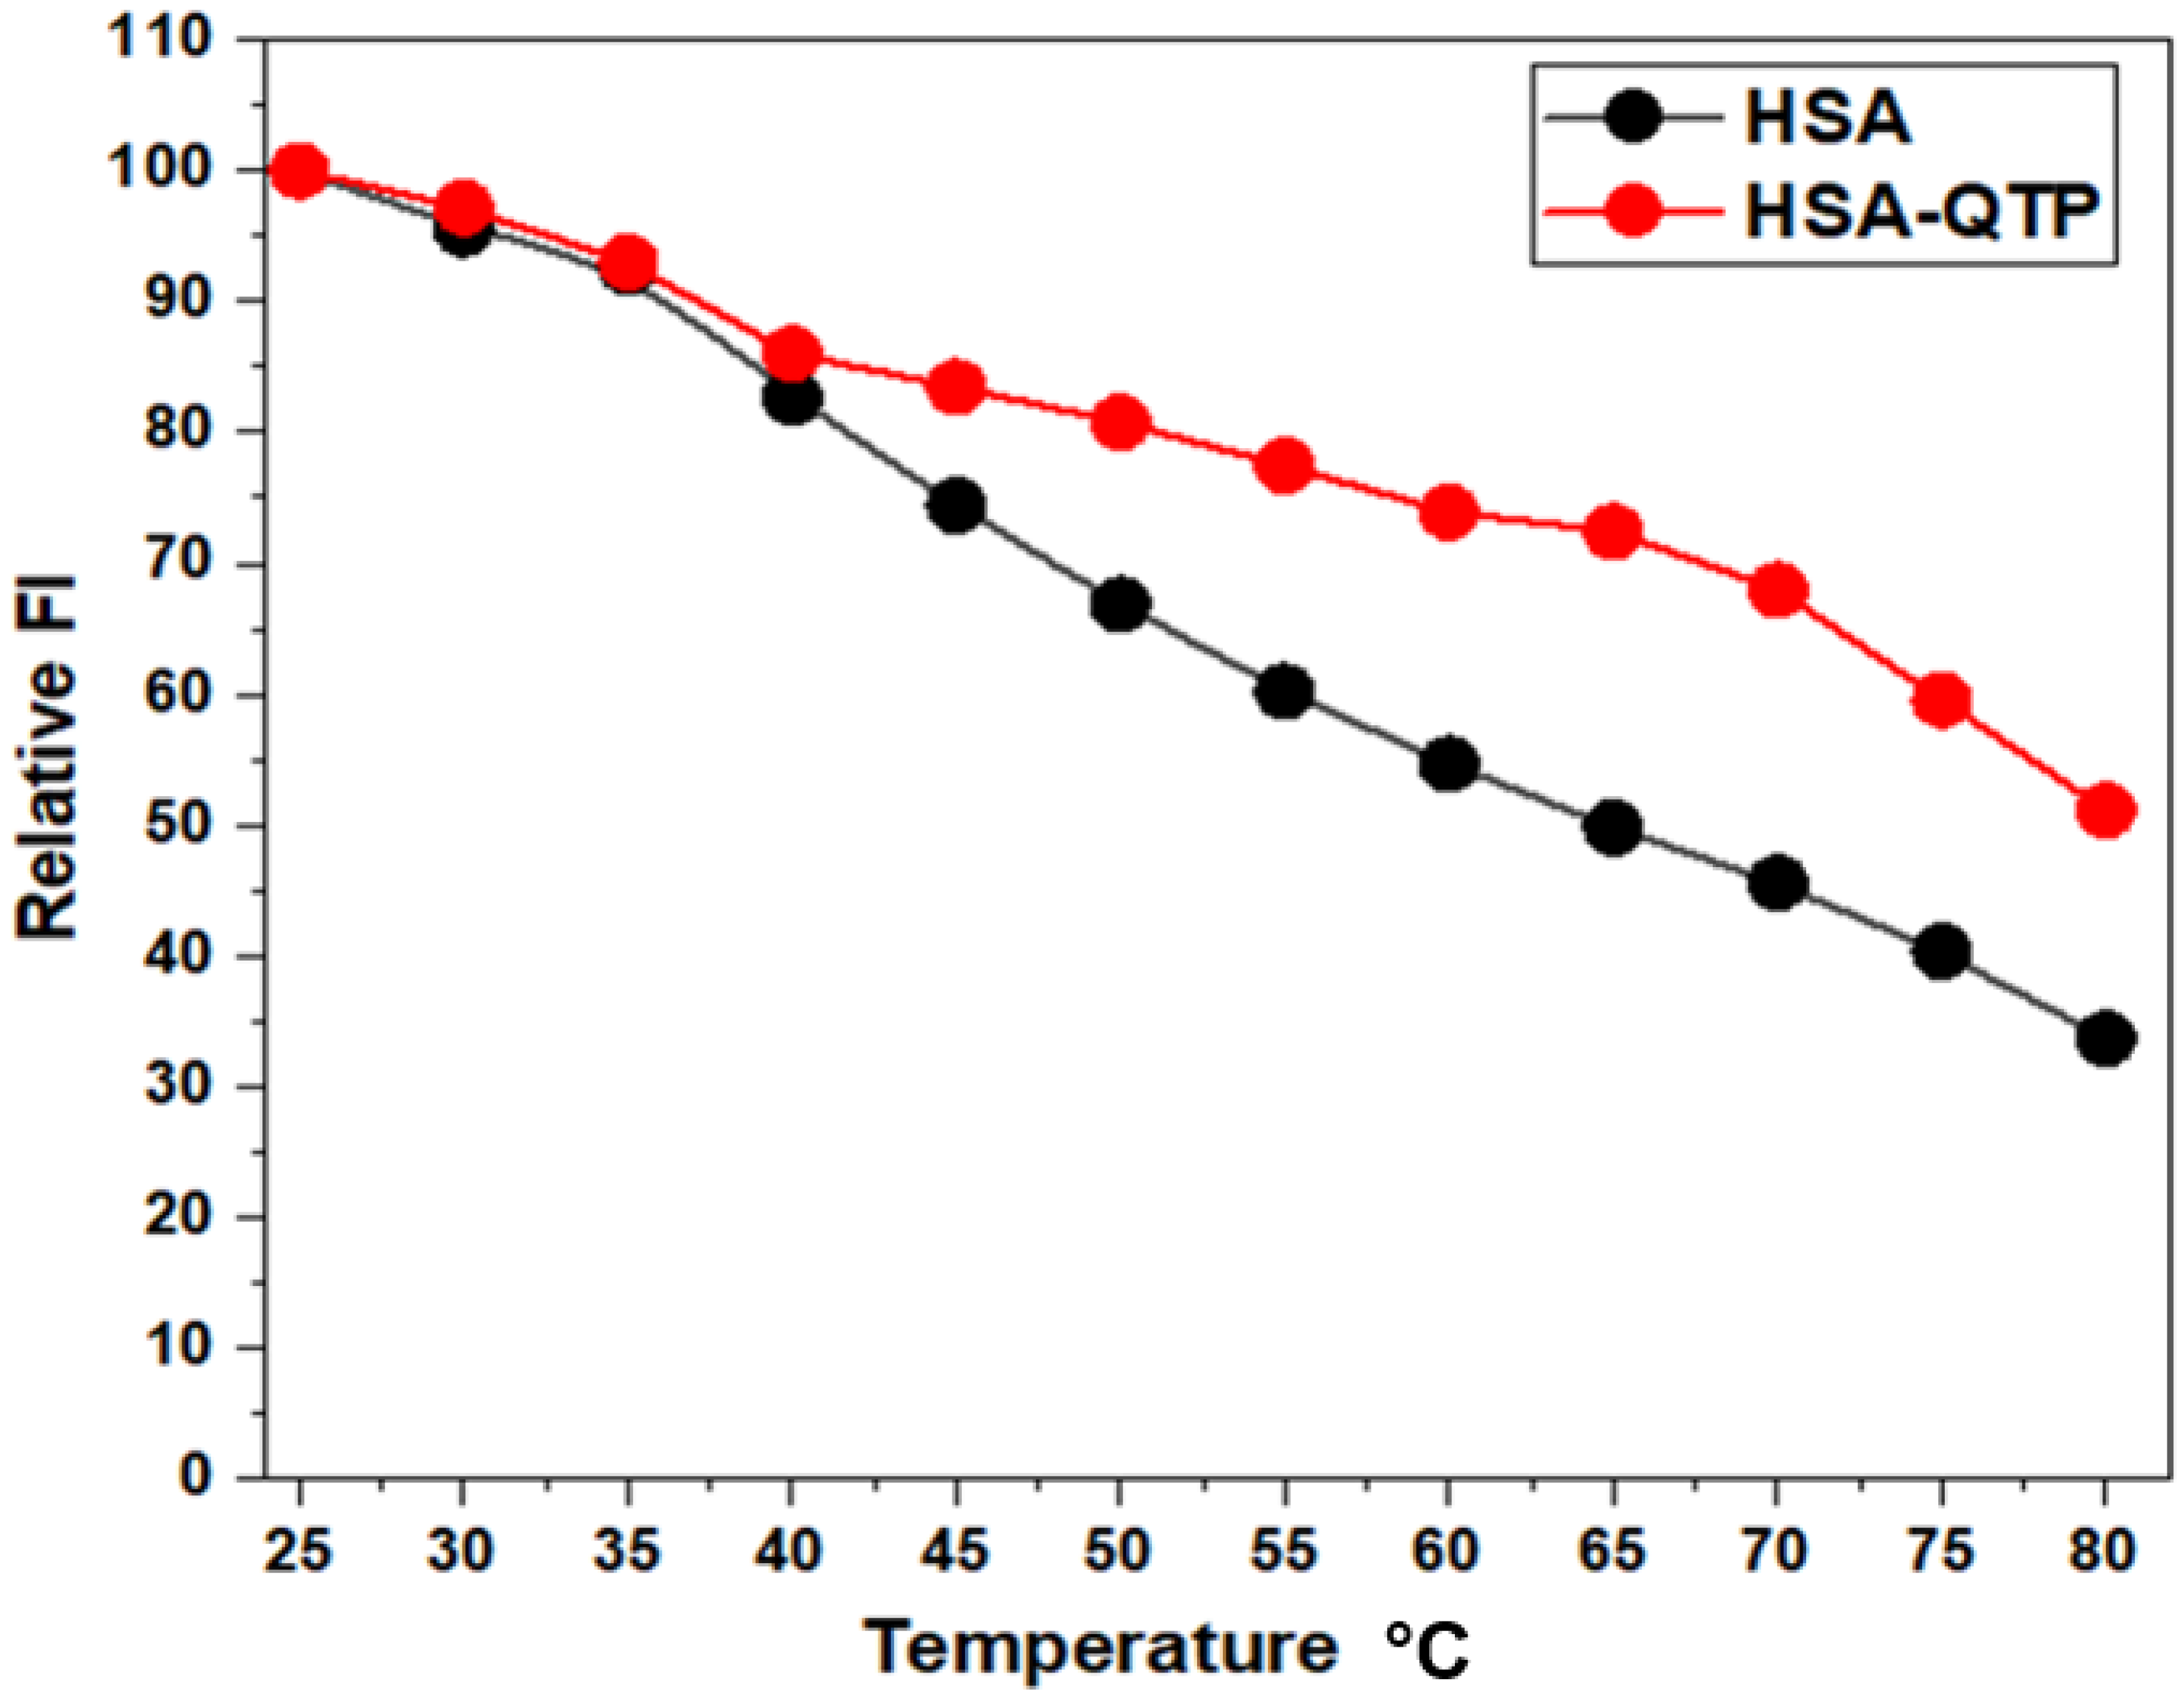
2.2.7. QTP-Induced Thermal Stabilization of HSA

The binding of drugs to plasma proteins can increase the protein’s thermal stability [43]. Various studies have shown that drugs induced thermal stabilization to HSA [44,45]. Therefore, the thermal stability measurements of HSA were carried out at different temperatures in the absence and presence of QTP binding. The temperature-dependent titrations measurements were performed on HSA (5 µM) without or with QTP (50 µM) in different temperature range, 25–80 °C (5 °C intervals). Figure 7 shows the influence of temperature on the fluorescence intensity of the HSA and HSA-QTP system at 343 nm. In the presence of QTP at 45 °C, the decrease in FI of the HSA-QTP system was lesser than HSA alone. However, our thermal stability results demonstrated QTP-induced stability to HSA via QTP-HSA system formation (coupling of binding and unfolding equilibrium) [46].

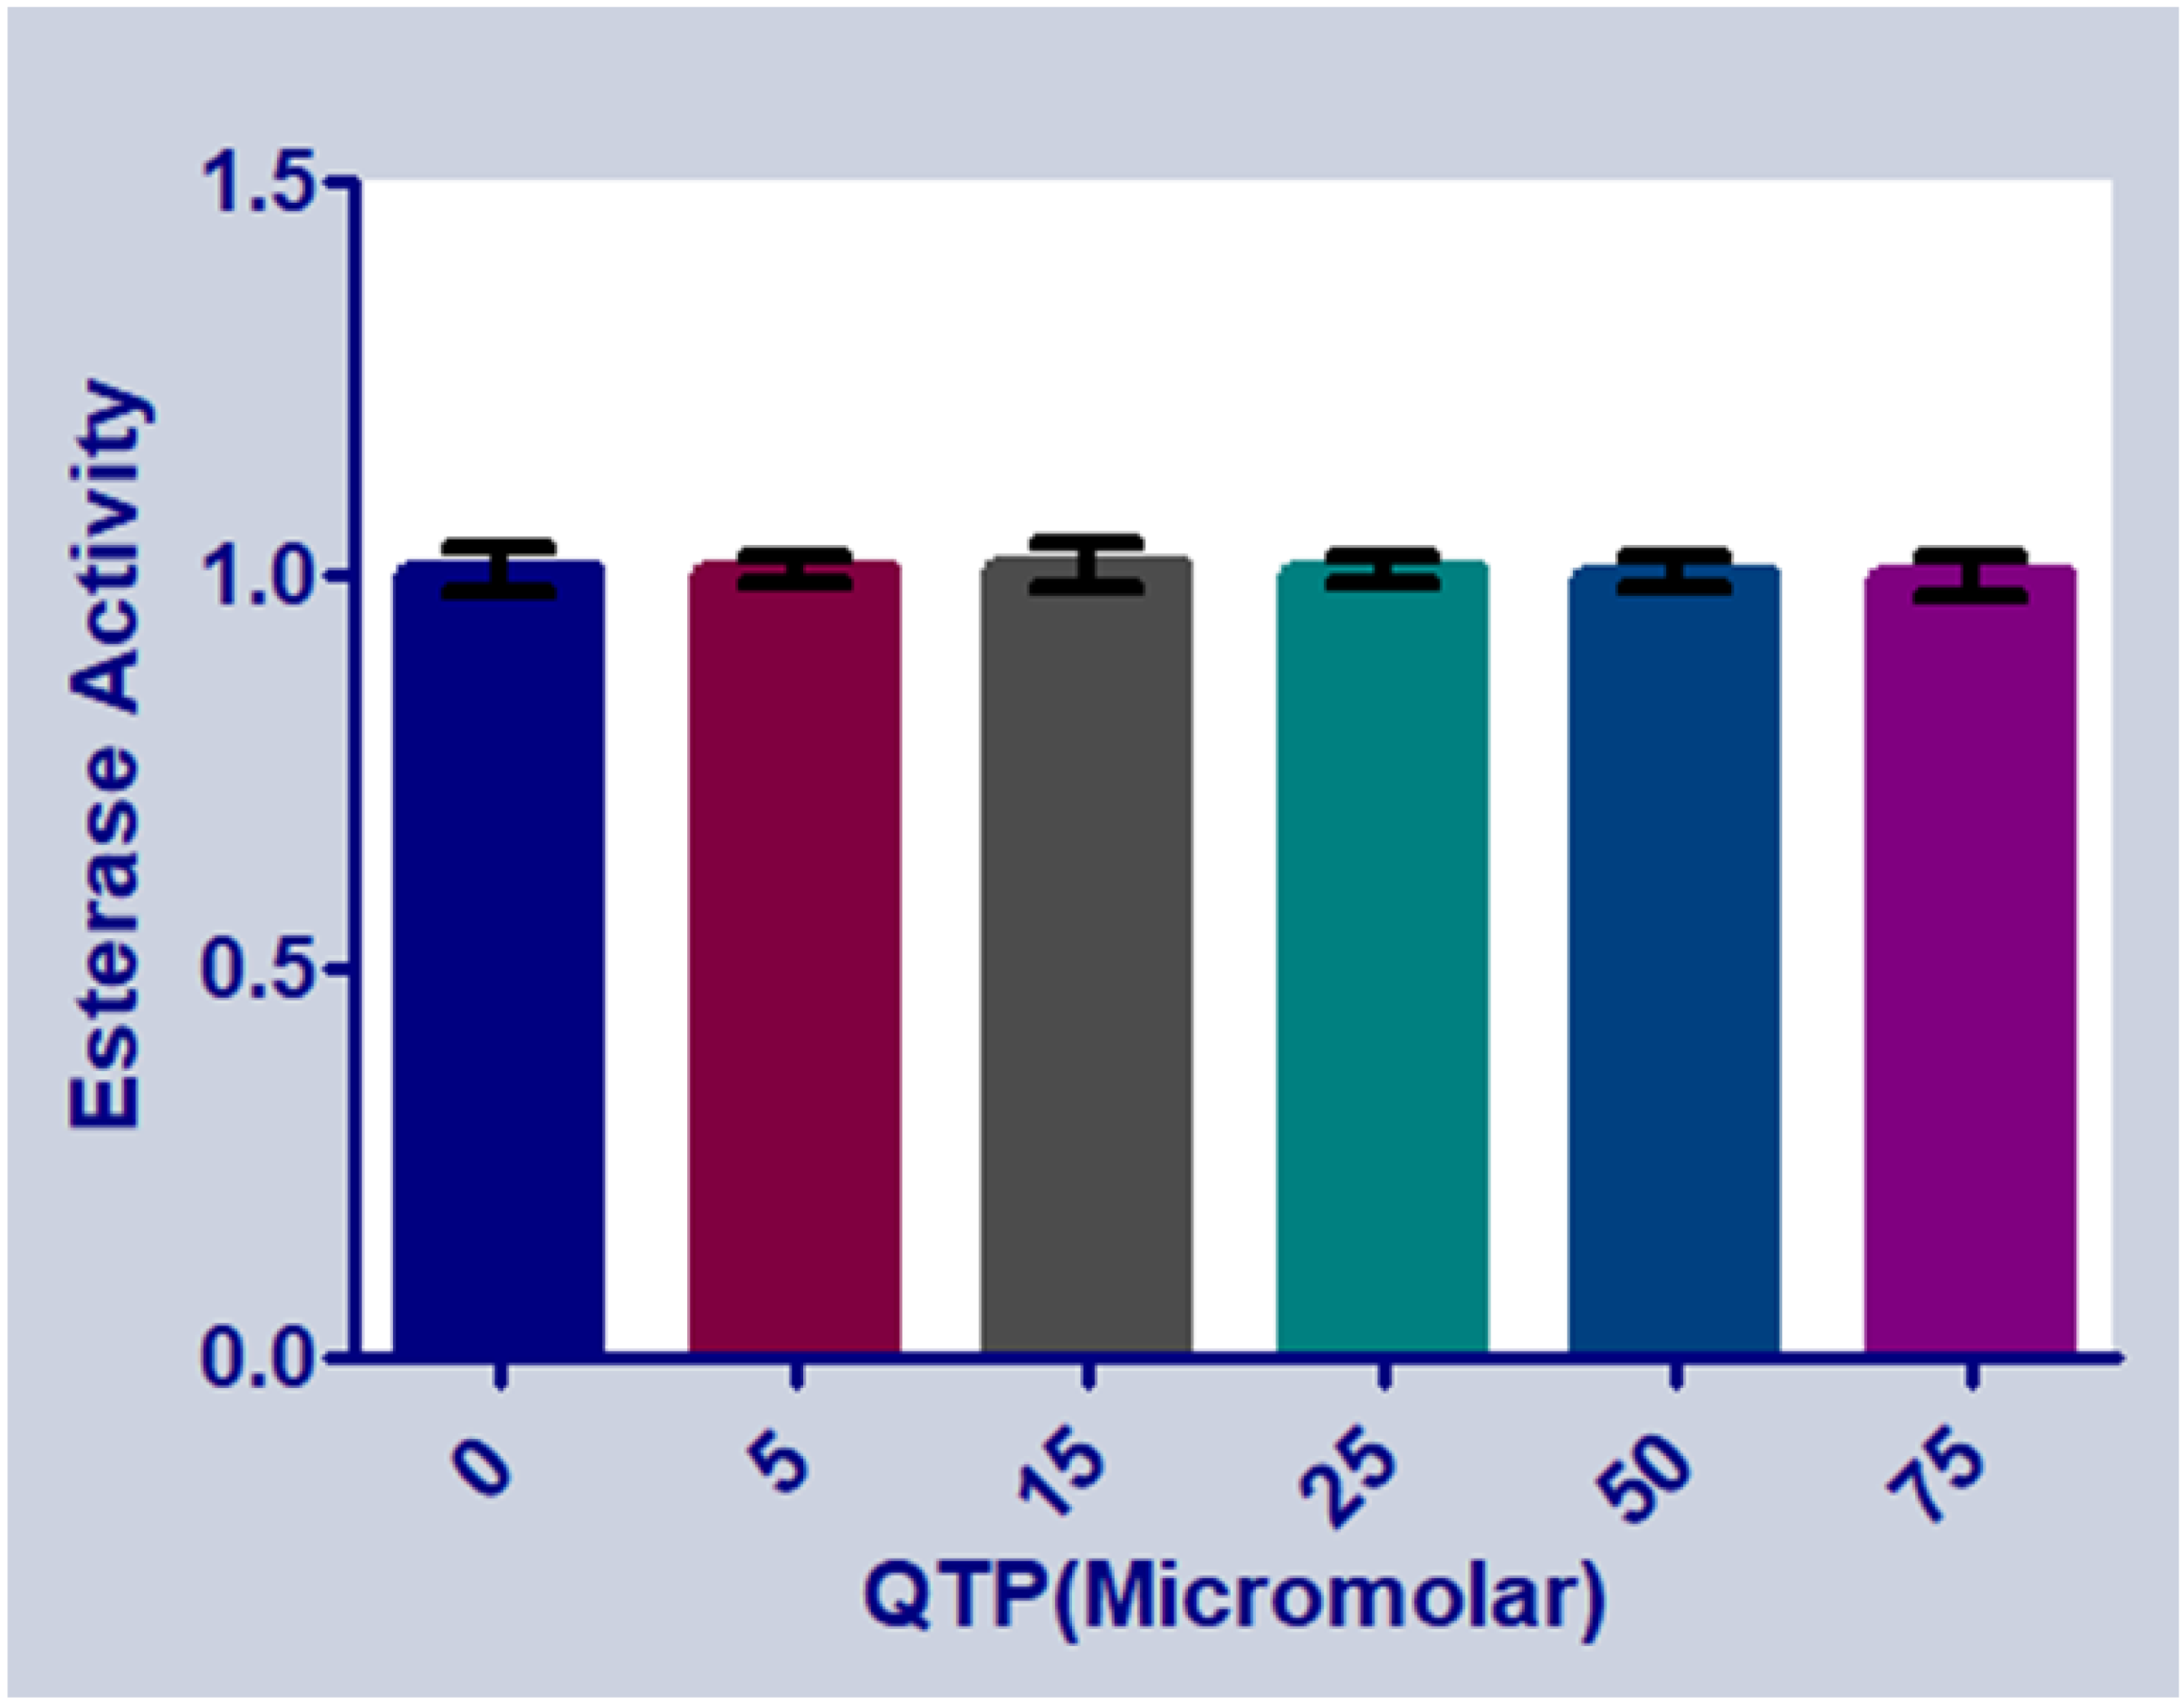
2.2.8. Effect of QTP Binding on the Esterase-Like Activity of HSA

HSA is the most abundant protein in the blood plasma and possesses catalytic functions such as esterase-like activity [47]. Amino acid residues such as Arg-410 Tyr-41 (Sudlow’s site II (subdomain IIIA)) of HSA play a predominant function in esterase activity (Watanabe et al., 2000) [48]. However, the effect of QTP binding on the esterase-like activity of HSA is shown in Figure 8. It was observed that upon the addition of QTP (0–75 μM), there is no inhibiting effect on the esterase-like activity of HSA.

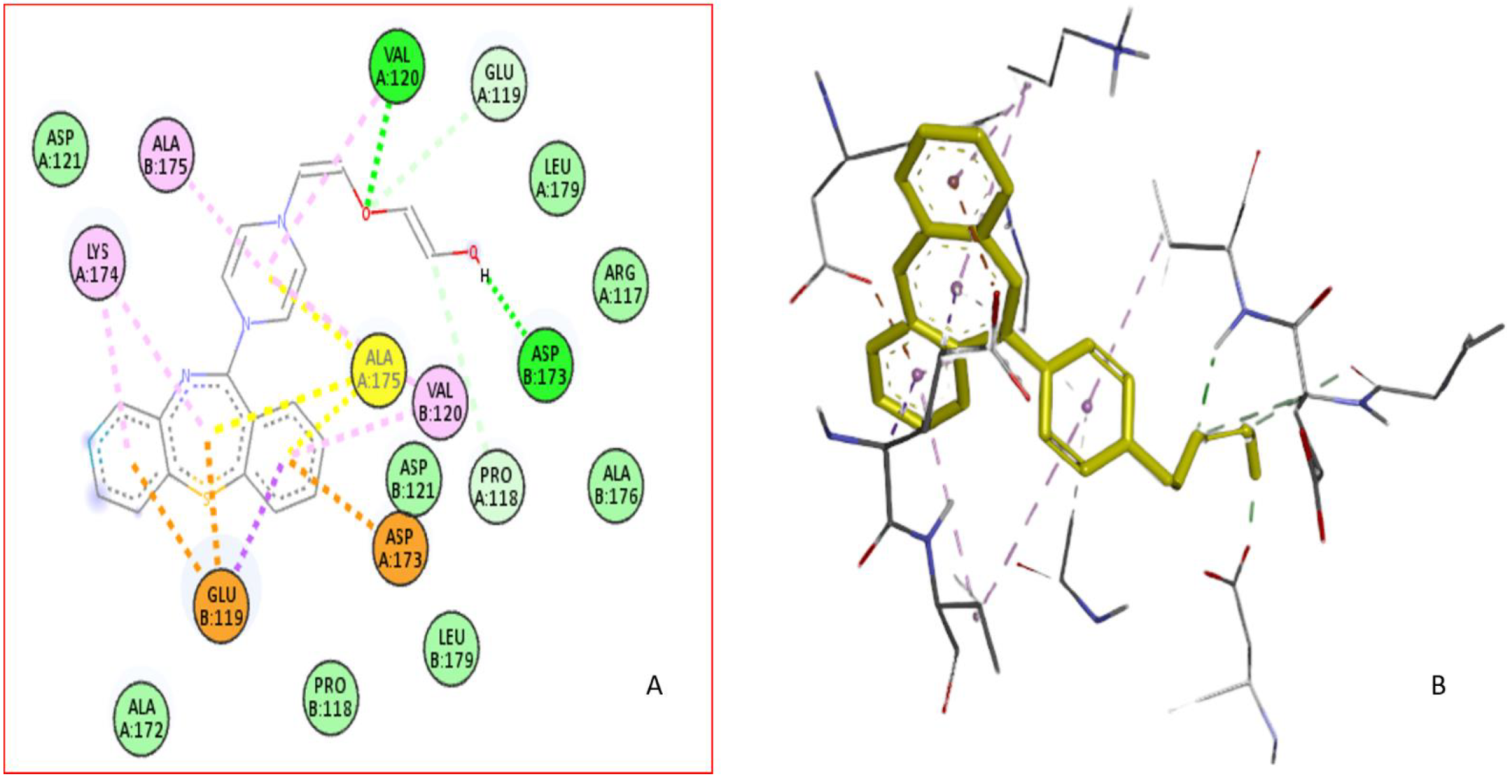
2.2.9. Computational Modeling of the HSA-QTP Complex

The binding region and amino acid residues involved in the interaction of QTP with HSA were evaluated by molecular docking analysis [27,45,47]. The most suitable confirmation of the HSA-QTP system is given in Figure 9A,B. The molecular docking results suggested the QTP binding region at subdomain IB (Site III) of HSA (Figure 9A). Further, QTP binds to HSA and forms two hydrogen bonds with VAL120 and ASP173 amino acid residues of HSA (Figure 10A). In addition to the two hydrogen bonds, the QTP molecule is surrounded by LEU-179, ARG-117, ALA-176, ASP-121, LEU-179, PRO-118, ALA-172, VAL-120, ASP-173, GLU-119, LYS-174, and ALA-175 through different interactions (Figure 10). The autodock results also showed that the binding affinity of QTP to HSA was −8.2 kcal mol−1. Thus, we can conclude that the molecular docking results agree with the site displacement markers experiments (Figure 5).

3. Materials and Methods

3.1. Chemical Reagents

HSA (A1887, fatty acid and globulin free) and QTP (purity, 90%) were obtained from Sigma Chemical Co. (St. Louis, Mo, USA) and GLR. Scientific. Co. (Delhi, India), warfarin, ibuprofen through the National Scientific company (Riyadh, KSA) and hemin were obtained from SRL Pvt. Ltd. (Mumbai, India). All other chemicals and reagents for this study were of high analytical grade.

3.2. Sample Preparation

HSA stock solution (200 µM) was prepared in Tris-HCI buffers (0.2 M) pH 7.4. In addition, the stock of QTP (10 mM) was prepared in methanol and then diluted with Tris-HCI buffers (0.2 M), pH 7.4, to prepare the working standard samples of QTP. Finally, the buffer was prepared using Type I Millipore water (Burlington, MA, USA).

3.3. Instrumentations

The UV-Vis absorption spectra were recorded on a UV-1800 spectrophotometer (Shimadzu, Kyoto, Japan) using a 1.0 × 1.0 cm cell. The fluorescence experiments were recorded on an RF-5301PC spectrofluorometer (Shimadzu, Kyoto, Japan) fitted with a xenon-flash lamp with quartz-cuvettes. The circular dichroism experiments were recorded on a JASCO J-1500-CD spectrophotometer (Mary’s Court, Easton, MD, USA) equipped with a Peltier temperature controller with a quartz cuvette.

3.4. Methods

3.4.1. UV-Visible Absorption Spectroscopy

UV-Visible absorbance spectra of HSA (5 μM) in the absence and presence of QTP (0–30 μM) at 298 k were recorded at wavelengths from 240 to 410 nm, and baseline correction was performed using an appropriate buffer.

3.4.2. Steady-State Fluorescence Measurements

The intrinsic fluorescence spectra of HSA were recorded at an emission wavelength (300–420 nm) upon excitement at 295 nm. The HSA (5 μM) samples were titrated with QTP (0–35 μM) at three different temperatures (295, 300, 305 K) to estimate thermodynamic parameters. The obtained fluorescence data were corrected for inner filter effects.

3.4.3. Synchronous Fluorescence Spectroscopy (SFS) Experiments

For this experiment, SFS measurements of HSA (5 μM) titrated with different concentrations of QTP (0–35 μM) were performed in different experiments by setting wavelength intervals (Δλ) at 15 nm for tyrosine residue (Y) and 60 nm for tryptophan residue (W) in the same experimental conditions as the fluorescence measurements.

3.4.4. Competitive Site Probe Displacement (CSPD) Experiments

Briefly, in these experiments, CSPD experiments were carried out to locate the binding site of QTP on the HSA. Warfarin (WAR) (Sudlow’s site I), ibuprofen (IBU) (Sudlow’s site II), and hemin (HEM) (site III) site markers were used to locate the binding region of QTP in HSA. Initially, fluorescence spectra were performed by titrating a solution of 5 μM HSA and QTP 10 µΜ with increasing site marker (0–30 µΜ) concentrations in separate experiments. All other parameters (excitation and emission wavelength) were uniform for the fluorescence measurements.

3.4.5. Circular Dichroism (CD) Spectroscopy Measurements

The far CD spectra of HSA and the HSA-QTP complex were recorded at a wavelength between 200 and 260 nm on the spectropolarimeter with a scan speed of 100 nm min−1. HSA (5 μM) was titrated with 10 μM QTP. The measured ellipticity values were expressed as the mean residue ellipticity (MRE) in deg cm2 dmol−1, defined by equation [48]:
MRE = Observed   CD   ( θ obs )   c × n × l × 10
where θobs is the measured ellipticity in millidegree, “n” is the number of amino acids residues, “l” is the path length of the cuvette (cm), and “c” is the molar concentration of protein. The α-helical content of HSA was determined by equation [48]:
  α - helical   content ( % ) = [ MRE 208 4000 ] [ 33,000 4000 ] × 100
where MRE208 is the mean residue elasticity (MRE) at 208 nm.

3.4.6. Thermal Stability Studies of HSA and the HSA-QTP System

The thermal stability of HSA without and with QTP was investigated using fluorescence measurements. The fluorescence spectra of the HSA (5 µM) and HSA-QTP (50 µM) complex were recorded (300–400 nm upon excitation at 295 nm) in the temperature range 25–80 °C (with 5 °C intervals). The solution mixture (HSA-QTP) was incubated for 1 h at 25 °C before fluorescence measurements.

3.4.7. HSA Esterase Activity (E.A.) Assay

The influence of QTP on the esterase activity of HSA was investigated by estimating the formation of p-nitrophenol [40]. The E.A. analysis is based on the fact that 4-nitrophenyl acetate (P-NPA) interacts with HSA and generates 4-nitrophenol (maximum absorption at 400 nm) [49,50]. For this experiment, the concentration of P-NPA (5 μM) and HSA (5 μM) was fixed, and the concentration of QTP increased (0–75 μM).

3.4.8. Molecular Docking between HSA and QTP

The mechanism of QTP binding with HSA has been predicted by molecular docking using AutoDock Vina [51]. The molecular structure of HSA (PDB ID: 1AO6) and QTP (Chem-Spider ID 4827) was obtained from Protein Data Bank (PDB) and Chem-spider, respectively. In the docking protocol, a grid box size of 60 × 60 × 60 with coordinates set to x = 45, y = 12, and z = 18 was built to cover the entire protein. All other parameters were maintained to the default setting. The docked structure of the HSA-QTP system was analyzed with Discovery studio.

4. Conclusions

In the present study, the antipsychotic drug QTP was characterized for its binding interaction to HSA using spectroscopic and biochemical methods and computational approaches. The results obtained from the QTP-HSA binding interactions showed moderate binding affinity of QTP toward HSA. In addition, the involvement of hydrogen bonding and hydrophobic interactions was observed. The spectroscopic studies suggest a complex formation between QTP and HSA, and the system follows a static quenching mechanism. Conversely, the thermodynamic parameters of the HSA-QTP system calculated via fluorescence spectroscopy at different temperatures indicate a spontaneous and exothermic process and indicate the predominant forces to be hydrophobic interactions.
Further, the site-displacement assay and molecular docking results confirm the QTP binding region at subdomain IB of HSA. The CD spectra and UV-Vis spectroscopy identified changes in the secondary structure of HSA upon its interaction with QTP. In addition, QTP did not inhibit the esterase-like activity of HSA. This study is essential and is expected to help understand the drug’s mechanisms and pharmacokinetics for further clinical research and novel drug delivery systems.

Author Contributions

Conceptualization: T.A.W., S.Z.; Methodology: T.A.W., S.Z.; Software: T.A.W., N.A.A.; Formal analysis: A.I.A.K., S.Z.; Investigation: N.A.A., T.A.W., S.Z, A.I.A.K.; Resources: T.A.W.; Writing: S.Z., T.A.W.; Review & Editing N.A.A., T.A.W. Project administration: T.A.W. All authors have read and agreed to the published version of the manuscript.

Funding

Researchers Supporting Project (RSP-2021/357), King Saud University, Riyadh, Saudi Arabia.

Institutional Review Board Statement

Not Applicable.

Informed Consent Statement

Not Applicable.

Data Availability Statement

Data will be available on request to corresponding author.

Acknowledgments

The authors extend their appreciation to the Researchers Supporting Project number (RSP-2021/357), King Saud University, Riyadh, Saudi Arabia, for funding this work.

Conflicts of Interest

The authors declare no conflict of interest.

References

  1. Rinaldi, R.; Bersani, G.; Marinelli, E.; Zaami, S. The rise of new psychoactive substances and psychiatric implications: A wide-ranging, multifaceted challenge that needs far-reaching common legislative strategies. Hum. Psychopharmacol. Clin. Exp. 2020, 35, e2727. [Google Scholar] [CrossRef] [PubMed]
  2. Harbell, M.W.; Dumitrascu, C.; Bettini, L.; Yu, S.; Thiele, C.M.; Koyyalamudi, V. Anesthetic Considerations for Patients on Psychotropic Drug Therapies. Neurol. Int. 2021, 13, 640–658. [Google Scholar] [CrossRef] [PubMed]
  3. Pringsheim, T.; Barnes, T.R. Antipsychotic drug-induced movement disorders: A forgotten problem? Can. J. Psychiatry 2018, 63, 717–718. [Google Scholar] [CrossRef] [PubMed]
  4. Gupta, A.; Kumar, Y.; Zaheer, M.R.; Roohi; Iqbal, S.; Iqbal, J. Electron Transfer-Mediated Photodegradation of Phototoxic Antipsychotic Drug Quetiapine. ACS Omega 2021, 6, 30834–30840. [Google Scholar] [CrossRef] [PubMed]
  5. Tran, J.; Gervase, M.A.; Evans, J.; Deville, R.; Dong, X. The stability of quetiapine oral suspension compounded from commercially available tablets. PLoS ONE 2021, 16, e0255963. [Google Scholar] [CrossRef]
  6. Evoy, K.E.; Teng, C.; Encarnacion, V.G.; Frescas, B.; Hakim, J.; Saklad, S.; Frei, C.R. Comparison of quetiapine abuse and misuse reports to the FDA Adverse Event Reporting System with other second-generation antipsychotics. Subst. Abus. Res. Treat. 2019, 13. [Google Scholar] [CrossRef]
  7. Akamine, Y.; Yasui-Furukori, N.; Uno, T. Drug-drug interactions of P-gp substrates unrelated to CYP metabolism. Curr. Drug Metab. 2019, 20, 124–129. [Google Scholar] [CrossRef]
  8. Ignacio, Z.M.; Calixto, A.V.; da Silva, R.H.; Quevedo, J.; Reus, G.Z. The use of quetiapine in the treatment of major depressive disorder: Evidence from clinical and experimental studies. Neurosci. Biobehav. Rev. 2018, 86, 36–50. [Google Scholar] [CrossRef]
  9. de Miranda, A.S.; Ferreira, R.N.; Teixeira, A.L.; de Miranda, A.S. Mood Stabilizers: Quetiapine. NeuroPsychopharmacotherapy 2020, 1–23. [Google Scholar]
  10. Wani, T.A.; Alsaif, N.; Alanazi, M.M.; Bakheit, A.H.; Zargar, S.; Bhat, M.A. A potential anticancer dihydropyrimidine derivative and its protein binding mechanism by multispectroscopic, molecular docking and molecular dynamic simulation along with its in-silico toxicity and metabolic profile. Eur. J. Pharm. Sci. 2021, 158, 105686. [Google Scholar] [CrossRef]
  11. Wani, T.A.; Alsaif, N.A.; Alanazi, M.M.; Bakheit, A.H.; Khan, A.A.; Zargar, S. Binding of colchicine and ascorbic acid (vitamin C) to bovine serum albumin: An in-vitro interaction study using multispectroscopic, molecular docking and molecular dynamics simulation study. J. Mol. Liq. 2021, 342, 117542. [Google Scholar] [CrossRef]
  12. Wani, T.A.; Bakheit, A.H.; Al-Majed, A.A.; Altwaijry, N.; Baquaysh, A.; Aljuraisy, A.; Zargar, S. Binding and drug displacement study of colchicine and bovine serum albumin in presence of azithromycin using multispectroscopic techniques and molecular dynamic simulation. J. Mol. Liq. 2021, 333, 115934. [Google Scholar] [CrossRef] [PubMed]
  13. Wani, T.A.; Bakheit, A.H.; Zargar, S.; Alamery, S. Mechanistic competitive binding interaction study between olmutinib and colchicine with model transport protein using spectroscopic and computer simulation approaches. J. Photochem. Photobiol. A Chem. 2022, 426, 113794. [Google Scholar] [CrossRef]
  14. Wani, T.A.; Alanazi, M.M.; Alsaif, N.A.; Bakheit, A.H.; Zargar, S.; Alsalami, O.M.; Khan, A.A. Interaction Characterization of a Tyrosine Kinase Inhibitor Erlotinib with a Model Transport Protein in the Presence of Quercetin: A Drug–Protein and Drug–Drug Interaction Investigation Using Multi-Spectroscopic and Computational Approaches. Molecules 2022, 27, 1265. [Google Scholar] [CrossRef]
  15. Zargar, S.; Wani, T.A. Protective Role of Quercetin in Carbon Tetrachloride Induced Toxicity in Rat Brain: Biochemical, Spectrophotometric Assays and Computational Approach. Molecules 2021, 26, 7526. [Google Scholar] [CrossRef]
  16. Tebeta, R.; Ahmed, N.; Fattahi, A. Experimental study on the effect of compression load on the elastic properties of HDPE/SWCNTs nanocomposites. Microsyst. Technol. 2021, 27, 3513–3522. [Google Scholar] [CrossRef]
  17. Alemi Parvin, S.; Ahmed, N.; Fattahi, A. Numerical prediction of elastic properties for carbon nanotubes reinforced composites using a multi-scale method. Eng. Comput. 2021, 37, 1961–1972. [Google Scholar] [CrossRef]
  18. Chamani, J.; Heshmati, M. Mechanism for stabilization of the molten globule state of papain by sodium n-alkyl sulfates: Spectroscopic and calorimetric approaches. J. Colloid Interface Sci. 2008, 322, 119–127. [Google Scholar] [CrossRef]
  19. Marouzi, S.; Rad, A.S.; Beigoli, S.; Baghaee, P.T.; Darban, R.A.; Chamani, J. Study on effect of lomefloxacin on human holo-transferrin in the presence of essential and nonessential amino acids: Spectroscopic and molecular modeling approaches. Int. J. Biol. Macromol. 2017, 97, 688–699. [Google Scholar] [CrossRef]
  20. Wani, T.A.; Bakheit, A.H.; Zargar, S.; Bhat, M.A.; Al-Majed, A.A. Molecular docking and experimental investigation of new indole derivative cyclooxygenase inhibitor to probe its binding mechanism with bovine serum albumin. Bioorg. Chem. 2019, 89, 103010. [Google Scholar] [CrossRef]
  21. He, X.M.; Carter, D.C. Atomic structure and chemistry of human serum albumin. Nature 1992, 358, 209–215. [Google Scholar] [CrossRef] [PubMed] [Green Version]
  22. Carballal, S.; Radi, R.; Kirk, M.C.; Barnes, S.; Freeman, B.A.; Alvarez, B. Sulfenic acid formation in human serum albumin by hydrogen peroxide and peroxynitrite. Biochemistry 2003, 42, 9906–9914. [Google Scholar] [CrossRef] [PubMed]
  23. Qi, J.; Zhang, Y.; Gou, Y.; Zhang, Z.; Zhou, Z.; Wu, X.; Yang, F.; Liang, H. Developing an anticancer copper (II) pro-drug based on the His242 residue of the human serum albumin carrier IIA subdomain. Mol. Pharm. 2016, 13, 1501–1507. [Google Scholar] [CrossRef] [PubMed]
  24. Alsaif, N.A.; Al-Mehizia, A.A.; Bakheit, A.H.; Zargar, S.; Wani, T.A. A spectroscopic, thermodynamic and molecular docking study of the binding mechanism of dapoxetine with calf thymus DNA. S. Afr. J. Chem. 2020, 73, 44–50. [Google Scholar] [CrossRef]
  25. Wani, T.A.; Bakheit, A.H.; Zargar, S.; Alanazi, Z.S.; Al-Majed, A.A. Influence of antioxidant flavonoids quercetin and rutin on the in-vitro binding of neratinib to human serum albumin. Spectrochim. Acta Part A Mol. Biomol. Spectrosc. 2021, 246, 118977. [Google Scholar] [CrossRef] [PubMed]
  26. Kou, S.-B.; Lin, Z.-Y.; Wang, B.-L.; Shi, J.-H.; Liu, Y.-X. Evaluation of the binding behavior of olmutinib (HM61713) with model transport protein: Insights from spectroscopic and molecular docking studies. J. Mol. Struct. 2021, 1224, 129024. [Google Scholar] [CrossRef]
  27. Rabbani, G.; Lee, E.J.; Ahmad, K.; Baig, M.H.; Choi, I. Binding of tolperisone hydrochloride with human serum albumin: Effects on the conformation, thermodynamics, and activity of HSA. Mol. Pharm. 2018, 15, 1445–1456. [Google Scholar] [CrossRef]
  28. Alam, M.M.; Abul Qais, F.; Ahmad, I.; Alam, P.; Hasan Khan, R.; Naseem, I. Multi-spectroscopic and molecular modelling approach to investigate the interaction of riboflavin with human serum albumin. J. Biomol. Struct. Dyn. 2018, 36, 795–809. [Google Scholar] [CrossRef]
  29. Zhao, X.; Liu, R.; Chi, Z.; Teng, Y.; Qin, P. New insights into the behavior of bovine serum albumin adsorbed onto carbon nanotubes: Comprehensive spectroscopic studies. J. Phys. Chem. B 2010, 114, 5625–5631. [Google Scholar] [CrossRef]
  30. Lakowicz, J.R. Principles of Fluorescence Spectroscopy; Springer Science & Business Media: Berlin, Germany, 2013. [Google Scholar]
  31. Kandagal, P.; Ashoka, S.; Seetharamappa, J.; Shaikh, S.; Jadegoud, Y.; Ijare, O. Study of the interaction of an anticancer drug with human and bovine serum albumin: Spectroscopic approach. J. Pharm. Biomed. Anal. 2006, 41, 393–399. [Google Scholar] [CrossRef]
  32. Peng, X.; Wang, X.; Qi, W.; Huang, R.; Su, R.; He, Z. Deciphering the binding patterns and conformation changes upon the bovine serum albumin-rosmarinic acid complex. Food Funct. 2015, 6, 2712–2726. [Google Scholar] [CrossRef] [PubMed] [Green Version]
  33. Kameníková, M.; Furtmüller, P.G.; Klacsová, M.; Lopez-Guzman, A.; Toca-Herrera, J.L.; Vitkovská, A.; Devínsky, F.; Mučaji, P.; Nagy, M. Influence of quercetin on the interaction of gliclazide with human serum albumin-spectroscopic and docking approaches. Luminescence 2017, 32, 1203–1211. [Google Scholar] [CrossRef] [PubMed]
  34. Tayyab, S.; Min, L.H.; Kabir, M.Z.; Kandandapani, S.; Ridzwan, N.F.W.; Mohamad, S.B. Exploring the interaction mechanism of a dicarboxamide fungicide, iprodione with bovine serum albumin. Chem. Pap. 2020, 74, 1633–1646. [Google Scholar] [CrossRef]
  35. Lakowicz, J.R.; Weber, G. Quenching of protein fluorescence by oxygen. Detection of structural fluctuations in proteins on the nanosecond time scale. Biochemistry 1973, 12, 4171–4179. [Google Scholar] [CrossRef]
  36. Shahabadi, N.; Hadidi, S.; Feizi, F. Study on the interaction of antiviral drug ‘Tenofovir’with human serum albumin by spectral and molecular modeling methods. Spectrochim. Acta Part A Mol. Biomol. Spectrosc. 2015, 138, 169–175. [Google Scholar] [CrossRef]
  37. Jafari, F.; Samadi, S.; Nowroozi, A.; Sadrjavadi, K.; Moradi, S.; Ashrafi-Kooshk, M.R.; Shahlaei, M. Experimental and computational studies on the binding of diazinon to human serum albumin. J. Biomol. Struct. Dyn. 2018, 36, 1490–1510. [Google Scholar] [CrossRef]
  38. Ross, P.D.; Subramanian, S. Thermodynamics of protein association reactions: Forces contributing to stability. Biochemistry 1981, 20, 3096–3102. [Google Scholar] [CrossRef]
  39. Lloyd, J. The nature and evidential value of the luminescence of automobile engine oils and related materials: Part I. Synchronous excitation of fluorescence emission. J. Forensic Sci. Soc. 1971, 11, 83–94. [Google Scholar] [CrossRef]
  40. Ahmad, A.; Ahmad, M. Understanding the fate of human serum albumin upon interaction with edifenphos: Biophysical and biochemical approaches. Pestic. Biochem. Physiol. 2018, 145, 46–55. [Google Scholar] [CrossRef]
  41. Wani, T.A.; Bakheit, A.H.; Zargar, S.; Khayyat, A.I.A.; Al-Majed, A.A. Influence of Rutin, Sinapic Acid, and Naringenin on Binding of Tyrosine Kinase Inhibitor Erlotinib to Bovine Serum Albumin Using Analytical Techniques Along with Computational Approach. Appl. Sci. 2022, 12, 3575. [Google Scholar] [CrossRef]
  42. Greenfield, N.J. Using circular dichroism spectra to estimate protein secondary structure. Nat. Protoc. 2006, 1, 2876–2890. [Google Scholar] [CrossRef] [PubMed]
  43. Sancataldo, G.; Vetri, V.; Fodera, V.; Di Cara, G.; Militello, V.; Leone, M. Oxidation enhances human serum albumin thermal stability and changes the routes of amyloid fibril formation. PLoS ONE 2014, 9, e84552. [Google Scholar] [CrossRef] [PubMed] [Green Version]
  44. Farruggia, B.; Nerli, B.; Di Nuci, H.; Rigatusso, R.; Picó, G. Thermal features of the bovine serum albumin unfolding by polyethylene glycols. Int. J. Biol. Macromol. 1999, 26, 23–33. [Google Scholar] [CrossRef]
  45. Rahman, S.; Rehman, M.T.; Rabbani, G.; Khan, P.; AlAjmi, M.F.; Hassan, M.; Muteeb, G.; Kim, J. Insight of the interaction between 2, 4-thiazolidinedione and human serum albumin: A spectroscopic, thermodynamic and molecular docking study. Int. J. Mol. Sci. 2019, 20, 2727. [Google Scholar] [CrossRef] [Green Version]
  46. Celej, M.S.; Montich, G.G.; Fidelio, G.D. Protein stability induced by ligand binding correlates with changes in protein flexibility. Protein Sci. 2003, 12, 1496–1506. [Google Scholar] [CrossRef] [Green Version]
  47. Moradi, N.; Ashrafi-Kooshk, M.R.; Ghobadi, S.; Shahlaei, M.; Khodarahmi, R. Spectroscopic study of drug-binding characteristics of unmodified and pNPA-based acetylated human serum albumin: Does esterase activity affect microenvironment of drug binding sites on the protein? J. Lumin. 2015, 160, 351–361. [Google Scholar] [CrossRef]
  48. Zargar, S.; Wani, T.A. Exploring the binding mechanism and adverse toxic effects of persistent organic pollutant (dicofol) to human serum albumin: A biophysical, biochemical and computational approach. Chem.-Biol. Interact. 2021, 350, 109707. [Google Scholar] [CrossRef]
  49. Ahmad, B.; Khan, M.K.A.; Haq, S.K.; Khan, R.H. Intermediate formation at lower urea concentration in ‘B’isomer of human serum albumin: A case study using domain specific ligands. Biochem. Biophys. Res. Commun. 2004, 314, 166–173. [Google Scholar] [CrossRef]
  50. Zhao, L.; Song, W.; Wang, J.; Yan, Y.; Chen, J.; Liu, R. Mechanism of dimercaptosuccinic acid coated superparamagnetic iron oxide nanoparticles with human serum albumin. J. Biochem. Mol. Toxicol. 2015, 29, 579–586. [Google Scholar] [CrossRef]
  51. Trott, O.; Olson, A.J. AutoDock Vina: Improving the speed and accuracy of docking with a new scoring function, efficient optimization, and multithreading. J. Comput. Chem. 2010, 31, 455–461. [Google Scholar] [CrossRef] [Green Version]
Figure 1. (A) chemical structure of QTP; (B) molecular structure of HSA.
Molecules 27 02589 g001
Figure 2. UV absorption spectra of HSA (5 μM) in the absence and presence of increasing concentrations of QTP (5–30 μM) in the wavelength range 240–410 nm.
Molecules 27 02589 g002
Figure 3. (A) Steady-state fluorescence emission spectra of HSA were recorded in the absence and presence of increasing concentrations of QTP. The intrinsic fluorescence of the HSA was measured at 295 K in the wavelength range of 300–420 nm after exciting at 295 nm. The black arrow represents fluorescence quenching of HSA on titration with QTP (B) Stern-Volmer plot for QTP-HSA interaction (295, 300, 310 K). (C) Double log plot for the QTP-HSA interaction at different temperatures (295, 300, 310 K). (D) van ’t Hoff plot (lnK vs. 1/T) for the binding of QTP to HSA. The concentration of HSA was 5 μM and was titrated with QTP (0–35 μM) in all the experiments (AD).
Molecules 27 02589 g003
Figure 4. Synchronous fluorescence spectra at Δλ = 15 nm (A) and Δλ = 60 nm (B) of HSA (5 μM) in the absence and presence of increasing concentrations of QTP (0-35 μM). At Δλ = 15 nm (for Y), the excitation wavelength of HSA was fixed at 240 nm, and the emission range was 255–400 nm, whereas at Δλ = 60 nm (for W), the excitation wavelength was taken at 240 nm and the emission range was 300–400 nm.
Molecules 27 02589 g004
Figure 5. Effect of site probes on the fluorescence emission intensities of the HSA-QTP system. The experiments were carried out using three site probes (warfarin, ibuprofen, and hemin). (HSA = 5 µM, QTP = 10 µM, C = 0-30 µM), λex = 295 nm, T = 295 K.
Molecules 27 02589 g005
Figure 6. Circular dichroism spectra of HSA (5 μM) in the absence and presence of QTP (10 μM).
Molecules 27 02589 g006
Figure 7. Thermal stability profiles of HSA and the QTP-HSA (1:10) system in the temperature range, 25–80 °C, as monitored by fluorescence intensity measurements at 343 nm (FI 343 nm) using a protein concentration of 5 μM in 60 mM sodium phosphate buffer, pH 7.4.
Molecules 27 02589 g007
Figure 8. Estimated esterase activity in HSA (5 μM) in the absence and presence of increasing concentrations of QTP (0–75 μM).
Molecules 27 02589 g008
Figure 9. (A) Molecular models of HSA complex with QTP. (B) Detailed view of the docking poses of the HSA-QTP complex. Selected protein side-chains are shown as ribbons.
Molecules 27 02589 g009
Figure 10. (A) The 2D binding site was magnified to show the surrounding amino acid residue of HSA interacting with QTP. (B) Three-dimensional structure of interactions of HSA with QTP.
Molecules 27 02589 g010
Table 1. The values of the Stern-Volmer constant and quenching rate constant for the QTP-HSA system.
pHTemp (K) Ksv (× 104 M−1)Kq (× 1012 M−1 s−1)
7.42950.70.70.987
3050.50.50.992
3100.30.30.993
Table 2. The binding constant values and the number of binding sites for the interaction of QTP with HSA.
pHTemp (K)Kb (× 104 M−1)N
7.42951.3261.280.996
3051.2361.310.994
3101.2001.350.994
Table 3. Various thermodynamic parameters for QTP-HSA complex formation at various temperatures.
Temp (K)ΔH0 (KJ mol−1)ΔS0 (JK−1 mol−1)TΔS0 (KJ mol−1)ΔG0 (KJ mol−1)
2955.0878123.89−18.8
30524.705−19.61
31025.11−20.11
Publisher’s Note: MDPI stays neutral with regard to jurisdictional claims in published maps and institutional affiliations.

