Quantum-SAR Extension of the Spectral-SAR Algorithm. Application to Polyphenolic Anticancer Bioactivity

Abstract
:1. Introduction
2. QuaSAR Methodology
- endpoint spectral norm
- algebraic correlation factor
- spectral path, with the distance defined in the Euclidian sense as:
- least spectral path principle, formally shaped as:
- ▪ inter-endpoint norm difference (IEND),
- ▪ inter-endpoint molecular activity difference (IEMAD),
- ○ it involves the wave-type expression of molecular effect of concentration, however, for special selected molecules (the fittest out of the C-models) and for special selected paths (the least for the M-ergodic assembly), being M and C related by Equation (1a);
- ○ it provides the specific transition or specific transformation of the effect of a certain molecule into the effect of another special molecule out from the N-trained molecules, paralleling the phenomenology of consecrated quantum transitions;
- ○ it has the amplitude of transformation driven by the so called quantum-SAR factor of an exponential formdefining the specific quantum-SAR wave;
- ○ it allows the identitywhen the reverse effects is consideredand substituted in the direct one (9), as absorption and emissions stand as reciprocal quantum effects;
- ○ it has a “phase” with unity norm, in the same manner as ordinary quantum wave functions, allowing the inter-molecular “real” quantum-SAR transformationexclusively regulated by the quantum-SAR factor of Equation (10), in the same fashion as quantum tunneling is characterized by the transmission coefficient;
- ○ when multiple transformations take place across paths with multiple linked models, say (l, l’, l’ ’), the inter-molecular transformation i→j→t is characterized by the overall quantum-SAR factor (10) written as product of intermediary onesdue to the two-equivalent ways the effect may be described directly from t or intermediated by j molecular effect transformations, respectively:in the same way as the quantum propagators behave along quantum paths [48]; certainly, such contraction scheme may be generalized for least paths connecting the M-contained k-endpoints giving an overall quantum-SAR (“metabolization power”) factor as:
- ○ Equation (9) supports the self-transformation as well, with the driven qua-SAR factor given by:during its evolution along the least paths when the same molecule (i=j) is metabolized by activating certain structural features (l≠l’) though specific indicators (variables) in correlation (bindings with receptor site); this case resembles the stationary quantum case according which even isolated (or with free motion), the molecular structures suffer dynamical wave-corpuscular or fluctuant transformation along their quantum paths;
3. Application to Flavonoids’ Anticancer Bioactivity
4. Conclusions
Acknowledgments
References
- Anderson, TW. An Introduction to Multivariate Statistical Methods; Wiley: New York, USA, 1958. [Google Scholar]
- Draper, NR; Smith, H. Applied Regression Analysis; Wiley: New York, USA, 1966. [Google Scholar]
- Shorter, J. Correlation Analysis in Organic Chemistry: An Introduction to Linear Free Energy Relationships; Oxford Univ. Press: London, UK, 1973. [Google Scholar]
- Box, GEP; Hunter, WG; Hunter, JS. Statistics for Experimenters; John-Wiley: New York, USA, 1978. [Google Scholar]
- Green, JR; Margerison, D. Statistical Treatment of Experimental Data; Elsevier: New York, USA, 1978. [Google Scholar]
- Topliss, J. Quantitative Structure-Activity Relationships of Drugs; Academic Press: New York, USA, 1983. [Google Scholar]
- Seyfel, JK. QSAR and Strategies in the Design of Bioactive Compounds; VCH Weinheim: New York, USA, 1985. [Google Scholar]
- Chatterjee, S; Hadi, AS; Price, B. Regression Analysis by Examples, 3rd Ed ed; John-Wiley: New-York, USA, 2000. [Google Scholar]
- European Commission. Regulation (EC) No. 1907/2006 of the European Parliament and of the Council of 18 Dec. 2006 concerning the registration, evaluation, authorisation and restriction of chemicals (REACH), establishing a European Chemicals Agency, amending directive 1999/45/EC and repealing Council Regulation (EC) No. 1488/94 as well as Council Directive 76/769/EEC and commission directives 91/155/EEC, 93/67/EEC, 93/105/EC and 2000/21/EC. Off. J. Eur. Union, L 396/1 of 30.12.2006; Office for Official Publication of the European Communities (OPOCE): Luxembourg, 2006. [Google Scholar]
- European Commission. Directive 2006/121/EC of the European Parliament and of the Council of 18 Dec. 2006 amending Council Directive 67/548/EEC on the approximation of laws, regulations and administrative provisions relating to the classification, packaging and labelling of dangerous substances in order to adapt it to Regulation (EC) No. 1907/2006 concerning the registration, evaluation, authorisation and restriction of chemicals (REACH) and establishing a european chemicals agency. Off. J. Eur. Union, L 396/850 of 30.12.2006; Office for Official Publication of the European Communities (OPOCE): Luxembourg, 2006. [Google Scholar]
- .
- .
- Worth, AP; Bassan, A; Gallegos Saliner, A; Netzeva, TI; Patlewicz, G; Pavan, M; Tsakovska, I; Vracko, M. The characterization of quantitative structure-activity relationships: Preliminary guidance; European Commission - Joint Research Centre: Ispra, Italy, 2005.
- Worth, AP; Bassan, A; Fabjan, E; Gallegos Saliner, A; Netzeva, TI; Patlewicz, G; Pavan, M; Tsakovska, I. The characterization of quantitative structure-activity relationships: Preliminary guidance; European Commission - Joint Research Centre: Ispra, Italy, 2005.
- Benigni, R; Bossa, C; Netzeva, TI; Worth, AP. Collection and evaluation of [(Q)SAR] models for mutagenicity and carcinogenicity; European Commission - Joint Research Centre: Ispra, Italy, 2007.
- So, SS; Karpuls, M. Evolutionary optimisation in quantitative structure-activity relationship: An application of genetic neural network. J. Med. Chem 1996, 39, 1521–1530. [Google Scholar]
- Kubinyi, H. Evolutionary variable selection in regression and PLS analysis. J. Chemometr 1996, 10, 119–133. [Google Scholar]
- Teko, IV; Alessandro, VAEP; Livingston, DJ. Neutral network studies. 2. Variable selection. J. Chem. Inf. Comput. Sci 1996, 36, 794–803. [Google Scholar]
- Kubinyi, H. Variable selection in QSAR studies. 1. An evolutionary algorithm. Quant. Struct.-Act. Relat 1994, 13, 285–294. [Google Scholar]
- Haegawa, K; Kimura, T; Fanatsu, K. GA strategy for variable selection in QSAR Studies: Enhancement of comparative molecular binding energy analysis by GA-based PLS method. Quant. Struct.-Act. Relat 1999, 18, 262–272. [Google Scholar]
- Zheng, W; Tropsha, A. Novel variable selection quantitative structure-property relationship approach based on the k-nearest neighbour principle. J. Chem. Inf. Comput. Sci 2000, 40, 185–194. [Google Scholar]
- Lucic, B; Trinajstic, N. Multivariate regression outperforms several robust architectures of neural networks in QSAR modelling. J. Chem. Inf. Comput. Sci 1999, 39, 121–132. [Google Scholar]
- Duchowicz, PR; Castro, EA. The Order Theory in QSPR-QSAR Studies; Mathematical Chemistry Monographs, University of Kragujevac: Kragujevac, Serbia, 2008. [Google Scholar]
- Zhao, VH; Cronin, MTD; Dearden, JC. Quantitative structure-activity relationships of chemicals acting by non-polar narcosis - theoretical considerations. Quant. Struct.-Act. Relat 1998, 17, 131–138. [Google Scholar]
- Pavan, M; Netzeva, T; Worth, AP. Review of literature based quantitative structure-activity relationship models for bioconcentration. QSAR Comb. Sci 2008, 27, 21–31. [Google Scholar]
- Pavan, M; Worth, AP. Review of estimation models for biodegradation. QSAR Comb. Sci 2008, 27, 32–40. [Google Scholar]
- Tsakovska, I; Lessigiarska, I; Netzeva, T; Worth, AP. A mini review of mammalian toxicity (Q)SAR models. QSAR Comb. Sci 2008, 27, 41–48. [Google Scholar]
- Gallegos Saliner, A; Patlewicz, G; Worth, AP. A review of (Q)SAR models for skin and eye irritation and corrosion. QSAR Comb. Sci 2008, 27, 49–59. [Google Scholar]
- Patlewicz, G; Aptula, A; Roberts, DW; Uriarte, E. A mini-review of available skin sensitization (Q)SARs/Expert systems. QSAR Comb. Sci 2008, 27, 60–76. [Google Scholar]
- Netzeva, T; Pavan, M; Worth, AP. Review of (quantitative) structure-activity relationship for acute aquatic toxicity. QSAR Comb. Sci 2008, 27, 77–90. [Google Scholar]
- Cronin, MTD; Worth, AP. (Q)SARs for predicting effects relating to reproductive toxicity. QSAR Comb. Sci 2008, 27, 91–100. [Google Scholar]
- Putz, MV. A spectral approach of the molecular structure – biological activity relationship part I. The general algorithm. Ann. West Univ. Timişoara Ser. Chem 2006, 15, 159–166. [Google Scholar]
- Putz, MV; Lacrămă, A-M. A spectral approach of the molecular structure – biological activity relationship part II. The enzymatic activity. Ann. West Univ. Timişoara Ser. Chem 2006, 15, 167–176. [Google Scholar]
- Putz, MV; Lacrămă, A-M. Introducing spectral structure activity relationship (S-SAR) analysis. Application to ecotoxicology. Int. J. Mol. Sci 2007, 8, 363–391. [Google Scholar]
- Lacrămă, A-M; Putz, MV; Ostafe, V. A Spectral-SAR model for the anionic-cationic interaction in ionic liquids: Application to Vibrio fischeri ecotoxicity. Int. J. Mol. Sci 2007, 8, 842–863. [Google Scholar]
- Putz, MV; Lacrămă, A-M; Ostafe, V. Spectral-SAR ecotoxicology of ionic liquids. The daphnia magna case. Res Lett Ecol 2007, 1–5. [Google Scholar]
- Putz, MV; Duda-Seiman, C; Duda-Seiman, DM; Putz, A-M. Turning SPECTRAL-SAR into 3D-QSAR analysis. application on H+K+-ATPase inhibitory activity. Int. J. Chem. Model 2008, 1, 45–62. [Google Scholar]
- Lacrămă, A-M; Putz, MV; Ostafe, V. Designing a spectral structure-activity ecotoxico-logistical battery”. In advances in quantum chemical bonding structures; Putz, MV, Ed.; Transworld Research Network: Kerala, India, 2008; Chapter 16, pp. 389–419. [Google Scholar]
- Putz, MV; Putz (Lacrămă), A-M. Spectral-SAR: Old wine in new bottle. Studia Universitatis Babeş-Bolyai Chemia 2008, 53, 73–81. [Google Scholar]
- Putz, MV; Putz, A-M; Ostafe, V; Chiriac, A. Application of spectral-structure activity relationship (S-SAR) method to ecotoxicology of some ionic liquids at the molecular level using acethylcolinesterase. Int J Chem Model 2009, 2. [Google Scholar]
- Steiger, JH; Schonemann, PH. A history of factor indeterminacy. In Theory Construction and Data Analysis in the Behavioural Science; Shye, S, Ed.; Jossey-Bass Publishers: San Francisco, CA, USA, 1978. [Google Scholar]
- Spearman, C. The Abilities of Man; MacMillan: London, UK, 1927. [Google Scholar]
- Wilson, EB. Review of the abilities of man, their nature and measurement, by Spearman, C. Science 1928, 67, 244–248. [Google Scholar]
- Wilson, EB; Hilferty, MM. The distribution of chi-square. Proc. Nat. Acad. Sci. USA 1931, 17, 684. [Google Scholar]
- Wilson, EB; Worcester, J. A note on factor analysis. Psychometrika 1939, 4, 133–148. [Google Scholar]
- Topliss, JG; Costello, RJ. Chance correlation in structure-activity studies using multiple regression analysis. J. Med. Chem 1972, 15, 1066–1068. [Google Scholar]
- Topliss, JG; Edwards, RP. Chance factors in studies of quantitative structure-activity relationships. J. Med. Chem 1979, 22, 1238–1244. [Google Scholar]
- Dittrich, W; Reuter, M. Classical and Quantum Dynamics From Classical Paths to Path Integrals; Springer-Verlag: Berlin, Germany, 1992. [Google Scholar]
- Havsteen, BH. The biochemistry and medical significance of the flavonoids. Pharmacol. Ther 2002, 96, 67–202. [Google Scholar]
- Middleton, E, Jr; Kandaswami, C; Theoharides, TC. The effects of plant flavonoids on mammalian cells: implications for inflammation, heart disease, and cancer. Pharmacol. Rev 2000, 52, 673–751. [Google Scholar]
- Zhang, S; Yang, X; Coburn, RA; Morris, ME. Structure activity relationships and quantitative structure activity relationships for the flavonoid-mediated inhibition of breast cancer resistance protein. Biochem. Pharmacol 2005, 70, 627–639. [Google Scholar]
- Zhang, S; Yang, X; Morris, ME. Combined effects of multiple flavonoids on breast cancer resistance protein (ABCG2)-mediated transport. Pharm. Res 2004, 21, 1263–1273. [Google Scholar]
- Zhang, S; Yang, X; Morris, ME. Flavonoids are inhibitors of breast cancer resistance protein (ABCG2)-mediated transport. Mol. Pharmacol 2004, 65, 1208–1216. [Google Scholar]
- Sargent, JM; Williamson, CJ; Maliepaard, M; Elgie, AW; Scheper, RJ; Taylor, CG. Breast cancer resistance protein expression and resistance to daunorubicin in blast cells from patients with acute myeloid leukaemia. Br. J. Haematol 2001, 115, 257–262. [Google Scholar]
- Hypercube, Inc. HyperChem 701, Program package, Semiempirical, AM1, Polak-Ribier optimization procedure 2002.
- Hansch, CA. A quantitative approach to biological-structure activity relationships. Acta Chem. Res 1969, 2, 232–239. [Google Scholar]
- Miller, JN; Miller, JC. Statistics and Chemometrics for Analytical Chemistry, 4th Ed ed; Pretience Hall: Harlow, England, 2000. [Google Scholar]
- StatSoft, Inc. STATISTICA for Windows, Computer program and manual 1995.


| No. | Molecular Name | Activity | Structural parameters | ||
|---|---|---|---|---|---|
| A | LogP | POL(Å3) | ETOT(kcal/mol) | ||
| (1) | Silybin | 3.74 | 2.03 | 45.68 | − 146625.1875 |
| (2) | Daidzein | 4.24 | 1.78 | 26.63 | − 76984.7109 |
| (3) | Naringenin | 4.49 | 1.99 | 27.46 | − 85032.9218 |
| (4) | Flavanone | 4.6 | 2.84 | 25.55 | − 62849.3125 |
| (5) | 7,8-Dihydroxyflavone | 4.7 | 1.75 | 26.63 | − 76982.1328 |
| (6) | 7–Methoxyflavanone | 4.79 | 2.59 | 28.02 | − 73823.8046 |
| (7) | Genistein | 4.83 | 1.50 | 27.27 | − 84380.7578 |
| (8) | 6,2′,3′-7-Hydroxyflavanone | 4.85 | 1.70 | 28.10 | − 92422.6640 |
| (9) | Hesperetin | 4.91 | 1.73 | 29.93 | − 96003.9921 |
| (10) | Chalcone | 4.93 | 3.68 | 25.49 | − 55450.1093 |
| (11) | Kaempferol | 5.22 | 0.56 | 27.90 | − 91770.5859 |
| (12) | 4′-5,7-Trimethoxyflavanone | 5.25 | 2.08 | 32.96 | − 95768.9062 |
| (13) | Flavone | 5.4 | 2.32 | 25.36 | − 62196.3437 |
| (14) | Apigenin | 5.78 | 1.46 | 27.27 | − 84379.8593 |
| (15) | Biochanin A | 5.79 | 1.53 | 29.10 | − 87961.2812 |
| (16) | 5,7-Dimethoxyflavone | 5.85 | 1.81 | 30.30 | − 84139.4687 |
| (17) | Galangin | 5.92 | 0.85 | 27.27 | − 84376.8359 |
| (18) | 5,6,7–Trimethoxyflavone | 5.96 | 1.56 | 32.77 | − 94976.1875 |
| (19) | Kaempferide | 5.99 | 0.60 | 29.74 | − 95351.3984 |
| (20) | 8-Methylflavone | 6.21 | 2.79 | 27.19 | − 65789.9218 |
| (21) | 6,4′–Dimethoxy-3-hydroxy-flavone | 6.35 | 0.41 | 31.13 | − 92162.7187 |
| (22) | Chrysin | 6.41 | 1.75 | 26.63 | − 76986.1171 |
| (23) | 2′-Hydroxy-α-naphtoflavone | 7.03 | 3.07 | 33.26 | − 82027.8359 |
| (24) | 7,8 – Benzoflavone | 7.14 | 3.35 | 32.63 | − 74634.5234 |
| 1 | 2 | 3 | 4 | 5 | 6 | 7 | 8 | 9 | 10 | 11 | 12 | 13 | 14 | 15 | 16 | 17 | 18 | 19 | 20 | 21 | 22 | 23 | 24 | |
|---|---|---|---|---|---|---|---|---|---|---|---|---|---|---|---|---|---|---|---|---|---|---|---|---|
| 0 | 0.5 | 0.75 | 0.86 | 0.96 | 1.05 | 1.09 | 1.11 | 1.17 | 1.19 | 1.48 | 1.51 | 1.66 | 2.04 | 2.05 | 2.11 | 2.18 | 2.22 | 2.25 | 2.47 | 2.61 | 2.67 | 3.29 | 3.4 | 1 |
| 0 | 0.25 | 0.36 | 0.46 | 0.55 | 0.59 | 0.61 | 0.67 | 0.69 | 0.98 | 1.01 | 1.16 | 1.54 | 1.55 | 1.61 | 1.68 | 1.72 | 1.75 | 1.97 | 2.11 | 2.17 | 2.79 | 2.9 | 2 | |
| 0 | 0.11 | 0.21 | 0.3 | 0.34 | 0.36 | 0.42 | 0.44 | 0.73 | 0.76 | 0.91 | 1.29 | 1.3 | 1.36 | 1.43 | 1.47 | 1.5 | 1.72 | 1.86 | 1.92 | 2.54 | 2.65 | 3 | ||
| 0 | 0.1 | 0.19 | 0.23 | 0.25 | 0.31 | 0.33 | 0.62 | 0.65 | 0.8 | 1.18 | 1.19 | 1.25 | 1.32 | 1.36 | 1.39 | 1.61 | 1.75 | 1.81 | 2.43 | 2.54 | 4 | |||
| 0 | 0.09 | 0.13 | 0.15 | 0.21 | 0.23 | 0.52 | 0.55 | 0.7 | 1.08 | 1.09 | 1.15 | 1.22 | 1.26 | 1.29 | 1.51 | 1.65 | 1.71 | 2.33 | 2.44 | 5 | ||||
| 0 | 0.04 | 0.06 | 0.12 | 0.14 | 0.43 | 0.46 | 0.61 | 0.99 | 1 | 1.06 | 1.13 | 1.17 | 1.2 | 1.42 | 1.56 | 1.62 | 2.24 | 2.35 | 6 | |||||
| 0 | 0.02 | 0.08 | 0.1 | 0.39 | 0.42 | 0.57 | 0.95 | 0.96 | 1.02 | 1.09 | 1.13 | 1.16 | 1.38 | 1.52 | 1.58 | 2.2 | 2.31 | 7 | ||||||
| 0 | 0.06 | 0.08 | 0.37 | 0.4 | 0.55 | 0.93 | 0.94 | 1 | 1.07 | 1.11 | 1.14 | 1.36 | 1.5 | 1.56 | 2.18 | 2.29 | 8 | |||||||
| 0 | 0.02 | 0.31 | 0.34 | 0.49 | 0.87 | 0.88 | 0.94 | 1.01 | 1.05 | 1.08 | 1.3 | 1.44 | 1.5 | 2.12 | 2.23 | 9 | ||||||||
| 0 | 0.29 | 0.32 | 0.47 | 0.85 | 0.86 | 0.92 | 0.99 | 1.03 | 1.06 | 1.28 | 1.42 | 1.48 | 2.1 | 2.21 | 10 | |||||||||
| 0 | 0.03 | 0.18 | 0.56 | 0.57 | 0.63 | 0.7 | 0.74 | 0.77 | 0.99 | 1.13 | 1.19 | 1.81 | 1.92 | 11 | ||||||||||
| 0 | 0.15 | 0.53 | 0.54 | 0.6 | 0.67 | 0.71 | 0.74 | 0.96 | 1.1 | 1.16 | 1.78 | 1.89 | 12 | |||||||||||
| 0 | 0.38 | 0.39 | 0.45 | 0.52 | 0.56 | 0.59 | 0.81 | 0.95 | 1.01 | 1.63 | 1.74 | 13 | ||||||||||||
| 0 | 0.01 | 0.07 | 0.14 | 0.18 | 0.21 | 0.43 | 0.57 | 0.63 | 1.25 | 1.36 | 14 | |||||||||||||
| 0 | 0.06 | 0.13 | 0.17 | 0.2 | 0.42 | 0.56 | 0.62 | 1.24 | 1.35 | 15 | ||||||||||||||
| 0 | 0.07 | 0.11 | 0.14 | 0.36 | 0.5 | 0.56 | 1.18 | 1.29 | 16 | |||||||||||||||
| 0 | 0.04 | 0.07 | 0.29 | 0.43 | 0.49 | 1.11 | 1.22 | 17 | ||||||||||||||||
| 0 | 0.03 | 0.25 | 0.39 | 0.45 | 1.07 | 1.18 | 18 | |||||||||||||||||
| 0 | 0.22 | 0.36 | 0.42 | 1.04 | 1.15 | 19 | ||||||||||||||||||
| 0 | 0.14 | 0.2 | 0.82 | 0.93 | 20 | |||||||||||||||||||
| 0 | 0.06 | 0.68 | 0.79 | 21 | ||||||||||||||||||||
| 0 | 0.62 | 0.73 | 22 | |||||||||||||||||||||
| 0 | 0.11 | 23 | ||||||||||||||||||||||
| 0 | 24 |
| Model | Variables | (Q/S-)SAR Equation | ‖|Y〉 PREDICTED‖ | RAlgebraic | RStatistic |
|---|---|---|---|---|---|
| Ia | |X0>, |X1> | |Y>Ia = 5.39837|X0>+0.0179106|X1> | 26.6138 | 0.988049 | 0.0175601 |
| Ib | |X0>, |X2> | |Y>Ib = 5.67735 X0>–0.00834411|X2> | 26.61425 | 0.988065 | 0.0409922 |
| Ic | |X0>, |X3> | |Y>Ic = 6.48303|X0>+0.0000124625|X3> | 26.6344 | 0.988812 | 0.252513 |
| IIa | |X0>, |X1〉,|X2> | |Y>IIa = 5.64318|X0> +0.0178242 |X1〉–0.00833676|X2> | 26.614349 | 0.988069 | 0.0445618 |
| IIb | |X0>, |X1>,|X3> | |Y>IIb = 6.93331|X0> − 0.120924|X1>+0.0000150708|X3> | 26.638 | 0.988947 | 0.273909 |
| IIc | |X0>, |X2>,|X3> | |Y>IIc = 4.99884|X0> +0.122989|X2>+0.0000376701 |X3> | 26.6681 | 0.990063 | 0.409837 |
| III | |X0>, |X1>,|X2>, |X3> | |Y>III = 5.59424|X0>–1.05993|X1>+0.400704|X2>+0.000117452|X3> | 26.7758 | 0.994064 | 0.708509 |


| PC1 | PC2 | PC3 | Multiple | |
| Eigenvalue: | 1.958158 | 0.892127 | 0.149715 | PC1–PC3 |
| % total variance: | 65.27195 | 29.73757 | 4.99049 | factors’ |
| Variable | Factors’ coefficients | R2 | ||
| LogP | 0.232179 | −0.997780 | 0.20467 | 0.083712 |
| POL | −0.472177 | −0.302902 | −1.79349 | 0.716820 |
| ETOT | 0.483556 | 0.183309 | −1.84956 | 0.728872 |
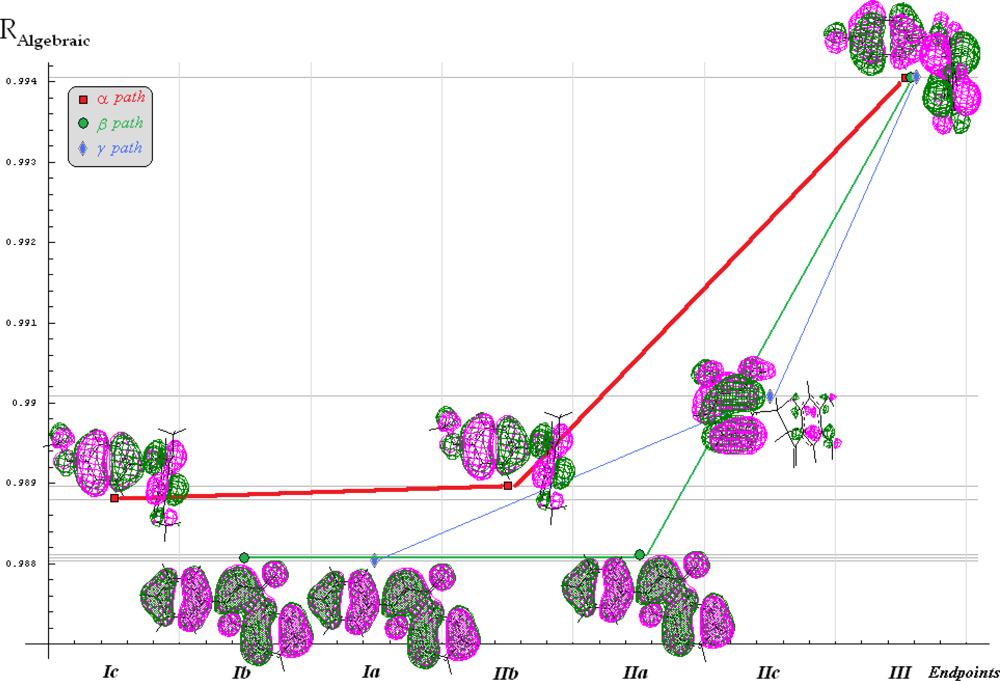
| Path | (IEND)# | (IEMAD)♣ | * | qPATH |
|---|---|---|---|---|
| α | qα =0.125464 | |||
| β | qβ=0.0848036 | |||
| γ | qγ =0.0847168 | |||
© 2009 by the authors; licensee Molecular Diversity Preservation International, Basel, Switzerland. This article is an open-access article distributed under the terms and conditions of the Creative Commons Attribution license ( http://creativecommons.org/licenses/by/3.0/). This article is an open-access article distributed under the terms and conditions of the Creative Commons Attribution license ( http://creativecommons.org/licenses/by/3.0/).
Share and Cite
Putz, M.V.; Putz, A.-M.; Lazea, M.; Ienciu, L.; Chiriac, A. Quantum-SAR Extension of the Spectral-SAR Algorithm. Application to Polyphenolic Anticancer Bioactivity. Int. J. Mol. Sci. 2009, 10, 1193-1214. https://0-doi-org.brum.beds.ac.uk/10.3390/ijms10031193
Putz MV, Putz A-M, Lazea M, Ienciu L, Chiriac A. Quantum-SAR Extension of the Spectral-SAR Algorithm. Application to Polyphenolic Anticancer Bioactivity. International Journal of Molecular Sciences. 2009; 10(3):1193-1214. https://0-doi-org.brum.beds.ac.uk/10.3390/ijms10031193
Chicago/Turabian StylePutz, Mihai V., Ana-Maria Putz, Marius Lazea, Luciana Ienciu, and Adrian Chiriac. 2009. "Quantum-SAR Extension of the Spectral-SAR Algorithm. Application to Polyphenolic Anticancer Bioactivity" International Journal of Molecular Sciences 10, no. 3: 1193-1214. https://0-doi-org.brum.beds.ac.uk/10.3390/ijms10031193