Large-Scale Isolation of Microsatellites from Chinese Mitten Crab Eriocheir sinensis via a Solexa Genomic Survey

Abstract
:1. Introduction
2. Results
2.1. Genome Survey and Assembly
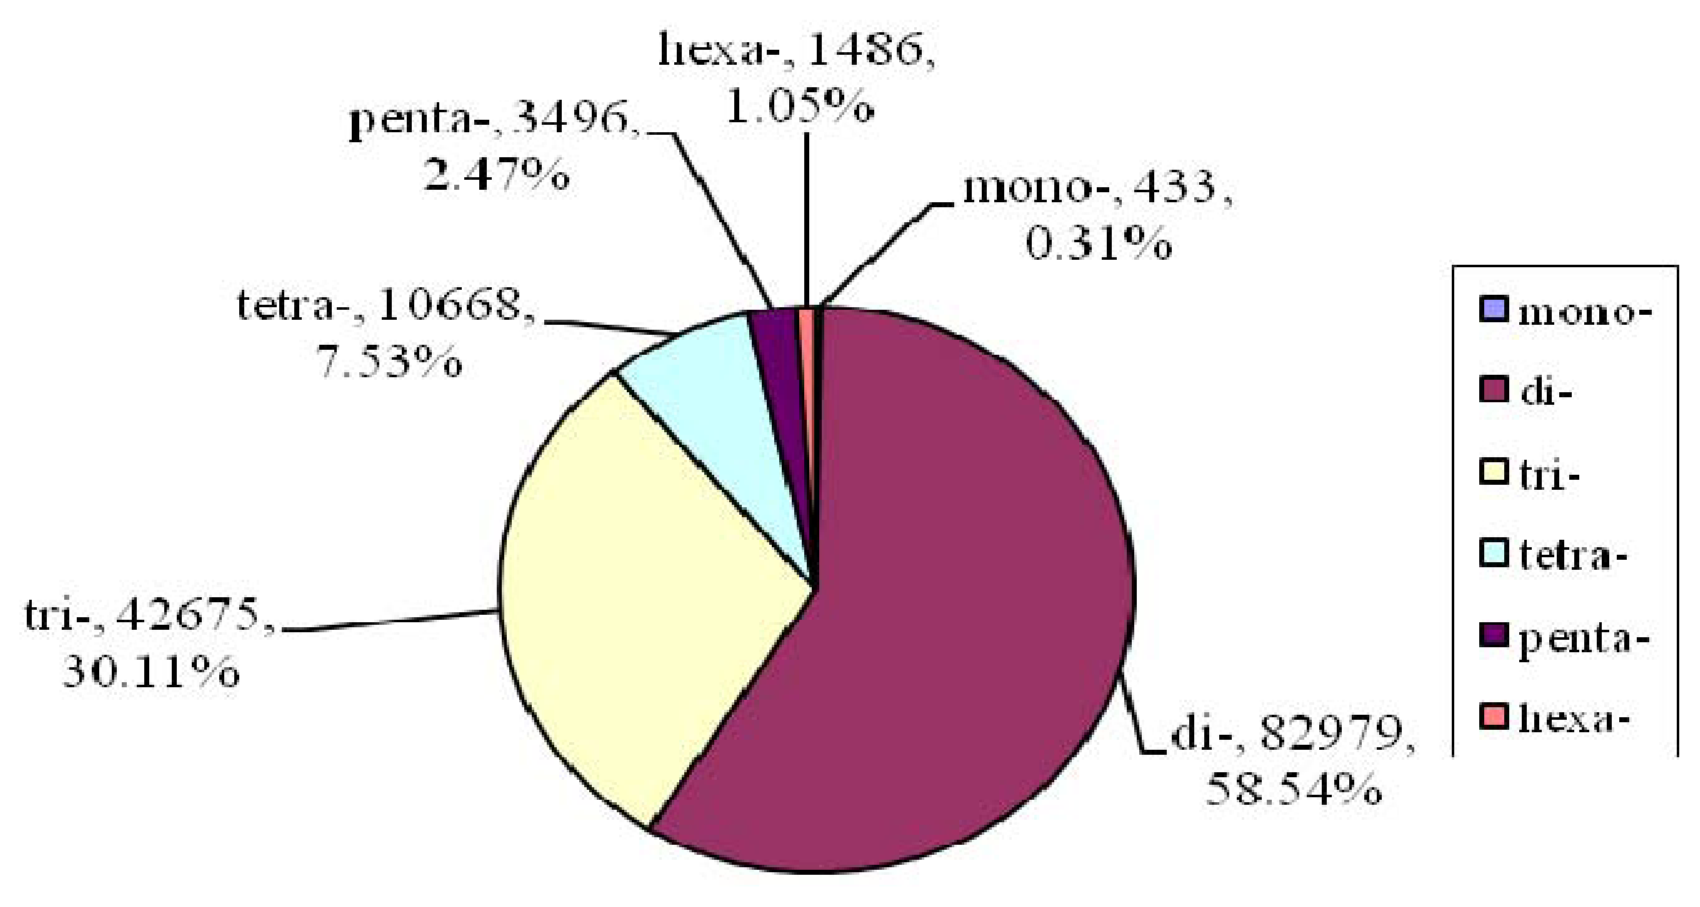
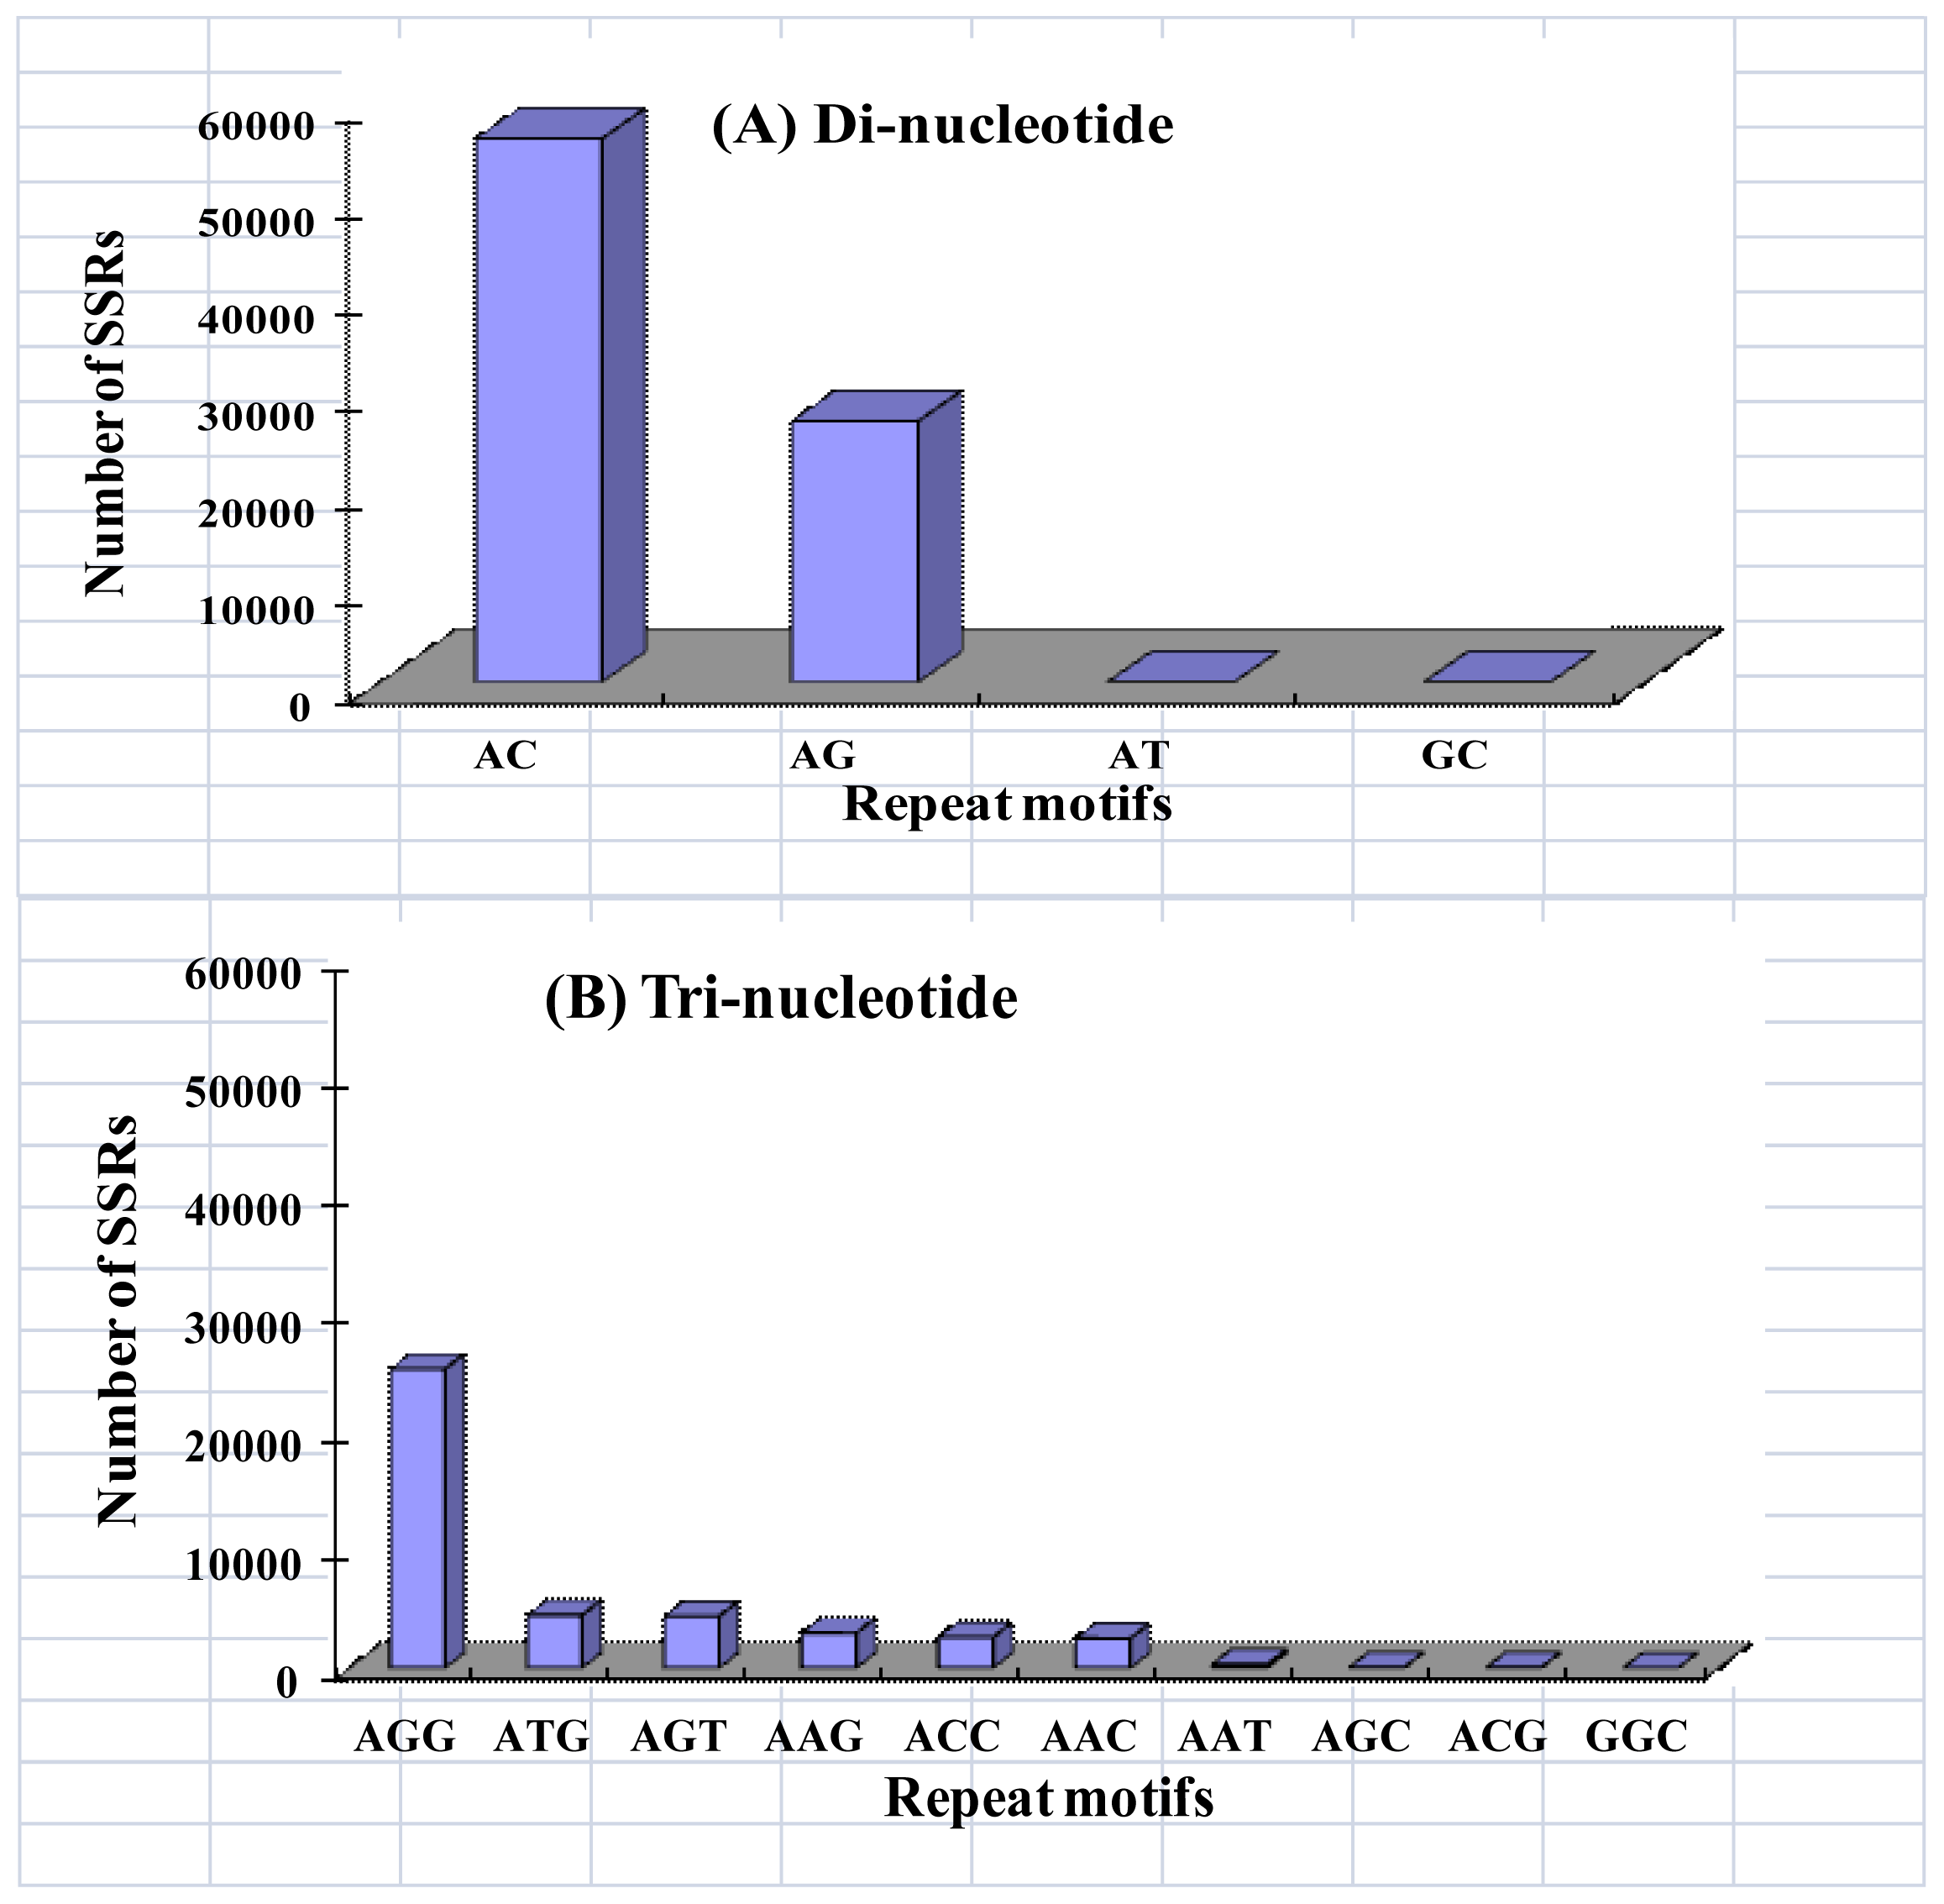
2.2. Microsatellite Loci Discovery and Primer Pair Design
2.3. SSR Validation and Population Genetic Analysis
3. Discussion
4. Experimental Section
4.1. Sample
4.2. DNA Sequencing
4.3. De Novo Assembly
4.4. Identification of Microsatellite Loci
4.5. Screening of Loci suitable for PCR and Primer Design
4.6. SSR Marker Validation and Population Genetic Analysis
5. Conclusions
Acknowledgements
References
- Weber, J.L. Informativeness of human (dC-dA)n.(dG-dT)n polymorphisms. Genomics 1990, 7, 524–530. [Google Scholar]
- Field, D.; Wills, C. Long, polymorphic microsatellites in simple organisms. Proc. R. Soc. Lond. Ser. B 1996, 263, 209–215. [Google Scholar]
- Goldstein, D.B.; Schlotterer, C. Microsatellites: Evolution and Applications; Oxford University Press: New York, NY, USA, 1999. [Google Scholar]
- Gupta, P.; Varshney, R. The development and use of microsatellite markers for genetic analysis and plant breeding with emphasis on bread wheat. Euphytica 2000, 113, 163–185. [Google Scholar]
- Gu, Z.X.; Gou, T.J.; Xi, X.B. Applications of microsatellite markers in studies of genetics and breeding of fish. Chin. J. Agric. Biotechnol 2006, 3, 83–87. [Google Scholar]
- Chistiakov, D.A.; Hellemans, B.; Volckaert, F.A.M. Microsatellites and their genomic distribution, evolution, function and applications: A review with special reference to fish genetics. Aquaculture 2006, 255, 1–29. [Google Scholar]
- Zane, L.; Bargelloni, L.; Patarnello, T. Strategies for microsatellite isolation: A review. Mol. Ecol 2002, 11, 1–16. [Google Scholar]
- Yu, J.-N.; Won, C.; Jun, J.; Lim, Y.; Kwak, M. Fast and Cost-Effective Mining of Microsatellite Markers Using NGS Technology: An Example of a Korean Water Deer Hydropotes inermis argyropus. PLoS One 2011, 6, e26933. [Google Scholar]
- Castoe, T.A.; Poole, A.W.; Gu, W.; de Koing, A.P.J.; Daza, J.M.; Smith, E.N.; Pollock, D.D. Rapid identification of thousands of copperhead snake (Agkistrodon contortrix) microsatellite loci from modest amounts of 454 shotgun genome sequence. Mol. Ecol. Resour 2010, 10, 341–347. [Google Scholar]
- Jennings, T.N.; Knaus, B.J.; Mullins, T.D.; Haig, S.M.; Cronn, R.C. Multiplexed microsatellite recovery using massively parallel sequencing. Mol. Ecol. Resour 2011, 11, 1060–1067. [Google Scholar]
- Blanca, J.; Canizares, J.; Roig, C.; Ziarsolo, P.; Nuez, F.; Pico, B. Transcriptome characterization and high throughput SSRs and SNPs discovery in Cucurbita pepo (Cucurbitaceae). BMC Genomics 2011, 12, 104. [Google Scholar]
- Setsuko, S.; Uchiyama, K.; Sugai, K.; Yoshimaru, H. Rapid development of microsatellite markers for Pandanus boninensis (Pandanaceae) by pyrosequencing technology. Am. J. Bot 2012, 99, e33–e37. [Google Scholar]
- Saarinen, E.V.; Austin, J.D. When Technology Meets Conservation: Increased Microsatellite Marker Production Using 454 Genome Sequencing on the Endangered Okaloosa Darter (Etheostoma okaloosae). J. Hered 2010, 101, 784–788. [Google Scholar]
- Kang, J.H.; Park, J.Y.; Jo, H.S. Rapid Development of Microsatellite Markers with 454 Pyrosequencing in a Vulnerable Fish, the Mottled Skate, Raja pulchra. Int. J. Mol. Sci 2012, 13, 7199–7211. [Google Scholar]
- Wang, J.; Yu, X.; Zhao, K.; Zhang, Y.; Tong, J.; Peng, Z. Microsatellite development for an endangered bream Megalobrama pellegrini (Teleostei, Cyprinidae) using 454 sequencing. Int. J. Mol. Sci 2012, 13, 3009–3021. [Google Scholar]
- Fushun, G.X.Z. Resources and Culturing Situation of Chinese Mitten Crab ( Eriocheir sinensis) and Species Character Conservation. J. Lake Sci 2001, 13, 267–271. [Google Scholar]
- Food and Agriculture Organization of the United Nations, FAO Yearbooks of Fishery Statistics Summary Tables, Aquaculture Production 2009; FAO: Rome, Italy, 2010; p. 44.
- Ozaki, A.; Sakamoto, T.; Khoo, S.; Nakamura, K.; Coimbra, M.R.M.; Akutsu, T.; Okamoto, N. Quantitative trait loci (QTLs) associated with resistance/susceptibility to infectious pancreatic necrosis virus (IPNV) in rainbow trout (Oncorhynchus mykiss). Mol. Genet. Genomics 2001, 265, 23–31. [Google Scholar]
- Dekkers, J.C.M.; Hospital, F. The use of molecular genetics in the improvement of agricultural populations. Nat. Rev. Genet 2002, 3, 22–32. [Google Scholar]
- Du, N.S.; Lai, W.; Xue, L.Z. The chromosomes of the Chinese mitten-handed crab, Eriocheir sinensis (Crustacea, Decapoda). Zool. Res 1986, 7, 293–296. [Google Scholar]
- Hanfling, B.; Weetman, D. Characterization of microsatellite loci for the Chinese mitten crab, Eriocheir sinensis. Mol. Ecol. Notes 2003, 3, 15–17. [Google Scholar]
- Zhu, Z.Y.; Shi, Y.H.; Le, G.W. Isolation and characterization of polymorphic microsatellites from Chinese mitten crab, Eriocheir sinensis. Mol. Ecol. Notes 2006, 6, 838–839. [Google Scholar]
- Mao, R.X.; Zhao, Y.Y.; Liu, F.J.; Jia, Z.Y.; Hou, N.; Chang, Y.M.; Lu, C.Y.; Liang, L.Q.; Sun, X.W. Development and characterization of new microsatellite loci from Chinese mitten crab (Eriocheir sinensis). Conserv. Genet 2009, 10, 1117–1119. [Google Scholar]
- Chang, Y.M.; Liang, L.Q.; Li, S.W.; Ma, H.T.; He, J.G.; Sun, X.W. A set of new microsatellite loci isolated from Chinese mitten crab, Eriocheir sinensis. Mol. Ecol. Notes 2006, 6, 1237–1239. [Google Scholar]
- Li, R.; Yu, C.; Li, Y.; Lam, T.-W.; Yiu, S.-M.; Kristiansen, K.; Wang, J. SOAP2: An improved ultrafast tool for short read alignment. Bioinformatics (Oxford) 2009, 25, 1966–1967. [Google Scholar]
- Cheng, Q.; Yuan, C.; Wang, J.; Xu, J.; Lee, T.-H.; Wang, C. Development of 20 microsatellite loci in the Japanese mitten crab Eriocheir japonica and cross-amplification in the Chinese mitten crab Eriocheir sinensis. Conserv. Genet. Resour 2010, 2, 47–50. [Google Scholar]
- Bachtrog, D.; Agis, M.; Imhof, M.; Schloetterer, C. Microsatellite variability differs between dinucleotide repeat motifs: Evidence from Drosophila melanogaster. Mol. Biol. Evol 2000, 17, 1277–1285. [Google Scholar]
- Lecher, P.; Defaye, D.; Noel, P. Chromosomes and nuclear DNA of Crustacea. Invertebr. Reprod. Dev 1995, 27, 85–114. [Google Scholar]
- Kong, J.; Gao, H.A. Analysis of tandem repeats in the genome of Chinese shrimp Fenneropenaeus chinensis. Chin. Sci. Bull 2005, 50, 1462–1469. [Google Scholar]
- Schug, M.D.; Wetterstrand, K.A.; Gaudette, M.S.; Lim, R.H.; Hutter, C.M.; Aquadro, C.F. The distribution and frequency of microsatellite loci in Drosophila melanogaster. Mol. Ecol 1998, 7, 57–70. [Google Scholar]
- Edwards, Y.J.K.; Elgar, G.; Clark, M.S.; Bishop, M.J. The identification and characterization of microsatellites in the compact genome of the Japanese pufferfish, Fugu rubripes: Perspectives in functional and comparative genomic analyses. J. Mol. Biol 1998, 278, 843–854. [Google Scholar]
- Lander, E.S.; Linton, L.M.; Birren, B.; Nusbaum, C.; Zody, M.C.; Baldwin, J.; Devon, K.; Dewar, K.; Doyle, M.; FitzHugh, W.; et al. Initial sequencing and analysis of the human genome. Nature (Lond.) 2001, 409, 860–921. [Google Scholar]
- Wang, Z.; Weber, J.L.; Zhong, G.; Tanksley, S.D. Survey of plant short tandem DNA repeats. Theor. Appl. Genet 1994, 88, 1–6. [Google Scholar]
- Van Belkum, A.; Scherer, S.; van Alphen, L.; Verbrugh, H. Short-sequence DNA repeats in prokaryotic genomes. Microbiol. Mol. Biol. Rev 1998, 62, 275–293. [Google Scholar]
- Ross, C.L.; Dyer, K.A.; Erez, T.; Miller, S.J.; Jaenike, J.; Markow, T.A. Rapid divergence of microsatellite abundance among species of Drosophila. Mol. Biol. Evol 2003, 20, 1143–1157. [Google Scholar]
- Lagercrantz, U.; Ellegren, H.; Andersson, L. The abundance of various polymorphic microsatellite motifs differs between plants and vertebrates. Nucleic Acids Res 1993, 21, 1111–1115. [Google Scholar]
- Toth, G.; Gaspari, Z.; Jurka, J. Microsatellites in different eukaryotic genomes: Survey and analysis. Genome Res 2000, 10, 967–981. [Google Scholar]
- Chang, Y.; Liang, L.; Ma, H.; He, J.; Sun, X. Microsatellite analysis of genetic diversity and population structure of Chinese mitten crab (Eriocheir sinensis). J. Genet. Genomics 2008, 35, 171–176. [Google Scholar]
- Herborg, L.-M.; Weetman, D.; Van Oosterhout, C.; Hanfling, B. Genetic population structure and contemporary dispersal patterns of a recent European invader, the Chinese mitten crab, Eriocheir sinensis. Mol. Ecol 2007, 16, 231–242. [Google Scholar]
- Sambrook, J.; Russell, D.W. Molecular Cloning: A Laboratory Manual; CSHL Press: Cold Spring Harbor, NY, USA, 2001; Volume 2. [Google Scholar]
- Pevzner, P.A.; Tang, H.X.; Waterman, M.S. An Eulerian path approach to DNA fragment assembly. Proc. Natl. Acad. Sci. USA 2001, 98, 9748–9753. [Google Scholar]
- Rozen, S.; Skaletsky, H. Primer3 on the WWW for general users and for biologist programmers. Methods Mol. Biol 2000, 132, 365–386. [Google Scholar]
- Jurka, J.; Pethiyagoda, C. Simple receptive DNA sequences from primates: Compilation and analysis. J. Mol. Evol 1995, 40, 120–126. [Google Scholar]
- Bassam, B.J.; Caetanoanolles, G.; Gresshoff, P.M. Fast and sensitive silver staining of DNA in polyacrylamide gels. Anal. Biochem 1991, 196, 80–83. [Google Scholar]
- Excoffier, L.; Lischer, H.E.L. Arlequin suite ver 3.5: A new series of programs to perform population genetics analyses under Linux and Windows. Mol. Ecol. Resour 2010, 10, 564–567. [Google Scholar]
- Rousset, F. GENEPOP’007: A complete re-implementation of the GENEPOP software for Windows and Linux. Mol. Ecol. Resour 2008, 8, 103–106. [Google Scholar]
- Van Oosterhout, C.; Hutchinson, W.F.; Wills, D.P.M.; Shipley, P. MICRO-CHECKER: Software for identifying and correcting genotyping errors in microsatellite data. Mol. Ecol. Notes 2004, 4, 535–538. [Google Scholar]


| Motif length | Repeat numbers | Total number | % | |||||||||||
|---|---|---|---|---|---|---|---|---|---|---|---|---|---|---|
| 4–5 | 6–7 | 8–9 | 10–11 | 12–13 | 14–15 | 16–17 | 18–19 | 20–21 | 22–23 | 24–25 | >25 | |||
| Mono- | 184 | 100 | 149 | 433 | 0.31 | |||||||||
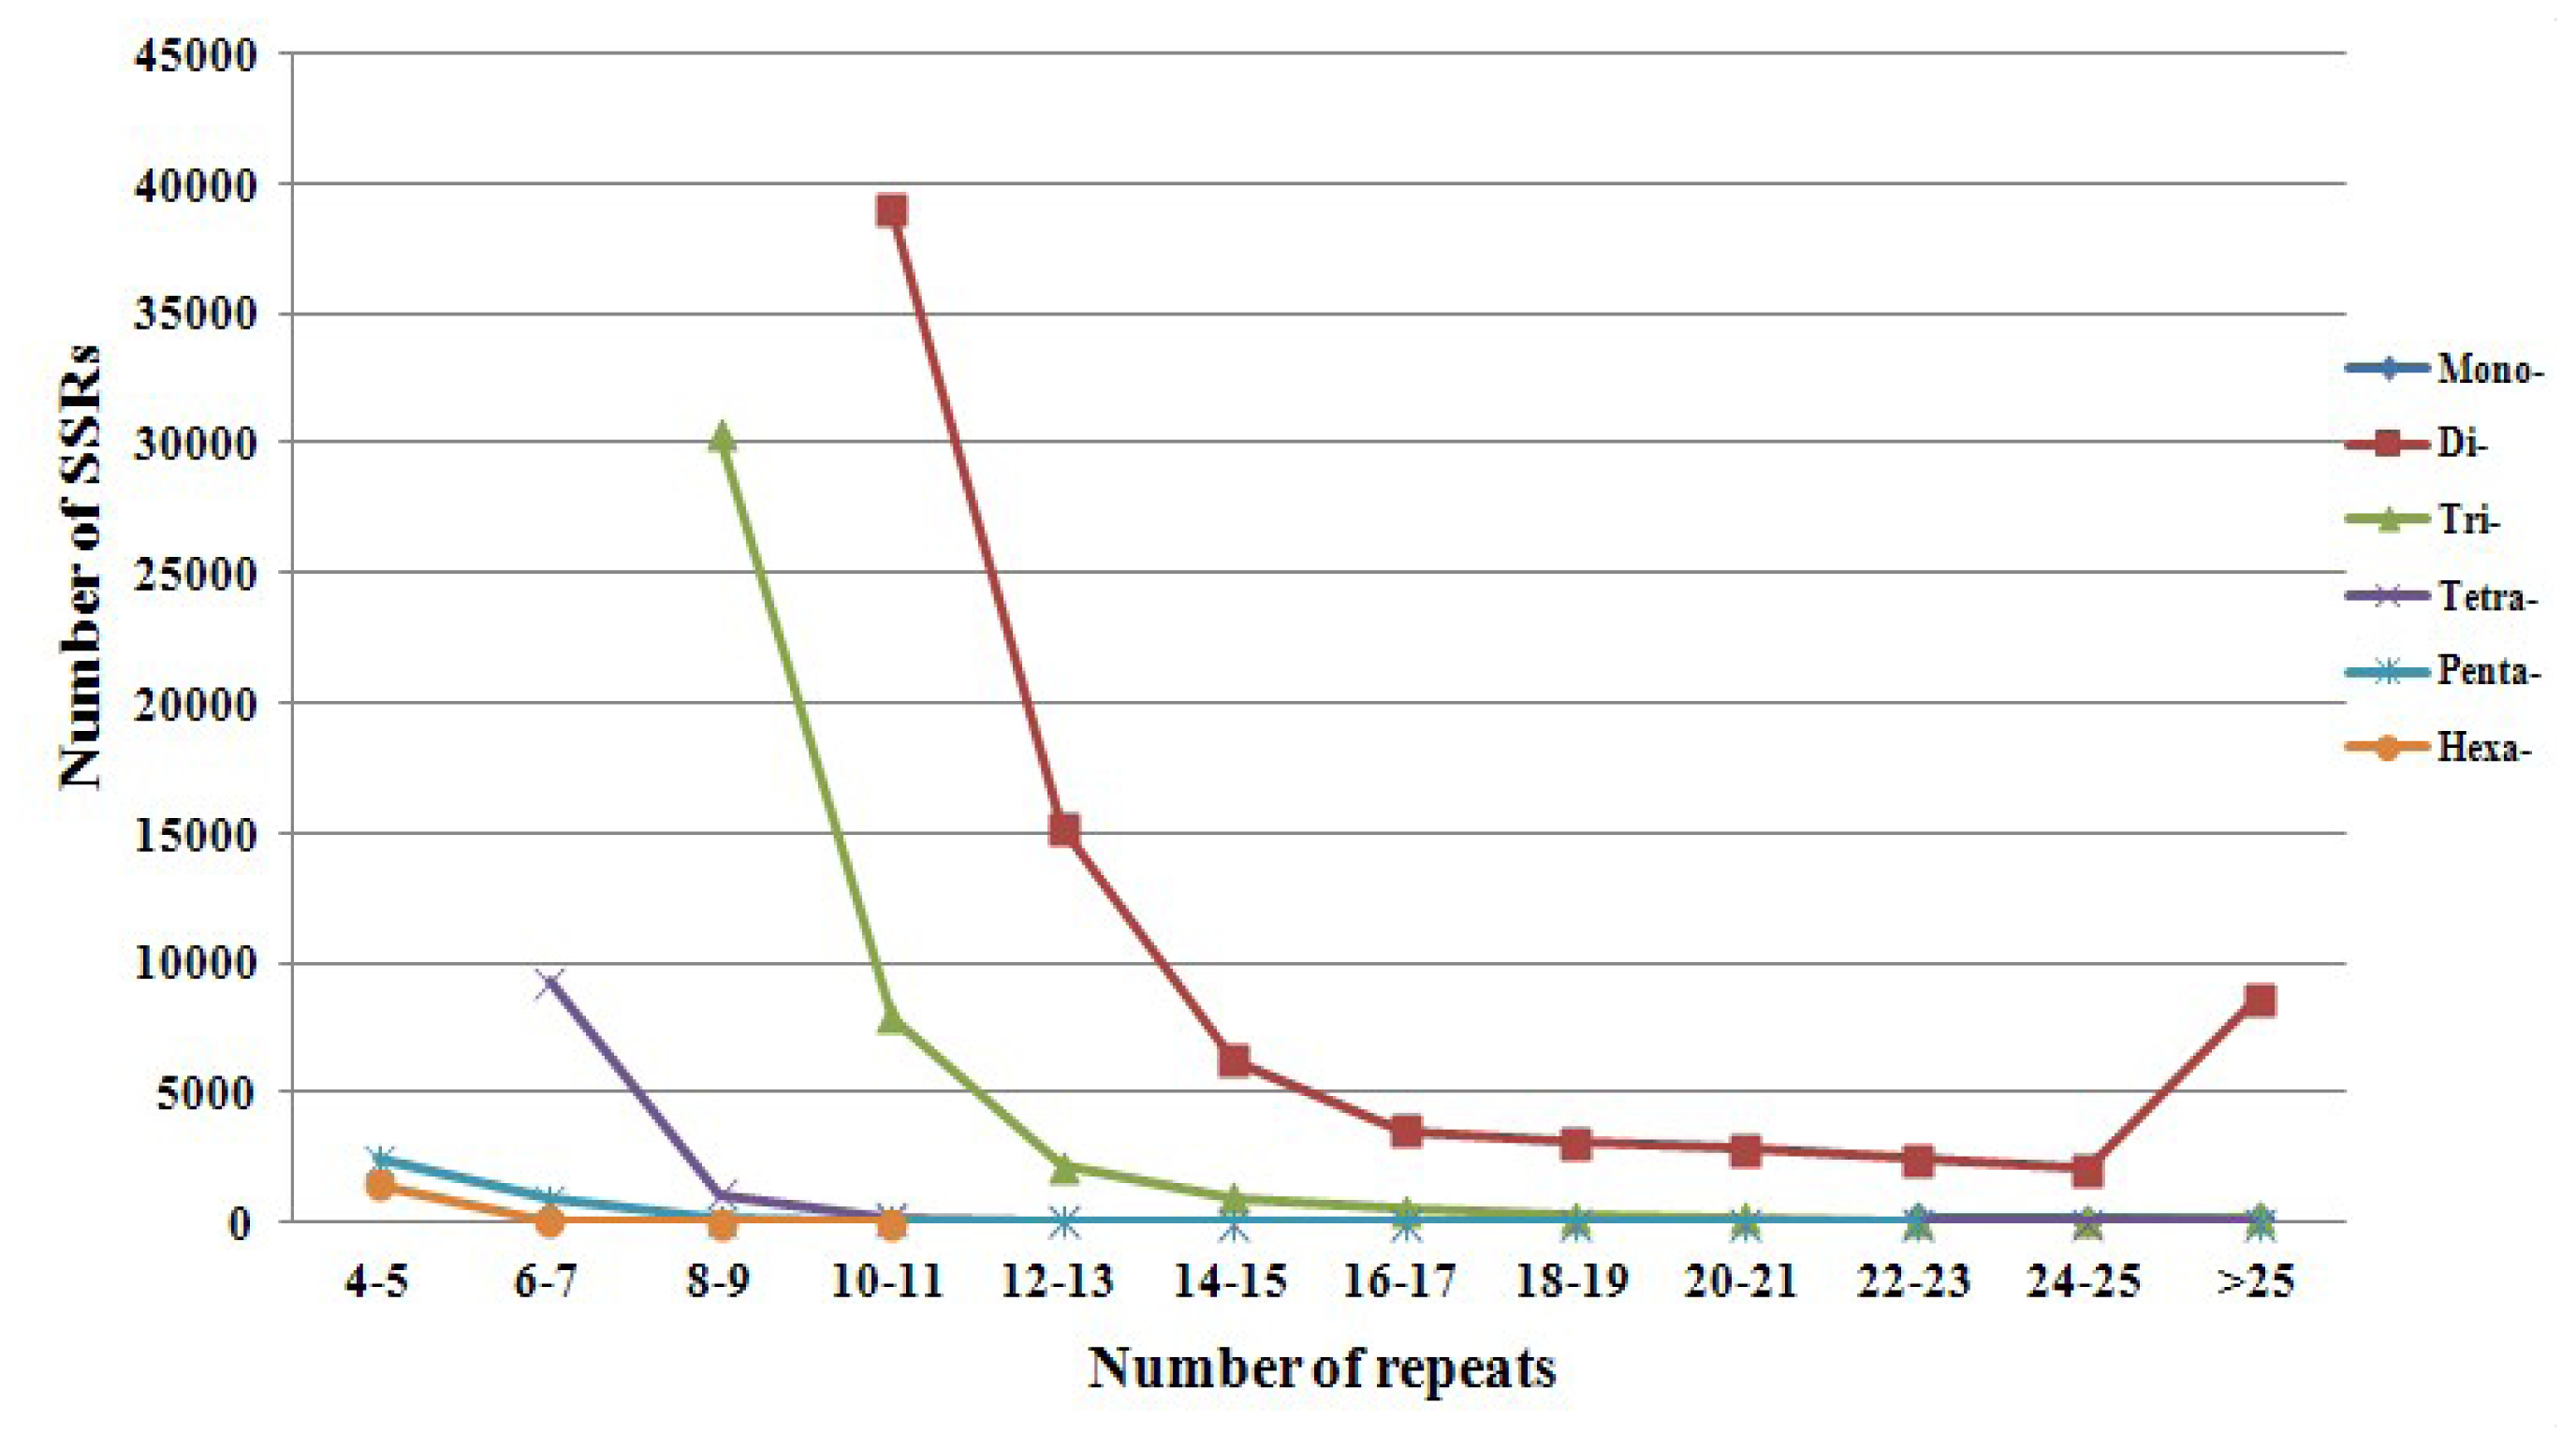
| Di- | 38990 | 15208 | 6239 | 3541 | 3052 | 2830 | 2441 | 2070 | 8608 | 82979 | 58.54 | |||
| Tri- | 30358 | 7936 | 2189 | 969 | 497 | 264 | 151 | 73 | 46 | 192 | 42675 | 30.11 | ||
| Tetra- | 9278 | 1093 | 208 | 61 | 8 | 2 | 6 | 1 | 7 | 3 | 1 | 10668 | 7.53 | |
| Penta- | 2403 | 909 | 125 | 33 | 16 | 3 | 2 | 2 | 1 | 1 | 1 | 3496 | 2.47 | |
| Hexa- | 1460 | 23 | 2 | 1 | 1486 | .05 | ||||||||
| Total | 3863 | 10210 | 31578 | 47168 | 17474 | 7219 | 4042 | 3324 | 2983 | 2706 | 2219 | 8951 | 141737 | 100 |
| % | 2.73 | 7.20 | 22.28 | 33.28 | 12.33 | 5.09 | 2.85 | 2.35 | 2.10 | 1.91 | 1.57 | 6.32 | ||
| Locus | Primer sequence (5′–3′) | Repeat motif | Ta a | Number of alleles | Allele size range (bp) b | HO | HE | Pc | GeneBank Accession No. |
|---|---|---|---|---|---|---|---|---|---|
| Eri1 | F:GATAGACCGTAAATGAGACGGCTG R:GGACGGAGAAAACTAGAGACCACA | (GGA)9 | 63 | 8 | 151–174 (157) | 0.643 | 0.759 | 0.130 | KC143114 |
| Eri2 | F:GGATTTACTTAAGTTGGGGCTCGT R:CGACGCAGTTTTGTCTAGAGACCT | (GAG)8 | 63 | 10 | 119–161 (146) | 0.750 | 0.918 | 0.057 | KC143100 |
| Eri3d | F:CAGCGAAAAACAGGAAGCATTTAG R:GGAAAGGGAAAGTGAAGGATGAAT | (AC)11 | 63 | 12 | 140–212 (166) | 0.793 | 0.950 | 0.000 | KC143117 |
| Eri4 | F:TTCTTTGAGCGACATGCAAAAGT R:AGACAGACAGACAAAAACGCTCCT | (TG)29 | 62 | 14 | 132–192 (150) | 0.950 | 0.971 | 0.100 | KC143110 |
| Eri5 | F:TAGGGGGTTTTAGGTGTGGTGATA R:ATTTATGTGGAGGGAATGGGAGAT | (TGA)9 | 62 | 8 | 125–167 (143) | 0.658 | 0.855 | 0.361 | KC143115 |
| Eri6d | F:CAACCACTACAACTATCAAAACCACC R:GACTTTACGACCACGAAATGGAG | (CA)26 | 62 | 9 | 91–181 (109) | 0.792 | 0.897 | 0.151 | KC143108 |
| Eri7 | F:TAACCTAAACAGCAACAGCAGCAA R:AAAGGGTTAGAAAGGAAGGAGGGT | (AGT)8 | 63 | 4 | 128–146 (134) | 0.567 | 0.693 | 0.251 | KC143118 |
| Eri8d | F:TGTTGAGTGTGATGTTTGTGATGC R:TAATAGCGGCCAAACTTTGTTGAT | (GT)12 | 65 | 11 | 160–226 (196) | 0.958 | 0.935 | 0.001 | KC143116 |
| Eri9 | F:TGCATATTGTTGTTTTTACTGACGTGT R:CATCATCACCATCATCATCACAAA | (AC)18 | 63 | 12 | 140–188 (154) | 0.884 | 0.945 | 0.641 | KC143109 |
| Eri10 | F:TACCTTTTTCAGGGTGAGTGAAGG R:AAGGACAGGAGGGAAAATGAGAGT | (GT)23 | 63 | 7 | 138–208 (160) | 0.865 | 0.917 | 0.317 | KC143102 |
| Eri11 | F:ATGTTTATTTTCACAACGCGAAGC R:TGTCTTCCTTGTCTCTGTCTGTGTG | (ACAT)6 | 63 | 4 | 157–177 (157) | 0.583 | 0.732 | 0.002 | KC143103 |
| Eri12 | F:ACCCATCTCAAGTCCAGACTCATC R:AGAGGATGCAAGGGAAATAAGGAG | (CCT)8 | 63 | 7 | 152–170 (161) | 0.700 | 0.784 | 0.113 | KC143113 |
| Eri13 | F:AAGGAAGGCAGTTAGGAGGGTATG R:TTATTATTGTGGCGACGAAGGGT | (AC)11 | 65 | 8 | 189–259 (221) | 0.668 | 0.950 | 0.147 | KC143106 |
| Eri14d | F:TGTTGTGTTGTCATGTCTTGTCTTTT R:TCAGAAACACCGCACTCGATATAA | (TCTCA)5 | 62 | 2 | 142–147 (142) | 0.420 | 0.510 | 0.000 | KC143119 |
| Eri15 | F:TCACCCCTTACTGAGCATAACACA R:CCTTATCCTGCGACTCGTAATGTT | (CA)12 | 63 | 5 | 93–109 (105) | 0.736 | 0.773 | 0.250 | KC143105 |
| Eri16d | F:TCCTCCCTATGCTCTTTGTAGGTG R:AAGGCCCAGGAGTATGGTGAAC | (AC)11 | 63 | 8 | 150–192 (156) | 0.699 | 0.786 | 0.115 | KC143111 |
| Eri17 | F:CAGCATGTCCAGTCTCTTCTGTGT R:GCTGAGAGAATATGTATGATGACATGG | (GT)15 | 65 | 6 | 141–159 (145) | 0.772 | 0.864 | 0.054 | KC143107 |
| Eri18 | F: TGGCATTGATTGATGTGAGTAGTG R:CTAACCTTCTCGACACCTTTGCAT | (GGT)10 | 62 | 5 | 85–106 (94) | 0.326 | 0.551 | 0.269 | KC143104 |
| Eri19 | F:CAGACCCTCCCGATGATACACTAC R:CTATCCACTCAGCTACCGCCTCT | (ATCT)8 | 63 | 4 | 133–155 (143) | 0.563 | 0.668 | 0.531 | KC143112 |
| Eri20 | F: GAGATGGAGGTAGATGATCGAGGA R:CAAGGCACTCAATCTCAACCTTTT | (GAAG)7 | 63 | 4 | 120–144 (132) | 0.447 | 0.532 | 0.516 | KC143101 |
© 2012 by the authors; licensee Molecular Diversity Preservation International, Basel, Switzerland. This article is an open-access article distributed under the terms and conditions of the Creative Commons Attribution license (http://creativecommons.org/licenses/by/3.0/).
Share and Cite
Xiong, L.-W.; Wang, Q.; Qiu, G.-F. Large-Scale Isolation of Microsatellites from Chinese Mitten Crab Eriocheir sinensis via a Solexa Genomic Survey. Int. J. Mol. Sci. 2012, 13, 16333-16345. https://0-doi-org.brum.beds.ac.uk/10.3390/ijms131216333
Xiong L-W, Wang Q, Qiu G-F. Large-Scale Isolation of Microsatellites from Chinese Mitten Crab Eriocheir sinensis via a Solexa Genomic Survey. International Journal of Molecular Sciences. 2012; 13(12):16333-16345. https://0-doi-org.brum.beds.ac.uk/10.3390/ijms131216333
Chicago/Turabian StyleXiong, Liang-Wei, Qun Wang, and Gao-Feng Qiu. 2012. "Large-Scale Isolation of Microsatellites from Chinese Mitten Crab Eriocheir sinensis via a Solexa Genomic Survey" International Journal of Molecular Sciences 13, no. 12: 16333-16345. https://0-doi-org.brum.beds.ac.uk/10.3390/ijms131216333