Optimization of Synthesis, Characterization and Cytotoxic Activity of Seleno-Capparis spionosa L. Polysaccharide

Abstract
:
1. Introduction
2. Results and Discussion
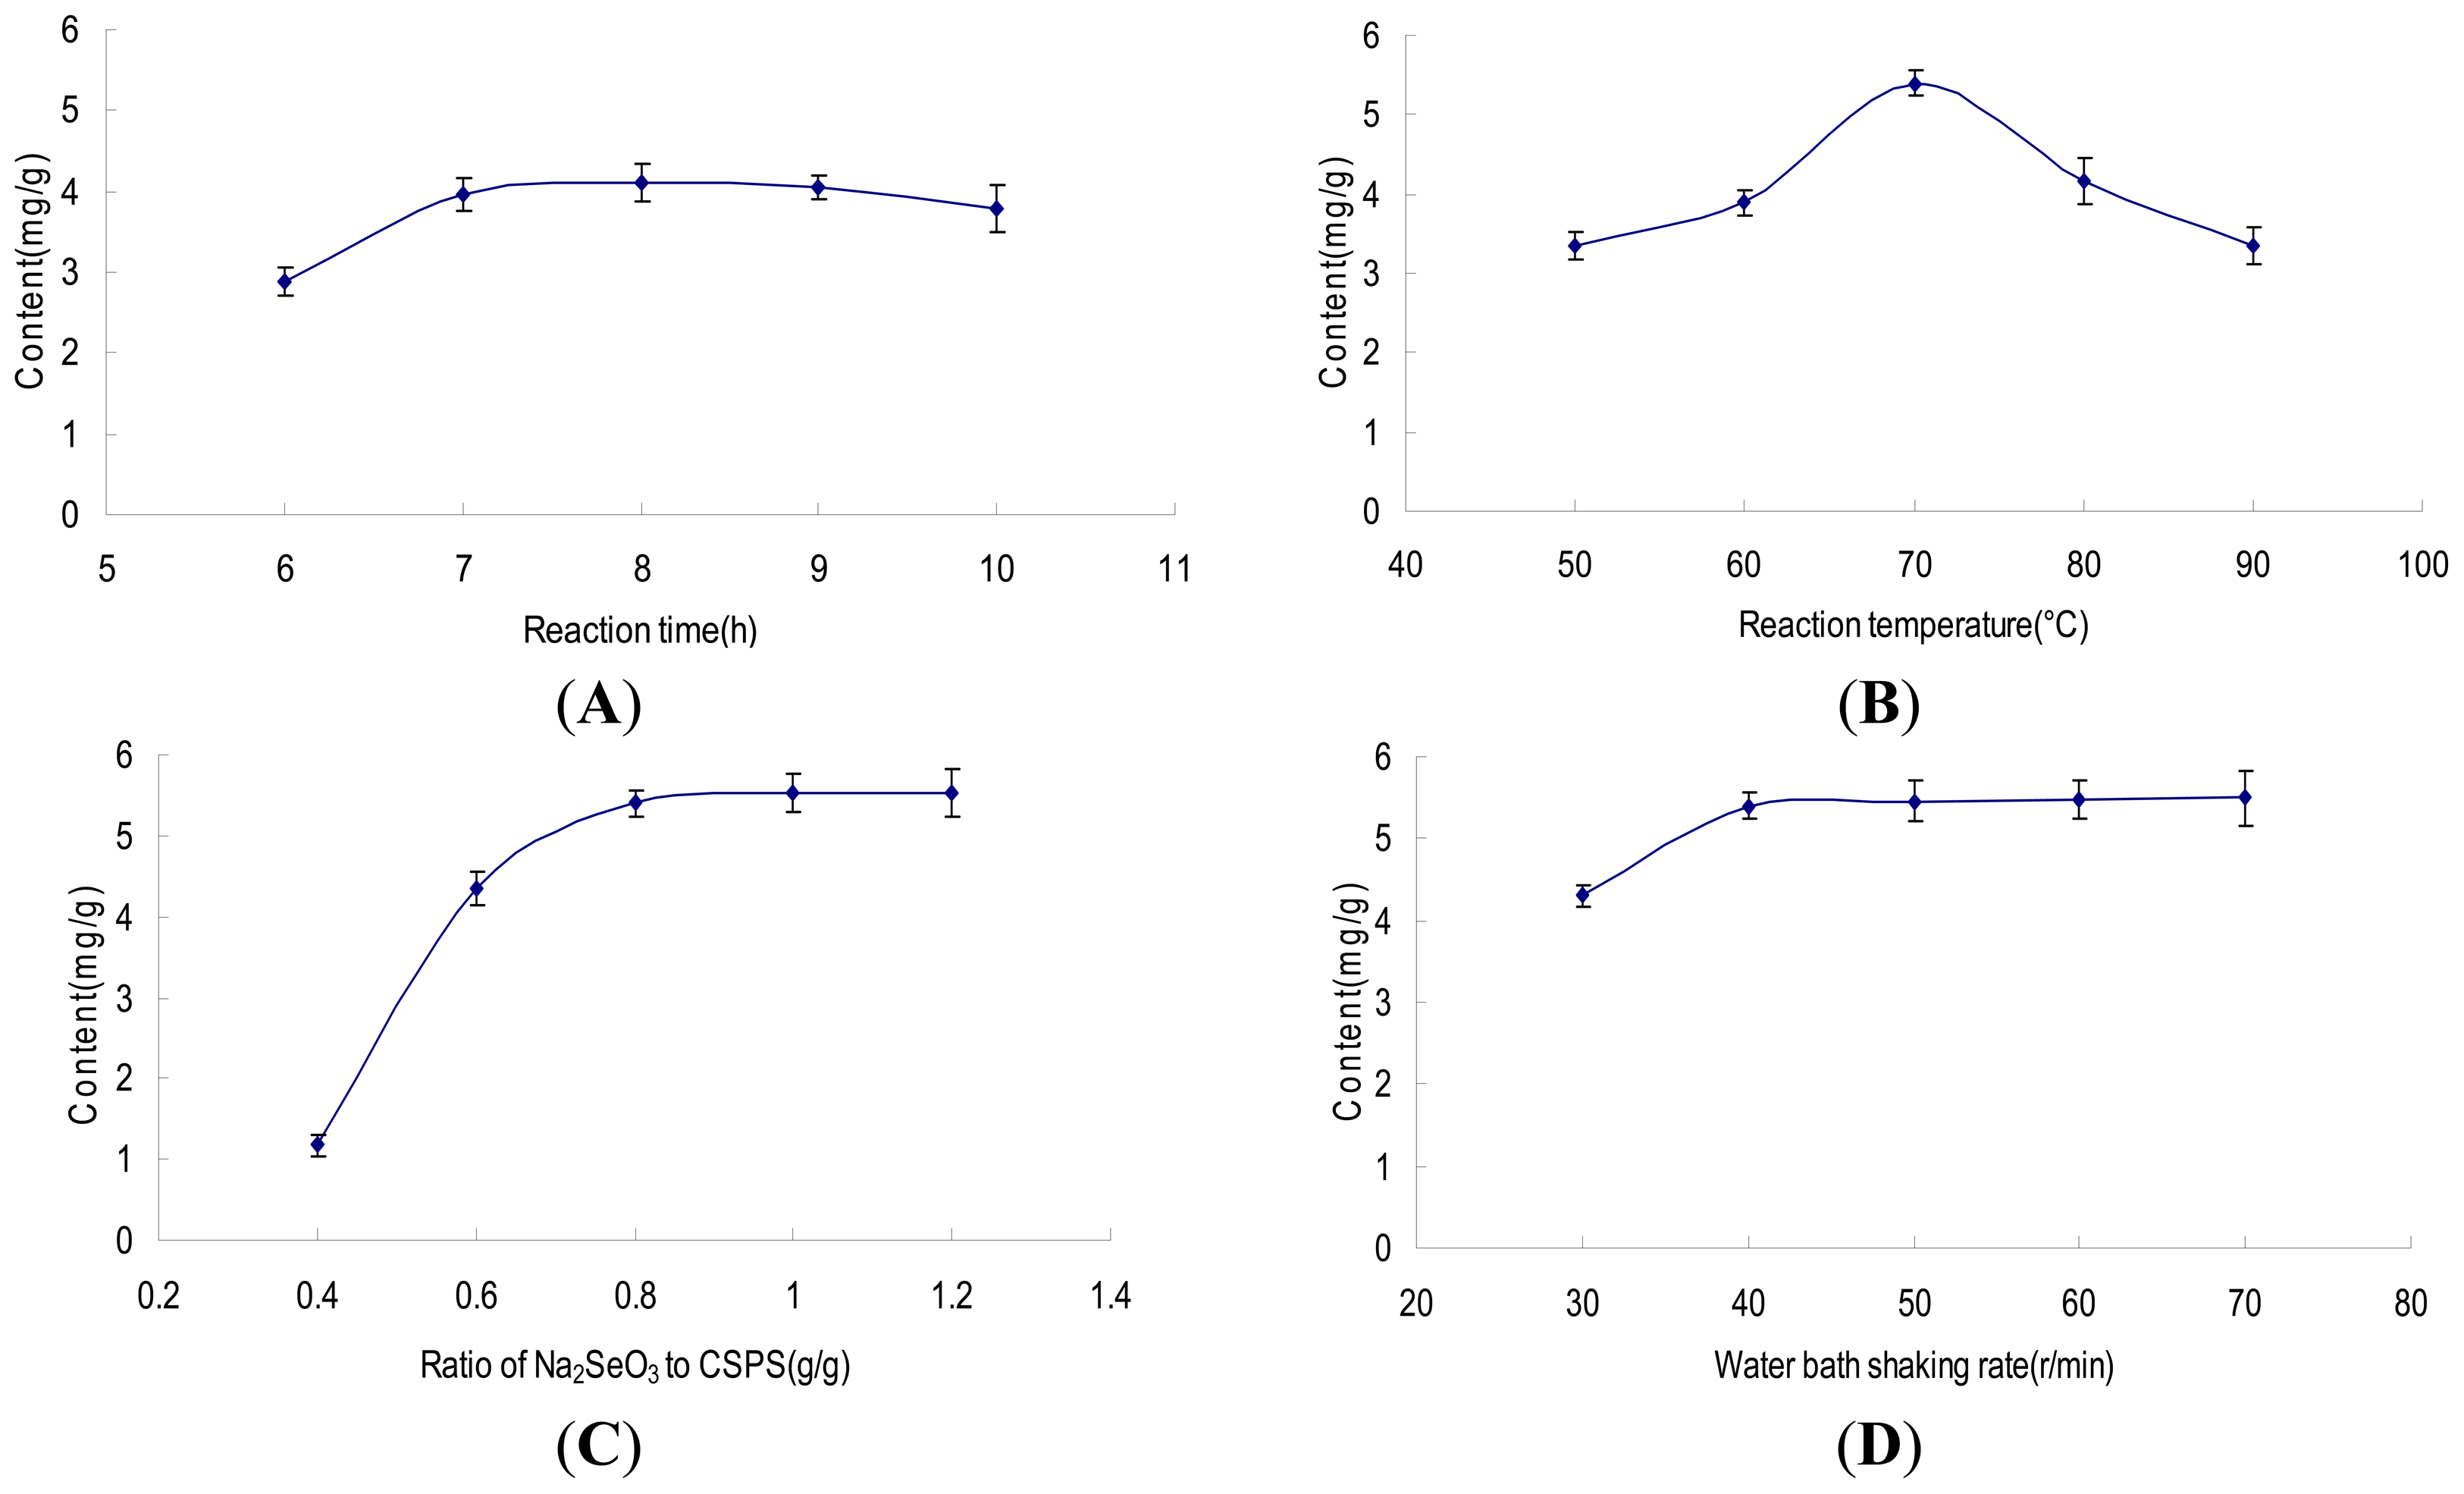
2.1. Single Factor Assays
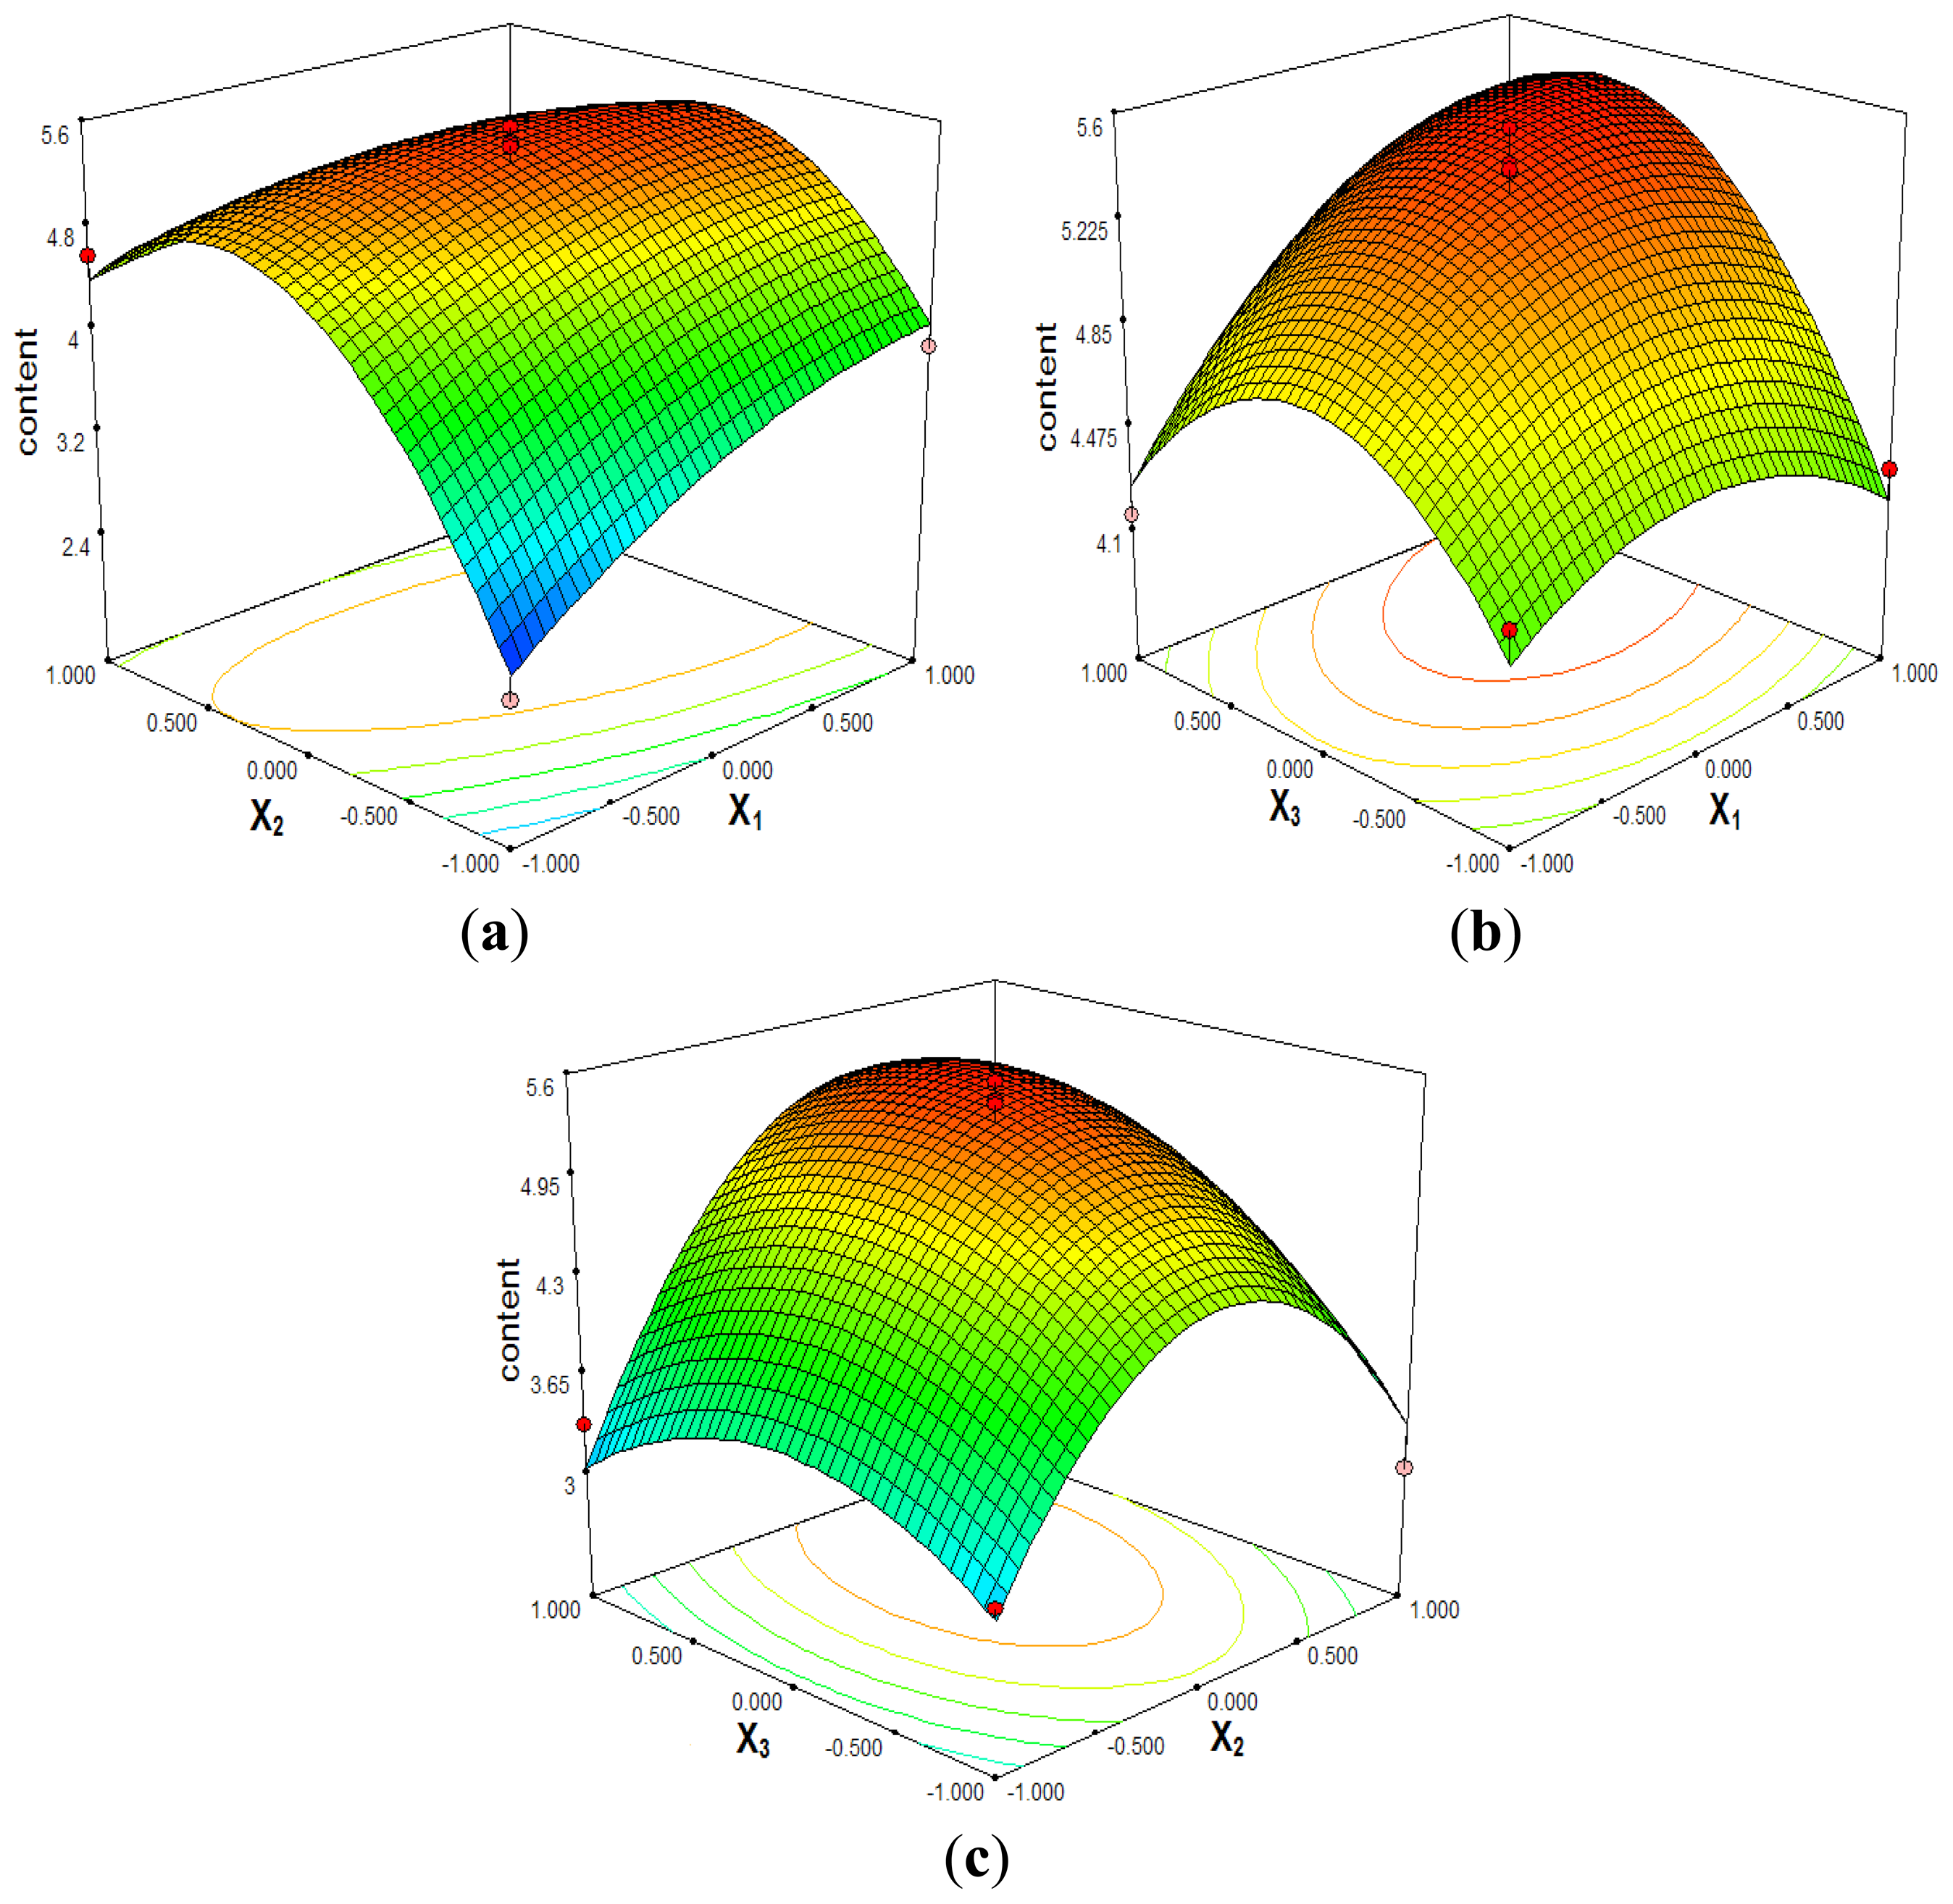
2.2. Optimization by RSM
2.2.1. Results of Selenylation of Optimization of the Procedure
2.2.2. Model Fitting and Statistical Significance Analysis
2.2.3. Optimization of Selenylation Conditions
2.2.4. Verification of Predictive Model
2.3. Characterization of Se-CSPS
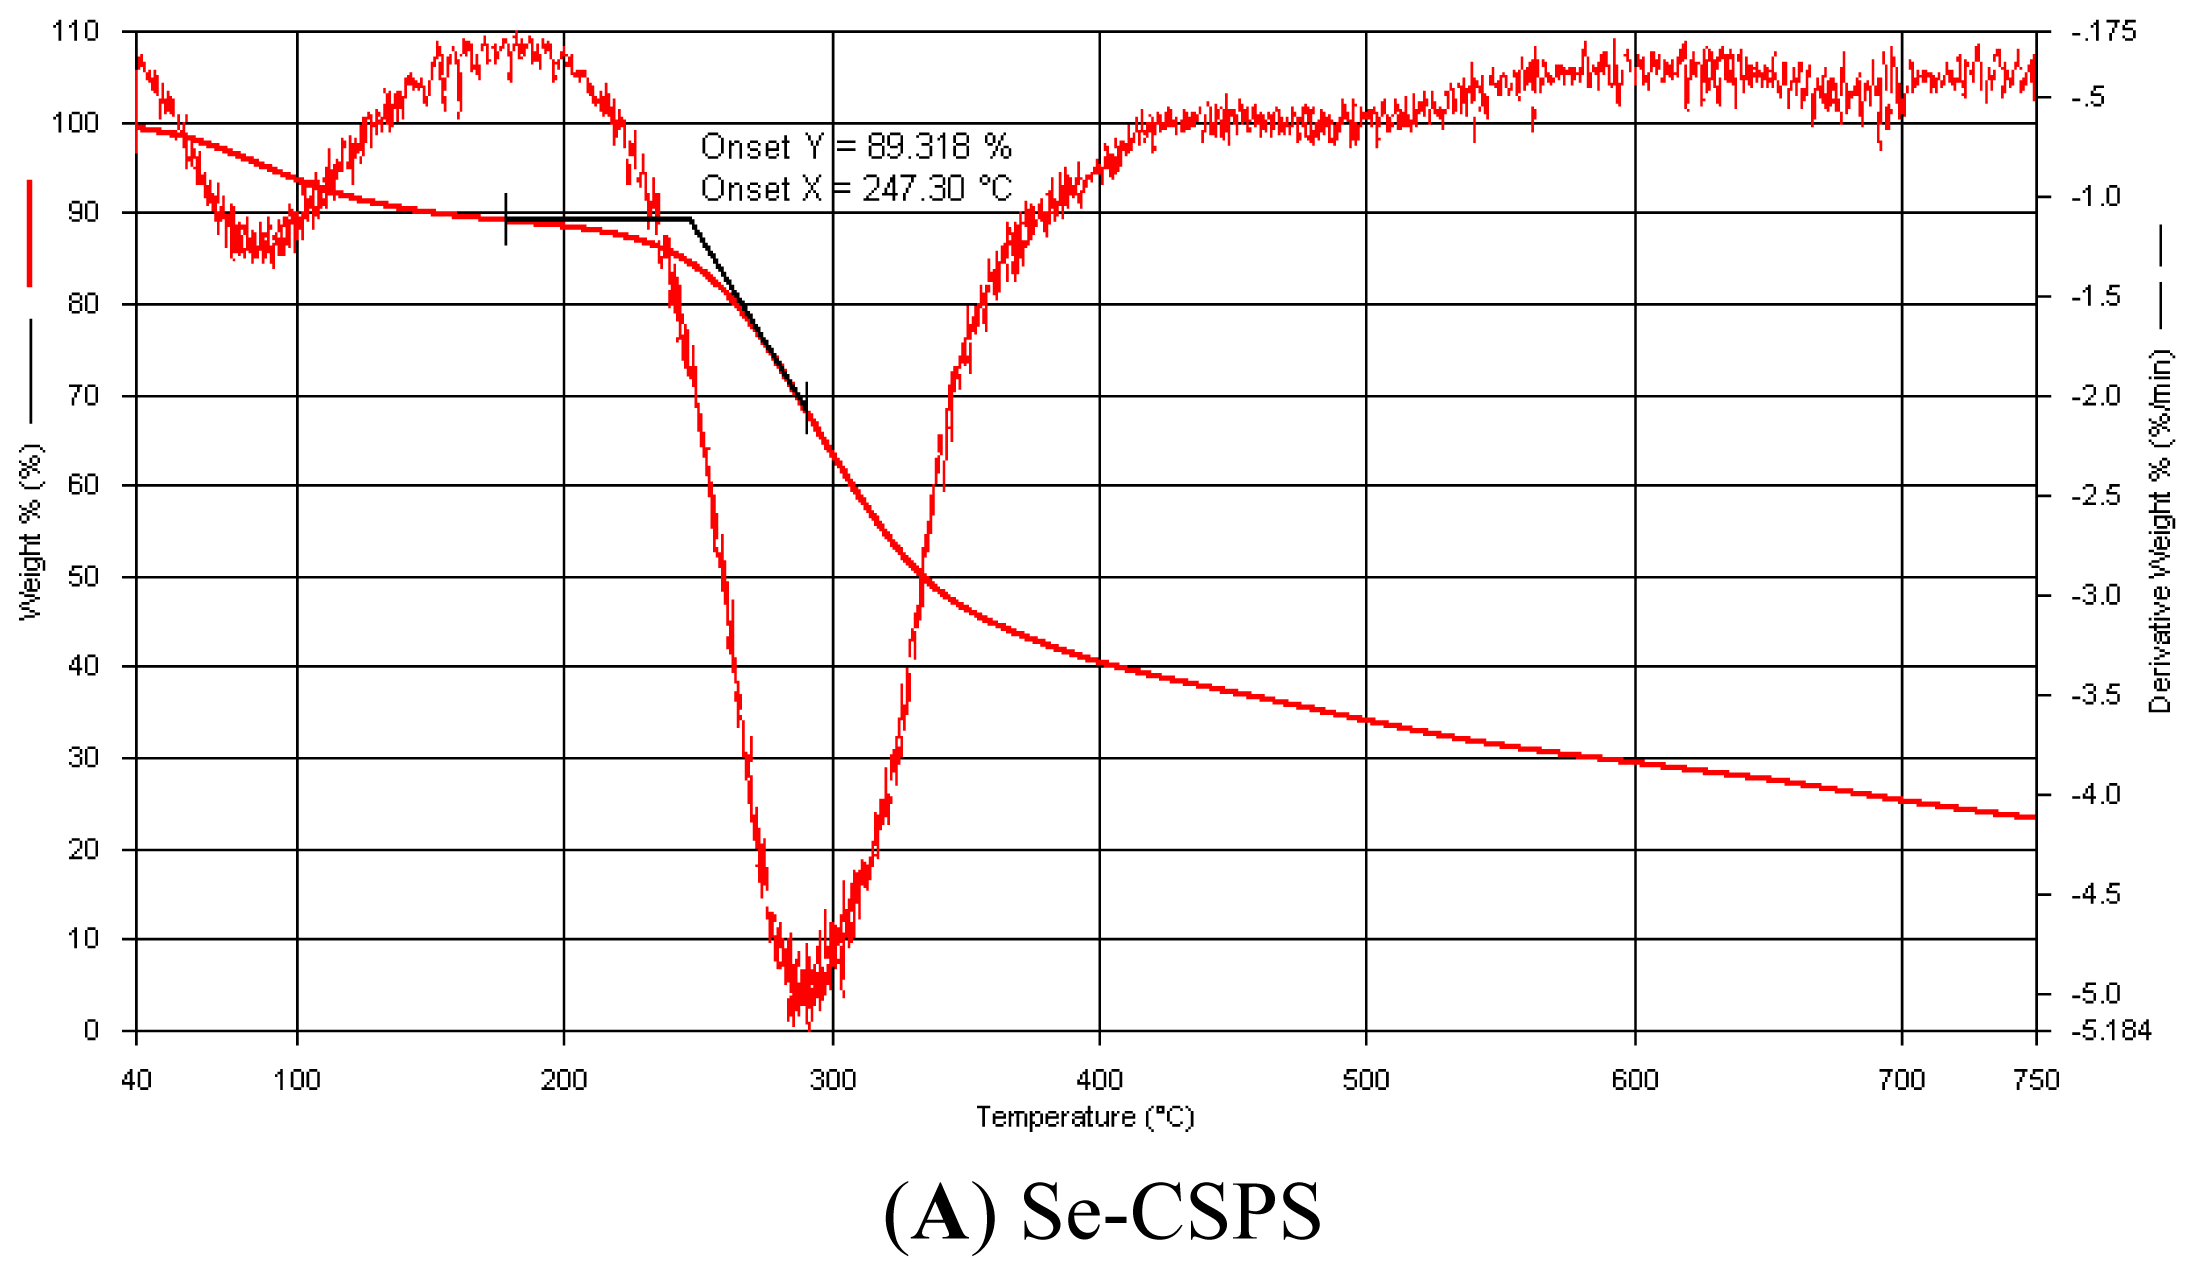
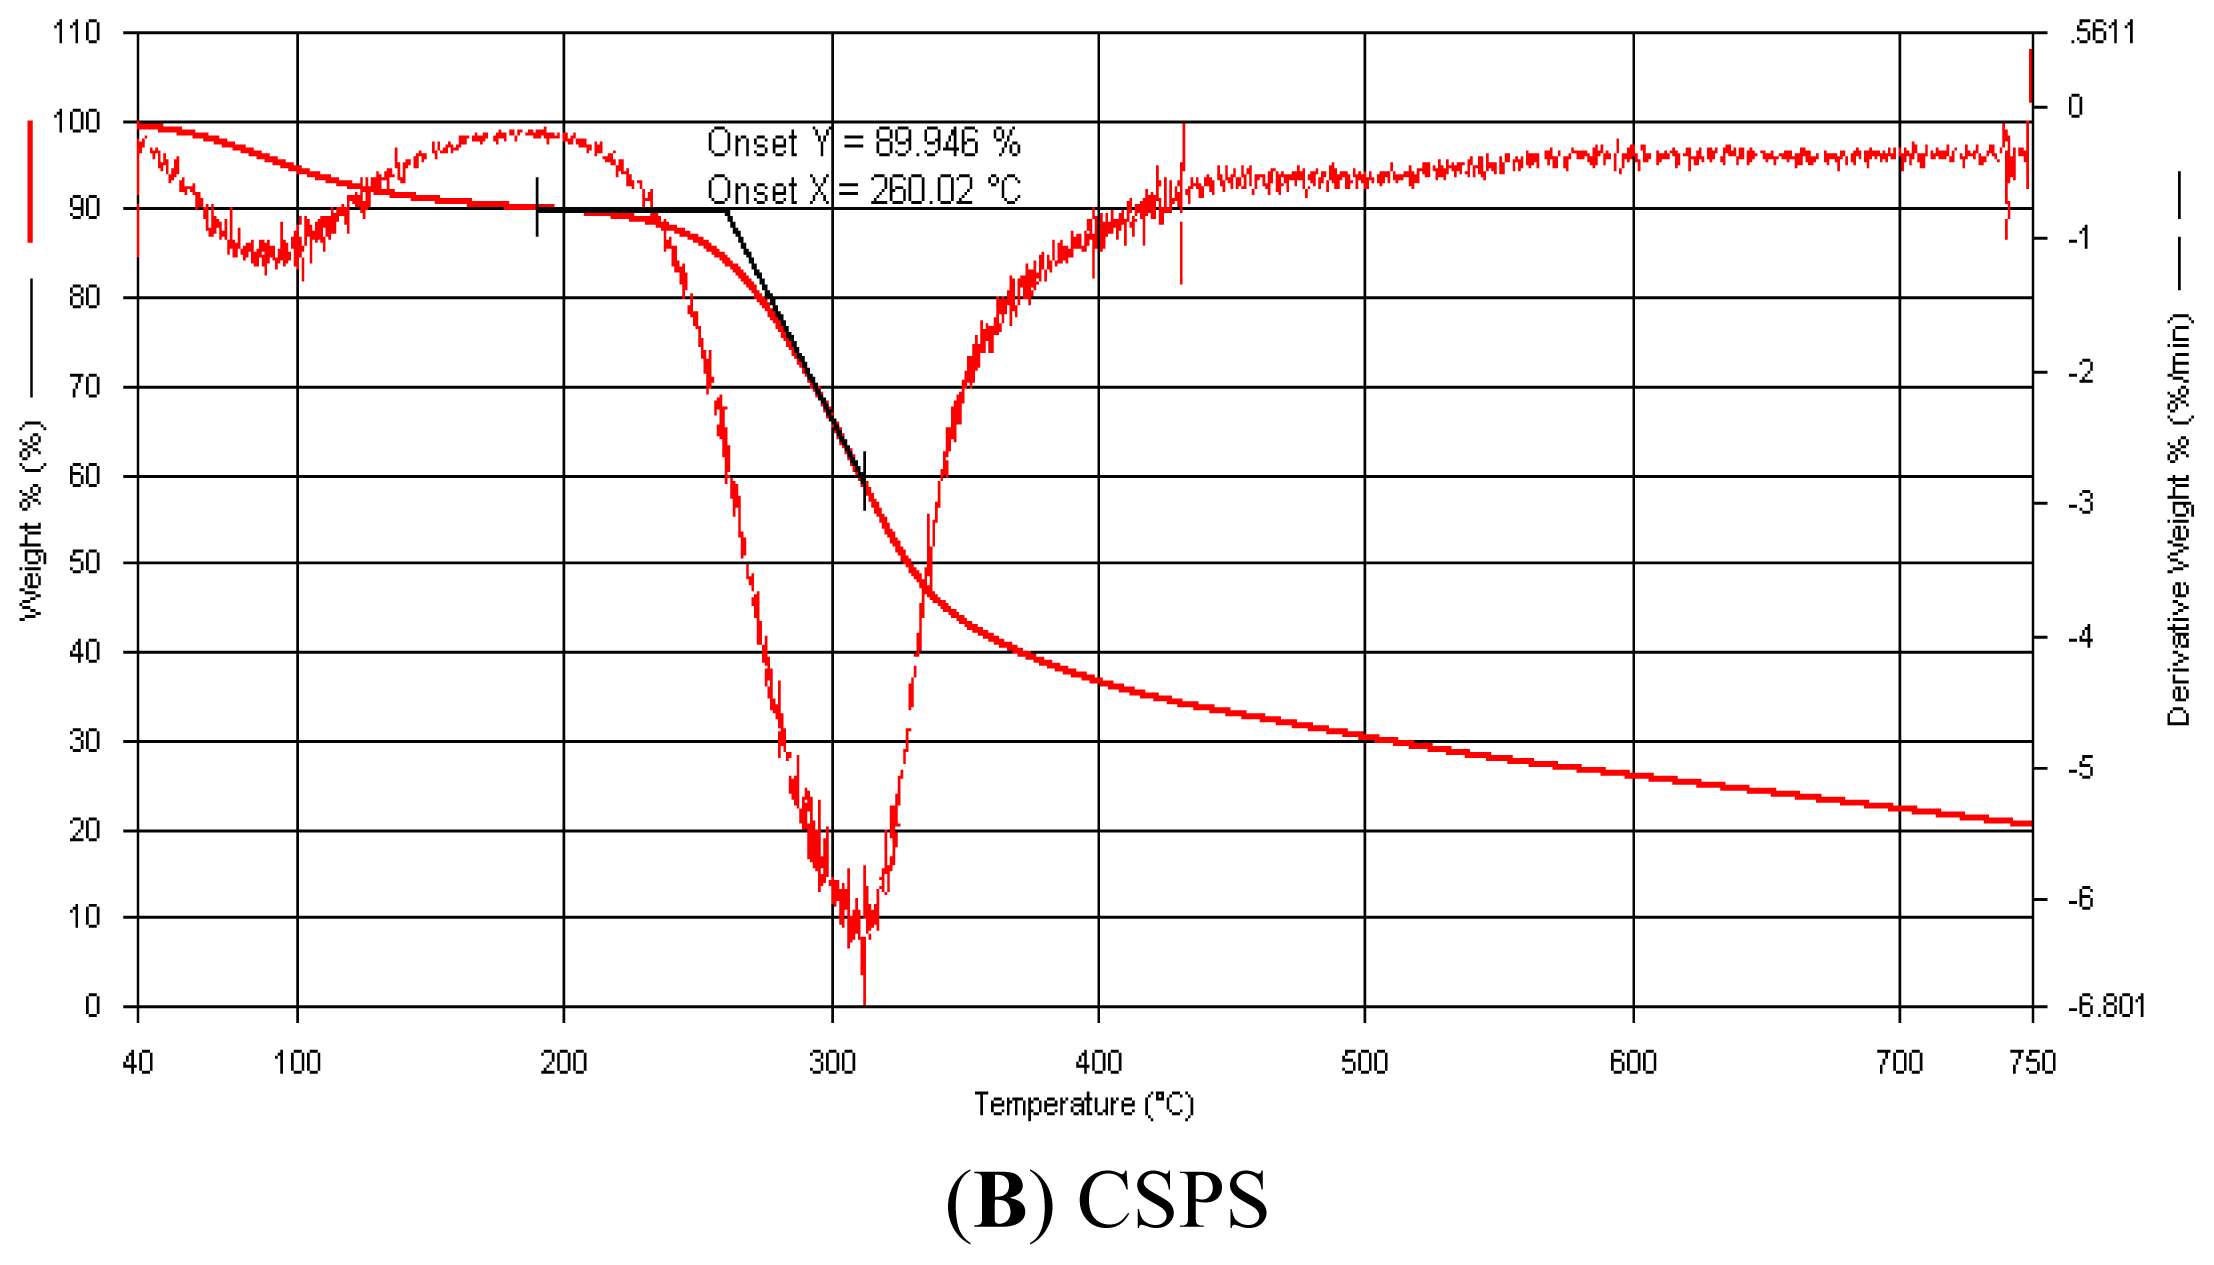
2.3.1. Thermal Weight Loss Analysis
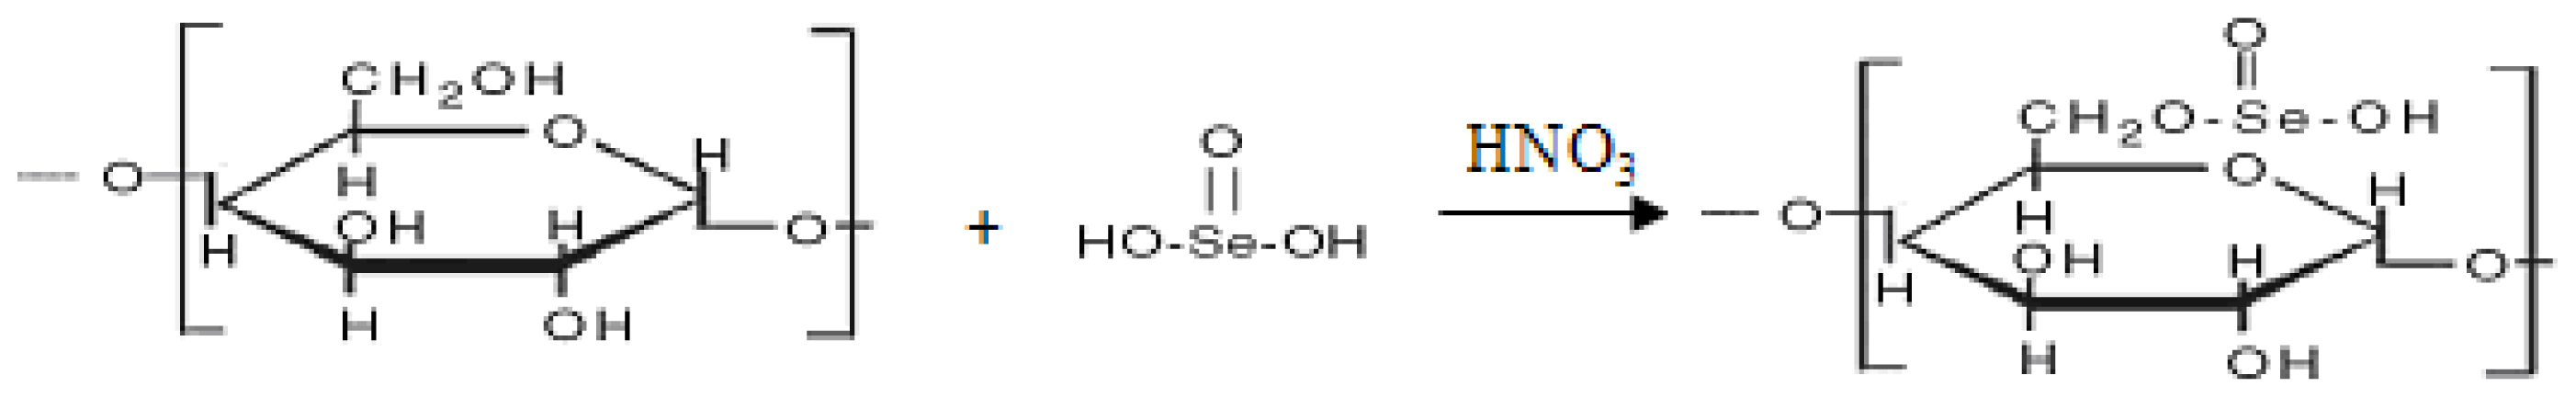
2.3.2. Particle Size Distribution
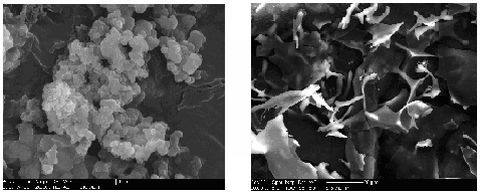
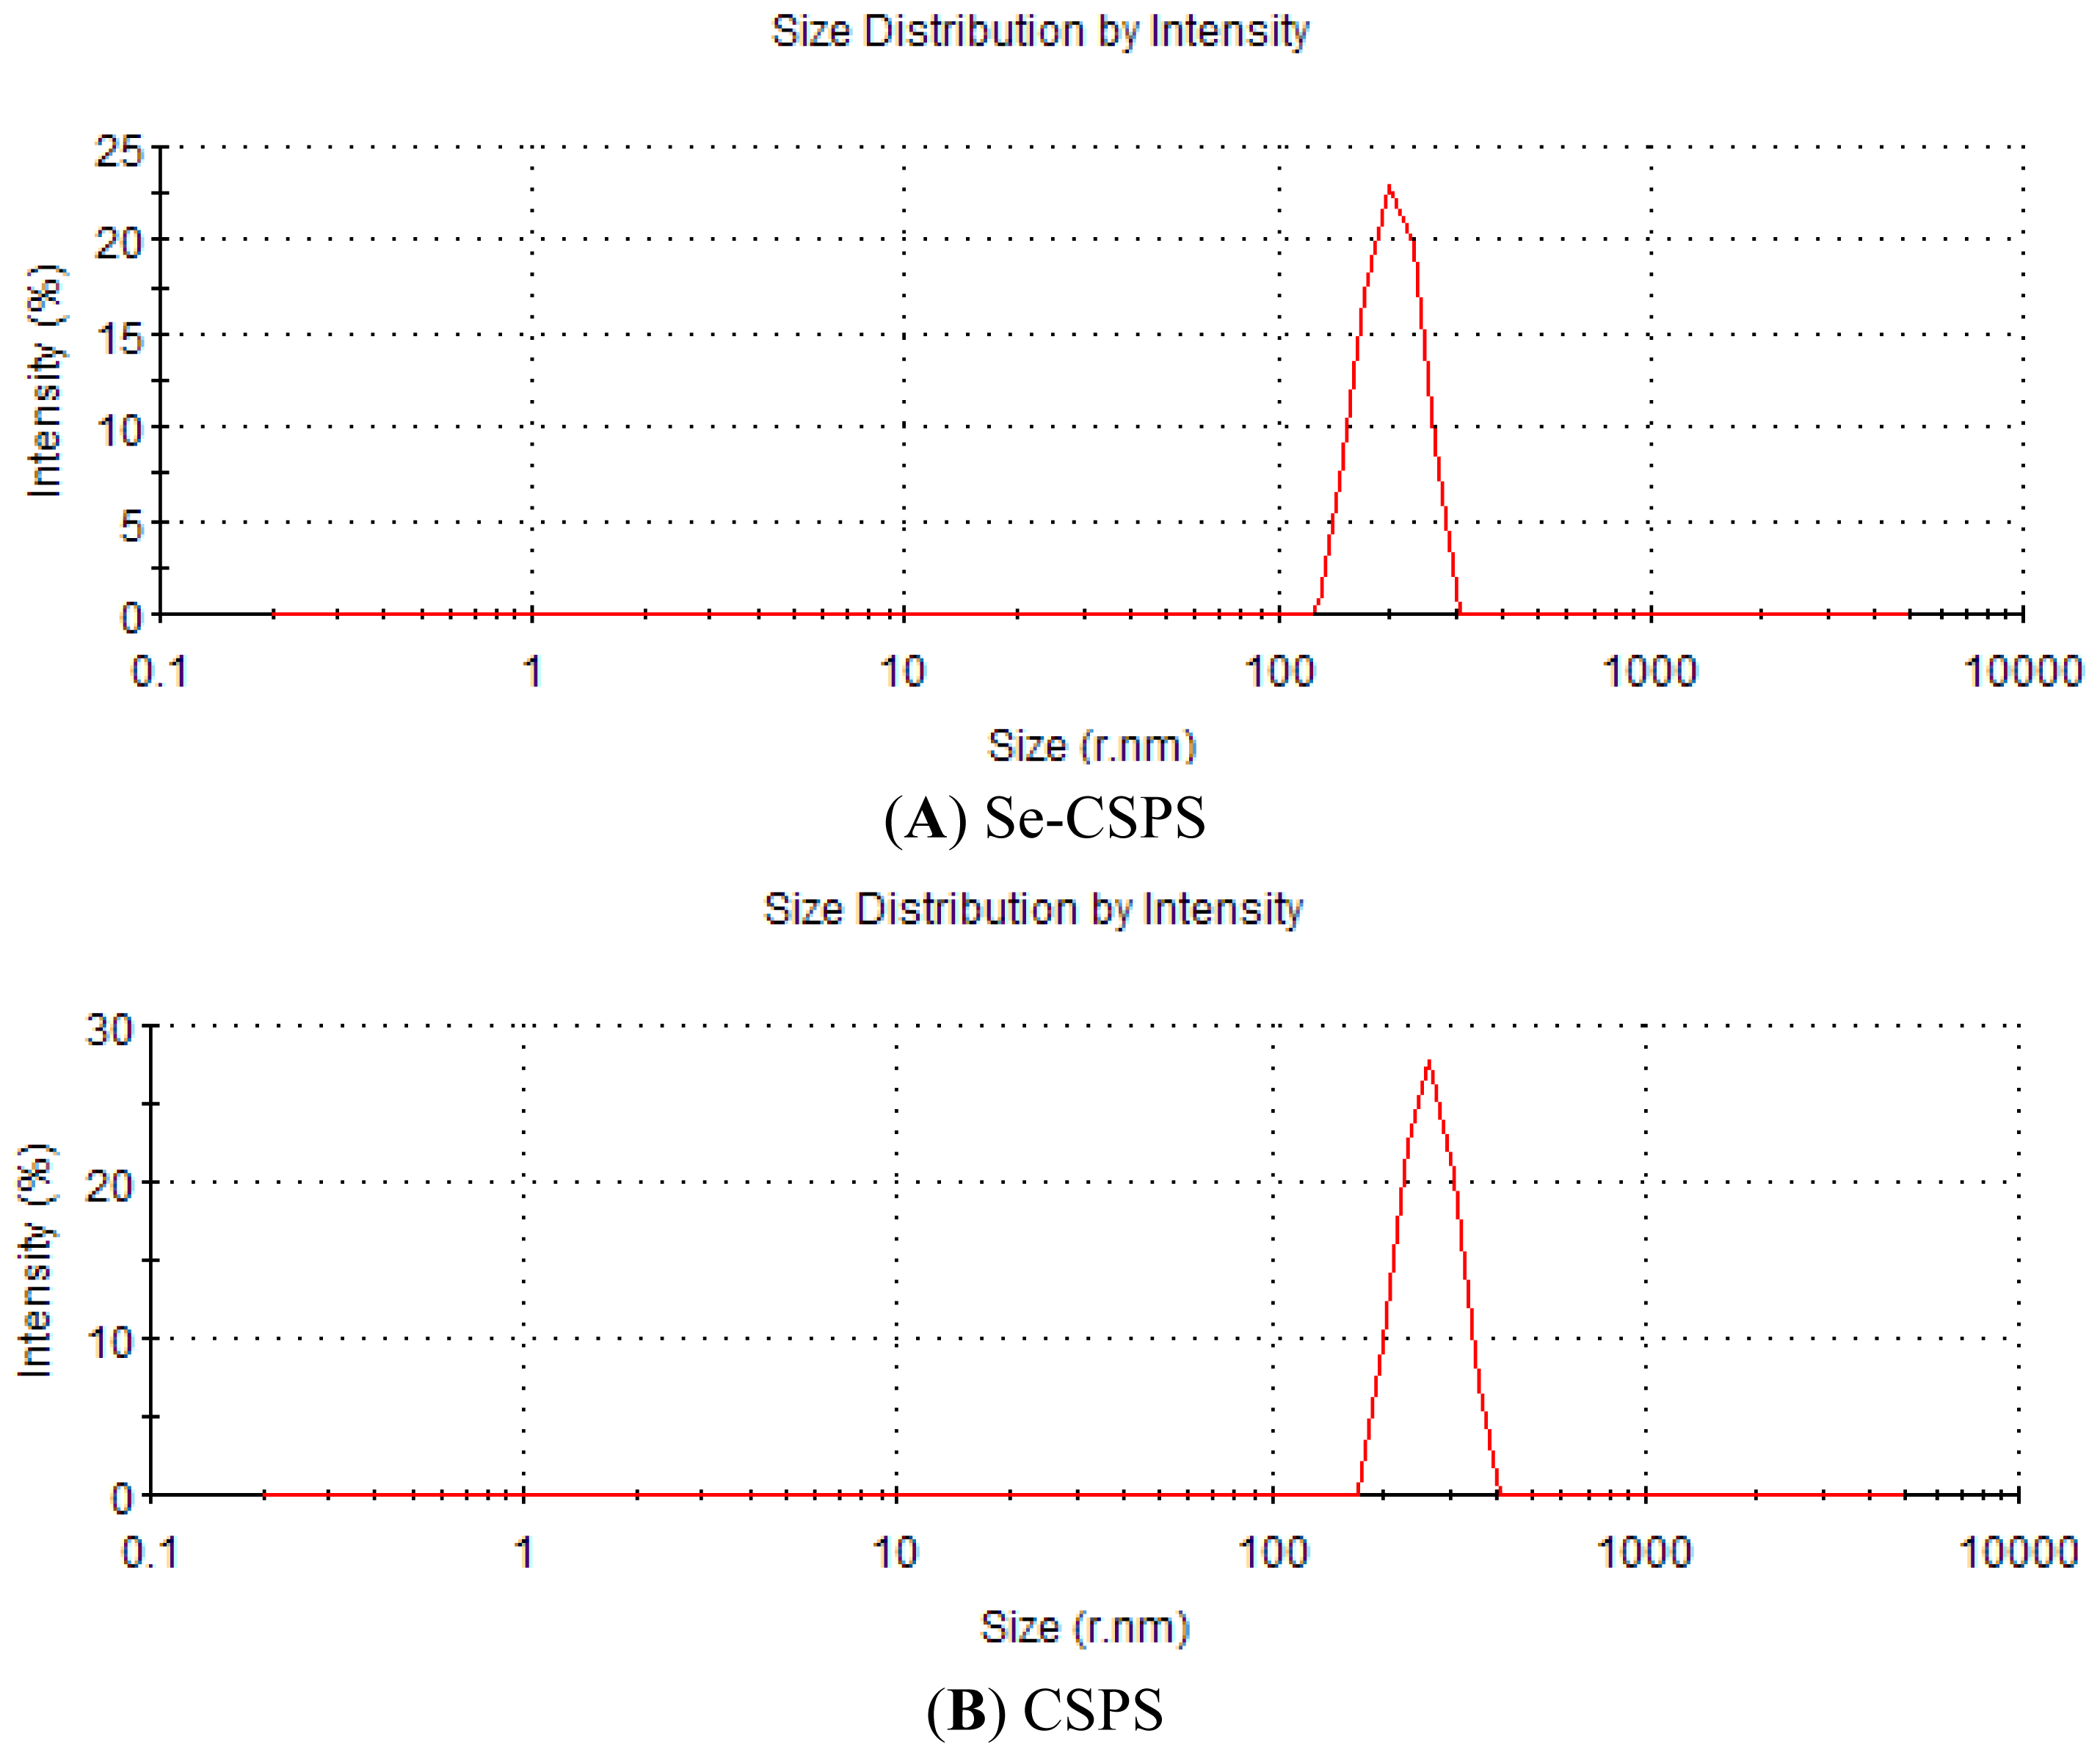
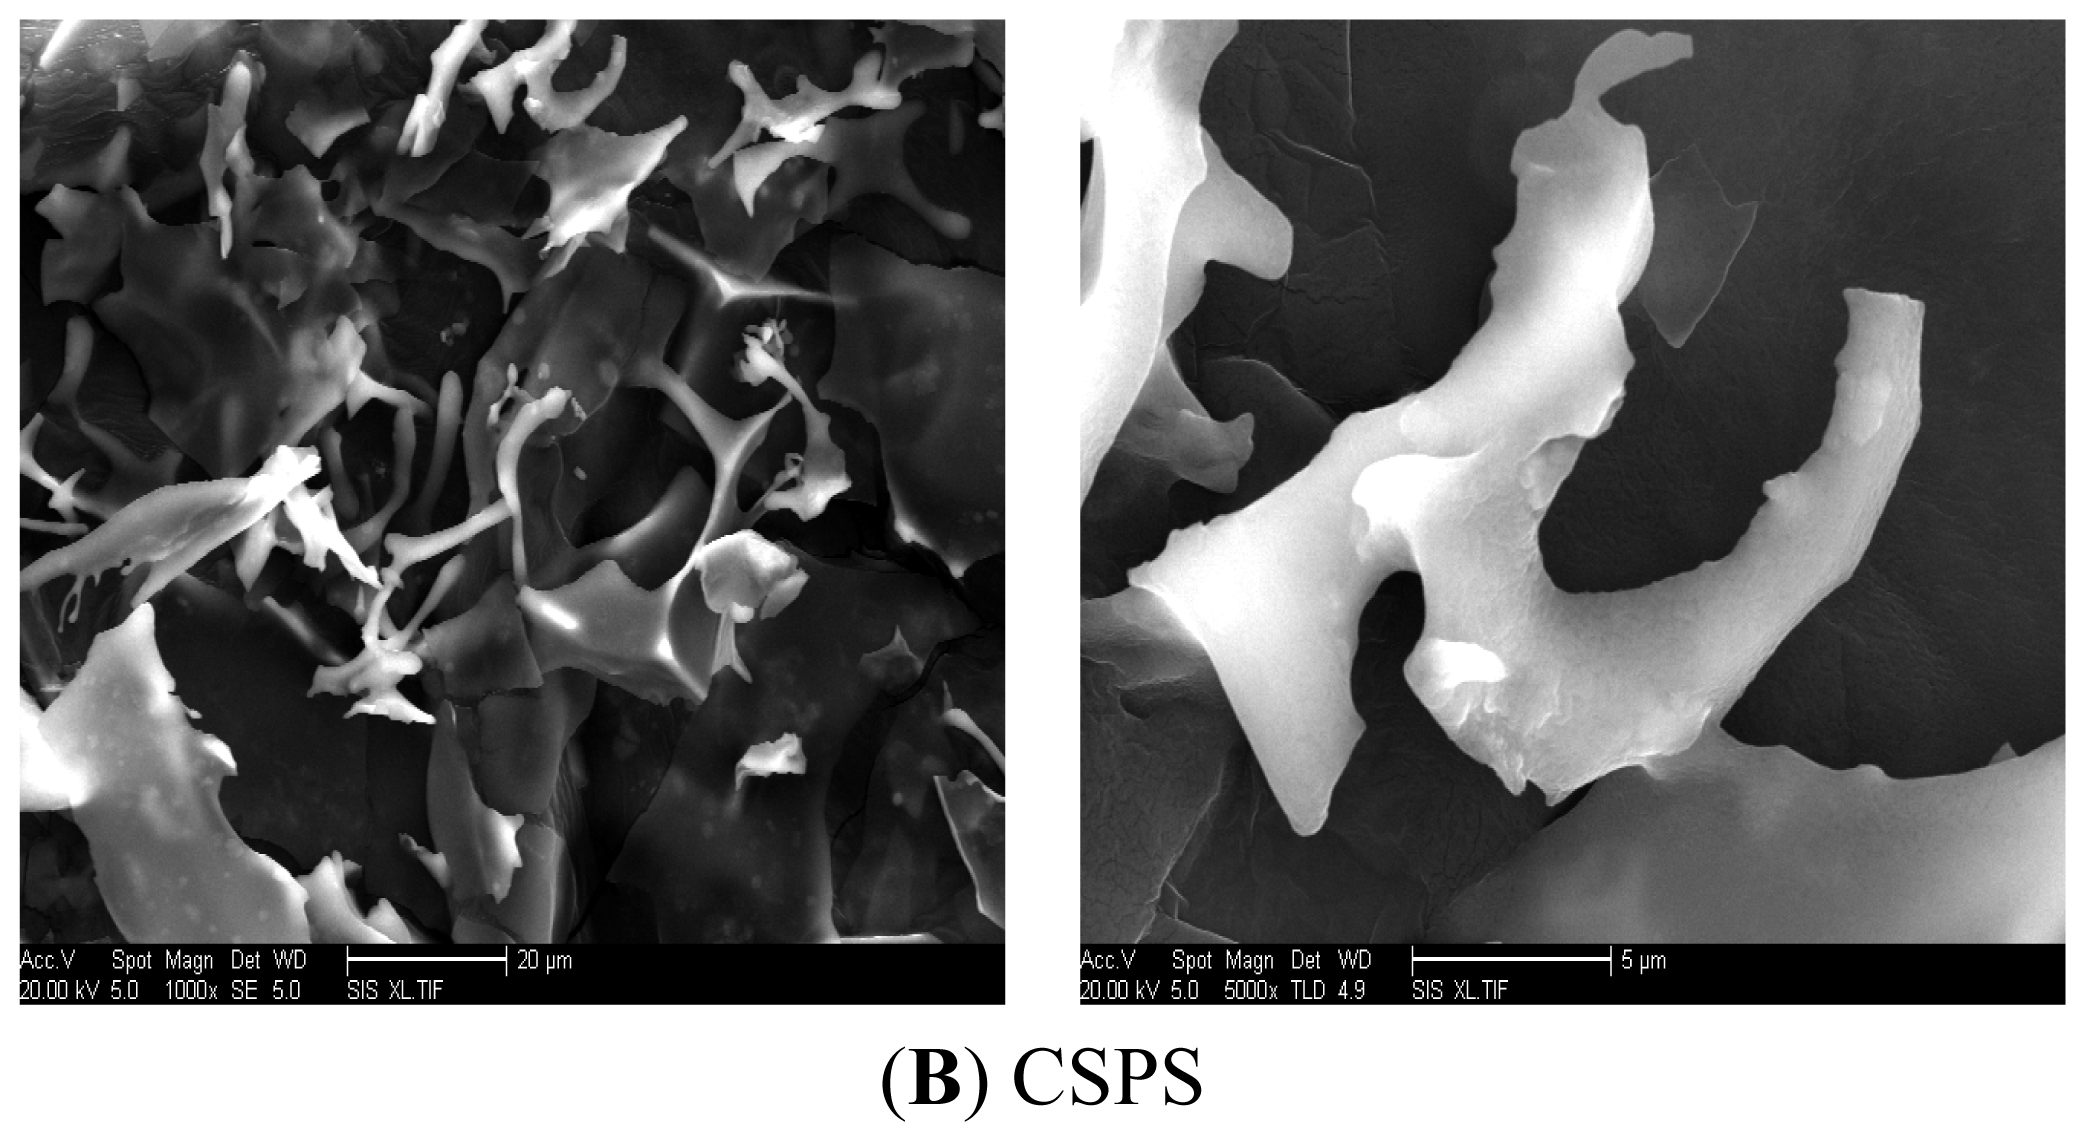
2.3.3. Shape in SEM
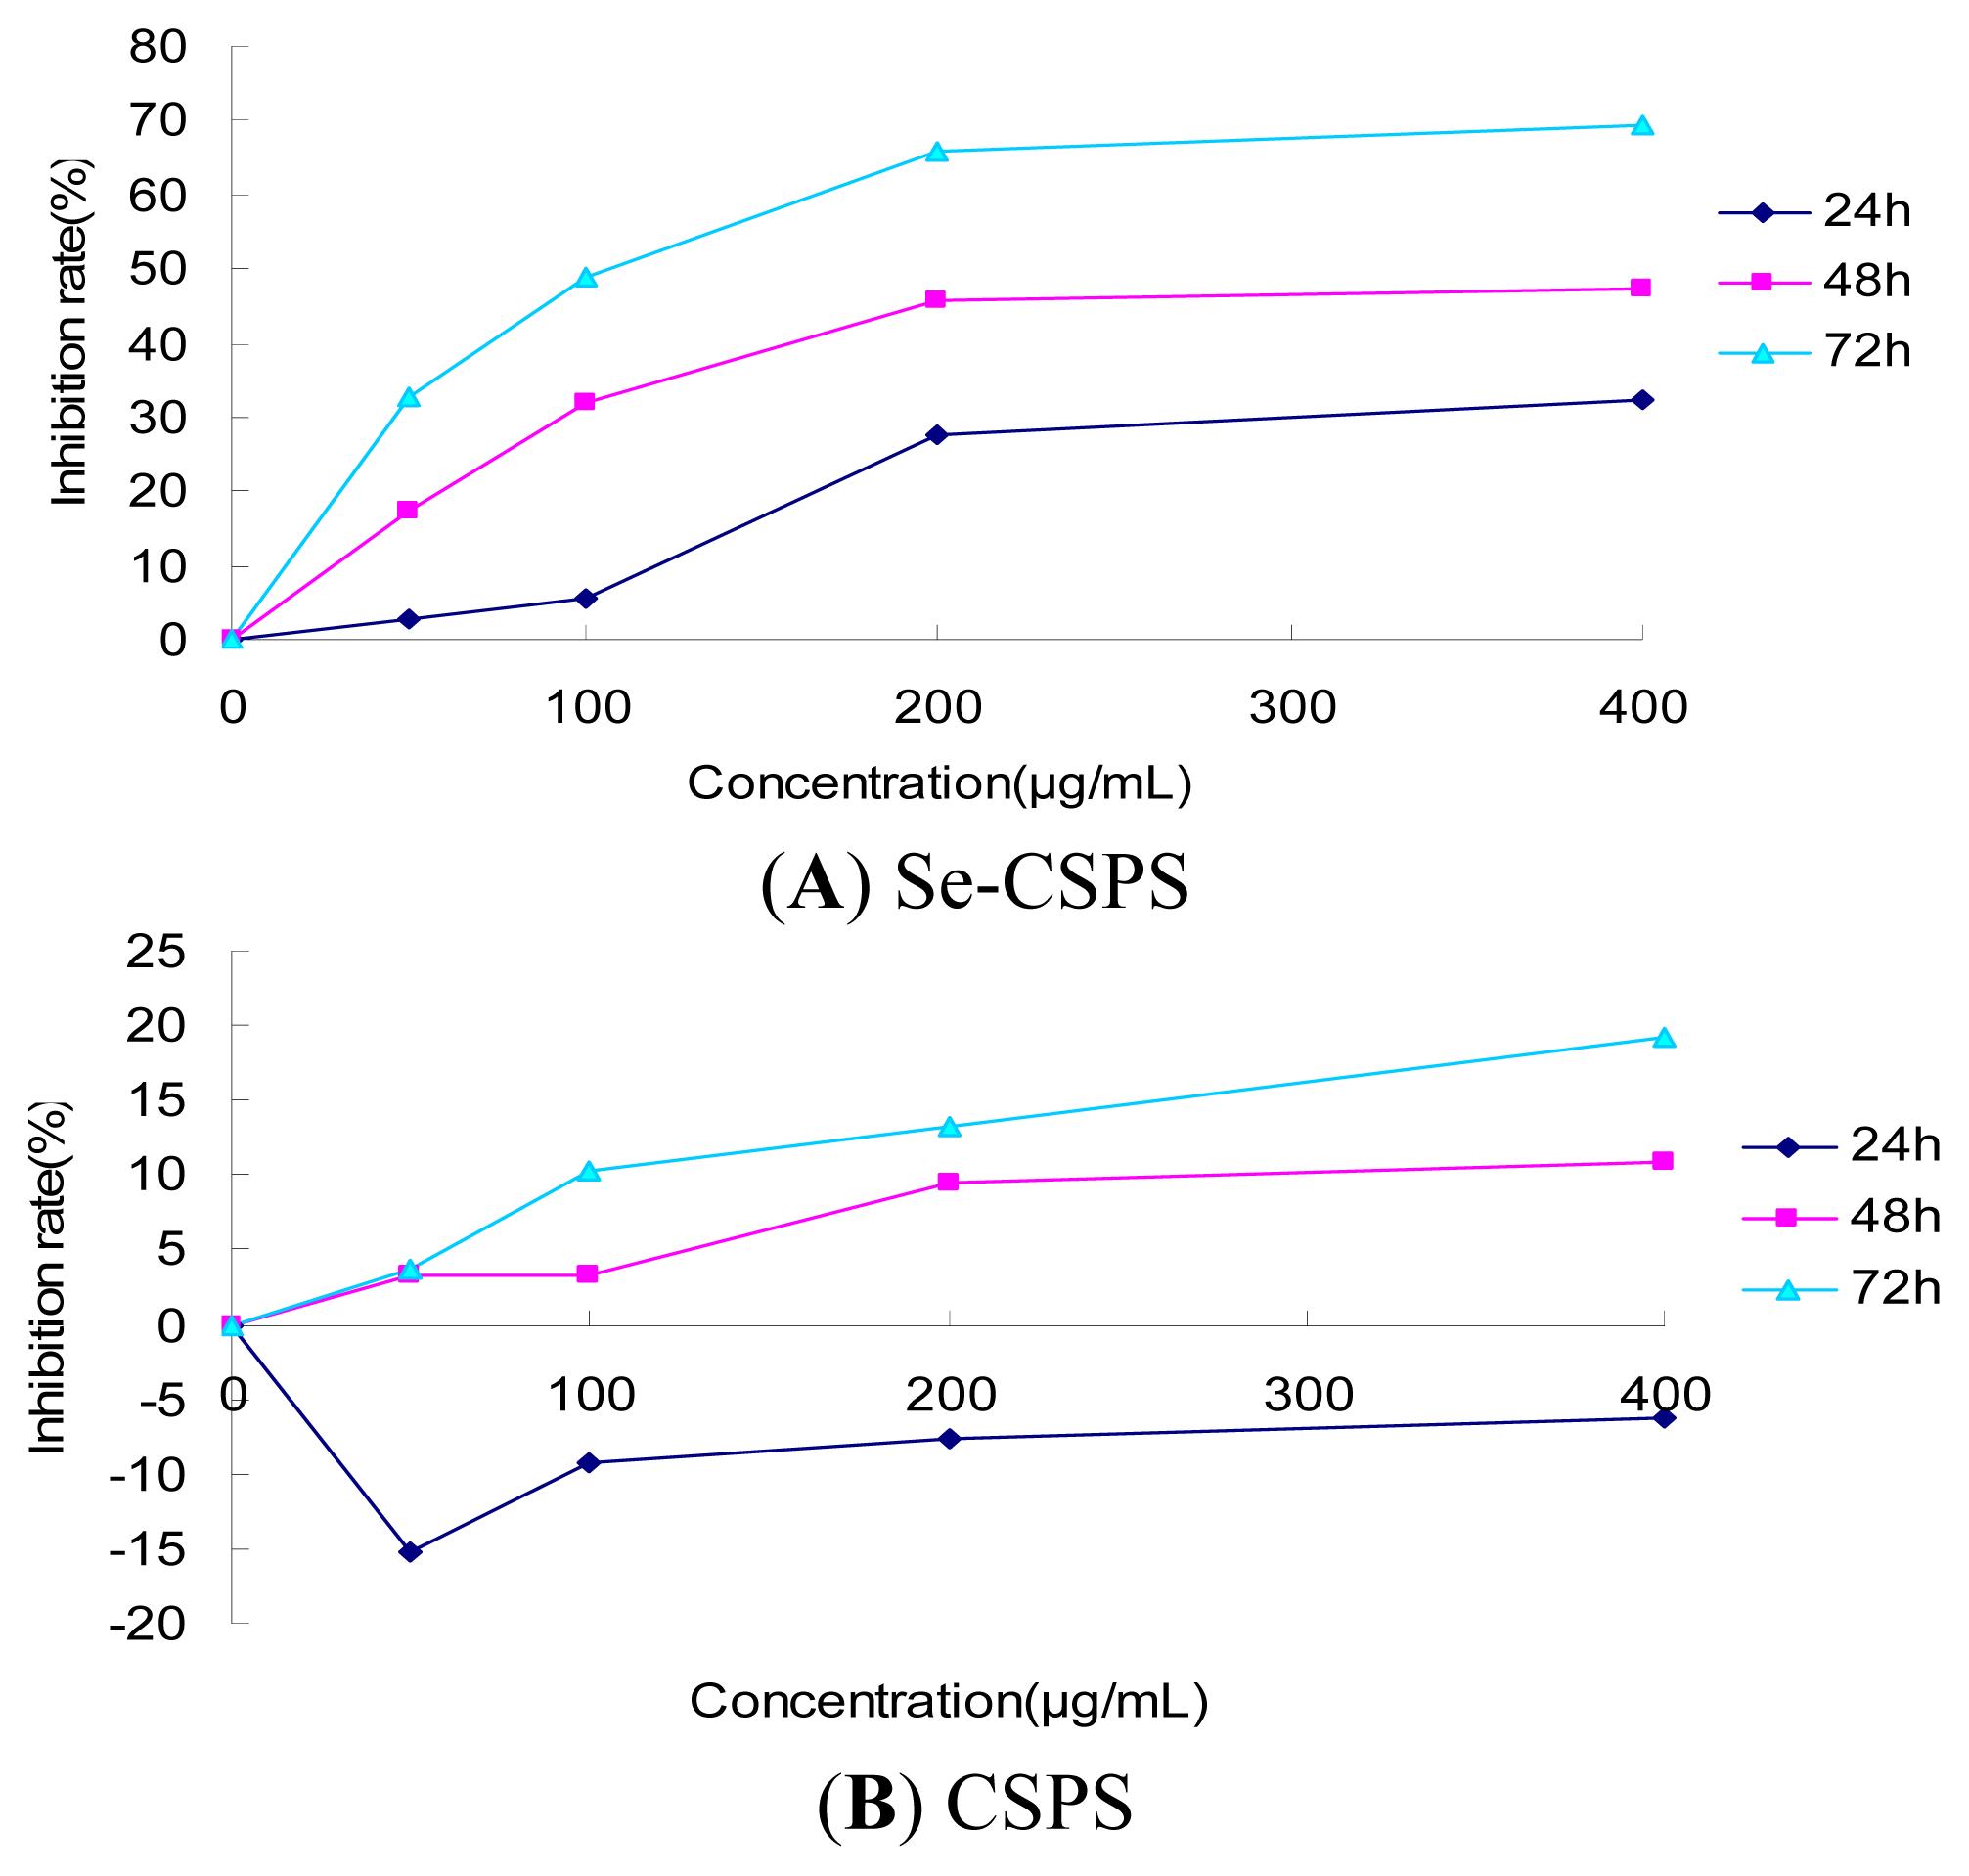
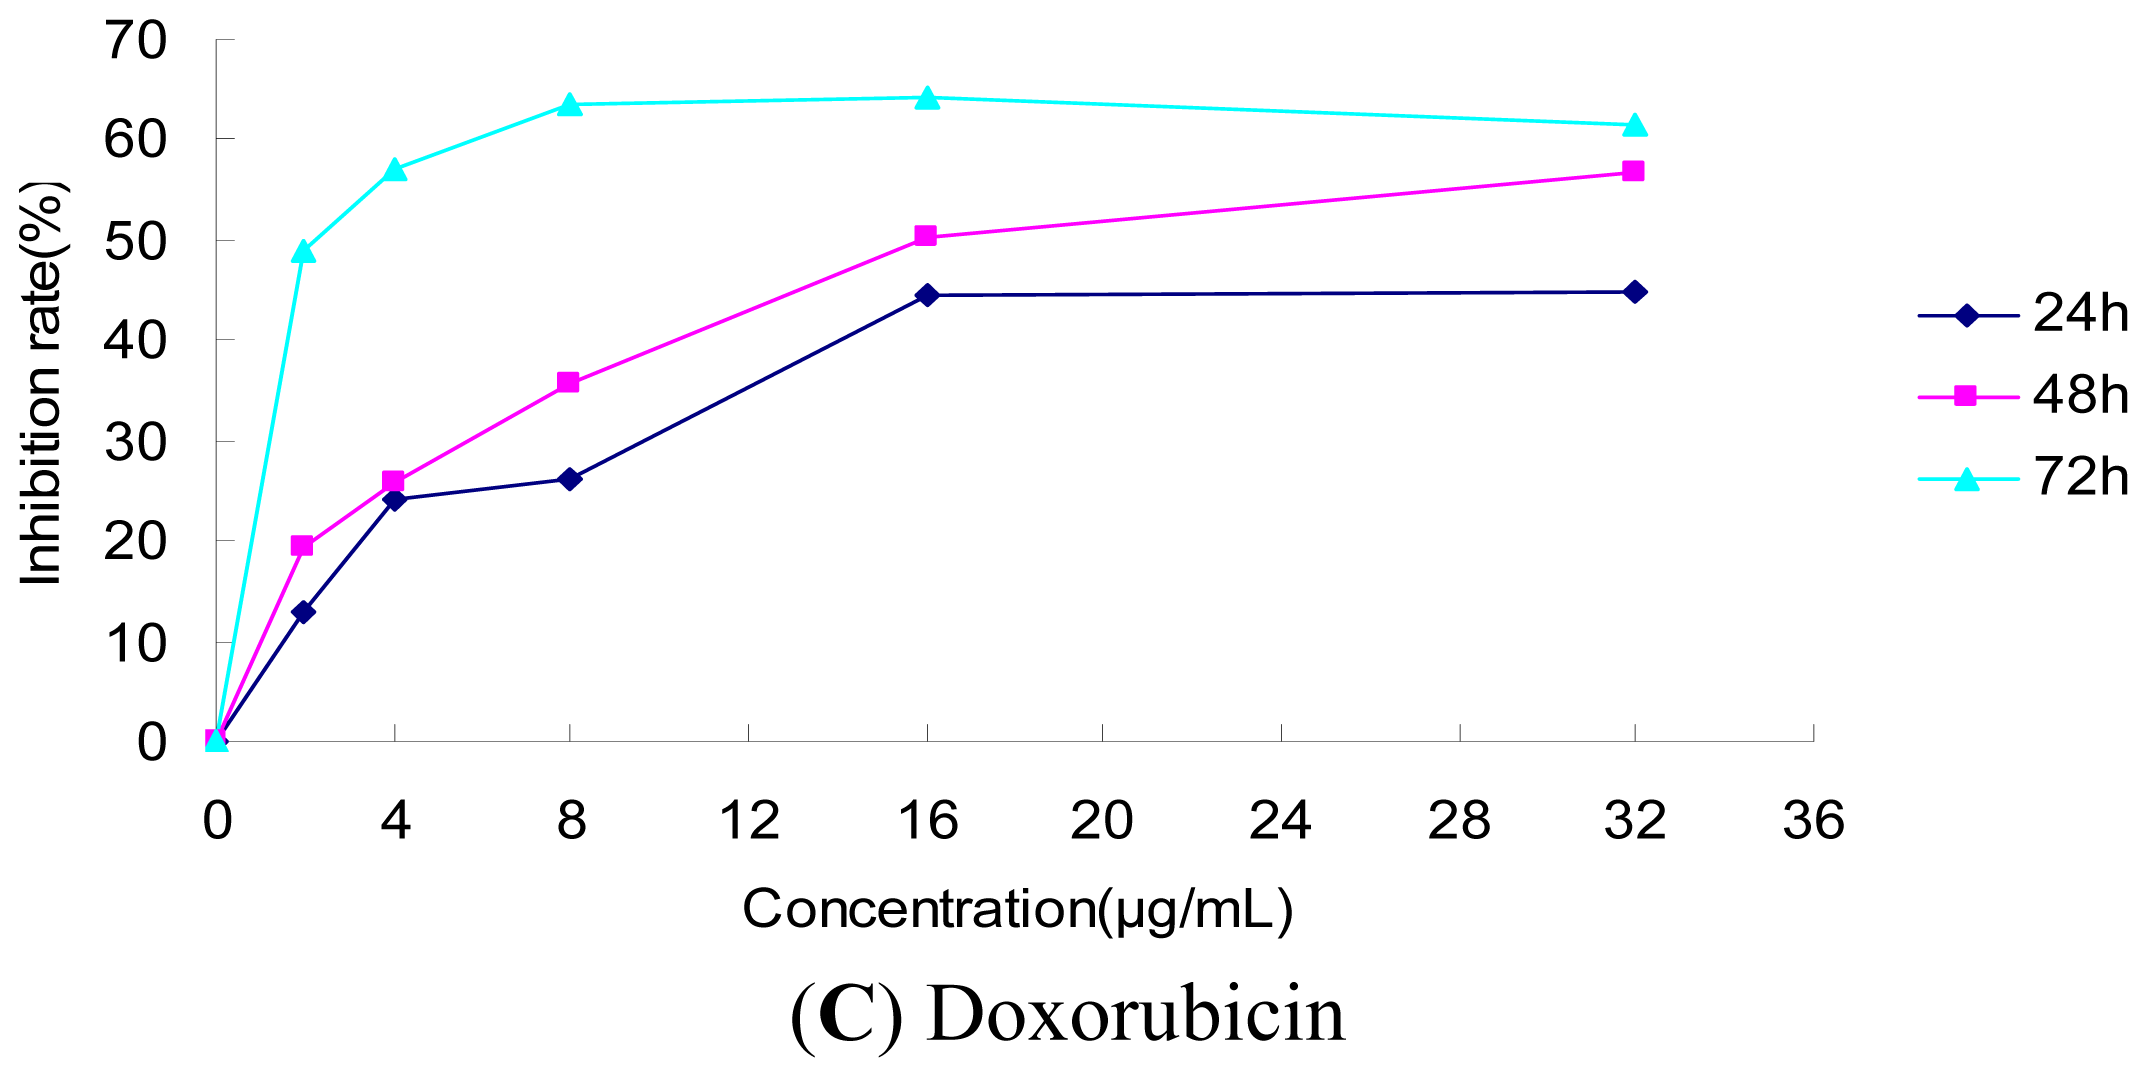
2.4. MTT Assay
3. Experimental Section
3.1. Materials and Instrument
3.2. Extraction, Purification and Isolation of CSPS
3.3. Selenylation
3.4. Detection of Se Content in Se-CSPS
3.5. Design of Optimization
3.6. Characterization Detection of Se-CSPS
3.6.1. Determination of Thermal Weight Loss Analysis
3.6.2. Detection of Particle Size Distribution
3.6.3. Observation under Scanning Electron Microscopy
3.7. MTT Detection of Se-CSPS in vitro
3.8. Statistical Analysis
4. Conclusions
Acknowledgments
References
- Papp, L.V.; Lu, J.; Holmgren, A.; Khanna, K.K. From selenium to selenoproteins: Synthesis, identity, and their role in human health. Antioxid. Redox Signal 2007, 9, 775–806. [Google Scholar]
- Sanmartín, C.; Plano, D.; Sharma, A.K.; Palop, J.A. Selenium compounds, Apoptosis and other types of cell death: An overview for cancer therapy. Int. J. Mol. Sci 2012, 13, 9649–9672. [Google Scholar]
- Brozmanova, J.; Manikova, D.; Vlckova, V.; Chovanec, M. Selenium: A double-edged sword for defense and offence in cancer. Arch. Toxicol 2010, 84, 919–938. [Google Scholar]
- Davis, C.D.; Irons, R. Are selenoproteins important for the cancer protective effects of selenium? Curr. Nutr. Food Sci 2005, 1, 201–214. [Google Scholar]
- Micke, O.; Schomburg, L.; Buentzel, J.; Kisters, K.; Muecke, R. Selenium in oncology: From chemistry to clinics. Molecules 2009, 14, 3975–3988. [Google Scholar]
- Schomburg, L.; Koehrle, J. Selenium: Benefits and risks. MMW Fortschr. Med 2007, 149, 34–36. [Google Scholar]
- Shang, D.; Li, Y.; Wang, C. A novel polysaccharide from Se-enriched Ganoderma lucidum induces apoptosis of human breast cancer cells. Oncol. Rep 2011, 25, 267–272. [Google Scholar]
- Ji, M.; Lu, Z.; Huang, M.; Wang, Y. Effect of Se-enriched polysaccharides produced by Enterobacter cloacae Z0206 on alloxan-induced diabetic mice. Int. J. Biol. Macromol 2012, 50, 348–352. [Google Scholar]
- Xu, C.L.; Qin, C.G.; Niu, W.N.; Shang, X.Y. Preparation of seleno-chitosan and study on its antioxidant activity in vitro. Chem. Bioeng 2009, 6, 45–48. [Google Scholar]
- Zhang, J.; Liu, Z.W.; Wang, F.X.; Yang, Y.P.; Tian, Y.R.; Sun, W.X.; Wang, Y.P. Synthesis and characterization of seleno-Lilium davidii var. unicolor Salisb polysaccharides. Polym. Bull 2009, 10, 48–52. [Google Scholar]
- Pang, X.F.; Yang, G.N.; Zhao, Q. Preparation of selenide glyeyrrhiza polysaccharides. Chem. Eng 2009, 37, 63–66. [Google Scholar]
- Wang, H.L.; Zhang, D.S.; Zhang, L.S.; Du, G.J.; Zhang, Y.Z.; Zhao, X.L. Preparation and immunological studies of seleno-Ganoderma lucidum polysaccharide. Food Sci 2009, 30, 316–318. [Google Scholar]
- Angelo, D.; Catania, S. Evaluation of extracts and isolated fraction from Capparis spinosa L. buds as an antioxidant source. J. Agric. Food Chem 2002, 50, 1168–1171. [Google Scholar]
- Ji, Y.B.; Guo, S.D.; Ji, C.F. Progress of study on Capparis spinosa L. J. Harbin Univ. Commerce 2006, 22, 5–10. [Google Scholar]
- Ji, Y.B.; Dong, F.; Ma, D.B.; Miao, J.; Jin, L.N.; Liu, Z.F.; Zhang, L.W. Optimizing the extraction of anti-tumor polysaccharides from the fruit of Capparis spionosa L. by response surface methodology. Molecules 2012, 17, 7323–7335. [Google Scholar]
- Ji, Y.B.; Dong, F.; Gao, S.Y.; Zou, X. Apoptosis induced by Capparis spionosa polysaccharide in human HepG2. Chin. Tradit. Herb. Drugs 2008, 9, 1364–1367. [Google Scholar]
- Ji, Y.B.; Dong, F.; Gao, S.Y.; Yu, M. Study on Capparis spionosa L. polysaccharide (CSPS) induced HepG2 apoptosis by controlling Ca2+ path. Adv. Mater. Res 2011, 282, 203–208. [Google Scholar]
- Liu, J.C.; Miao, S.; Wen, X.C.; Sun, Y.X. Optimization of polysaccharides (ABP) extraction from the fruiting bodies of Agaricus blazei Murill. using response surface methodology (RSM). Carbohydr. Polymer 2009, 78, 704–709. [Google Scholar]
- Amdoun, R.; Khelifi, L.; Khelifi-Slaoui, M.; Amroune, S.; Asch, M.; Assaf-Ducrocq, C.; Gontier, E. Optimization of the culture medium composition to improve the production of hyoscyamine in elicited Datura stramonium L. hairy roots using the response surface methodology (RSM). Int. J. Mol. Sci 2010, 11, 4726–4740. [Google Scholar]
- Gu, F.; Xu, F.; Tan, L.; Wu, H.; Chu, Z.; Wang, Q. Optimization of enzymatic process for vanillin extraction using response surface methodology. Molecules 2012, 17, 8753–8761. [Google Scholar]
- Guo, Z.; Shen, L.; Ji, Z.; Wu, W. Enhanced production of a novel cyclic hexapeptide antibiotic (NW-G01) by Streptomyces alboflavus 313 using response surface methodology. Int. J. Mol. Sci 2012, 13, 5230–5241. [Google Scholar]
- Mehrnoush, A.; Mustafa, S.; Yazid, A.M.M. Optimization of freeze drying conditions for purified pectinase from Mango (Mangifera indica cv. Chokanan) Peel. Int. J. Mol. Sci 2012, 13, 2939–2950. [Google Scholar]
- She, Z.G.; Hu, G.P.; Guo, Z.Y.; Lin, Y.C.; Lin, M.L. Study on the thermal decomposition of the sulphated polysaccharide Hal-A from Haliotis diverisicolor Reeve. Chin. J. Org. Chem 2003, 23, 1149–1151. [Google Scholar]
- Zhang, J.; Wang, F.X.; Liu, Z.W.; Zhang, S.T.; Zhang, Y.Y.; Liang, J.Y.; Wang, Y.P. Synthesis and characterisation of seleno-Cynomorium songaricum Rupr. polysaccharide. Nat. Prod. Res 2009, 23, 1641–1651. [Google Scholar]
- Xu, C.L. Preparation, structural analysis and biological function research of selenium-enriehed produced exopolysaceharide by Bacterium Enterobacter cloacae Z0206. Ph.D. Thesis, Zhejiang University, Hangzhou, China, 2008. [Google Scholar]


| Exp. No. | X1/Reaction time (h) | X2/Reaction temperature (°C) | X3/Ratio of Na2SeO3 to CSPS (g/g) | Se content in Se-CSPS (mg/g) |
|---|---|---|---|---|
| 1 | −1 (6) | −1 (60) | 0 (0.8) | 2.438 |
| 2 | 1 (8) | −1 (60) | 0 (0.8) | 3.874 |
| 3 | −1 (6) | 1 (80) | 0 (0.8) | 4.574 |
| 4 | 1 (8) | 1 (80) | 0 (0.8) | 4.183 |
| 5 | −1 (6) | 0 (70) | −1 (0.6) | 4.348 |
| 6 | 1 (8) | 0 (70) | −1 (0.6) | 4.319 |
| 7 | −1 (6) | 0 (70) | 1 (1.0) | 4.149 |
| 8 | 1 (8) | 0 (70) | 1 (1.0) | 5.199 |
| 9 | 0 (7) | −1 (60) | −1 (0.6) | 3.186 |
| 10 | 0 (7) | 1 (80) | −1 (0.6) | 3.022 |
| 11 | 0 (7) | −1 (60) | 1 (1.0) | 3.317 |
| 12 | 0 (7) | 1 (80) | 1 (1.0) | 4.476 |
| 13 | 0(7) | 0 (70) | 0 (0.8) | 5.545 |
| 14 | 0 (7) | 0 (70) | 0 (0.8) | 5.423 |
| 15 | 0 (7) | 0 (70) | 0 (0.8) | 5.399 |
| 16 | 0 (7) | 0 (70) | 0 (0.8) | 5.220 |
| 17 | 0 (7) | 0 (70) | 0 (0.8) | 5.234 |
| Parameter | Estimate | Sum of squares | Standard error | df | F-value | p-value |
|---|---|---|---|---|---|---|
| intercept | 5.36 | 0.11 | 1 | |||
| X1 | 0.26 | 0.53 | 0.089 | 1 | 8.49 | 0.0226 |
| X2 | 0.43 | 1.48 | 0.089 | 1 | 23.53 | 0.0019 |
| X3 | 0.28 | 0.64 | 0.089 | 1 | 10.21 | 0.0152 |
| X1X2 | −0.46 | 0.83 | 0.13 | 1 | 13.27 | 0.0083 |
| X1X3 | 0.27 | 0.29 | 0.13 | 1 | 4.63 | 0.0685 |
| X2X3 | 0.33 | 0.44 | 0.13 | 1 | 6.96 | 0.0335 |
| X12 | −0.30 | 0.37 | 0.12 | 1 | 5.90 | 0.0455 |
| X22 | −1.30 | 7.12 | 0.12 | 1 | 113.21 | <0.0001 |
| X32 | −0.56 | 1.34 | 0.12 | 1 | 21.28 | 0.0024 |
| Source | Sum of squares | df | Mean square | F-value | p-value | |
|---|---|---|---|---|---|---|
| Model | 13.70 | 9 | 1.52 | 24.21 | 0.0002 | significant |
| Residual | 0.44 | 7 | 0.063 | |||
| Lack of fit | 0.37 | 3 | 0.12 | 6.48 | 0.0514 | not significant |
| Pure error | 0.075 | 4 | 0.019 | |||
| Cor total | 14.14 | 16 |
| Reaction time (h) | Reaction temperature (°C) | Ratio of Na2SeO3 to CSPS (g/g) | Se content in Se-CSPS (mg/g) | |
|---|---|---|---|---|
| Predicted conditions | 7.53 | 71.26 | 0.88 | 5.518 |
| Experimental conditions | 7.5 | 71 | 0.9 | 5.547 ± 0.09 * |
| Independent variables | Factor level | ||
|---|---|---|---|
| −1 | 0 | 1 | |
| X1 reaction time (h) | 6 | 7 | 8 |
| X2 reaction temperature (°C) | 60 | 70 | 80 |
| X3 ratio of Na2SeO3 to CSPS (g/g) | 0.6 | 0.8 | 1 |
© 2012 by the authors; licensee Molecular Diversity Preservation International, Basel, Switzerland. This article is an open-access article distributed under the terms and conditions of the Creative Commons Attribution license (http://creativecommons.org/licenses/by/3.0/).
Share and Cite
Ji, Y.-B.; Dong, F.; Lang, L.; Zhang, L.-W.; Miao, J.; Liu, Z.-F.; Jin, L.-N.; Hao, Y. Optimization of Synthesis, Characterization and Cytotoxic Activity of Seleno-Capparis spionosa L. Polysaccharide. Int. J. Mol. Sci. 2012, 13, 17275-17289. https://0-doi-org.brum.beds.ac.uk/10.3390/ijms131217275
Ji Y-B, Dong F, Lang L, Zhang L-W, Miao J, Liu Z-F, Jin L-N, Hao Y. Optimization of Synthesis, Characterization and Cytotoxic Activity of Seleno-Capparis spionosa L. Polysaccharide. International Journal of Molecular Sciences. 2012; 13(12):17275-17289. https://0-doi-org.brum.beds.ac.uk/10.3390/ijms131217275
Chicago/Turabian StyleJi, Yu-Bin, Fang Dong, Lang Lang, Ling-Wen Zhang, Jing Miao, Zhen-Feng Liu, Li-Na Jin, and Ying Hao. 2012. "Optimization of Synthesis, Characterization and Cytotoxic Activity of Seleno-Capparis spionosa L. Polysaccharide" International Journal of Molecular Sciences 13, no. 12: 17275-17289. https://0-doi-org.brum.beds.ac.uk/10.3390/ijms131217275