1. Introduction
Diatoms, important marine photoautotrophic protists that account for up to 25% of the primary production on Earth [
1], produce large quantities of extracellular polymeric substances (EPS), consisting predominantly of polysaccharides [
2]. Diatom extracellular polymers participate in various processes, both at the cellular level and in the environment. At the cellular level, extracellular polymers have several important functions, of which some of the most frequently recognized are sessile adhesion, gliding, protection against drying, stabilization of habitats through prevention of sediment erosion, and the formation of biofilms and colonies [
2,
3]. The total amount of exopolysaccharides produced by diatoms is far in excess of that required for movement or adhesion [
3–
5] and is referred to as the photosynthetic overflow. In the marine environment, extracellular polysaccharide production by diatoms is a significant route by which photosynthetically produced organic carbon enters the trophic web and may influence the physical environment in the sea. Specifically, species of diatoms in the northern Adriatic Sea can produce large amounts, up to 50 g/m
3 of extracellular polysaccharides in a month [
6], resulting in the episodic formation of a macroscopic gel phase [
7,
8].
Marine polysaccharide gels represent a form of molecular organization in which biopolymer molecules form solvated three-dimensional networks imbedded in seawater. Intense metabolic activities of microorganisms within gel aggregates (e.g., [
9]) result in the formation of sharp microbiogeochemical gradients. The diffusion-slowing properties of the gel phase aid in maintaining these gradients over a very small (μm) spatial scale. The continued presence of sharp microbiogeochemical gradients results in the formation of microbial consortia, structured arrangements of microorganisms exhibiting different but highly specific physiological activities over small spatial scales.
Unlike chemical gels that are formed by chemical reaction using a cross-linking agent, it is characteristic of anionic polysaccharide macromolecules to form gels by physical bonds through the intermolecular forces among polymer chains [
10,
11]. Among the new methodologies (experimental and theoretical) developed for and applied to polysaccharide conformation and dynamics, solution properties, chain aggregation and gelation [
12] using atomic force microscopy (AFM) have yielded the most striking results [
13].
AFM has been extensively used in nanoscale studies of EPS intimately associated with frustules as coating and adhesive structures (strands, tethers, pads and stalks), as recently reviewed by Higgins and Wetherbee, 2012 [
14]. Here, we intend to review recent AFM studies of diatom EPS focusing on the detection of the supramolecular structures of polysaccharide fibrils produced by marine diatoms, either attached to the diatom cell wall or released into the surrounding seawater.
2. Basic Principles of AFM and Its Application to Polysaccharides
AFM connects the nanometer- and micrometer-length scales, utilizing a sharp probe that senses interatomic forces acting between the surface of a sample and the atoms at the apex of the tip. The physical basis behind AFM and its ability to “feel” the surface make AFM a versatile tool in biophysics, allowing high resolution imaging, nanomechanical characterization and measurements of inter- and intramolecular forces in living and non-living structures [
15–
19]. Thanks to the simple principle on which it is based, the AFM is a surprisingly small and compact instrument. Its use includes an electronic control unit, computer and usually two monitors for the simultaneous checking of the image and imaging parameters. The probe, which scans the sample surface, consists of a cantilever and a tip located at its free end. The deflection of the cantilever is measured by an optical detection system. Registered values of cantilever deflection are electronically converted into a pseudo 3D image of a sample. As a result AFM produces real 3D images of a sample with a vertical resolution of 0.1 nm and lateral resolution of 1 nm. The measured forces range from 10
−6 N to 10
−11 N. In AFM force spectroscopy, a single molecule or fiber is stretched between the AFM flexible cantilever tip and a flat substrate. A polysaccharide molecule, protein or other biopolymer is either adsorbed to the substrate or linked to it through the formation of covalent bonds. When the tip and substrate are brought together and then withdrawn, one or more molecules can attach to the tip. The deflection of the cantilever measures the force on the polymer with an accuracy of ~5 pN, while the piezoelectric positioner records the changes in the end-to-end length of the molecule with an accuracy of 0.1 nm. AFM force spectroscopy is a widely used method in polymer biophysics, allowing the measurement of the mechanical properties of single molecules with the possibility of quantifying the forces involved directly in both intra- and inter-molecular polymer interactions [
18,
20–
23]. It has also been adopted in advancing diatom research into the nanotechnology [
14].
In the AFM imaging mode that makes visualization at the molecular scale of polysaccharide samples possible [
24–
32], the molecules are usually spread on freshly cleaved mica (a hydrophilic aluminosilicate mineral). The imaging of hydrated samples is preferably conducted in air to inhibit the unfavorable motion of polysaccharides in liquid medium. Protocols for marine sample AFM imaging have been recently developed for single diatom cells and released polymers, isolated polysaccharides from diatom cultures and polymer networks of the marine gel phase [
33–
39].
3. AFM Studies of Diatom EPS
Higgins and coworkers [
40] were the first to use AFM for the characterization of diatom extracellular polymers. Intra- and intermolecular forces were measured between polymers on the cell wall and between those extruded from the diatom raphe on diatom species
Craspedostauros australis E.J. Cox and
Pinnularia viridis (Nitzsch) Ehrenberg [
41,
42]. The resulting force curves obtained from the pores of cell walls were attributed to the soft and compressible material. However, due to their complexity, it was difficult to assign specific interactions between biopolymers to patterns on the force curves. AFM force spectroscopy was also applied to study extracellular adhesive pads released by the diatom
Toxarium undulatum Bailey [
43–
45]. These pads are very sticky and cells use them to form colonies or attach themselves to the surface. The resulting force profiles with numerous sawtooth patterns (e.g., [
46]) were attributed to the extensible modular proteins that are associated into the nanofibers. In a differently designed experiment, Arce and coworkers [
47] compared the adhesion of whole diatom
Navicula spp. cells on different surfaces. In that study, individual cells were glued to tipless cantilevers. With such “diatom probes,” standard force curves were recorded on surfaces such as Intersleek (a hydrophobic agent inhibiting biofilm formation) and mica. The resulting force curves showed comparable adhesion forces, and it was concluded that the extracellular polymeric material on the surface of
Navicula spp. has both hydrophobic and hydrophilic properties. Direct imaging of EPS molecules was, however, hampered by the weak interaction of strands and tethers with the substrates used in the liquid [
41]. These difficulties were overcome by using mica as a substrate and by imaging in air under ambient conditions (experimental details in [
35]).
3.1. EPS of Cylindrotheca Species
The ubiquitous marine diatoms of the
Cylindrotheca spp. were used in AFM studies of exopolysaccharide production [
35–
38]. The
Cylindrotheca closterium (
Ceratonea Closterium Ehrenberg) strain CCNA1 [
35] was isolated from northern Adriatic seawater, while the CCMP1544 and
Cylindrotheca fusiformis Reimann & J.C. Lewin, CCMP343 strains were obtained from the Bigelow Laboratory for Ocean Sciences.
The molecular organization of the EPS biopolymers released by
C. closterium was approached at different levels: (i) EPS released by a single cell; (ii) EPS released in the culture medium and (iii) as biofilms grown on mica slides inserted in the culture [
35]. The release of extracellular polymers by single cells was investigated by AFM in exponential and stationary growth phases. While the release of extracellular polymers in the exponential phase of growth was negligible, in the stationary phase extracellular polymers were visualized on more than 25% of the cells. The AFM data are in line with literature data on increased production of extracellular polymers in the stationary growth phase [
48–
52]. Parallel experiments with Alcian Blue staining and light microscopy performed in the cell culture have shown that the fibrils extending from the cell rostrum were mainly polysaccharides that existed in the liquid phase before the cell deposition to the mica surface [
53].
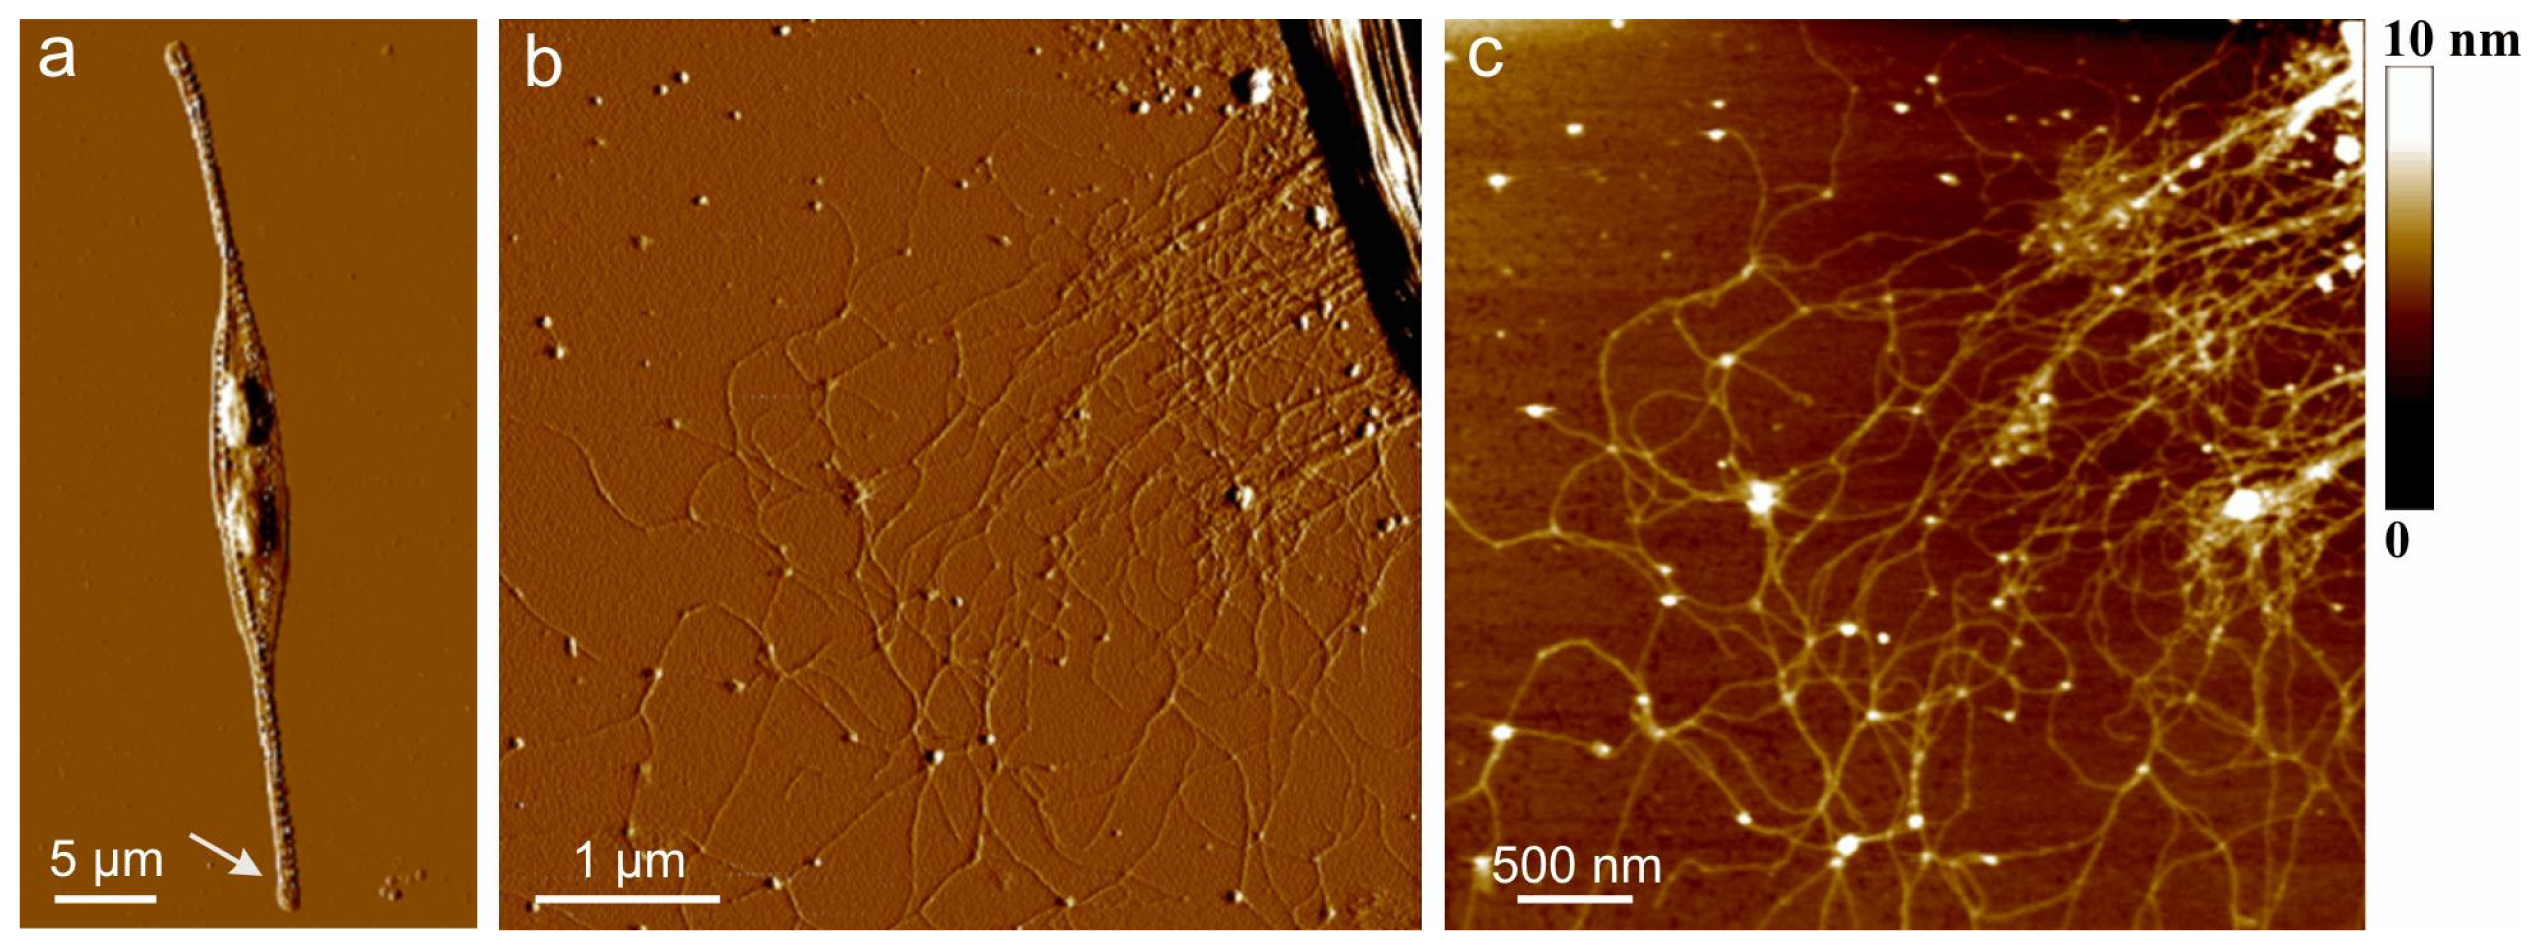
AFM images of extracellular polymers released by
C. closterium are shown in
Figure 1. The image of the whole cell (
Figure 1a) presents the general features of the
C. closterium cell with two chloroplasts and its drawn-out flexible rostra. The arrow indicates the position of polymer release shown in b and c of
Figure 1. Bundles of polymer fibrils appear at the position close to the site of excretion. Their heights were 5–7 nm. These bundles unfold into a fibrillar network with gradually decreasing fibril heights reaching a distance of up to 10 μm from the cell wall. At the distance of 1 μm, a dense network is observed with fibril heights of 2–3 nm. At larger distances,
C. closterium EPS appeared as a relaxed network of fibrils with incorporated spherical nanoparticles/globules. The fibrils appeared flexible, usually with a curved shape, some of them even forming loops. The globules were found to interconnect two or more fibrils but were also imbedded along a single fibril. The fibril heights were in the range of 0.6 to 1.2 nm, while the average height of the incorporated globules was 5 nm. It was hypothesized that the globules are positively charged proteins whose function is the intracellular packing of negatively charged polysaccharide fibrils [
35].
3.2. Biofilm of Cylindrotheca Closterium
Although several AFM studies exist that explored the nature of diatom biofilms and adhesives [
40,
45,
47,
54], visualization of a biofilm has only been achieved by AFM imaging in air [
35]. The mica slides were withdrawn from the flasks when the cultures of diatom
C. closterium entered the stationary growth phase (after 18 days), washed with ultrapure water and imaged in air after drying.
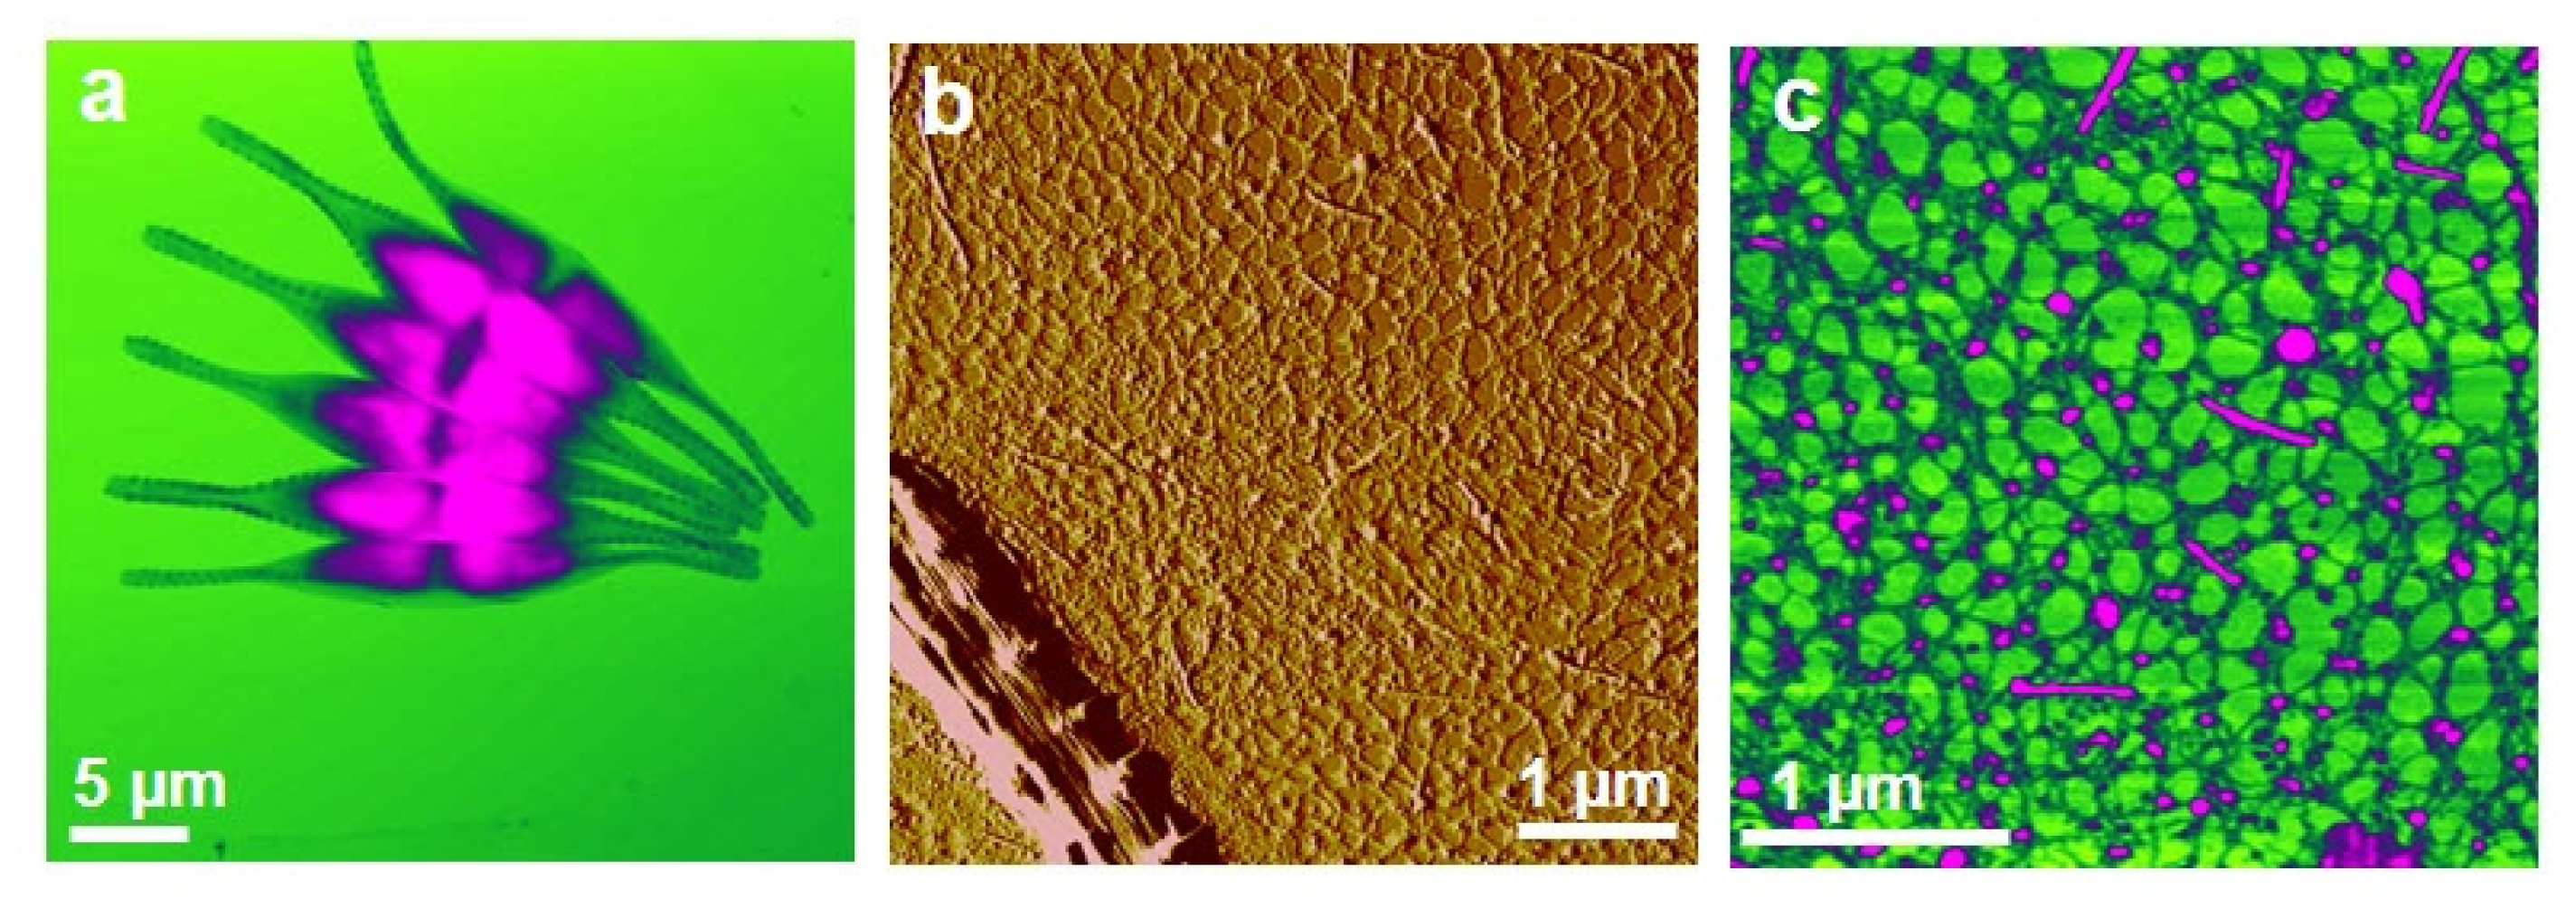
The observed biofilm appeared as a continuous fibrillar network between predominantly individual cells (
Figure 2). Some cells were associated (
Figure 2a) and 2–6 cells were captured on a 35 μm × 35 μm scanned biofilm surface. At a higher resolution, the biofilm was visualized as a dense fibrillar network with pore sizes ranging from 50 nm to 300 nm (
Figure 2b,c). A gradual increase in pore sizes was detected going from the cell wall to the distance of 10 μm (
Figure 2b). The globules (3–12 nm high) found exclusively on the fibrillar network appear as silica nanoparticles nucleated from the culture medium. Shchipunov and coworkers applied AFM to demonstrate that gel-forming polysaccharides (e.g., carrageenans) promote silica precipitation, serving as a template [
55,
56]. Comparison of the fibril and globule height analyses in the EPS of the two
C. closterium strains and the biofilm grown in a
C. closterium (CCNA1) culture is given in
Table 1.
4. AFM of Marine Gel
The broad polydispersity of marine gels ranges from microscopic to macroscopic dimensions [
59]. Santschi and coworkers [
60] were the first to use AFM to image individual fibrillar polysaccharides in marine macromolecular organic matter. The massive appearance of gelatinous macroaggregates known as mucilage events [
7,
8,
61] offered a possibility for systematic studies of the marine gel phase using AFM [
53,
62]. The macromolecular characterization of the isolated polysaccharide fraction using physico-chemical techniques [
63] showed that they are polydisperse high-molecular weight heteropolysaccharides, in which at least some of the hydroxyl groups of sugar residues are substituted by ester sulfate groups and to a minor extent by carboxylic groups-uronic acid.
These features, conferring a marked polyelectrolytic behavior of the polysaccharides in salt solutions, were also found for the polysaccharide fraction from
C. closterium EPS [
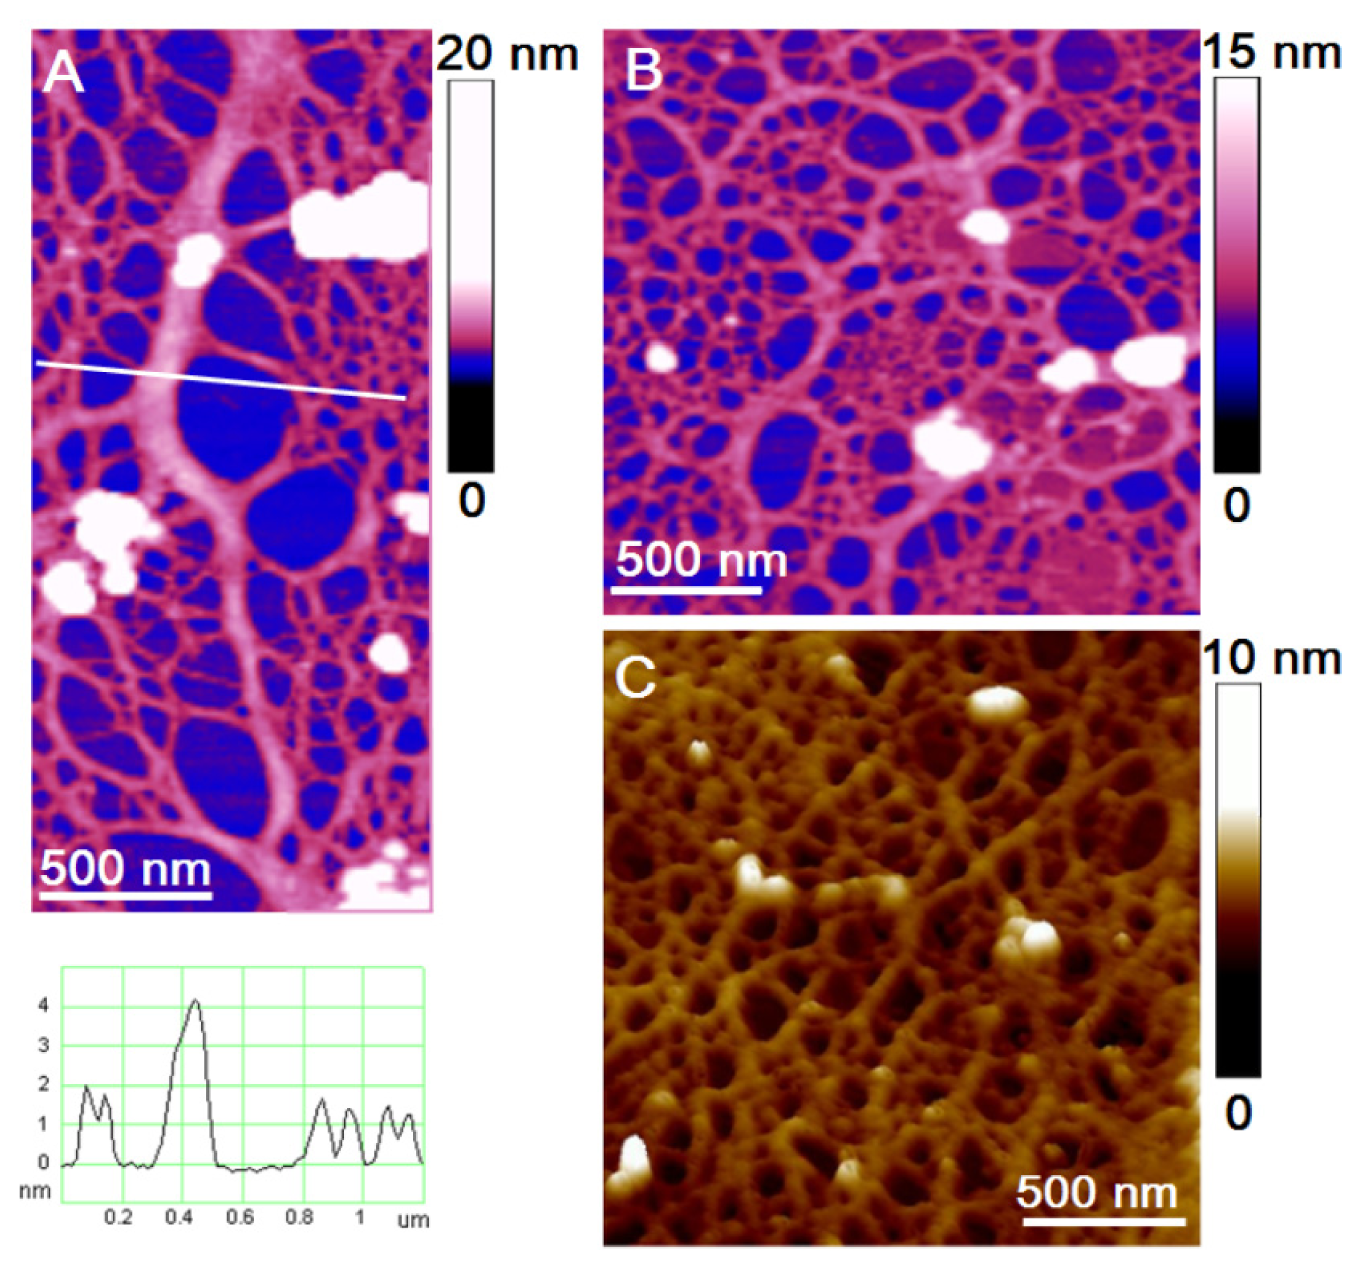
36]. The fact that the EPS isolated polysaccharide fraction has the capacity to self-assemble into a gel network (
Figure 4) is an important finding, with implications on the mechanism of gel phase formation in marine systems [
36].
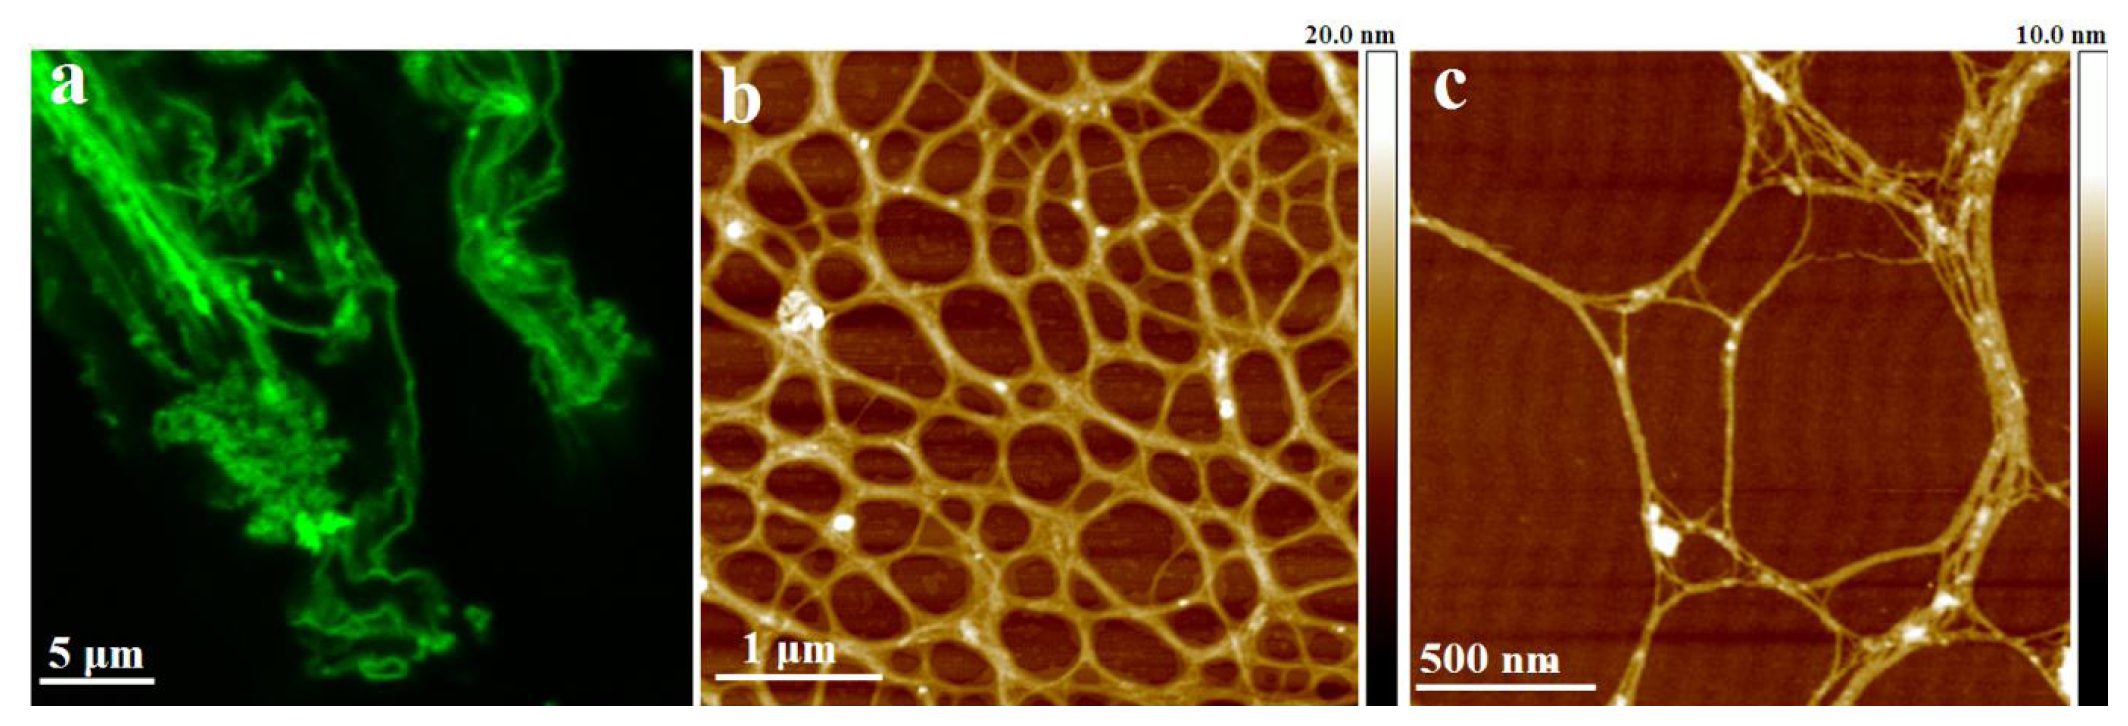
4.1. Imaging a Polysaccharide Network of Marine Gel
Development of the protocol for the AFM imaging of the marine gel phase was a critical step. The sampling procedure and specimen preparation protocol for AFM imaging is described in detail by Mišić, Radić
et al. [
34]. The main organizational features of the polymer gel network were preserved during the transfer of marine gel from seawater to a mica substrate in air. The appearance of a marine gel network at micro and nanometric scales is shown in
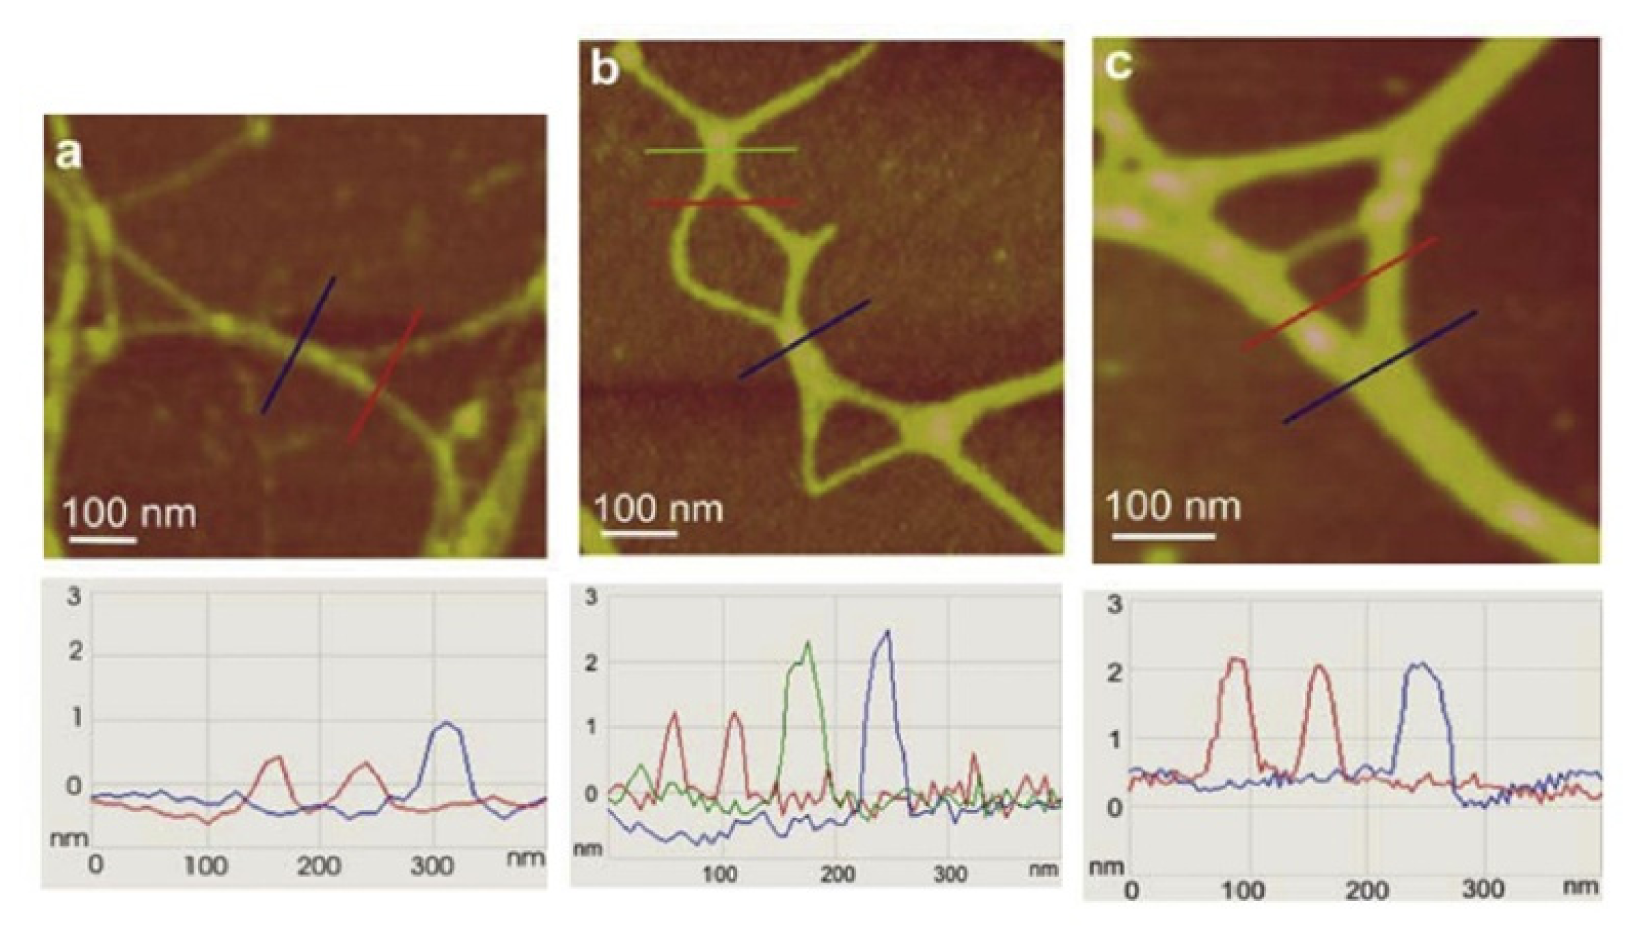
Figure 5. The gel network imaged by AFM is to a certain extent distorted from the 3D structure in the aqueous phase due to attachment and stretching on the mica surface. Nevertheless, such constraints make studies of fibril associations at the molecular level that would not be accessible by other techniques possible. AFM imaging of marine gel provided insight into the molecular organization of the gel network and associations between polysaccharide fibrils forming the network. Among the complex network structures, associations of fibrils forming junction zones were identified. Modes of fibril associations into junction zones are exemplified in
Figure 6.
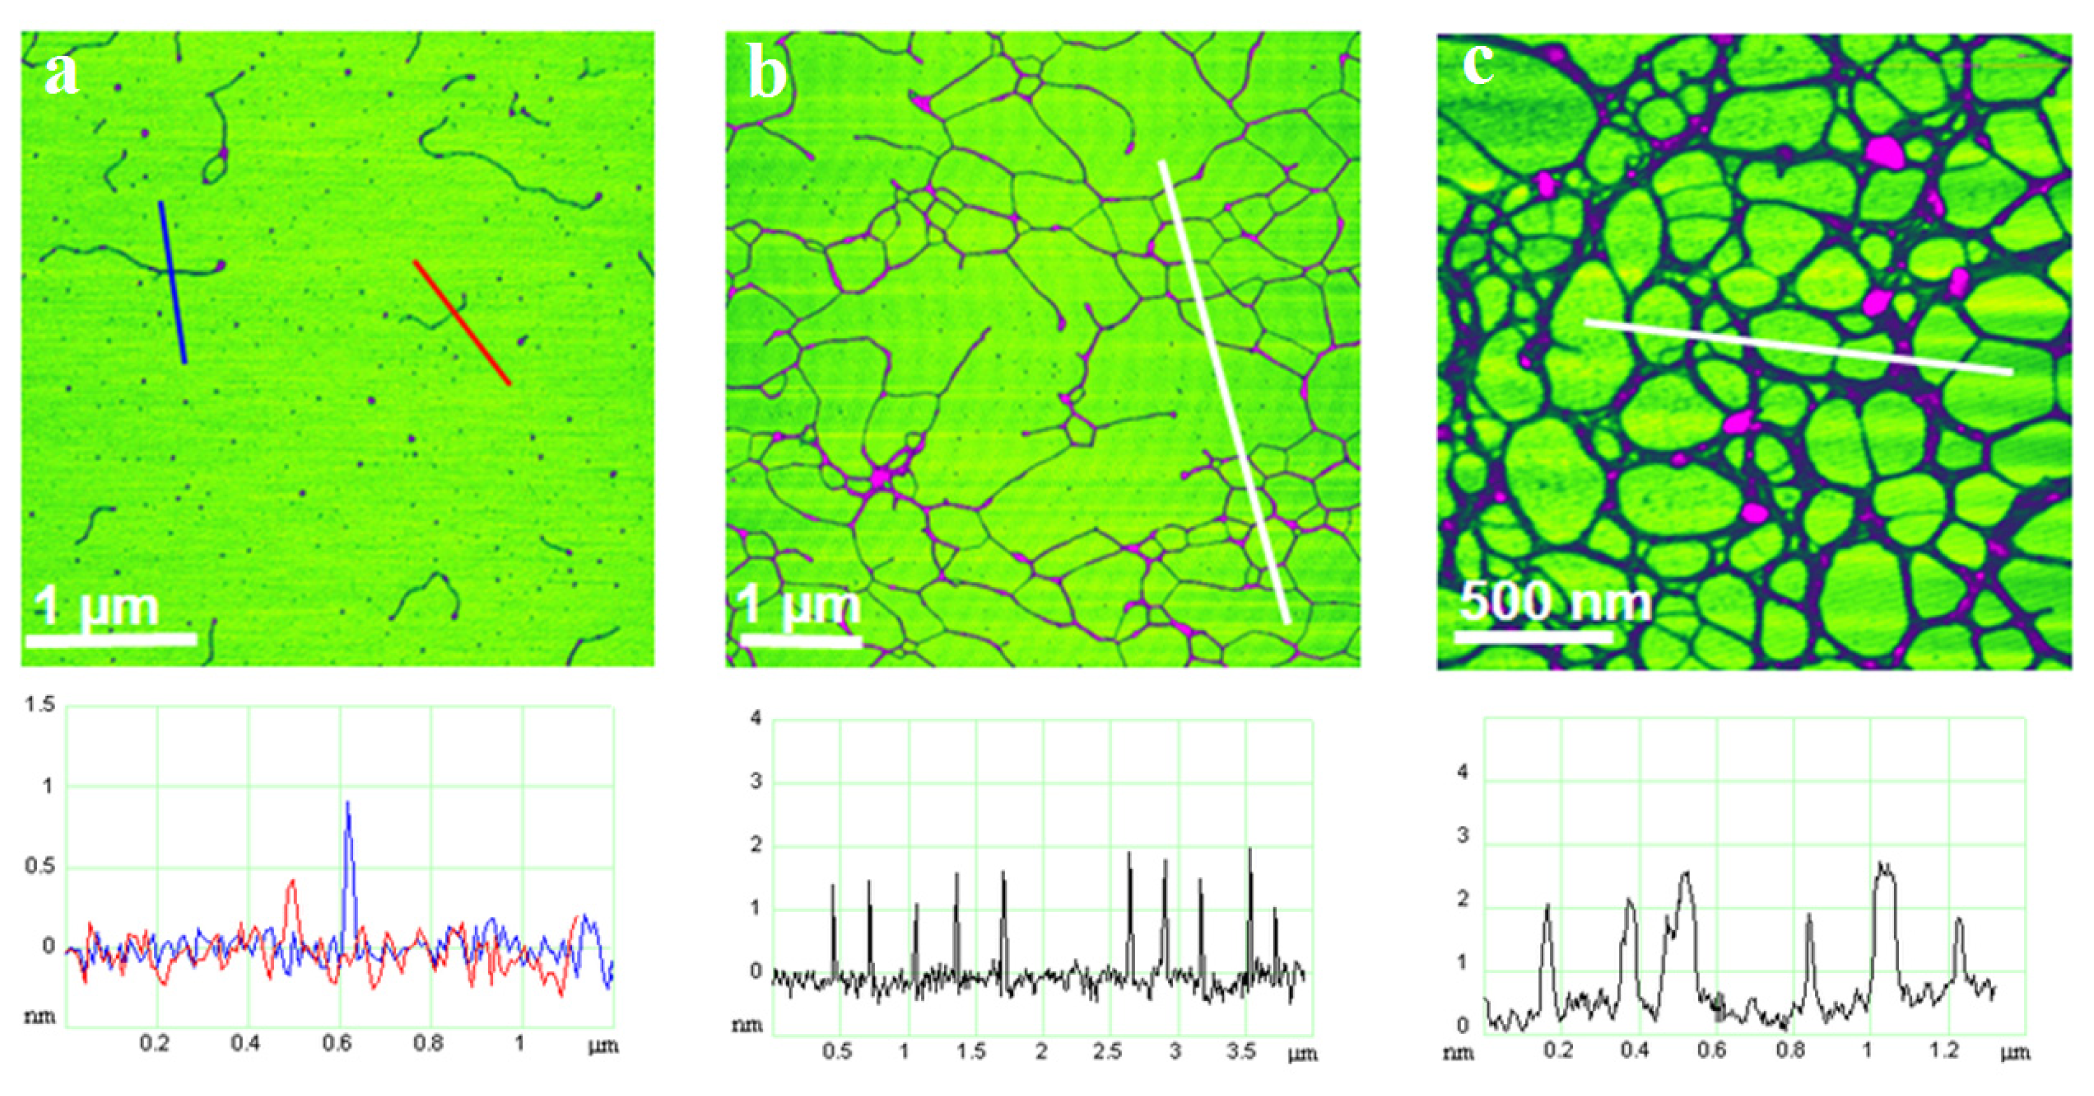
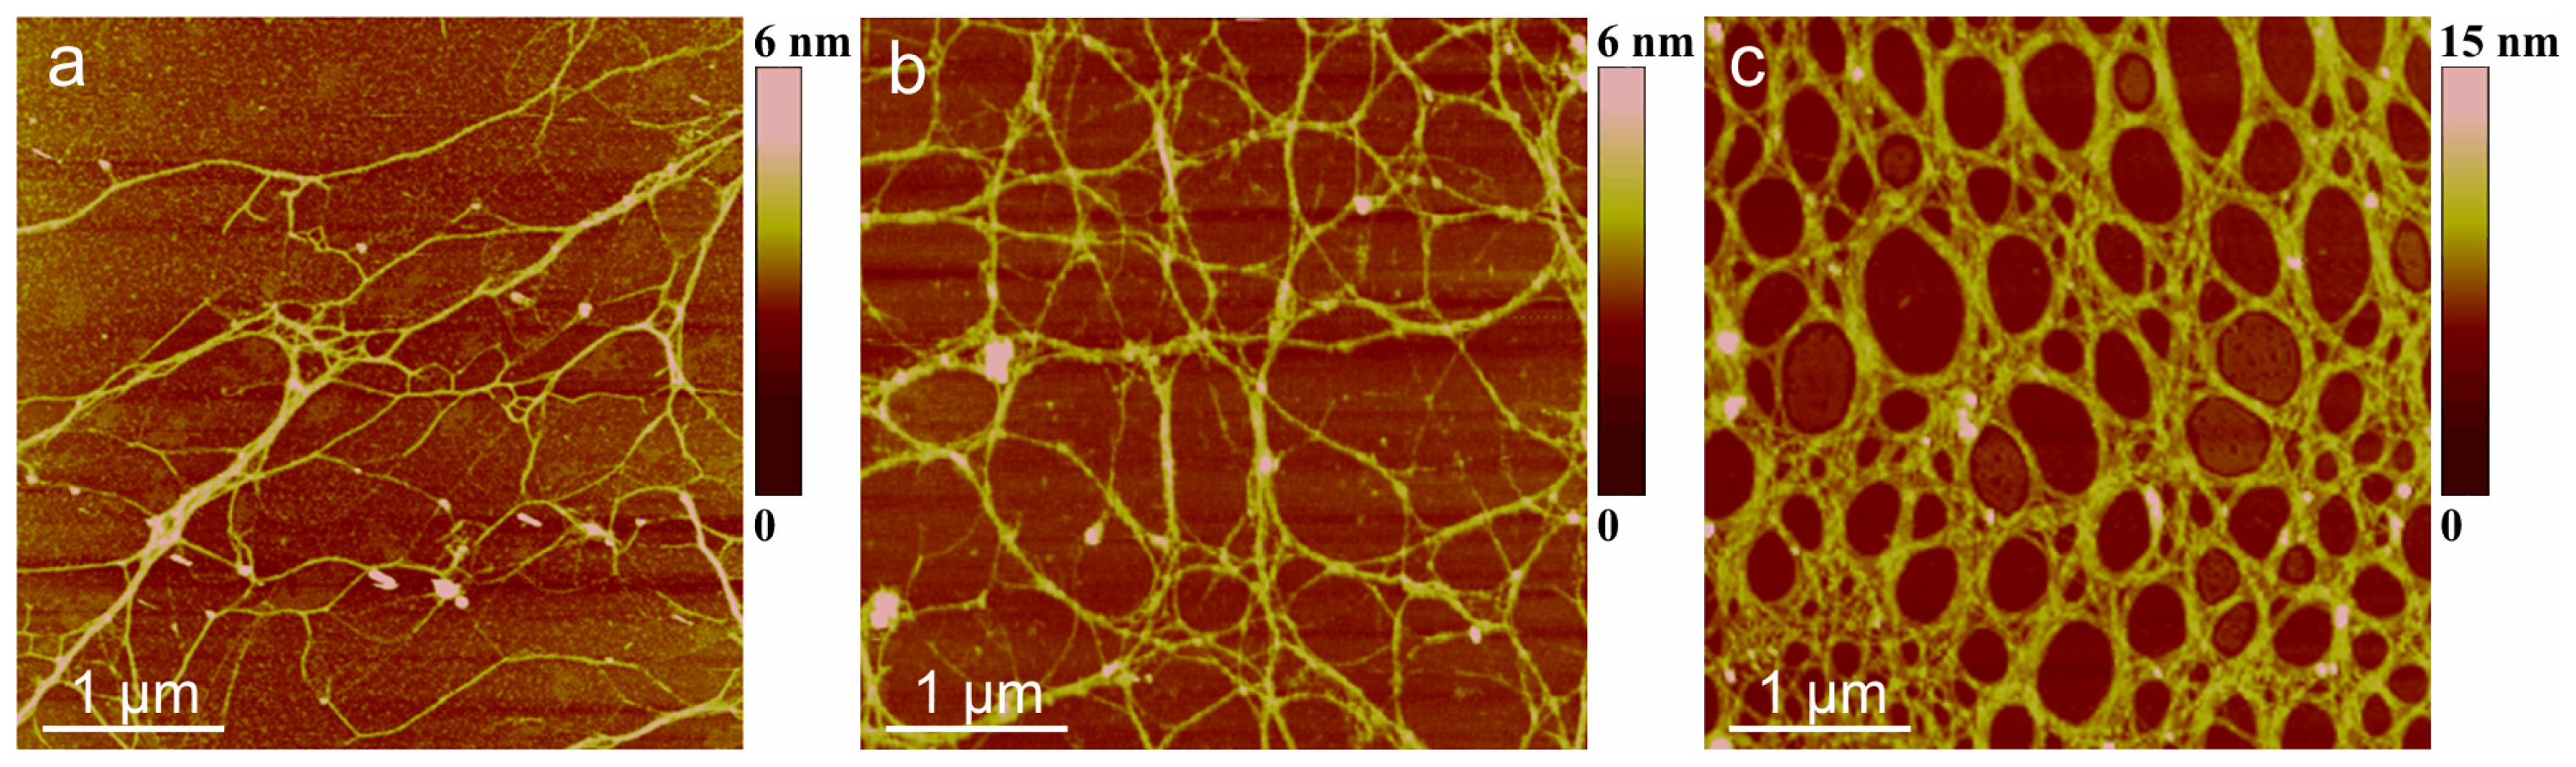
The evolution of polysaccharide fibrils into marine gel during the mucilage event in the northern Adriatic Sea was captured by AFM [
36]. The samples were prepared from macroaggregates collected after different residence times in the water column, from the early stage of gel phase formation to the condensed (mature) gel network of an older macroaggregate. The long polymer strands with small patches of initial fibril associations (
Figure 7a) coexisted with the continuous gel network shown in
Figure 7b. With a prolonged residence time (one month), a more condensed network was formed, as presented in
Figure 7c.
4.2. Force Spectroscopy of a Marine Gel Network
The knowledge of the mechanical strength of individual molecular assemblies within a marine gel network contributes to the understanding of the gel phase formation and its persistence in the marine environment. Due to the inherent complexity and heterogeneity of the marine gel phase, it is difficult to isolate the physical forces in the biopolymer network assemblies. However, based on AFM imaging and differential scanning calorimetry, the marine gel was characterized as a thermoreversible physical gel and the dominant mode of gelation was proposed to be the crosslinking of polysaccharide fibrils by hydrogen bonding, which results in helical structures and their associations [
34].
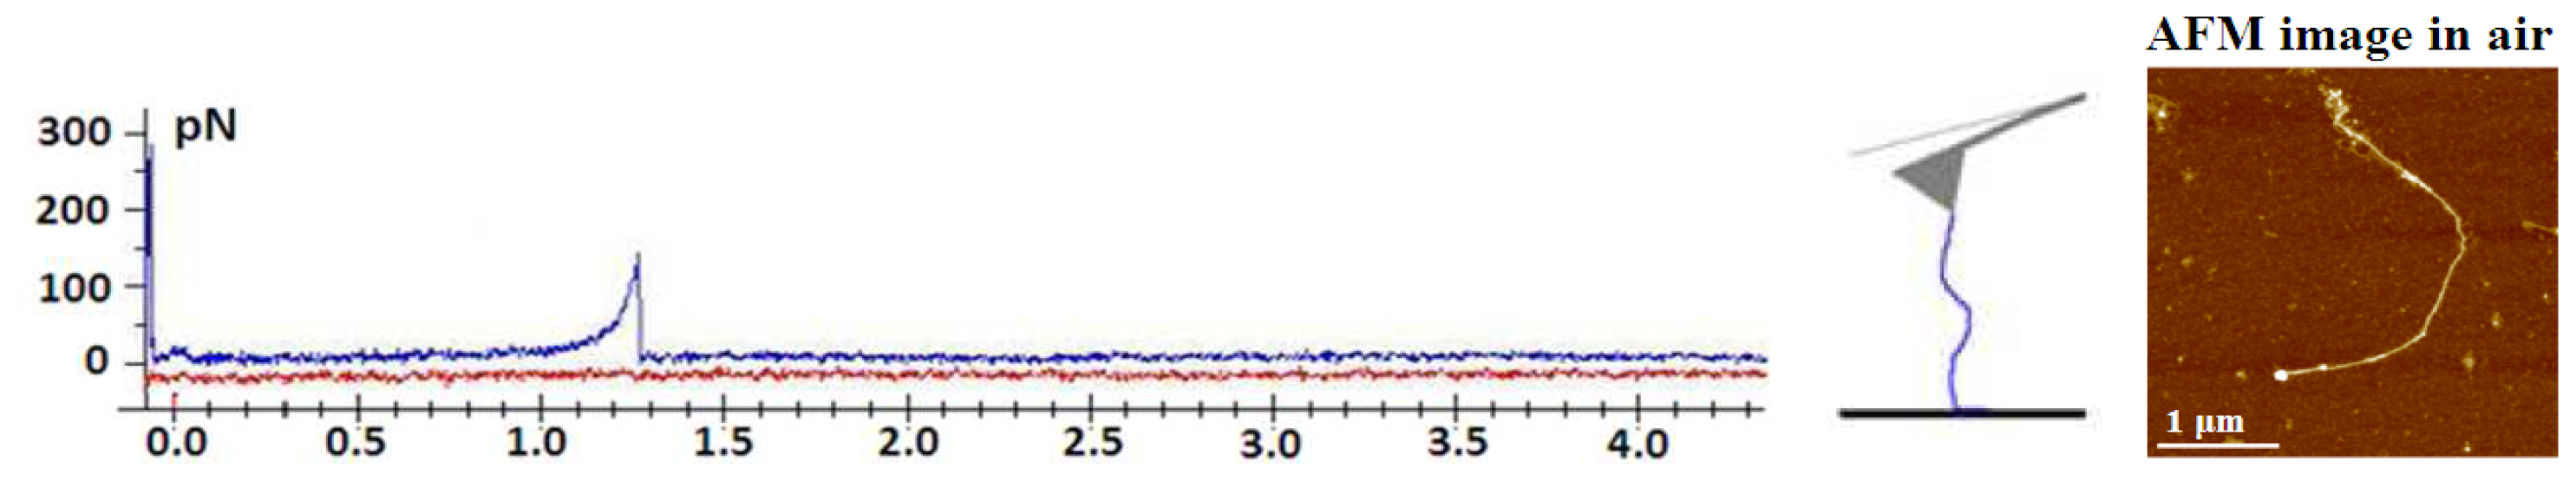
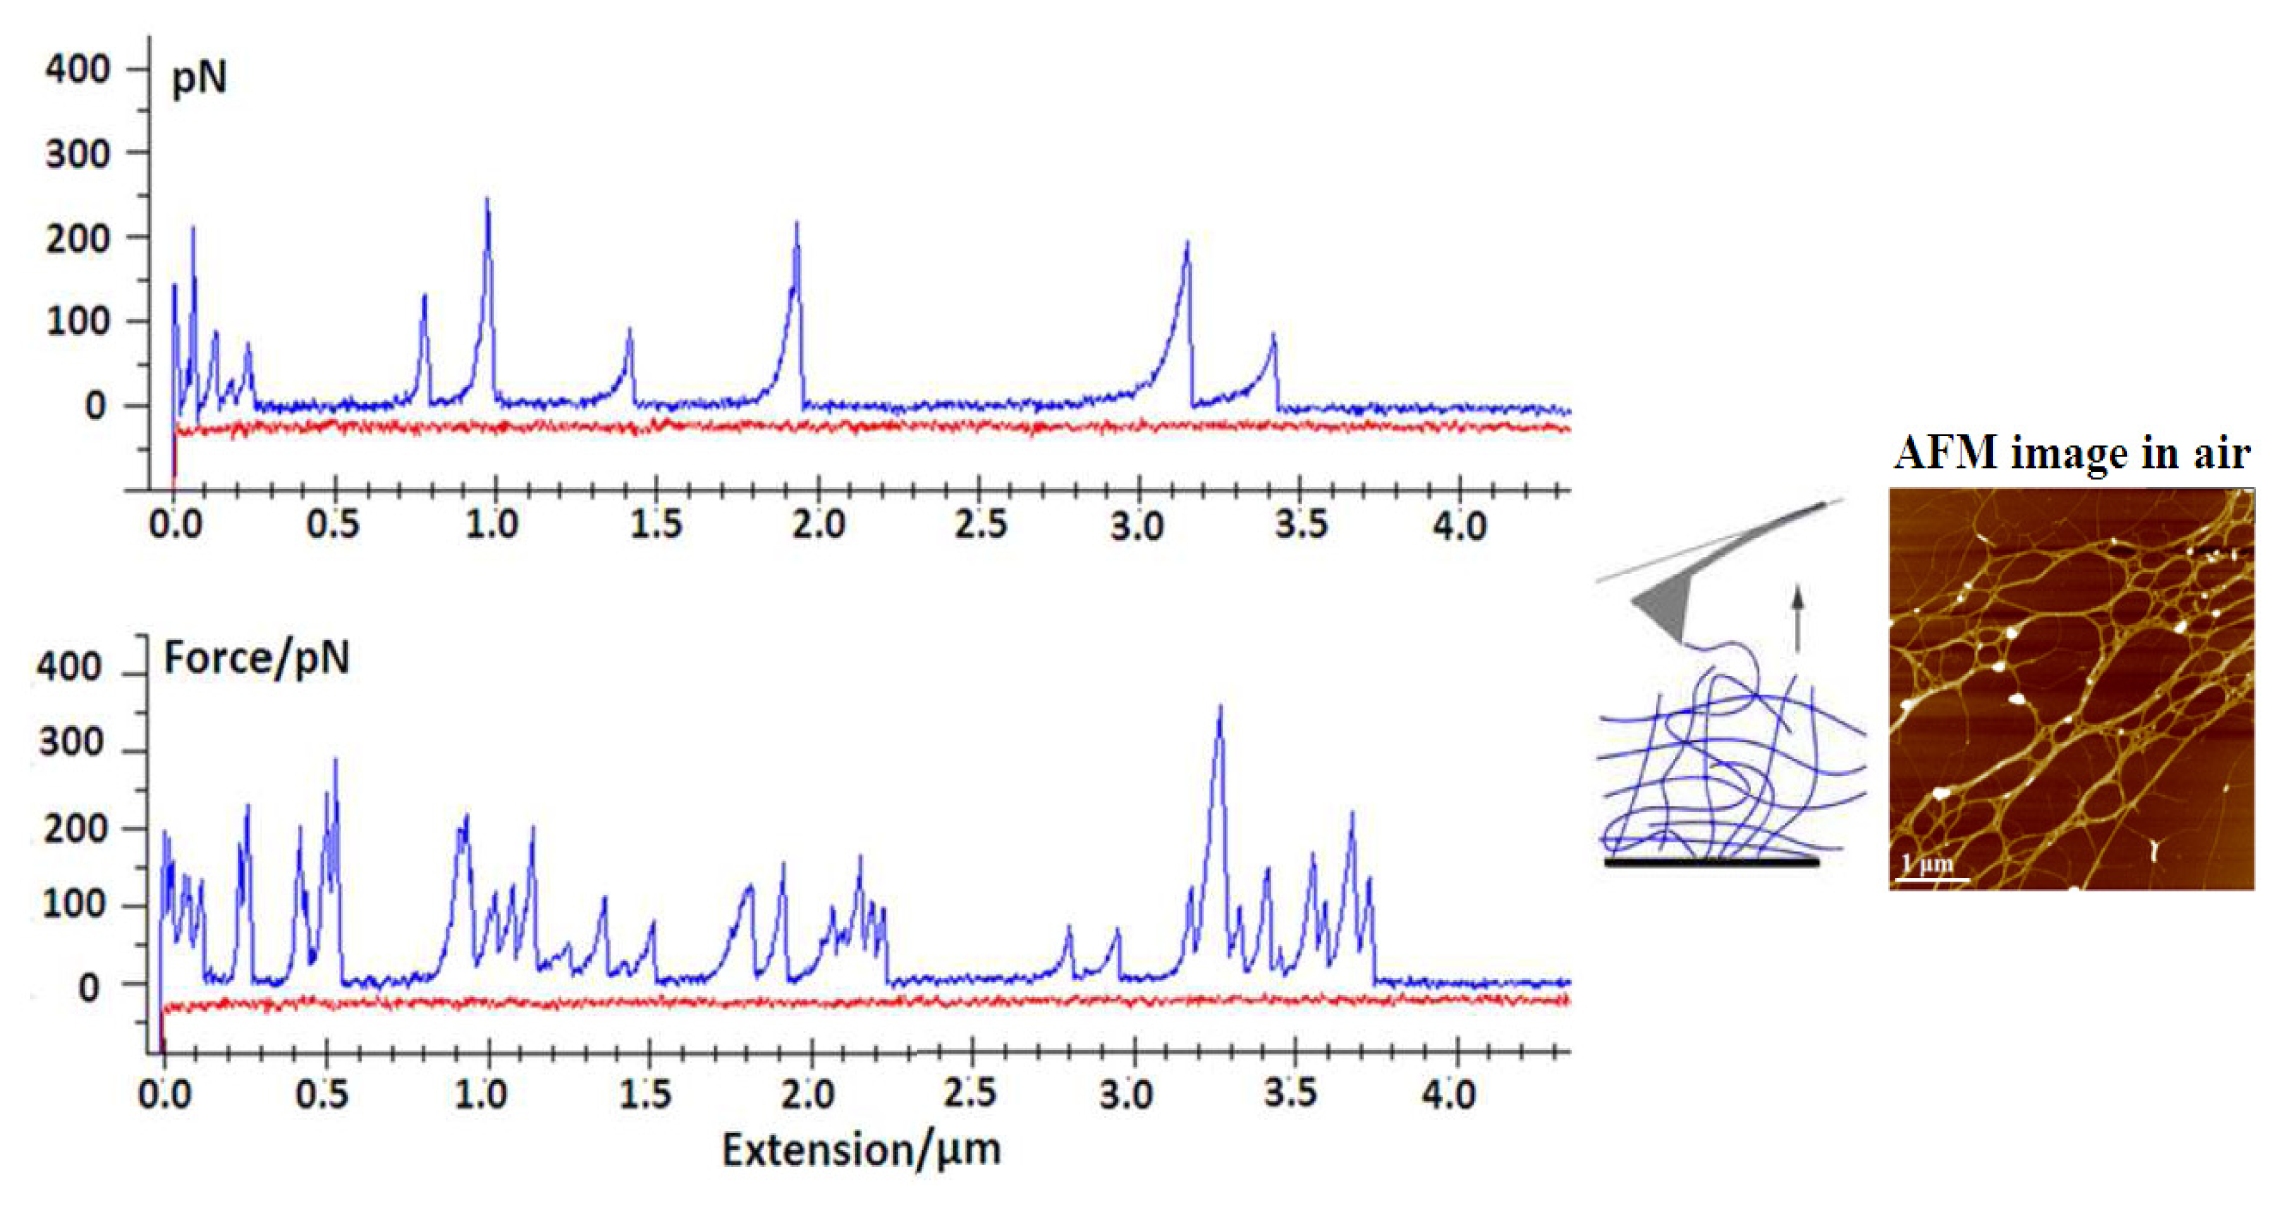
Force spectroscopy and high resolution AFM imaging were applied to quantify the intramolecular, interdomain and intermolecular forces within the marine gel network [
63,
64]. The ability to control the degree of gel network entanglements by dilution and stirring was used to probe marine polysaccharides at different levels of association. The typical events that lead to specific patterns upon stretching include the entropic behavior of individual fibrils (
Figure 8) and more complex events, such as the unfolding of polysaccharide entanglements (
Figure 9).
Marine gels are highly extensible, as they may be stretched with very little force to distances of up to several micrometers. Fairly large forces are required to unzip the fibrils, suggesting that lateral stability may be important in maintaining the structural integrity of the marine gel.
5. Conclusions
AFM made characterization of diatom polysaccharide networks at the nanometric scale and a clear distinction between the self-assembly and self-organization of these complex systems possible. Marine polysaccharides produced by diatoms are shown to form distinct supramolecular assemblies that are best described as gel networks. These photosynthetically produced macromolecules may stay attached to the cell wall or be released into the environment.
This review encompasses three specific examples of polysaccharide polymer networks attached to the diatom cell wall: (i) Cylindrotheca closterium polymers at the moment of their release; (ii) a C. closterium biofilm grown on an atomically smooth substrate and (iii) a 3D polysaccharide network enclosing a cell colony of planktonic diatom Bacteriastrum jadranum.
Extracellular polymers produced by C. closterium exhibit a certain level of self-organization, while the highest level of self-organization was found in a 3D polysaccharide network produced by B. jadranum. The polysaccharide fibrillar network of B. jadranum represents an essential part of the cell and not a random extracellular polysaccharide structure. With a more generalized use of AFM, it would probably be discovered that there are many similar types of coverings among planktonic diatoms, as well as diatoms adapted to other habitats (e.g., benthos, tychoplankton etc.). This may be additionally extended to a wider range of microalgae and protists.
In contrast to the networks attached to the diatom cells, free-floating marine gel aggregates are formed by a self-assembly of diatom-released polymers. Structural details of the gel network visualized down to the molecular level revealed monomolecular, helical and superhelical associations.
The physical forces in marine gel network assemblies have been quantified using force spectroscopy together with high resolution AFM imaging. The marine gels appeared highly extensible, as they could be stretched with very little force to distances of up to several micrometers. Such self-assembled networks with randomly distributed microscopic features and high extensibility are capable of responding to environmental conditions, such as change in salinity, temperature, pH and shear stress, maintaining favorable physiological conditions for microbial communities.
Acknowledgments
The research was supported by the Croatian Ministry of Science, Education and Sport, the project Surface Forces on an Atomic Scale Applied in Marine Science and Nanotechnology (No. 0982934-2744).
Conflicts of Interest
The authors declare no conflict of interest.
References
- Falkowski, P.; Raven, J.A. Aquatic Photosynthesis; Blackwell: Malden, MA, USA, 1997. [Google Scholar]
- Hoagland, K.D.; Rosovski, J.R.; Gretz, M.R.; Roemer, S.C. Diatom extracellular polymeric substances: Function, fine structure, chemistry and physiology. J. Phycol 1993, 29, 537–566. [Google Scholar]
- Underwood, G.J.C.; Paterson, D.M. The importance of extracellular carbohydrate production by marine epipelic diatoms. Adv. Bot. Res 2003, 40, 184–240. [Google Scholar]
- Decho, A.W. Microbial exopolymer secretions in ocean environments: Their role(s) in food webs and marine processes. Oceanogr. Mar. Biol. Annu. Rev 1990, 28, 73–153. [Google Scholar]
- Staats, N.; Stal, L.I.; de Winder, B.; Mur, L.R. Oxygenic photosynthesis as driving process in exopolysaccharide production of benthic diatoms. Mar. Ecol. Prog. Ser 2000, 193, 261–269. [Google Scholar]
- Myklestad, S.M. Release of extracellular products by phytoplankton with special emphasis on polysaccharides. Sci. Total Environ 1995, 165, 155–164. [Google Scholar]
- Vollenweider, R.; Rinaldi, A. Marine mucilages. Sci. Total Environ 1995, 165, 1–235. [Google Scholar]
- Giani, M.; Degobbis, D.; Rinaldi, A. Mucilages in the Adriatic and Tyrrhenian Seas. Sci. Total Environ 2005, 353, 1–379. [Google Scholar]
- Müller-Niklas, G.; Schuster, S.; Kaltenbök, E.; Herndl, G.J. Organic content and bacterial metabolism in amorphous aggregations of the northern Adriatic Sea. Limnol. Oceanogr 1994, 39, 58–68. [Google Scholar]
- Rinaudo, M. Advances in Characterization of Polysaccharides in Aqueous Solution and Gel State. In Polysaccharides-Structural Diversity and Functional Versatiliy; Dumitriu, S., Ed.; Marcel Dekker: New York, NY, USA, 2005; pp. 237–252. [Google Scholar]
- Israelachvili, J.N. Intermolecular and Surface Forces, 3rd ed; Academic Press: London, UK, 2010. [Google Scholar]
- Dimitriu, S. Polysaccharides: Structural Diversity and Functional Versatility, 2nd ed; Marcel Dekker: New York, NY, USA, 2005. [Google Scholar]
- Cesàro, A.; Bellich, B.; Borgogna, M. Biophysical functionality in polysaccharides: From Lego-blocks to nano-particles. Eur. Biophys. J 2012, 41, 379–395. [Google Scholar]
- Higgins, M.J.; Wetherbee, R. The Role of Atomic Force Microscopy in Advancing Diatom Research into the Nanotechnology Era. In Life at the Nanoscale: Atomic Force Microscopy of Live Cells; Dufrene, Y., Ed.; Pan Stanford Publishing; Singapore, 2011; pp. 405–420. [Google Scholar]
- Eaton, P.; West, P. Atomic Force Microscopy; Oxford University Press: New York, NY, USA, 2010. [Google Scholar]
- Jena, B.P.; Hörber, J.K.H. Force Microscopy: Applications in Biology and Medicine; John Wiley & Sons: New York, NY, USA, 2006. [Google Scholar]
- Dufrene, Y. Life at the Nanoscale: Atomic Force Microscopy of Live Cells; Pan Stanford Publishing: Singapore, 2011. [Google Scholar]
- Zhang, W.; Zhang, X. Single molecule mechanochemistry of macromolecules. Prog. Polym. Sci 2003, 28, 1271–1295. [Google Scholar]
- Akai, A. Review on: Atomic force microscopy applied to nano-mechanics of the cell. Adv. Biochem. Eng. Biotechnol 2010, 119, 47–61. [Google Scholar]
- Bustamante, C.; Macosko, J.C.; Wuite, G.J. Grabbing the cat by the tail: Manipulating molecules one by one. Nat. Rev. Mol. Cell Biol 2000, 1, 130–136. [Google Scholar]
- Noy, A. Handbook of Molecular Force Spectroscopy; Springer: Livermore, CA, USA, 2007. [Google Scholar]
- Giannotti, M.I.; Vancso, G.J. Interrogation of single synthetic polymer chains and polysaccharides by AFM-based force spectroscopy. Chem. Phys. Chem 2007, 8, 2290–2307. [Google Scholar]
- Zhang, X.; Liu, C.; Wang, Z. Force spectroscopy of polymers: Studying on intramolecular and intermolecular interactions in single molecular level. Polymer 2008, 49, 3353–3361. [Google Scholar]
- Kirby, A.R.; Gunning, A.P.; Morris, V.J. Imaging polysaccharides by atomic force microscopy. Biopolymers 1996, 38, 355–366. [Google Scholar]
- Morris, V.J.; Kirby, A.R.; Gunning, A.P. Atomic Force Microscopy for Biologists; Imperial College Press: London, UK, 1999. [Google Scholar]
- Abu-Lail, N.I.; Camesano, T.A. Polysaccharide properties probed with atomic force microscopy. J. Microsc. 2003, 212, 217–238. [Google Scholar]
- Abu-Lail, N.I.; Camesano, T.A. Atomic Force Microscope and Single-Molecule Force Microscopy Studies of Biopolymers. In Dekker Encyclopedia of Nanoscience and Nanotechnology; Schwarz, J., Contescu, C., Putyera, K., Eds.; Taylor & Francis: London, UK, 2004; pp. 119–131. [Google Scholar]
- McIntire, T.M.; Brant, D.A. Imaging of individual biopolymers and supramolecular assemblies using noncontact atomic force microscopy. Biopolymers 1997, 42, 133–146. [Google Scholar]
- Ikeda, S.; Morris, V.J.; Nishinari, K. Microstructure of aggregated and nonaggregated kappa-carrageenan helices visualized by atomic force microscopy. Biomacromolecules 2001, 2, 1331–1337. [Google Scholar]
- Keresztes, Z.; Rigó, T.; Telegdi, J.; Kálmán, E. Investigation of biopolymer networks by means of AFM. Appl. Phys. A 2001, 72, 113–116. [Google Scholar]
- Funami, T.; Hiroe, M.; Noda, S.; Asai, I.; Ikeda, S.; Nishimari, K. Influence of molecular structure imaged with atomic force microscopy on the rheological behavior of carrageenan aqueous systems in the presence or absence of cations. Food Hydrocolloids 2007, 21, 617–629. [Google Scholar]
- Noda, S.; Funami, T.; Nakauma, M.; Asai, I.; Takahashi, R.; Al-Assaf, S.; Ikeda, S. Molecular structures of gellan gum imaged with atomic force microscopy in relation to the rheological behavior in aqueous systems. 1. Gellan gum with various acyl contents in the presence and absence of potassium. Food Hydrocolloids 2008, 22, 1148–1159. [Google Scholar]
- Svetličić, V.; Balnois, E.; Žutić, V.; Chevalet, J.; Hozić Zimmermann, A.; Kovač, S.; Vdović, N. Electrochemical detection of gel microparticles in seawater. Croat. Chem. Acta 2006, 79, 107–113. [Google Scholar]
- Mišić Radić, T.; Svetličić, V.; Žutić, V.; Boulgaropoulos, B. Seawater at the nanoscale: Marine gel imaged by atomic force microscopy. J. Mol. Recognit 2011, 24, 397–405. [Google Scholar]
- Pletikapić, G.; Mišić Radić, T.; Hozić Zimmermann, A.; Svetličić, V.; Pfannkuchen, M.; Marić, D.; Godrijan, J.; Žutić, V. Extracellular polymer release AFM imaging of extracellular polymer release by marine diatom Cylindrotheca closterium (Ehrenberg) Reiman & J.C. Lewin. J. Mol. Recognit 2011, 24, 436–445. [Google Scholar]
- Svetličić, V.; Žutić, V.; Mišić Radić, T.; Pletikapić, G.; Hozić Zimmerman, A.; Urbani, R. Polymer networks produced by marine diatoms in the northern Adriatic Sea. Mar. Drugs 2011, 9, 666–679. [Google Scholar]
- Pletikapić, G.; Berquand, A.; Mišić Radić, T.; Svetličić, V. Quantitative nanomechanical mapping of marine diatom. J. Phycol 2012, 48, 174–185. [Google Scholar]
- Pletikapić, G.; Vinković Vrček, I.; Žutić, V.; Svetličić, V. Atomic force microscopy characterization of silver nanoparticles interactions with marine diatom cells and extracellular polymeric substance. J. Mol. Recognit 2012, 25, 309–317. [Google Scholar]
- Bosak, S.; Pletikapić, G.; Hozić, A.; Svetličić, V.; Sarno, D.; Viličić, D. A novel type of colony formation in marine planktonic diatoms revealed by atomic force microscopy. PLoS One 2012, 7, e44851. [Google Scholar]
- Higgins, M.J.; Crawford, S.A.; Mulvaney, P.; Wetherbee, R. Characterization of the adhesive mucilages secreted by live diatom cells using atomic force microscopy. Protist 2002, 153, 25–38. [Google Scholar]
- Higgins, M.J.; Molino, P.; Mulvaney, P.; Wetherbee, R. The structure and nanomechanical properties of the adhesive mucilage that mediates diatom-substratum adhesion and motility. J. Phycol. 2003, 39, 1181–1193. [Google Scholar]
- Higgins, M.J.; Sader, J.E.; Mulvaney, P.; Wetherbee, R. Probing the surface of living diatoms with atomic force microscopy: The nanostructure and nanomechanical properties of the mucilage layer. J. Phycol. 2003, 39, 722–734. [Google Scholar]
- Dugdale, T.M.; Dagastine, R.; Chiovitti, A.; Mulvaney, P.; Wetherbee, R. Single adhesive nanofibres from a live diatom have the signature fingerprint of modular proteins. Biophys. J 2005, 89, 4252–4260. [Google Scholar]
- Dugdale, T.M.; Dagastine, R.; Chiovitti, A.; Wetherbee, R. Diatom adhesive mucilage contains distinct supramolecular assemblies of a single modular protein. Biophys. J 2006, 90, 2987–2993. [Google Scholar]
- Dugdale, T.M.; Willis, A.; Wetherbee, R. Adhesive modular proteins occur in the extracellular mucilage of the motile, pennate diatom phaeodactylum tricornutum. Biophys. J 2006, 90, L58–L60. [Google Scholar]
- Rief, M.; Gautel, M.; Oesterhelt, F.; Fernandez, J.M.; Gaub, H.E. Reversible unfolding of individual titin immunoglobulin domains by AFM. Science 1997, 16, 1109–1112. [Google Scholar]
- Arce, F.T.; Avci, R.; Beech, I.B.; Cooksey, K.E.; Wigglesworth-Cooksey, B. A live bioprobe for studying diatom-surface interactions. Biophys. J 2004, 87, 4284–4297. [Google Scholar]
- Staats, N.; de Winder, B.; Stal, L.J.; Mur, L.R. Isolation and characterization of extracellular polysaccharides from the epipelic diatoms Cylindrotheca closterium and Navicula salinarum. Eur. J. Phycol 1999, 34, 161–169. [Google Scholar]
- Staats, N.; Stal, L.J.; Mur, L.R. Exopolysaccharide production by the epipelic diatom Cylindrotheca closterium: Effects of nutrient conditions. J. Exp. Mar. Biol. Ecol 2000, 249, 13–27. [Google Scholar]
- Alcoverro, T.; Conte, E.; Mazzella, L. Production of mucilage by the Adriatic epipelic diatom Cylindrotheca closterium (Bacillariophyceae) under nutrient limitation. J. Phycol 2000, 36, 1087–1095. [Google Scholar]
- Smith, D.J.; Underwood, G.J.C. Production of extracellular carbohydrates by estuarine benthic diatoms: The effects of growth phase and light and dark treatment. J. Phycol 2000, 36, 321–333. [Google Scholar]
- De Brouwer, J.F.C.; Stal, L.J. Daily fluctuations of exopolymers in cultures of the benthic diatoms Cylindrotheca closterium and Nitzschia sp. (Bacillariophyceae). J. Phycol 2002, 38, 464–472. [Google Scholar]
- Pletikapić, G. Nanomechanical Properties of Diatom Cell Surfaces and Extracellular Polymers. Ph.D. Thesis, University of Zagreb, Zagreb, Croatia, March 2013. [Google Scholar]
- Stal, L.J.; de Brouwer, J.F.C. Biofilm formation by benthic diatoms and their influence on the stabilization of intertidal mudflats. Berichte-Forschungszentrum Terramare 2003, 12, 109–111. [Google Scholar]
- Shchipunov, Y.A. Sol-gel-derived biomaterials of silica and carrageenans. J. Colloid Interface Sci 2003, 268, 68–76. [Google Scholar]
- Shchipunov, Y.A.; Kojima, A.; Imae, T. Polysaccharides as a template for silicate generated by sol-gel processes. J. Colloid Interface Sci 2005, 285, 574–580. [Google Scholar]
- Godrijan, J.; Marić, D.; Imešek, M.; Janeković, I.; Schweikert, M.; Pfannkuchen, M. Diversity, occurrence, and habitats of the diatom genus Bacteriastrum (Bacillariophyta) in the northern Adriatic Sea, with the description of B. jadranum sp. nov. Bot. Mar 2012, 55, 1–12. [Google Scholar]
- Sarno, D.; Zingone, A.; Marino, D. Bacteriastrum parallelum sp. nov., a new diatom from the Gulf of Naples, and new observations on B. furcatum (Chaetocerotaceae, Bacillariophyta). Phycologia 1997, 36, 257–266. [Google Scholar]
- Verdugo, P.; Alldredge, A.L.; Azam, F.; Kirchman, D.L.; Passow, U.; Santschi, P.H. The oceanic gel phase: A bridge in the DOM-POM continuum. Mar. Chem 2004, 92, 67–85. [Google Scholar]
- Santschi, P.H.; Balnois, E.; Wilkinson, K.J.; Zhang, J.; Buffle, J. Fibrillar polysaccharides in marine macromolecular organic matter as imaged by atomic force microscopy and transmission electron microscopy. Limnol. Oceanogr 1998, 43, 896–908. [Google Scholar]
- Svetličić, V.; Žutić, V.; Hozić Zimmermann, A. Biophysical scenario of giant gel formation in the northern Adriatic Sea. Ann. N. Y. Acad 2005, 1048, 524–527. [Google Scholar]
- Mišić; Radić, T. Supramolecular organization of marine gel biopolymers studied by atomic force microscopy. Ph.D. Thesis, University of Zagreb, Zagreb, Croatia, October 2010. [Google Scholar]
- Urbani, R.; Sist, P.; Pletikapić, G.; Mišić Radić, T.; Svetličić, V.; Žutić, V. Diatom Polysaccharides: Extracellular Production, Isolation and Molecular Characterization. In The Complex World of Polysaccharide; Karunaratn, D.N., Ed.; Intech: Rijeka, Croatia, 2012; pp. 346–356. [Google Scholar]
- Svetličić, V.; Pletikapić, G.; Mišić Radić, T.; Kellermayer, M.S.Z.; Brujić, J. Force spectroscopy of marine polysaccharides: From gel networks to individual fibrils. Technical Report for AFMBiomed Conference, Shanghai, China, May 2013.
© 2013 by the authors; licensee MDPI, Basel, Switzerland This article is an open access article distributed under the terms and conditions of the Creative Commons Attribution license (http://creativecommons.org/licenses/by/3.0/).


