Article

Epigenetic Silencing of DKK3 in Medulloblastoma

1
Department of Experimental Medicine (DIMES), University of Genoa-IRCCS A.O.U. San Martino–IST National Cancer Research Institute, Genoa 16132, Italy
2
Laboratory of Tumor Genetics and Epigenetics, IRCCS A.O.U. San Martino–IST National Cancer Research Institute, Genoa 16132, Italy
3
Center of Physiopathology of Human Reproduction, Obstetrics and Gynecology Unit, IRCCS A.O.U. San Martino–IST National Cancer Research Institute, Genoa 16132, Italy
4
Division of Pediatric Neurooncology, German Cancer Research Center (DKFZ), Heidelberg 69120, Germany
5
Department of Pediatric Oncology, Hematology & Immunology, Heidelberg University Hospital, Heidelberg 69120, Germany
6
CNRS-LAMSADE Laboratoire d'Analyse et Modélisation de Systèmes pour l'Aide à la decision Paris 75775, France
7
Université Paris-Dauphine, Paris 75775, France
8
Developmental & Stem Cell Biology Program, the Hospital for Sick Children, Toronto M5G 1X8, Canada
9
Institute of Digestive Disease, Faculty of Medicine, The Chinese University of Hong Kong, Hong Kong
10
Division of Biostatistics German Cancer Research Center (DKFZ), Heidelberg 69120, Germany
11
Division of Pediatric Oncology, Catholic University, Rome 00198, Italy
12
CEINGE, Centro di Ingegneria Genetica e Biotecnologia Avanzate, Naples 80145, Italy
13
Pediatric Neurosurgery, Santobono-Pausilipon Children's Hospital, Naples 80122, Italy
14
Department of Pediatric Oncology and Hematology, University Children's Hospital of Cologne, Cologne 50924, Germany
15
Laboratory of Neuroblastoma, Onco/Hematology Laboratory Department SDB University of Padua, Pediatric Research Institute, Padua 35127, Italy
16
Lung Cancer Unit IRCSS San Martino Hospital-IST National Cancer Research Institute, Genoa 16132, Italy
*
Author to whom correspondence should be addressed.
These authors contributed equally to this work.
Int. J. Mol. Sci. 2013, 14(4), 7492-7505; https://0-doi-org.brum.beds.ac.uk/10.3390/ijms14047492
Submission received: 6 February 2013 / Revised: 25 March 2013 / Accepted: 27 March 2013 / Published: 8 April 2013
(This article belongs to the Special Issue Advances in Cancer Diagnosis)

Abstract

:
Medulloblastoma (MB) is a malignant pediatric brain tumor arising in the cerebellum consisting of four distinct subgroups: WNT, SHH, Group 3 and Group 4, which exhibit different molecular phenotypes. We studied the expression of Dickkopf (DKK) 1–4 family genes, inhibitors of the Wnt signaling cascade, in MB by screening 355 expression profiles derived from four independent datasets. Upregulation of DKK1, DKK2 and DKK4 mRNA was observed in the WNT subgroup, whereas DKK3 was downregulated in 80% MBs across subgroups with respect to the normal cerebellum (p < 0.001). Since copy number aberrations targeting the DKK3 locus (11p15.3) are rare events, we hypothesized that epigenetic factors could play a role in DKK3 regulation. Accordingly, we studied 77 miRNAs predicting to repress DKK3; however, no significant inverse correlation between miRNA/mRNA expression was observed. Moreover, the low methylation levels in the DKK3 promoters (median: 3%, 5% and 5% for promoter 1, 2 and 3, respectively) excluded the downregulation of gene expression by methylation. On the other hand, the treatment of MB cells with Trichostatin A (TSA), a potent inhibitor of histone deacetylases (HDAC), was able to restore both DKK3 mRNA and protein. In conclusion, DKK3 downregulation across all MB subgroups may be due to epigenetic mechanisms, in particular, through chromatin condensation.

1. Introduction

Medulloblastoma (MB) is a highly malignant embryonic tumor of the cerebellum and accounts for 20% of all intracranial tumors of childhood [1]. Although MB has been considered a unique disease, several studies demonstrated remarkable intertumor heterogeneity, suggesting distinct molecular subgroups [25]. Current patient risk stratification is based on clinical factors (age at diagnosis, metastatic disease and extent of resection), as well as histological subgroups (classic, desmoplastic, large cell anaplastic MB) [6]. The current consensus is that there are four major subgroups, named WNT, SHH, Group 3 and Group 4 [7,8].
Deregulation of Wingless (Wnt), Sonic Hedgehog (SHH) and Notch signaling pathways play a critical role in MB pathogenesis [9]. Two main classes of Wnt signaling antagonists have been discovered; both prevent the ligand-receptor interaction. The first class binds Wnt proteins and includes the secreted Frizzled-related protein (sFRP) family, Wnt inhibitory factor-1 (WIF-1) and Cerberus. The second class comprises members of DKK family, which bind one subunit of the Wnt receptor complex [10,11]. Members of DKK and sFRP gene families have been reported to act as tumor suppressor genes in several malignancies [1216]. The epigenetic downregulation of DKK1 in MB tumors and cell lines was first described by Vibhakar et al.[17]. In this tumor, inhibitors of histone deacetylases (HDAC), such as Trichostatin A (TSA), have been reported to induce re-expression of several genes, including CASP8 and DKK1[1719].
However, a comprehensive study on DKK family gene regulation in MB has not been published yet. In the present study, we show for the first time that DKK3 gene is significantly downregulated in all MB subgroups as compared to normal cerebellum, whereas DKK1, DKK2 and DKK4 are overexpressed in WNT tumors. Moreover, we investigated the mechanisms of DKK3 regulation and found that epigenetics is a key regulator of this gene.

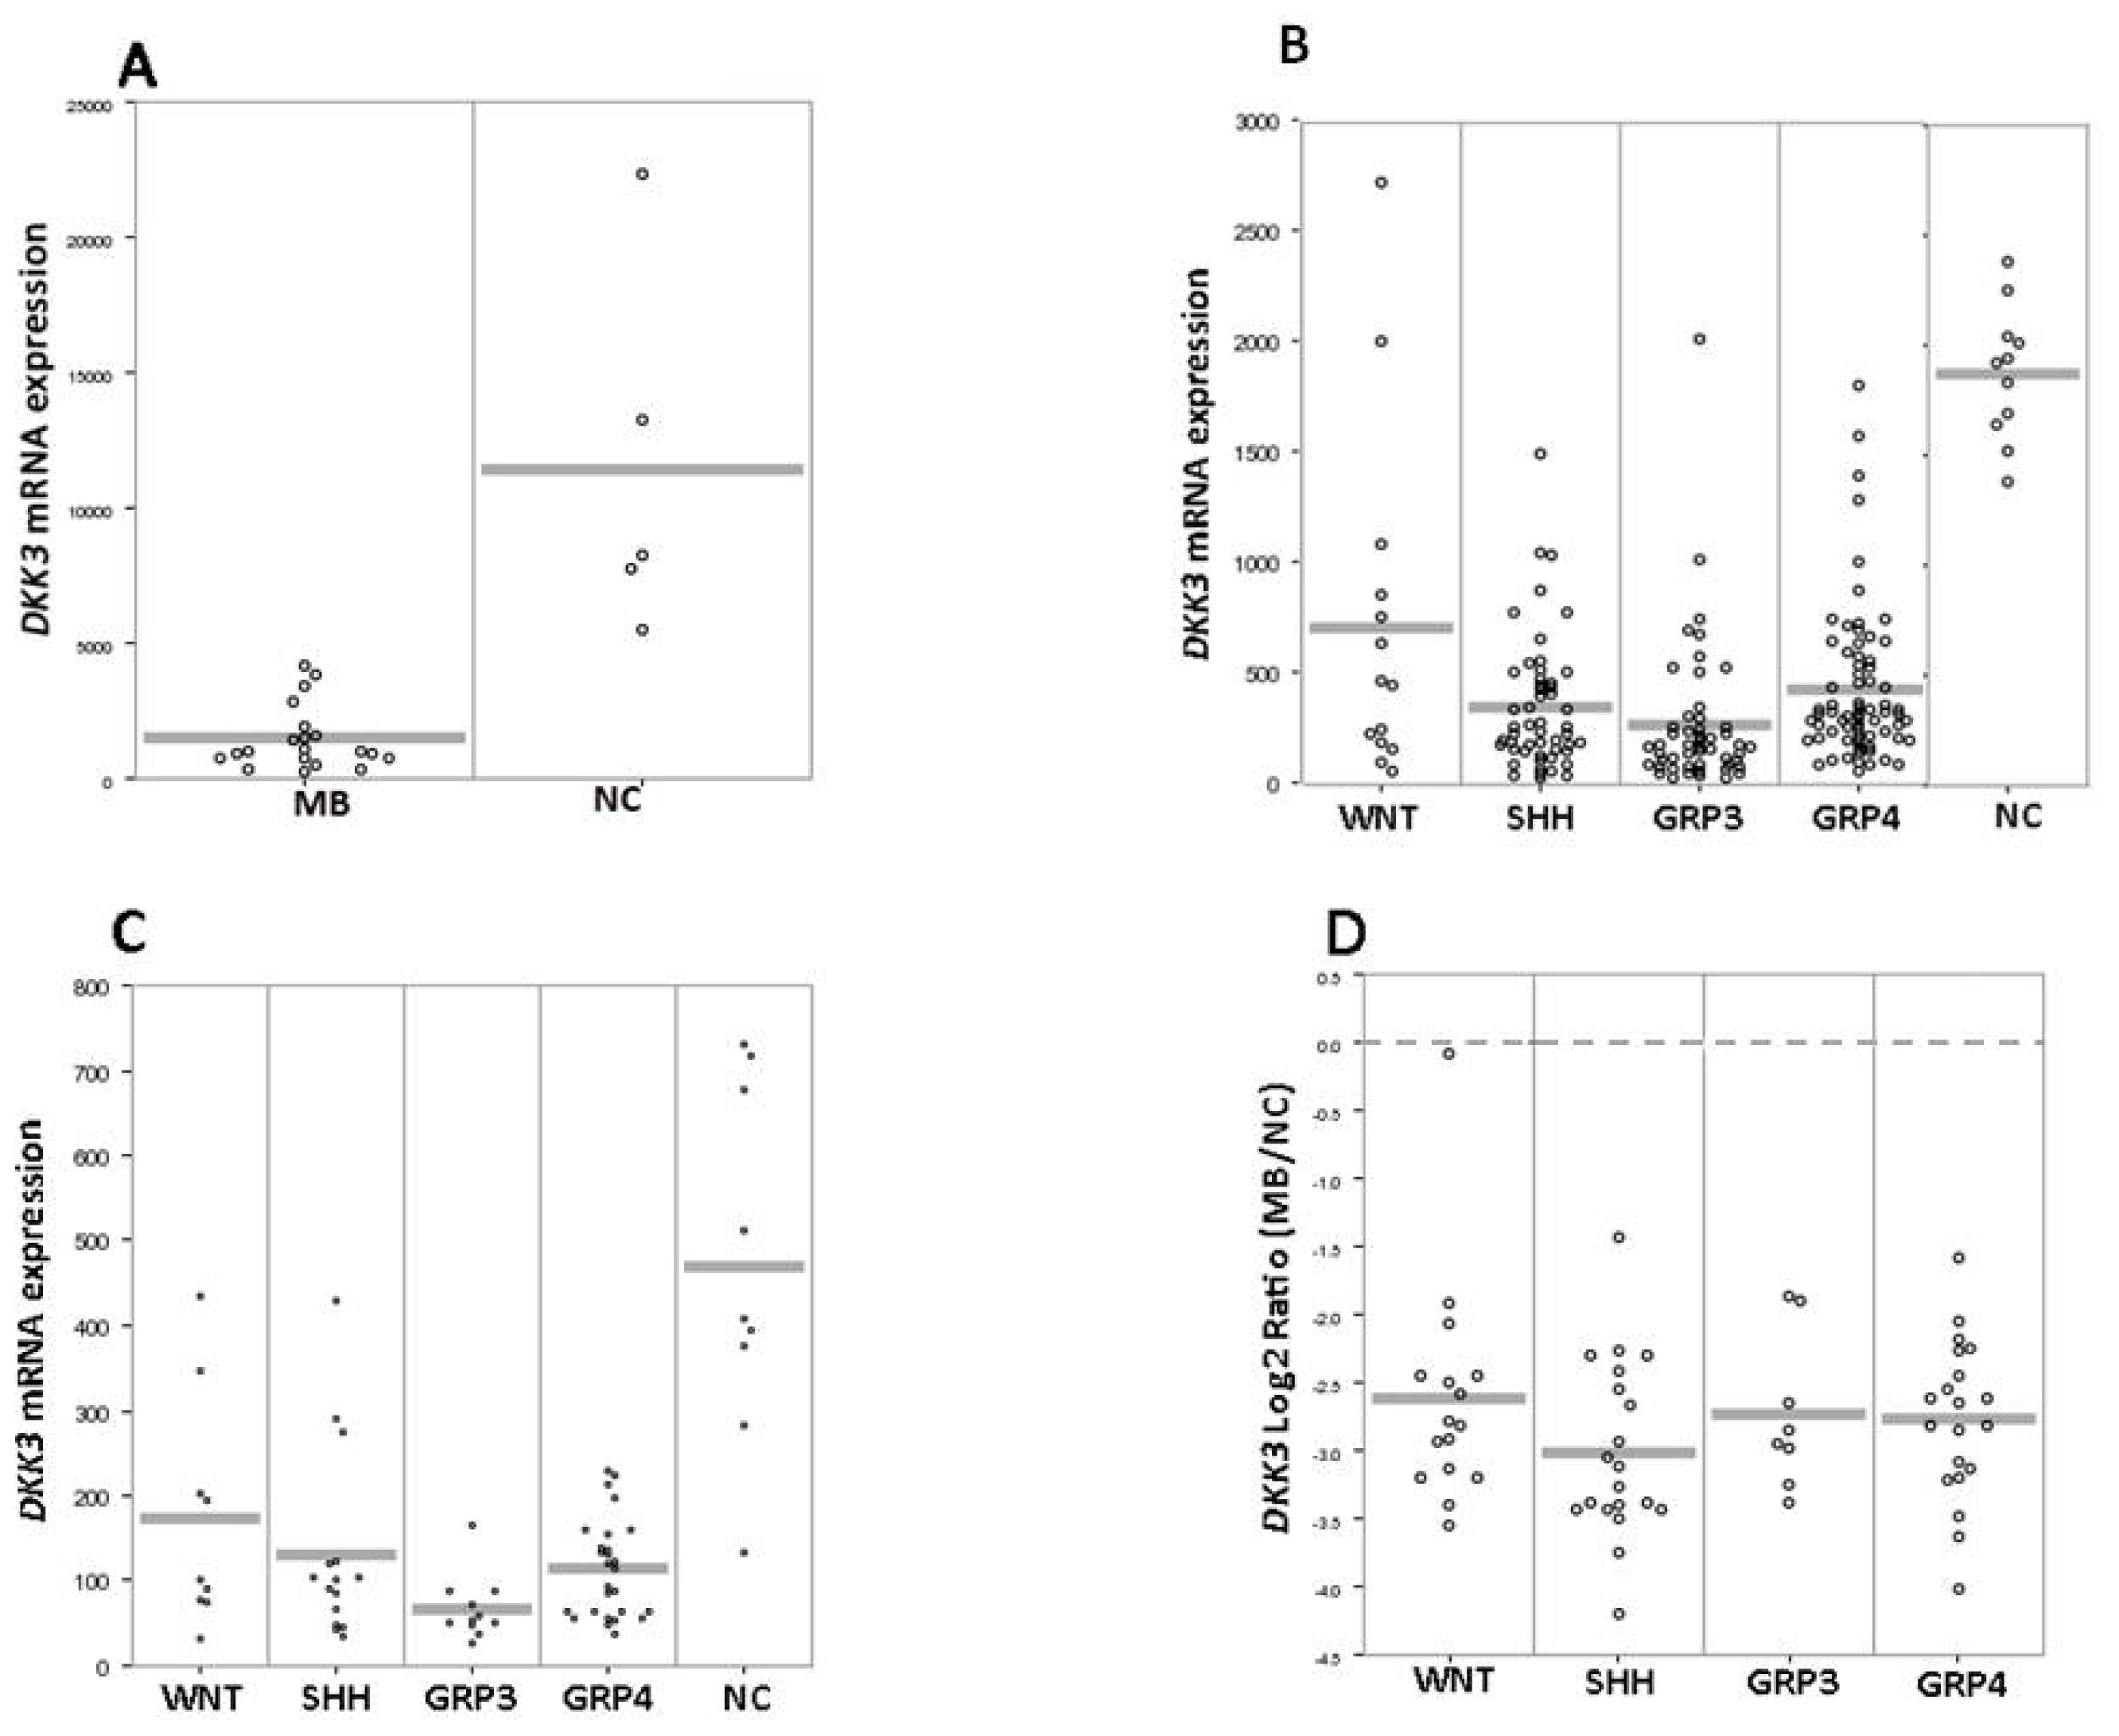
2. Results and Discussion

We evaluated the expression of DKK family members (DKK1, DKK2, DKK3 and DKK4), by screening 355 expression profiling data, including 333 MB tumors and 22 normal cerebella from four independent datasets. This analysis showed the significant DKK1, DKK2 and DKK4 upregulation (p < 0.01) in WNT subgroup tumors (Figures S1–S3), whereas DKK1, DKK2 and DKK4 were either not expressed or expressed at only very low levels in non-WNT tumors or normal cerebellum. Only a subset of SHH tumors shows some DKK2 expression. Our findings are in agreement with Northcott et al.[3], who showed the overexpression of DKK1 mRNA and protein in the WNT subgroup. The WNT-specific overexpression of DKK1, DKK2 and DKK4 suggests the activation of a negative feedback loop in this peculiar subgroup of tumors. On the contrary, we found that DKK3 gene expression was significantly (p < 0.001) downregulated in all subgroups of MB compared to normal cerebellum (Figure 1).
To confirm the downregulation of DKK3 gene expression, we validated the expression results in 33 MB tumors and five human MB cell lines by quantitative Polymerase Chain Reaction (qPCR) compared to a pool of normal cerebella and found that DKK3 expression was reduced in 27/33 (82%) MBs and in 3/5 (60%) cell lines (Figure 2).
We then explored different genetic and epigenetic mechanisms, alone or in cooperation between themselves, that could explain the DKK3 downregulation. First, we investigated if the somatic copy number changes, as well as the 11p loss and the focal event affecting the DKK3 locus may contribute to drive its down-modulation. We analyzed both the status of chromosome 11 in 77 MBs (17 from dataset A and 60 from dataset D) and the focal aberration targeting DKK3 by SNPs study [21] in 1,087 MBs. We found that 11 monosomy (10/77) and structural 11p loss (3/77) copy number aberrations were rare events and, in addition to the total absence to focal aberrations targeting DKK3, suggest that other regulatory mechanisms may exist.
Deregulation of miRNAs have been found in several cancers; thus, miRNAs may play a role in gene expression modulation. Therefore, we studied the miRNAs as a possible mechanism of DKK3 epigenetic silencing. We interrogated five miRNA target prediction programs—miRWalk, Diana-microT, miRanda, miRDB and TargetScan—and selected 147 miRNAs found in at least three out of five predictive tools. Hence, we investigated the inverse correlation integrating data between miRNAs and DKK3 expression by in silico analysis on the available 25 MB tumors from dataset D, containing 77 out of 147 predicted miRNAs. However, the respective Pearson’s rank correlation coefficient did not show any significant inverse correlation (r2 ≤ −0.49) with DKK3 transcript levels (Table S1). This result is in contrast with Haug et al.[22], who have identified miRNA-92 as the main modulator of DKK3 expression in neuroblastoma. The absence of modulation mediated by miRNA in MB with respect to the previous study on neuroblastoma may be explained by the activation of miRNA-92 by MYCN. MYCN is an oncogene frequently amplified in neuroblastoma, while its amplification is a rare event in MB (about 5% of the tumors) [23] and more frequently associated with SHH and Group 4 MBs [21].
It has been reported that chromatin remodeling by DNA methylation and histone acetylation, represents an important mechanism of inactivation of tumor suppressor genes in several cancers, including MB [17,24,25]. In this respect, DKK3 has been observed to be methylated in several tumors [26,27], and the combined action of the HDAC inhibitor TSA and of the DNA methyltransferase (DNMT) inhibitor 5-aza-2′-deoxycytidine reactivates DKK3 expression in breast cancer cells [28]. To determine the role of epigenetic mechanisms in regulating the expression of DKK3 in MB, we initially performed an absolute quantitative methylation analysis on the three DKK3 promoters in MB cell lines and primary tumors. Our results show low levels of methylation (promoter 1: 3.13%, promoter 2: 5.41%, promoter 3: 4.88%; Table S2; for representative pyrograms, see Figure S4), indicating that DNA methylation likely is not involved in DKK3 downregulation.
As a further attempt to understand if other epigenetic mechanisms beside DNA methylation could affect DKK3 expression, we treated human MB cell lines, D425Med and D458Med, with the HDAC inhibitor, TSA. In addition, two MB cell lines, DAOY and D283Med, with DKK3 expression comparable to normal cerebellum, were also treated with TSA. Interestingly, the TSA treatment induced a significant increase of DKK3 expression relative to untreated cells in three out of four cell lines (D283Med; D425Med; D458Med) (Figure 3). DKK3 expression was measured after 8 h and 24 h and increased on average 19- and 130-fold in D283Med, 57- and 602-fold in D425Med and 563- and 5296-fold in D458Med. DAOY, with DKK3 expression levels comparable to normal cerebellum, showing no significant increase of DKK3 expression after TSA treatment.
In order to establish the role of histone modifications as an epigenetic regulator for DKK3 in MB, we performed Chromatin Immuno-Precipitation (ChIP) targeting the three promoter regions of DKK3 using antibodies against the active chromatin histone marker, H3K4me2. This experiment was conducted using D458Med cells, due to the strongest DKK3 upregulation upon TSA treatment. Consistent with our previous results, after 24 h of TSA treatment, H3K4me2 increased about six-fold in each DKK3 promoters with respect to the untreated cells (Figure 4).
Finally, in order to evaluate if the effect of the HDAC inhibition acts also on protein expression, we evaluated the Dkk3 by immunofluorescence staining of three adherent MB cell lines after 24 h of TSA treatment (Figure 5). In agreement with the mRNA expression data, TSA treatment did not modify Dkk3 protein expression in DAOY cells. About 10% of cells had a weak positive signal compared to 8% in control cells, while the treatment in D283Med increased the Dkk3 protein from 7% to 26% (p = 0.060). The immunofluorescence signal in the D425Med, whose DKK3 transcript and protein were undetectable in control cells, revealing a strong positive expression in about 20% of cells after TSA treatment (p = 0.025). The increase of Dkk3 protein expression was approximately 20% in both cell lines upon only 24 h at 20 nM of TSA, a sub-lethal dose.
HDAC inhibitors, like TSA, can induce a relaxed chromatin conformation independently from promoter methylation [29,30]. Our results indicate that DKK3 reactivation in MB is accompanied by the increase of H3K4me2, a histone marker characteristic of transcriptionally active chromatin remodeling. It thus appears that the DKK3 gene in MB is in a partially active conformation and that HDAC inhibitors can induce re-expression of DKK3.

3. Experimental Section

3.1. Tumor Samples and Cell Lines and Acid Nucleic Isolation

MB tumor samples were obtained from 55 pediatric patients at time of diagnosis, prior to any radio- or chemo-therapy (Table S3). Written informed consent was obtained from all the patients’ parents or legal guardians. Approval from the Ethical Committee was obtained (July 11, 2011). Ten samples of normal cerebella from children (6 Caucasians and 4 African Americans; ages: 0–16 years, cause of death: sudden death provided by NICHD Brain and Tissue Bank, Baltimore, MD, USA) and a commercial pool (Clontech, Cambridge, UK) from female and male Caucasians (ages: 16–70 years; cause of death: sudden death) were used as reference samples. The human MB cell lines—DAOY, D341Med and D283Med—were from the American Type Culture Collection and D425Med, D458Med cells were kindly provided by Prof. G. Basso, Padua, Italy. Genomic DNA was isolated from about 50 mg of snap-frozen tumor tissue or from 2 × 10⁶ cells using the standard phenol-chloroform protocol. DNA concentration and purity were evaluated by Biophotometer (Eppendorf; Hamburg, Germany). Total RNA was extracted from tumors and cells using the miRNeasy Mini kit (Qiagen; Hilden, Germany); RNA quality control and quantification were carried out by the 2100 Bioanalyzer instrument using RNA 6000 Nano kit (Agilent Technologies; Santa Clara, CA, USA). Only RNA samples with a RIN (RNA Integrity Number) of at least 7 were included in the study.

3.2. Gene Expression Profiling, Array-CGH Data and miRNA

Gene expression profiling was performed on 19 MB samples and two pools of normal cerebellum, as reference samples using the 44 k whole genome oligonucleotides microarray (Agilent Technologies; Santa Clara, CA, USA) (Dataset A). Labeling and hybridization of samples was performed according to the “one-color microarray-based gene expression analysis” protocol. The reference samples, including a pool of normal cerebellum from children and a commercial pool from adults, were hybridized in triplicate and duplicate, respectively. The data were extracted using Feature Extraction software (v. 9.5; Agilent Technologies; Santa Clara, CA, USA, 2009); probe intensities were log base 2-transformed and normalized across arrays with the scale normalization method implemented in R package “limma” version 3.10.2. All raw data were deposited in Gene Expression Omnibus ( http://0-www-ncbi-nlm-nih-gov.brum.beds.ac.uk/geo/; GSE39182). We also included the data obtained from three independent public datasets of gene expression: (1) B, including 188 MBs and 11 normal cerebellum data [4]; (2) C, including 62 MB data [2] and 9 normal cerebellum [20]; (3) D, including 64 MB data [5]. Data are accessible through the open access database R2 for visualization and analysis of microarray data ( http://r2.amc.nl). Differences between the comparisons of MBs versus normal cerebellum were studied using the one-way analysis of variance (ANOVA), while differences between four subgroups were calculated by two-tailed Student’s t-test; p values < 0.01 were considered to be statistically significant. Array-CGH data were available for 77 MBs already published by Coco et al.[31] (17 MBs, 244 k Agilent Technologies; GEO accession number GSE23005) and Pfister et al.[32] (60 MBs, 6 k BAC array; GEO accession number GSE8634). The raw data were analyzed by Agilent Genomics Workbench Lite Edition software (v. 6.5; Agilent Technologies, Santa Clara, CA, USA, 2010) using the z-score algorithm. SNPs data of 1,087 MBs were by Nothcott et al.[21]. The microRNAs targeting DKK3 was determined interrogating five target prediction programs: miRWalk, Diana-microT (v. 3.0); miRanda (August 2010); miRDB (April 2009); and TargetScan (v. 5.1). Statistical analysis was performed calculating the level of inverse correlation between miRNA/mRNA combined miRNAs and DKK3 expression values from 25 tumors from dataset D by respective Pearson’s rank correlation coefficient; −1 < r2 > 1; and a significant negative correlation was defined as r2 ≤ −0.5.

3.3. qPCR Analysis

Total RNA (50 ng) was amplified and reverse transcribed using the WT-Ovation RNA Amplification System (NuGEN Technologies; San Carlos, CA, USA), according to the manufacturer’s instructions. The expression value of DKK3 was evaluated in 33 MBs and 5 MB cell lines by qPCR using specific Taqman gene expression assays (Hs00951307_m1; specific for 6–8 exons, Applied Biosystems, Carlsbad, CA, USA). EIF4A2 and ATP5B were used as reference genes (Primer Design, Southampton, UK). All reactions were performed in duplicate on the Mastercycler® RealPlex4 System (Eppendorf), and the downregulation relative to the pool of normal cerebellum was defined for values lower than 0.5 using the 2−ΔΔCt formula.

3.4. Trichostatin a Treatment and Chromatin Immuno-Precipitation (ChIP) Assay

DAOY, D283Med, D425Med and D458Med MB cell lines were treated with 20 nM Trichostatin A (TSA) (Upstate Biotechnology, Lake Placid, NY, USA) for 8 h and 24 h. Untreated control cells were included in each experiment. The final concentration of TSA was chosen according to Vibhakar et al.[17]. For qPCR expression analysis, total RNA was extracted from MB cells after 8 h and 24 h of TSA treatment. ChIP assays for the Histone 3 K4 dimethylated (H3K4me2) were performed on D458Med after 24 h of TSA treatment using the EpiQuik Methyl-Histone H3-K4 ChIP kit (Epigentek, NY, USA), as previously described by Brigati et al. [30]. Every ChIP for H3K4me2 was coupled to ChIP reactions with the irrelevant normal mouse IgG. Specific primers to amplify the three promoter regions of DKK3 were designed and qPCR conditions optimized (Table S4). ChIP-qPCR data were normalized according to the Fold Enrichment Method (2−ΔΔCt) with respect to the irrelevant IgG.

3.5. Methylation Analysis

The methylation status of the three promoters of DKK3 gene was performed on 32 tumor samples MB tumors and five cell lines by pyrosequencing analysis. Briefly, genomic DNA (1 μg) was modified with sodium bisulfite, which converts the unmethylated C into U, using the EZ DNA Methylation Gold kit (Zymo Research, Irvine, CA, USA), according to the manufacturer’s recommendations. The pyrosequencing analysis was carried out as described by Banelli et al.[33] with a SPQ 96MA instrument (Qiagen, Hilden, Germany) and conducted with the Pyro Q-CpG software (version 1.0.9; Qiagen Technologies, Hilden, Germany, 2006). The primers were designed with the Pyrosequencing Assay Design Software (Qiagen Technologies, Hilden, Germany). The sequence of the primers used pyrosequencing and the PCR conditions are indicated in the Table S4.

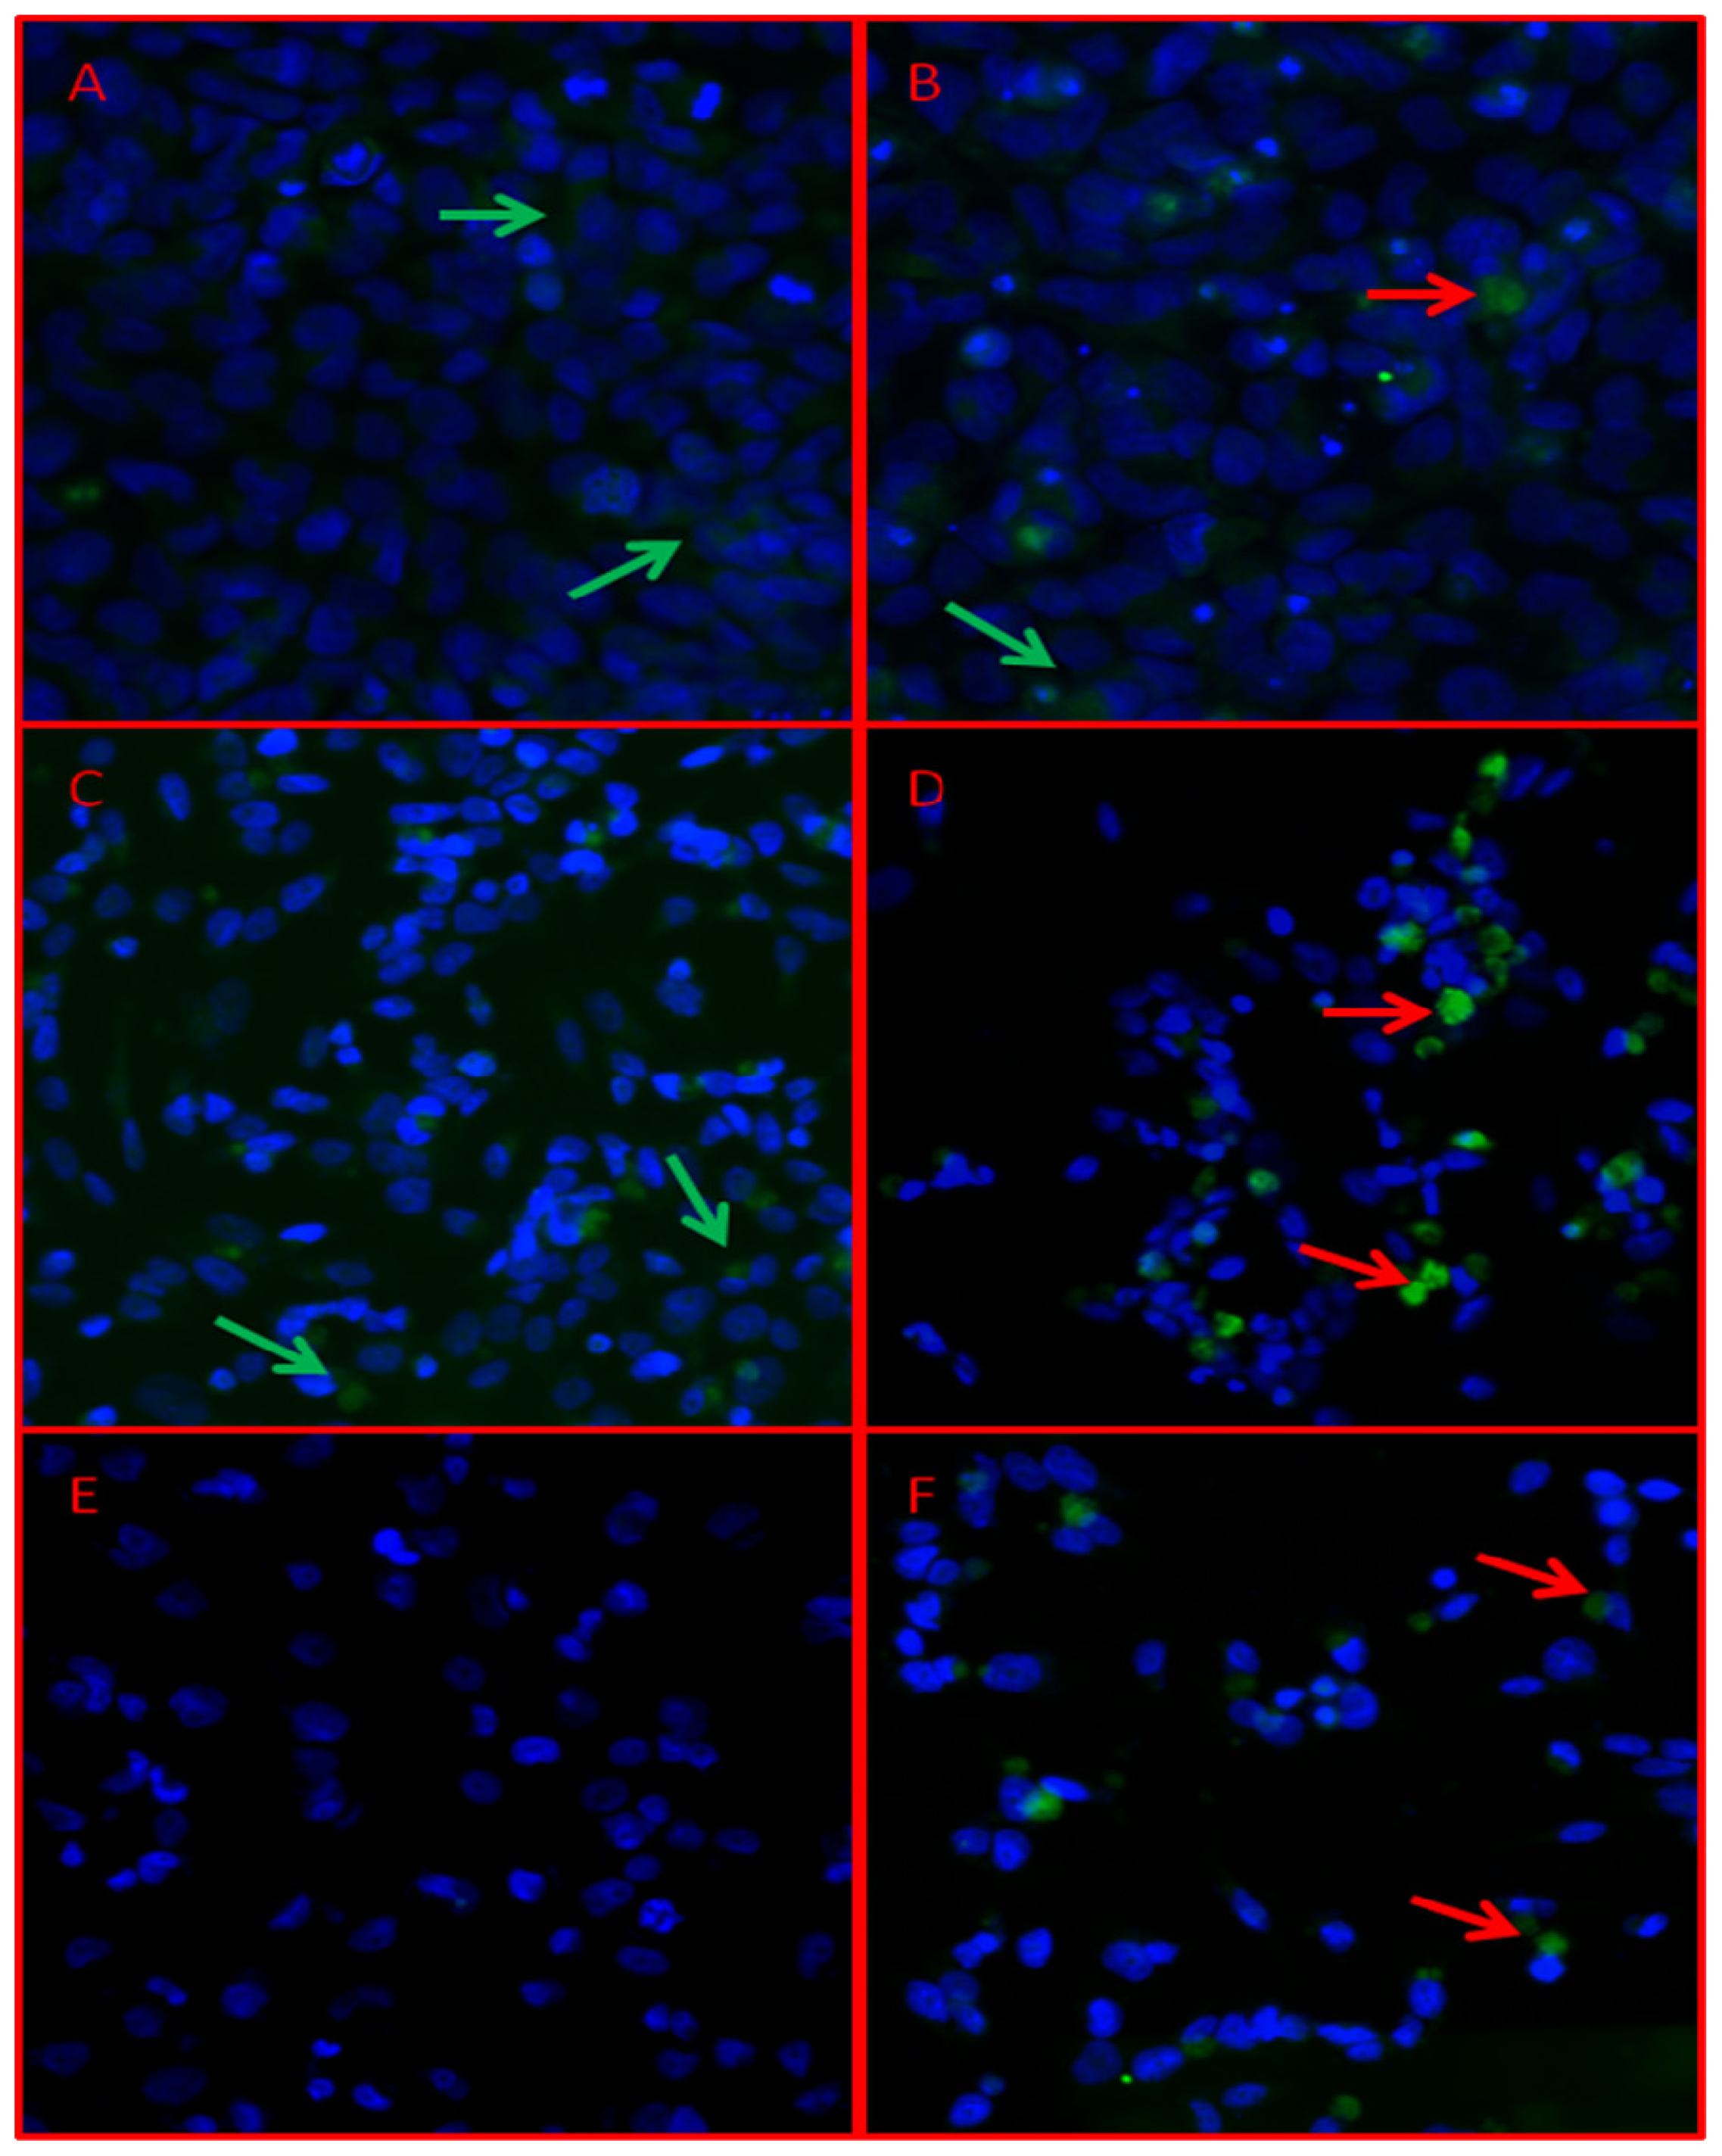
3.6. Immunofluorescence Analysis

Immunofluorescence analysis was performed on adherent cell lines (DAOY, D425Med and D283Med). Cells were treated for 24 h with 20 nM TSA, then control and treated cells were plated overnight on a Poly-d-Lysine 8-well slide (BD Biosciences, Franklin Lakes, NJ, USA) to allow adherence to the slide surface. Immunostaining was performed, as previously described by Del Grosso et al. [34], with slight modifications. Briefly, the primary antibody goat anti-human DKK-3 (H-130; Santa Cruz Biotechnologies, Inc., Santa Cruz, CA, USA) was incubated for 2 h at 37 °C, and after the secondary antibody incubation, cells were washed and stained with DAPI (1:5000). The images were acquired using an Axio Imager M1 microscope equipped with fluorescence lamp (Zeiss Inc., Oberkochen, Germany).

4. Conclusions

In conclusion, we describe for the first time the downregulation of DKK3, a Wnt pathway inhibitor, across all MB subgroups, suggesting a generally important role in MB tumorigenesis. We also demonstrate the modulation of DKK3 at transcript and protein levels by TSA, a potent inhibitor of HDAC, in the absence of promoter methylation and miRNAs regulation. We report the specific upregulation of the other DKK members, DKK1, DKK2 and DKK4, suggesting a negative feedback loop within WNT tumors. This paper demonstrates that DKK3 is an epigenetically regulated gene, and further studies are needed to establish the role of DKK3 and the effect of its overexpression in medulloblastoma.

Supplementary Information

ijms-14-07492-s001.pdf

Acknowledgments

The work has been supported by: Italian Neuroblastoma Foundation, Associazione Italiana per la Ricerca sul Cancro (AIRC), Ministero dell’Istruzione dell’Università e della Ricerca (MIUR). We are grateful to NICHD Brain and Tissue Bank, University of Maryland, Department of Pediatrics (Baltimore, USA), for sharing healthy control cerebellum tissues. B.B. is the recipient of the ‘Young Investigators’ Grant GR-2008-1143408 from the Italian Ministry of Health.

Conflict of Interest

The authors declare no conflict of interest.

References

  1. Packer, R.J.; Cogen, P.; Vezina, G.; Rorke, L.B. Medulloblastoma: Clinical and biologic aspects. Neuro Oncol 1999, 1, 232–250. [Google Scholar]
  2. Kool, M.; Koster, J.; Bunt, J.; Hasselt, N.E.; Lakeman, A.; van Sluis, P.; Troost, D.; Meeteren, N.S.; Caron, H.N.; Cloos, J.; et al. Integrated genomics identifies five medulloblastoma subtypes with distinct genetic profiles, pathway signatures and clinicopathological features. PLoS One 2008, 3, 3088. [Google Scholar]
  3. Northcott, P.A.; Korshunov, A.; Witt, H.; Hielscher, T.; Eberhart, C.G.; Mack, S.; Bouffet, E.; Clifford, S.C.; Hawkins, C.E.; French, P.; et al. Medulloblastoma comprises four distinct molecular variants. J. Clin. Oncol 2011, 10, 1408–1414. [Google Scholar]
  4. Cho, Y.J.; Tsherniak, A.; Tamayo, P.; Santagata, S.; Ligon, A.; Greulich, H.; Berhoukim, R.; Amani, V.; Goumnerova, L.; Eberhart, C.G.; et al. Integrative genomic analysis of medulloblastoma identifies a molecular subgroup that drives poor clinical outcome. J. Clin. Oncol 2011, 29, 1424–1430. [Google Scholar]
  5. Remke, M.; Hielscher, T.; Korshunov, A.; Nothcott, P.A.; Bender, S.; Kool, M.; Westermann, F.; Benner, A.; Ryzhova, M.; Sturm, D.; et al. FSTL5 is a marker of poor prognosis in non-Wnt/non.SHH Medulloblastoma. J. Clin. Oncol 2011, 29, 3852–3861. [Google Scholar]
  6. Polkinghorn, W.R.; Tarbel, N.J. Medulloblastoma: Tumorigenesis, current clinical paradigm, and efforts to improve risk stratification. Nat. Clin. Pract. Oncol 2007, 4, 295–304. [Google Scholar]
  7. Taylor, M.D.; Northcott, P.A.; Korshunov, A.; Remke, M.; Cho, Y.J.; Clifford, S.C.; Eberhart, C.G.; Parsons, D.W.; Rutkowski, S.; Gajjar, A.; et al. Molecular subgroups of medulloblastoma: The current consensus. Acta Neuropathol 2012, 123, 465–472. [Google Scholar]
  8. Kool, M.; Korshunov, A.; Remke, M.; Jones, D.T.; Schlanstein, M.; Northcott, P.A.; Cho, Y.J.; Koster, J.; Schouten-van Meeteren, A.; van Vuurden, D.; et al. Molecular subgroups of medulloblastoma: An international meta-analysis of transcriptome, genetic aberrations, and clinical data of WNT, SHH, Group 3, and Group 4 medulloblastomas. Acta Neuropathol 2012, 123, 473–484. [Google Scholar]
  9. Marino, S. Medulloblastoma: Developmental mechanisms out of control. Trends Mol. Med 2005, 11, 17–22. [Google Scholar]
  10. Kawano, Y.; Kypta, R. Secreted antagonists of the Wnt signalling pathway. J. Cell Sci 2003, 116, 2627–2634. [Google Scholar]
  11. Katoh, M.; Katoh, M. WNT signaling pathway and stem cell signaling network. Clin. Cancer Res 2007, 13, 4042–4045. [Google Scholar]
  12. Kobayashi, K.; Ouchida, M.; Tsuji, T.; Hanafusa, H.; Miyazaki, M.; Namba, M.; Shimizu, N.; Shimizu, K. Reduced expression of the REIC/Dkk3 gene by promoter-hypermethylation in human tumor cells. Gene 2002, 2, 151–158. [Google Scholar]
  13. Hsieh, S.Y.; Hsieh, P.S.; Chiu, C.-T.; Chen, W.Y. Dickkopf-3/REIC functions as a suppressor gene of tumor growth. Oncogene 2004, 2, 9183–9189. [Google Scholar]
  14. Kuphal, S.; Lodermeyer, S.; Bataille, F.; Schuierer, M.; Hoang, B.H.; Bosserhoff, A.K. Expression of Dickkopf genes is strongly reduced in malignant Melanoma. Oncogene 2006, 25, 5027–5036. [Google Scholar]
  15. Chung, M.T.; Lai, H.C.; Sytwu, H.K.; Yan, M.D.; Shih, Y.L.; Chang, C.C.; Yu, M.H.; Liu, H.S.; Chu, D.W.; Lin, Y.W. SFRP1 and SFRP2 suppress the transformation and invasion abilities of cervical cancer cells through Wnt signaling pathway. Ginecol. Oncol 2009, 112, 646–653. [Google Scholar]
  16. Sato, H.; Suzuki, H.; Toyotak, M.; Nojima, M.; Maruyama, R.; Sasaki, S.; Takagi, H.; Sogabe, Y.; Sasaki, Y.; Idogawa, M.; et al. Frequent epigenetic inactivation of DICKKOPF family genes in human gastrointestinal tumors. Carcinogenesis 2007, 28, 2459–2466. [Google Scholar]
  17. Vibhakar, R.; Foltz, G.; Yoon, J.G.; Field, L.; Lee, H.; Ryu, G.Y.; Pierson, J.; Davidson, B.; Madan, A. Dickkopf-1 is an epigenetically silenced candidate tumor suppressor gene in medulloblastoma. Neuro Oncol 2007, 4, 135–144. [Google Scholar]
  18. Facchetti, F.; Previdi, S.; Ballarini, M.; Minucci, S.; Perego, P.; La Porta, C.A. Modulation of pro-and anti-apoptotic factors in human melanoma cells exposed to histone deacetylase inhibitors. Apoptosis 2004, 9, 573–582. [Google Scholar]
  19. Yoshikawa, M.; Hishikawa, K.; Idei, M.; Fujita, T. Trichostatin a prevents TGF-beta1-induced apoptosis by inhibiting ERK activation in human renal tubular epithelial cells. Eur. J. Pharmacol 2010, 642, 28–36. [Google Scholar]
  20. Roth, R.B.; Hevezi, P.; Lee, J.; Willhite, D.; Lechner, S.M.; Foster, A.C.; Zlotnik, A. Gene expression analyses reveal molecular relationships among 20 regions of the human CNS. Neurogenetics 2006, 7, 67–80. [Google Scholar]
  21. Northcott, P.A.; Shih, D.J.; Peacock, J.; Garzia, L.; Morrissy, A.S.; Zichner, T.; Stütz, A.M.; Korshunov, A.; Reimand, J.; Schumacher, S.E.; et al. Subgroup-specific structural variation across 1000 medulloblastoma genomes. Nature 2012, 488, 49–56. [Google Scholar]
  22. Haug, B.H.; Henriksen, J.R.; Buechner, J.; Geerts, D.; Tømte, E.; Kogner, P.; Martinsson, T.; Flægstad, T.; Sveinbjørnsson, B.; Einvik, C. MYCN-regulated miRNA-92 inhibits secretion of the tumor suppressor DICKKOPF-3 (DKK3) in neuroblastoma. Carcinogenesis 2011, 32, 1005–1012. [Google Scholar]
  23. Aldosari, N.; Bigner, S.H.; Burger, P.C.; Becker, L.; Kepner, J.L.; Friedman, H.S.; McLendon, R.E. MYCC and MYCN oncogene amplification in medulloblastoma. A fluorescence in situ hybridization study on paraffin sections from the Children’s Oncology Group. Arch. Pathol. Lab. Med 2002, 126, 540–544. [Google Scholar]
  24. Kongkham, P.N.; Northcott, P.A.; Croul, S.E.; Smith, C.A.; Taylor, M.D.; Rutka, J.T. The SFRP family of WNT inhibitors function as novel tumor suppressor genes epigenetically silenced in medulloblastoma. Oncogene 2010, 29, 3017–3024. [Google Scholar]
  25. Häcker, S.; Dittrich, A.; Mohr, A.; Schweitzer, T.; Rutkowski, S.; Krauss, J.; Debatin, K.M.; Fulda, S. Histone deacetylase inhibitors cooperate with IFN-gamma to restore caspase-8 expression and overcome TRAIL resistance in cancers with silencing of caspase-8. Oncogene 2009, 28, 3097–3110. [Google Scholar]
  26. Yang, B.; Du, Z.; Gao, Y.T.; Lou, C.; Zhang, S.G.; Bai, T.; Wang, Y.J.; Song, W.Q. Methylation of Dickkopf-3 as a prognostic factor in cirrhosis-related hepatocellular carcinoma. World J. Gastroenterol 2010, 16, 755–763. [Google Scholar]
  27. Roman-Gomez, J.; Jimenez-Velasco, A.; Agirre, X.; Castillejo, J.A.; Navarro, G.; Barrios, M.; Andreu, E.J.; Prosper, F.; Heiniger, A.; Torres, A. Transcriptional silencing of the Dickkopfs-3 (Dkk-3) gene by CpG hypermethylation in acute lymphoblastic leukaemia. Br. J. Cancer 2004, 91, 707–713. [Google Scholar]
  28. Veeck, J.; Bektas, N.; Hartmann, A.; Kristiansen, G.; Heindrichs, U.; Knuchel, R.; Dahl, E. Wnt signalling in human breast cancer: Expression of the putative Wnt inhibitor Dickkopf-3 (DKK3) is frequently suppressed by promoter hypermethylation in mammary tumours. Breast Cancer Res 2008, 10, R82. [Google Scholar]
  29. Cameron, E.E.; Bachman, K.E.; Myöhänen, S.; Herman, J.G.; Baylin, S.B. Synergy of demethylation and histone deacetylase inhibition in the re-expression of genes silenced in cancer. Nat. Genet 1999, 21, 103–107. [Google Scholar]
  30. Brigati, C.; Banelli, B.; Casciano, I.; di Vinci, A.; Matis, S.; Cutrona, G.; Forlani, A.; Allemanni, G.; Romani, M. Epigenetic mechanisms regulate ΔNP73 promoter function in human tonsil B cells. Mol. Immunol 2011, 48, 408–414. [Google Scholar]
  31. Coco, S.; Valdora, F.; Bonassi, S.; Scaruffi, P.; Stigliani, S.; Oberthuer, A.; Berthold, F.; Adolfo, I.; Servidei, T.; Riccardi, R.; et al. Chromosome 9q and 16q loss identified by genome-wide pooled analysis are associated with tumor aggressiveness in patients with classic medulloblastoma. J. Integr. Biol 2011, 15, 273–280. [Google Scholar]
  32. Pfister, S.M.; Remke, M.; Benner, A.; Mendrzyk, F.; Toedt, G.; Felsberg, J.; Wittmann, A.; Devens, F.; Gerber, N.U.; Joos, S.; et al. Outcome prediction in pediatric medulloblastoma based on DNA copy-number aberrations of chromosomes 6q and 17q and the MYC and MYCN loci. J. Clin. Oncol 2009, 27, 1627–1636. [Google Scholar]
  33. Banelli, B.; Bonassi, S.; Casciano, I.; Mazzocco, K.; di Vinci, A.; Scaruffi, P.; Brigati, C.; Allemanni, G.; Borzì, L.; Tonini, G.P.; et al. Outcome prediction and risk assessment by quantitative pyrosequencing methylation analysis of the SFN gene advanced stage, high-risk, neuroblastic tumor patients. Int. J. Cancer 2010, 126, 656–668. [Google Scholar]
  34. Del Grosso, F.; Coco, S.; Scaruffi, P.; Stigliani, S.; Valdora, F.; Benelli, R.; Salvi, S.; Boccardo, S.; Truini, M.; Croce, M.; et al. Role of CXCL13-CXCR5 crosstalk between malignant neuroblastoma cells and Schwannian stromal cells in neuroblastic tumors. Mol. Cancer Res 2011, 9, 815–823. [Google Scholar]
  35. Giangaspero, F.; Eberhart, C.; Haapasalo, H.; Pietsch, T.; Wiestler, O.D.; Ellison, D.W. Medulloblastoma. In WHO Classification of Tumours of the Central Nervous System; Louis, D.N., Ohgaki, H., Wiestler, O.D., Cavenee, W.K., Eds.; IARC Press: Lyon, France, 2007. [Google Scholar]
  36. Chang, C.H.; Housepian, E.M.; Herbert, C., Jr. An operative staging system and a megavoltage radiotherapeutic technic for cerebellar medulloblastomas. Radiology 1969, 93, 13561–1359. [Google Scholar]
Figure 1. DKK3 expression in normal cerebellum (NC) and medulloblastoma (MB) samples. Dot plots of DKK3 expression values from expression profiles in four independent datasets: (A) 19 MB tumors and two pools of NC (present dataset); (B) 188 MBs and 11 NC data [4]; (C) 62 MB data [2] and nine NC [20]; (D) 64 MB data [5]. The statistically significance was calculated by one-way analysis of variance (ANOVA) between MB samples and NC; the differences between four subgroups were calculated by two-tailed Student’s t-test. p-values <0.01 were considered to be statistically significant. The X-axis indicates the four molecular subgroups according to the current consensus ([7]; WNT, SHH, Group 3 (GRP3) and Group 4 (GRP4)); the dataset A was not divided in the subgroups, due to a low number of samples. Y-axis: DKK3 mRNA expression value in the (A), (B) and (C) dataset, respectively. The dataset (D) reports the relative expression between MB samples and NC, and the dotted grey line delineates the expression level in a pool of NC samples. Abbreviations: NC, normal cerebellum; MB, medulloblastoma; GRP3, Group 3; GRP4, Group 4.
Ijms 14 07492f1
Figure 2. DKK3 expression in MB samples and cell lines. Scatter plot of DKK3 relative expression values in 33 MB samples (black diamonds) and five MB cell lines (white diamonds) by qPCR. DKK3 relative expression compared to a pool of 10 NCs from children (age range 0–16 years). Cut-off was set at 0.5 (black line), MBs with DKK3 expression value lower than this value was defined as downregulated. DKK3 expression values are transformed in logarithmic scale. Y-axis: relative DKK3 mRNA expression. Abbreviations: NC, normal cerebellum; MB, medulloblastoma.
Ijms 14 07492f2
Figure 3. DKK3 modulation expression after Trichostatin A (TSA) treatment in four MB cell lines. Box plots display the DKK3 relative expression in four MB cell lines—DAOY, D283Med, D425Med and D458Med—after treatment with 20 nM of TSA at 8 h (A) and 24 h (B) with respect to untreated cells (control cells). Every experiment was performed in triplicate. Independent sample t-test was applied to compare ΔCt of TSA treated cells versus ΔCt control cells; p-values <0.05 were considered significant (* p-value <0.05; ** p-value <0.01). Y-axis: relative DKK3 expression values with respect to control cells.
Ijms 14 07492f3
Figure 4. Chromatin Immuno-Precipitation (ChIP) analysis. Analyses of histone H3K4me2 levels in the three promoters of DKK3 gene—promoter 1, promoter 2 and promoter 3, respectively—by ChIP and subsequent qPCR. The experiments were performed on D458Med cell line comparing the fold enrichment over background after 24 h of TSA treatment (T) with respect to untreated cells (UT). Signals of target DNA obtained from UT cells served as the base and were defined as one. Fold change with respect to irrelevant IgG indicates 2−ΔΔCt of target DNA in treated cells over 2−ΔΔCt of target DNA in UT cells (Y-axis).
Ijms 14 07492f4
Figure 5. Immunofluorescence analysis of Dkk3 protein expression. Dkk3 protein expression in three MB cell lines: DAOY, D283Med and D425Med, before (A, C, E) and after (B, D, F) TSA treatment by immunofluorescence. Dkk3 positive signals (green) are evident in the cytoplasm of some cells before (A, C) and after 24 h of TSA treatment (B, D, E). D425Med, epigenetically silenced, after treatment, showed positive signals in about 20% of cells. The nucleus was stained in DAPI. Images were captured by Image capture system AxioVision Release 4.6 (Magnification 40X). Green arrows indicate an example of weak Dkk3 expression, while red arrows a high Dkk3 expression.
Ijms 14 07492f5

