Differential Proinflammatory and Oxidative Stress Response and Vulnerability to Metabolic Syndrome in Habitual High-Fat Young Male Consumers Putatively Predisposed by Their Genetic Background

 and
and
Abstract
:
1. Introduction
2. Results and Discussion
2.1. Baseline Characteristics of Lean and Obese Subjects
2.2. Over-Represented GO Biological Process Categories
2.2.1. Genes Involved in Inflammation
2.2.2. Genes Involved in Extracellular Matrix Remodeling
2.2.3. Genes Involved in Angiogenesis
2.2.4. Genes involved in Oxidative Stress
2.3. Under-Represented GO Biological Process Categories
2.3.1. Genes Involved in Apoptosis
2.3.2. Genes in Cell Control and Cell Cycle
2.3.3. Genes in Signal Transcription
2.4. Association of Gene Expression with Metabolic Syndrome
3. Experimental Section
3.1. Experimental Subjects
3.2. Anthropometrical Measurements and Adipose Tissue Biopsy
3.3. Blood Pressure and Measurements
3.4. Microarray Analysis
3.5. Real-Time PCR Analysis
3.6. Statistical Analysis
4. Conclusions
Supplementary Information
ijms-14-17238-s001.pdfAcknowledgments
Conflicts of Interest
References
- Bluher, M. The distinction of metabolically “healthy” from “unhealthy” obese individuals. Curr. Opin. Lipidol 2010, 21, 38–43. [Google Scholar]
- Harwood, H.J., Jr. The adipocyte as an endocrine organ in the regulation of metabolic homeostasis. Neuropharmacology 2012, 63, 57–75. [Google Scholar]
- Mansego, M.L.; Redon, J.; Martinez-Hervas, S.; Real, J.T.; Martinez, F.; Blesa, S.; Gonzalez-Albert, V.; Saez, G.T.; Carmena, R.; Chaves, F.J. Different impacts of cardiovascular risk factors on oxidative stress. Int. J. Mol. Sci 2011, 12, 6146–6163. [Google Scholar]
- Maury, E.; Brichard, S.M. Adipokine dysregulation, adipose tissue inflammation and metabolic syndrome. Mol. Cell. Endocrinol 2010, 314, 1–16. [Google Scholar]
- Trayhurn, P. Hypoxia and adipose tissue function and dysfunction in obesity. Physiol. Rev 2013, 93, 1–21. [Google Scholar]
- Trayhurn, P.; Wood, I.S. Adipokines: Inflammation and the pleiotropic role of white adipose tissue. Br. J. Nutr 2004, 92, 347–355. [Google Scholar]
- Cnop, M.; Foufelle, F.; Velloso, L.A. Endoplasmic reticulum stress, obesity and diabetes. Trends Mol. Med 2012, 18, 59–68. [Google Scholar]
- Gregor, M.F.; Hotamisligil, G.S. Thematic review series: Adipocyte biology. Adipocyte stress: The endoplasmic reticulum and metabolic disease. J. Lipid Res 2007, 48, 1905–1914. [Google Scholar]
- Ozcan, U.; Cao, Q.; Yilmaz, E.; Lee, A.H.; Iwakoshi, N.N.; Ozdelen, E.; Tuncman, G.; Gorgun, C.; Glimcher, L.H.; Hotamisligil, G.S. Endoplasmic reticulum stress links obesity, insulin action, and type 2 diabetes. Science 2004, 306, 457–461. [Google Scholar]
- Bondia-Pons, I.; Ryan, L.; Martinez, J.A. Oxidative stress and inflammation interactions in human obesity. J. Physiol. Biochem 2012, 68, 701–711. [Google Scholar]
- Fernandez-Sanchez, A.; Madrigal-Santillan, E.; Bautista, M.; Esquivel-Soto, J.; Morales-Gonzalez, A.; Esquivel-Chirino, C.; Durante-Montiel, I.; Sanchez-Rivera, G.; Valadez-Vega, C.; Morales-Gonzalez, J.A. Inflammation, oxidative stress, and obesity. Int. J. Mol. Sci 2011, 12, 3117–3132. [Google Scholar]
- Houstis, N.; Rosen, E.D.; Lander, E.S. Reactive oxygen species have a causal role in multiple forms of insulin resistance. Nature 2006, 440, 944–948. [Google Scholar]
- Marti, A.; Martinez-Gonzalez, M.A.; Martinez, J.A. Interaction between genes and lifestyle factors on obesity. Proc. Nutr. Soc 2008, 67, 1–8. [Google Scholar]
- Moreno-Aliaga, M.J.; Santos, J.L.; Marti, A.; Martinez, J.A. Does weight loss prognosis depend on genetic make-up? Obes. Rev 2005, 6, 155–168. [Google Scholar]
- Hotamisligil, G.S. Inflammation and metabolic disorders. Nature 2006, 444, 860–867. [Google Scholar]
- Robertson, L.T.; Mitchell, J.R. Benefits of short-term dietary restriction in mammals. Exp. Gerontol. 2013. [Google Scholar] [CrossRef]
- Holz, T.; Thorand, B.; Doring, A.; Schneider, A.; Meisinger, C.; Koenig, W. Markers of inflammation and weight change in middle-aged adults: Results from the prospective MONICA/KORA S3/F3 study. Obesity 2010, 18, 2347–2353. [Google Scholar]
- Marrades, M.P.; Martinez, J.A.; Moreno-Aliaga, M.J. Differences in short-term metabolic responses to a lipid load in lean (resistant) vs. obese (susceptible) young male subjects with habitual high-fat consumption. Eur. J. Clin. Nutr 2007, 61, 166–174. [Google Scholar]
- Marrades, M.P.; Martinez, J.A.; Moreno-Aliaga, M.J. ZAG, a lipid mobilizing adipokine, is downregulated in human obesity. J. Physiol. Biochem 2008, 64, 61–66. [Google Scholar]
- Razquin, C.; Marti, A.; Martinez, J.A. Evidences on three relevant obesogenes: MC4R, FTO and PPARγ. Approaches for personalized nutrition. Mol. Nutr. Food Res 2011, 55, 136–149. [Google Scholar]
- Martinez, J.A.; Parra, M.D.; Santos, J.L.; Moreno-Aliaga, M.J.; Marti, A.; Martinez-Gonzalez, M.A. Genotype-dependent response to energy-restricted diets in obese subjects: Towards personalized nutrition. Asia Pac. J. Clin. Nutr 2008, 17, 119–122. [Google Scholar]
- Lee, I.S.; Shin, G.; Choue, R. Shifts in diet from high fat to high carbohydrate improved levels of adipokines and pro-inflammatory cytokines in mice fed a high-fat diet. Endocr. J 2010, 57, 39–50. [Google Scholar]
- Margioris, A.N. Fatty acids and postprandial inflammation. Curr. Opin. Clin. Nutr. Metab. Care 2009, 12, 129–137. [Google Scholar]
- Frayn, K.N. Adipose tissue as a buffer for daily lipid flux. Diabetologia 2002, 45, 1201–1210. [Google Scholar]
- Martinez, J.A. Mitochondrial oxidative stress and inflammation: An slalom to obesity and insulin resistance. J. Physiol. Biochem 2006, 62, 303–306. [Google Scholar]
- Zulet, M.A.; Puchau, B.; Navarro, C.; Marti, A.; Martinez, J.A. Inflammatory biomarkers: The link between obesity and associated pathologies. Nutr. Hosp 2007, 22, 511–527. [Google Scholar]
- Moreno-Aliaga, M.J.; Campión, J.; Milagro, F.I.; Berjón, A.; Martínez, J.A. Adiposity and proinflammatory state: The chicken or the egg. Adipocytes 2005, 1, 1–13. [Google Scholar]
- Laclaustra, M.; Corella, D.; Ordovas, J.M. Metabolic syndrome pathophysiology: The role of adipose tissue. Nutr. Metab. Cardiovasc. Dis 2007, 17, 125–139. [Google Scholar]
- Huang, W.; Metlakunta, A.; Dedousis, N.; Zhang, P.; Sipula, I.; Dube, J.J.; Scott, D.K.; O’Doherty, R.M. Depletion of liver kupffer cells prevents the development of diet-induced hepatic steatosis and insulin resistance. Diabetes 2010, 59, 347–357. [Google Scholar]
- Manica-Cattani, M.F.; Bittencourt, L.; Rocha, M.I.; Algarve, T.D.; Bodanese, L.C.; Rech, R.; Machado, M.M.; Santos, G.F.; Gottlieb, M.G.; Schwanke, C.H.; et al. Association between interleukin-1 beta polymorphism (+3953) and obesity. Mol. Cell. Endocrinol 2010, 314, 84–89. [Google Scholar]
- Wrann, C.D.; Ehmer, U.; Lautenbach, A.; Kuhlmann, S.; Nave, H. Obesity and NK cells affect the expression of the long form of the leptin receptor Ob-Rb in liver of F344 rats. Exp. Toxicol. Pathol 2010, 62, 1–8. [Google Scholar]
- Maasen, J.A. Mitochondria, body fat and type 2 diabetes: What is the connection? Minerva Med 2008, 99, 241–251. [Google Scholar]
- Maassen, J.A.; Romijn, J.A.; Heine, R.J. Fatty acid-induced mitochondrial uncoupling in adipocytes as a key protective factor against insulin resistance and beta cell dysfunction: A new concept in the pathogenesis of obesity-associated type 2 diabetes mellitus. Diabetologia 2007, 50, 2036–2041. [Google Scholar]
- Clement, K.; Viguerie, N.; Poitou, C.; Carette, C.; Pelloux, V.; Curat, C.A.; Sicard, A.; Rome, S.; Benis, A.; Zucker, J.D.; et al. Weight loss regulates inflammation-related genes in white adipose tissue of obese subjects. FASEB J 2004, 18, 1657–1669. [Google Scholar]
- Wang, B.; Wood, I.S.; Trayhurn, P. Dysregulation of the expression and secretion of inflammation-related adipokines by hypoxia in human adipocytes. Pflugers Arch 2007, 455, 479–492. [Google Scholar]
- Fidge, N.H. High density lipoprotein receptors, binding proteins, and ligands. J. Lipid Res 1999, 40, 187–201. [Google Scholar]
- Rathcke, C.N.; Johansen, J.S.; Vestergaard, H. YKL-40, a biomarker of inflammation, is elevated in patients with type 2 diabetes and is related to insulin resistance. Inflamm. Res 2006, 55, 53–59. [Google Scholar]
- Boot, R.G.; van Achterberg, T.A.; van Aken, B.E.; Renkema, G.H.; Jacobs, M.J.; Aerts, J.M.; de Vries, C.J. Strong induction of members of the chitinase family of proteins in atherosclerosis: Chitotriosidase and human cartilage gp-39 expressed in lesion macrophages. Arterioscler. Thromb. Vasc. Biol 1999, 19, 687–694. [Google Scholar]
- Kastrup, J. Can YKL-40 be a new inflammatory biomarker in cardiovascular disease? Immunobiology 2012, 217, 483–491. [Google Scholar]
- Iwata, T.; Kuwajima, M.; Sukeno, A.; Ishimaru, N.; Hayashi, Y.; Wabitsch, M.; Mizusawa, N.; Itakura, M.; Yoshimoto, K. YKL-40 secreted from adipose tissue inhibits degradation of type I collagen. Biochem. Biophys. Res. Commun 2009, 388, 511–516. [Google Scholar]
- Hempen, M.; Kopp, H.P.; Elhenicky, M.; Hobaus, C.; Brix, J.M.; Koppensteiner, R.; Schernthaner, G.; Schernthaner, G.H. YKL-40 is elevated in morbidly obese patients and declines after weight loss. Obes. Surg 2009, 19, 1557–1563. [Google Scholar]
- Nielsen, A.R.; Erikstrup, C.; Johansen, J.S.; Fischer, C.P.; Plomgaard, P.; Krogh-Madsen, R.; Taudorf, S.; Lindegaard, B.; Pedersen, B.K. Plasma YKL-40: A BMI-independent marker of type 2 diabetes. Diabetes 2008, 57, 3078–3082. [Google Scholar]
- Czerwony, G.; Alten, R.; Gromnica-Ihle, E.; Hagemann, D.; Reuter, U.; Sorensen, H.; Muller, B. Differential surface expression of HLA-DRB1 and HLA-DRB4 among peripheral blood cells of DR4 positive individuals. Hum. Immunol 1999, 60, 1–9. [Google Scholar]
- Kern, P.A.; Ranganathan, S.; Li, C.; Wood, L.; Ranganathan, G. Adipose tissue tumor necrosis factor and interleukin-6 expression in human obesity and insulin resistance. Am. J. Physiol. Endocrinol. Metab 2001, 280, E745–E751. [Google Scholar]
- Marrades, M.P.; Milagro, F.I.; Martinez, J.A.; Moreno-Aliaga, M.J. Differential expression of aquaporin 7 in adipose tissue of lean and obese high fat consumers. Biochem. Biophys. Res. Commun 2006, 339, 785–789. [Google Scholar]
- Wellen, K.E.; Hotamisligil, G.S. Obesity-induced inflammatory changes in adipose tissue. J. Clin. Invest 2003, 112, 1785–1788. [Google Scholar]
- Mariman, E.C.; Wang, P. Adipocyte extracellular matrix composition, dynamics and role in obesity. Cell. Mol. Life Sci 2010, 67, 1277–1292. [Google Scholar]
- Kiefer, F.W.; Zeyda, M.; Todoric, J.; Huber, J.; Geyeregger, R.; Weichhart, T.; Aszmann, O.; Ludvik, B.; Silberhumer, G.R.; Prager, G.; et al. Osteopontin expression in human and murine obesity: Extensive local up-regulation in adipose tissue but minimal systemic alterations. Endocrinology 2008, 149, 1350–1357. [Google Scholar]
- Qiu, J.; Cheng, R.; Zhou, X.Y.; Zhu, J.G.; Zhu, C.; Qin, D.N.; Kou, C.Z.; Guo, X.R. Gene expression profiles of adipose tissue of high-fat diet-induced obese rats by cDNA microarrays. Mol. Biol. Rep 2010, 37, 3691–3695. [Google Scholar]
- Ress, C.; Tschoner, A.; Ciardi, C.; Laimer, M.W.; Engl, J.W.; Sturm, W.; Weiss, H.; Tilg, H.; Ebenbichler, C.F.; Patsch, J.R.; et al. Influence of significant weight loss on serum matrix metalloproteinase (MMP)-7 levels. Eur. Cytokine Netw 2010, 21, 65–70. [Google Scholar]
- Liu, X.S.; Luo, H.J.; Yang, H.; Wang, L.; Kong, H.; Jin, Y.E.; Wang, F.; Gu, M.M.; Chen, Z.; Lu, Z.Y.; et al. Palladin regulates cell and extracellular matrix interaction through maintaining normal actin cytoskeleton architecture and stabilizing beta1-integrin. J. Cell. Biochem 2007, 100, 1288–1300. [Google Scholar]
- Koch, W.; Hoppmann, P.; Schomig, A.; Kastrati, A. Variations of specific non-candidate genes and risk of myocardial infarction: A replication study. Int. J. Cardiol 2011, 147, 38–41. [Google Scholar]
- Klein, A.P.; Borges, M.; Griffith, M.; Brune, K.; Hong, S.M.; Omura, N.; Hruban, R.H.; Goggins, M. Absence of deleterious palladin mutations in patients with familial pancreatic cancer. Cancer Epidemiol. Biomarkers Prev 2009, 18, 1328–1330. [Google Scholar]
- Jernas, M.; Palming, J.; Sjoholm, K.; Jennische, E.; Svensson, P.A.; Gabrielsson, B.G.; Levin, M.; Sjogren, A.; Rudemo, M.; Lystig, T.C.; et al. Separation of human adipocytes by size: Hypertrophic fat cells display distinct gene expression. FASEB J 2006, 20, 1540–1542. [Google Scholar]
- Smith, J.R.; Chipps, T.J.; Ilias, H.; Pan, Y.; Appukuttan, B. Expression and regulation of activated leukocyte cell adhesion molecule in human retinal vascular endothelial cells. Exp. Eye Res 2012, 104, 89–93. [Google Scholar]
- Sevenich, L.; Werner, F.; Gajda, M.; Schurigt, U.; Sieber, C.; Muller, S.; Follo, M.; Peters, C.; Reinheckel, T. Transgenic expression of human cathepsin B promotes progression and metastasis of polyoma-middle-T-induced breast cancer in mice. Oncogene 2011, 30, 54–64. [Google Scholar]
- Christiaens, V.; Lijnen, H.R. Angiogenesis and development of adipose tissue. Mol. Cell. Endocrinol 2010, 318, 2–9. [Google Scholar]
- Buckanovich, R.J.; Sasaroli, D.; O’Brien-Jenkins, A.; Botbyl, J.; Hammond, R.; Katsaros, D.; Sandaltzopoulos, R.; Liotta, L.A.; Gimotty, P.A.; Coukos, G. Tumor vascular proteins as biomarkers in ovarian cancer. J. Clin. Oncol 2007, 25, 852–861. [Google Scholar]
- Taleb, S.; Cancello, R.; Clement, K.; Lacasa, D. Cathepsin S promotes human preadipocyte differentiation: Possible involvement of fibronectin degradation. Endocrinology 2006, 147, 4950–4959. [Google Scholar]
- Xiao, Y.; Junfeng, H.; Tianhong, L.; Lu, W.; Shulin, C.; Yu, Z.; Xiaohua, L.; Weixia, J.; Sheng, Z.; Yanyun, G.; et al. Cathepsin K in adipocyte differentiation and its potential role in the pathogenesis of obesity. J. Clin. Endocrinol. Metab 2006, 91, 4520–4527. [Google Scholar]
- Premzl, A.; Turk, V.; Kos, J. Intracellular proteolytic activity of cathepsin b is associated with capillary-like tube formation by endothelial cells in vitro. J. Cell. Biochem 2006, 97, 1230–1240. [Google Scholar]
- Wickramasinghe, N.S.; Banerjee, K.; Nagaraj, N.S.; Vigneswaran, N.; Zacharias, W. Hypoxia alters cathepsin b/inhibitor profiles in oral carcinoma cell lines. Anticancer Res 2005, 25, 2841–2849. [Google Scholar]
- Saiki, A.; Olsson, M.; Jernas, M.; Gummesson, A.; McTernan, P.G.; Andersson, J.; Jacobson, P.; Sjoholm, K.; Olsson, B.; Yamamura, S.; et al. Tenomodulin is highly expressed in adipose tissue, increased in obesity, and down-regulated during diet-induced weight loss. J. Clin. Endocrinol. Metab 2009, 94, 3987–3994. [Google Scholar]
- Tolppanen, A.M.; Pulkkinen, L.; Kolehmainen, M.; Schwab, U.; Lindstrom, J.; Tuomilehto, J.; Uusitupa, M. Tenomodulin is associated with obesity and diabetes risk: The finnish diabetes prevention study. Obesity (Silver Spring) 2007, 15, 1082–1088. [Google Scholar]
- Tolppanen, A.M.; Pulkkinen, L.; Kuulasmaa, T.; Kolehmainen, M.; Schwab, U.; Lindstrom, J.; Tuomilehto, J.; Uusitupa, M.; Kuusisto, J. The genetic variation in the tenomodulin gene is associated with serum total and LDL cholesterol in a body size-dependent manner. Int. J. Obes. (Lond. ) 2008, 32, 1868–1872. [Google Scholar]
- Tolppanen, A.M.; Pulkkinen, L.; Herder, C.; Koenig, W.; Kolehmainen, M.; Lindstrom, J.; Tuomilehto, J.; Uusitupa, M. The genetic variation of the tenomodulin gene (TNMD) is associated with serum levels of systemic immune mediators—The finnish diabetes prevention study. Genet. Med 2008, 10, 536–544. [Google Scholar]
- Kolehmainen, M.; Salopuro, T.; Schwab, U.S.; Kekalainen, J.; Kallio, P.; Laaksonen, D.E.; Pulkkinen, L.; Lindi, V.I.; Sivenius, K.; Mager, U.; et al. Weight reduction modulates expression of genes involved in extracellular matrix and cell death: The genobin study. Int. J. Obes. (Lond. ) 2008, 32, 292–303. [Google Scholar]
- Piperi, C.; Adamopoulos, C.; Dalagiorgou, G.; Diamanti-Kandarakis, E.; Papavassiliou, A.G. Crosstalk between advanced glycation and endoplasmic reticulum stress: Emerging therapeutic targeting for metabolic diseases. J. Clin. Endocrinol. Metab 2012, 97, 2231–2242. [Google Scholar]
- Blouin, K.; Richard, C.; Brochu, G.; Hould, F.S.; Lebel, S.; Marceau, S.; Biron, S.; Luu-The, V.; Tchernof, A. Androgen inactivation and steroid-converting enzyme expression in abdominal adipose tissue in men. J. Endocrinol 2006, 191, 637–649. [Google Scholar]
- Blouin, K.; Veilleux, A.; Luu-The, V.; Tchernof, A. Androgen metabolism in adipose tissue: Recent advances. Mol. Cell. Endocrinol 2009, 301, 97–103. [Google Scholar]
- Wake, D.J.; Strand, M.; Rask, E.; Westerbacka, J.; Livingstone, D.E.; Soderberg, S.; Andrew, R.; Yki-Jarvinen, H.; Olsson, T.; Walker, B.R. Intra-adipose sex steroid metabolism and body fat distribution in idiopathic human obesity. Clin. Endocrinol. (Oxf. ) 2007, 66, 440–446. [Google Scholar]
- Svensson, P.A.; Gabrielsson, B.G.; Jernas, M.; Gummesson, A.; Sjoholm, K. Regulation of human aldoketoreductase 1C3 (AKR1C3) gene expression in the adipose tissue. Cell. Mol. Biol. Lett 2008, 13, 599–613. [Google Scholar]
- Costes, S.; Huang, C.J.; Gurlo, T.; Daval, M.; Matveyenko, A.V.; Rizza, R.A.; Butler, A.E.; Butler, P.C. β-cell dysfunctional ERAD/ubiquitin/proteasome system in type 2 diabetes mediated by islet amyloid polypeptide-induced UCH-L1 deficiency. Diabetes 2011, 60, 227–238. [Google Scholar]
- Lefebvre, B.; Benomar, Y.; Guedin, A.; Langlois, A.; Hennuyer, N.; Dumont, J.; Bouchaert, E.; Dacquet, C.; Penicaud, L.; Casteilla, L.; et al. Proteasomal degradation of retinoid X receptor α reprograms transcriptional activity of PPARγ in obese mice and humans. J. Clin. Invest 2010, 120, 1454–1468. [Google Scholar]
- Palming, J.; Sjoholm, K.; Jernas, M.; Lystig, T.C.; Gummesson, A.; Romeo, S.; Lonn, L.; Lonn, M.; Carlsson, B.; Carlsson, L.M. The expression of NAD(P)H: Quinone oxidoreductase 1 is high in human adipose tissue, reduced by weight loss, and correlates with adiposity, insulin sensitivity, and markers of liver dysfunction. J. Clin. Endocrinol. Metab 2007, 92, 2346–2352. [Google Scholar]
- Joo, J.I.; Kim, D.H.; Choi, J.W.; Yun, J.W. Proteomic analysis for antiobesity potential of capsaicin on white adipose tissue in rats fed with a high fat diet. J. Proteome Res 2010, 9, 2977–2987. [Google Scholar]
- Ke, L.; Meijering, R.A.; Hoogstra-Berends, F.; Mackovicova, K.; Vos, M.J.; van Gelder, I.C.; Henning, R.H.; Kampinga, H.H.; Brundel, B.J. HSPB1, HSPB6, HSPB7 and HSPB8 protect against RhoA GTPase-induced remodeling in tachypaced atrial myocytes. PLoS One 2011, 6, e20395. [Google Scholar]
- Cappola, T.P.; Li, M.; He, J.; Ky, B.; Gilmore, J.; Qu, L.; Keating, B.; Reilly, M.; Kim, C.E.; Glessner, J.; et al. Common variants in HSPB7 and FRMD4B associated with advanced heart failure. Circ. Cardiovasc. Genet 2010, 3, 147–154. [Google Scholar]
- Chazenbalk, G.; Chen, Y.H.; Heneidi, S.; Lee, J.M.; Pall, M.; Chen, Y.D.; Azziz, R. Abnormal expression of genes involved in inflammation, lipid metabolism, and Wnt signaling in the adipose tissue of polycystic ovary syndrome. J. Clin. Endocrinol. Metab 2012, 97, E765–E770. [Google Scholar]
- Jones, M.R.; Chazenbalk, G.; Xu, N.; Chua, A.K.; Eigler, T.; Mengesha, E.; Chen, Y.H.; Lee, J.M.; Pall, M.; Li, X.; et al. Steroidogenic regulatory factor FOS is underexpressed in polycystic ovary syndrome (PCOS) adipose tissue and genetically associated with PCOS susceptibility. J. Clin. Endocrinol. Metab 2012, 97, E1750–E1757. [Google Scholar]
- De Zegher, F.; Lopez-Bermejo, A.; Ibanez, L. Adipose tissue expandability and the early origins of pcos. Trends Endocrinol. Metab 2009, 20, 418–423. [Google Scholar]
- Panidis, D.; Tziomalos, K.; Macut, D.; Kandaraki, E.A.; Tsourdi, E.A.; Papadakis, E.; Katsikis, I. Age- and body mass index-related differences in the prevalence of metabolic syndrome in women with polycystic ovary syndrome. Gynecol. Endocrinol. 2013. [Google Scholar] [CrossRef]
- Shefer, G.; Benayahu, D. SVEP1 is a novel marker of activated pre-determined skeletal muscle satellite cells. Stem Cell Rev 2010, 6, 42–49. [Google Scholar]
- Shur, I.; Socher, R.; Hameiri, M.; Fried, A.; Benayahu, D. Molecular and cellular characterization of SEL-OB/SVEP1 in osteogenic cells in vivo and in vitro. J. Cell. Physiol 2006, 206, 420–427. [Google Scholar]
- Kim, Y.; Park, T. DNA microarrays to define and search for genes associated with obesity. Biotechnol. J 2010, 5, 99–112. [Google Scholar]
- Lee, Y.H.; Nair, S.; Rousseau, E.; Allison, D.B.; Page, G.P.; Tataranni, P.A.; Bogardus, C.; Permana, P.A. Microarray profiling of isolated abdominal subcutaneous adipocytes from obese vs. non-obese pima indians: Increased expression of inflammation-related genes. Diabetologia 2005, 48, 1776–1783. [Google Scholar]
- Nair, S.; Lee, Y.H.; Rousseau, E.; Cam, M.; Tataranni, P.A.; Baier, L.J.; Bogardus, C.; Permana, P.A. Increased expression of inflammation-related genes in cultured preadipocytes/stromal vascular cells from obese compared with non-obese Pima indians. Diabetologia 2005, 48, 1784–1788. [Google Scholar]
- Celik, C.; Abali, R.; Guzel, S.; Bastu, E.; Kucukyalcin, V.; Yilmaz, M. Elevated circulating levels of YKL-40 are a marker of abnormal glucose tolerance in women with polycystic ovary syndrome. Clin. Endocrinol. (Oxf. ) 2012, 77, 893–897. [Google Scholar]
- Kyrgios, I.; Galli-Tsinopoulou, A.; Stylianou, C.; Papakonstantinou, E.; Arvanitidou, M.; Haidich, A.B. Elevated circulating levels of the serum acute-phase protein YKL-40 (chitinase 3-like protein 1) are a marker of obesity and insulin resistance in prepubertal children. Metabolism 2012, 61, 562–568. [Google Scholar]
- Schaller, G.; Brix, J.M.; Placher-Sorko, G.; Hollerl, F.; Schernthaner, G.H.; Schernthaner, G. YKL-40 concentrations are not elevated in gestational diabetes. Eur. J. Clin. Invest 2010, 40, 339–343. [Google Scholar]
- Woollard, K.J.; Geissmann, F. Monocytes in atherosclerosis: Subsets and functions. Nat. Rev. Cardiol 2010, 7, 77–86. [Google Scholar]
- Martinez-Gonzalez, M.A.; Lopez-Fontana, C.; Varo, J.J.; Sanchez-Villegas, A.; Martinez, J.A. Validation of the Spanish version of the physical activity questionnaire used in the nurses’ health study and the health professionals’ follow-up study. Public Health Nutr 2005, 8, 920–927. [Google Scholar]
- De la Iglesia, R.; Lopez-Legarrea, P.; Celada, P.; Sanchez-Muniz, F.J.; Martinez, J.A.; Zulet, M.A. Beneficial effects of the RESMENA dietary pattern on oxidative stress in patients suffering from metabolic syndrome with hyperglycemia are associated to dietary TAC and fruit consumption. Int. J. Mol. Sci 2013, 14, 6903–6919. [Google Scholar]
- Colombo, M.; Kruhoeffer, M.; Gregersen, S.; Agger, A.; Jeppesen, P.; Oerntoft, T.; Hermansen, K. Energy restriction prevents the development of type 2 diabetes in zucker diabetic fatty rats: Coordinated patterns of gene expression for energy metabolism in insulin-sensitive tissues and pancreatic islets determined by oligonucleotide microarray analysis. Metabolism 2006, 55, 43–52. [Google Scholar]
- Gene Ontology Website. Available online: http://www.geneontology.org (accessed on 11 January 2013).
- Zhang, B.; Kirov, S.; Snoddy, J. Webgestalt: An integrated system for exploring gene sets in various biological contexts. Nucleic Acids Res 2005, 33, W741–W748. [Google Scholar]

| Baseline descriptive characteristics | Lean (n = 9) | Obese (n = 9) | p value | ||
|---|---|---|---|---|---|
| Mean | SE | Mean | SE | ||
| Energy (Kcal) | 2,766.7 | 258.7 | 2799.1 | 171.4 | 0.918 |
| Fat intake (%E) | 44.6 | 2.2 | 42.5 | 1.8 | 0.573 |
| Physical activity (METs h/week) | 17.5 | 5.1 | 18.0 | 4.4 | 0.945 |
| Watching TV (METs h/week) | 12.2 | 2.5 | 10.2 | 3.2 | 0.621 |
| BMI (kg/m2) | 23.1 | 0.4 | 34.7 | 1.2 | 0.000 |
| Waist circumference (cm) | 78.7 | 1.2 | 105.7 | 2.6 | 0.000 |
| QUICKI | 0.40 | 0.00 | 0.35 | 0.01 | 0.004 |
| Triglycerides (mg/dL) | 85.0 | 6.7 | 142.2 | 10.6 | 0.001 |
| Total Cholesterol (mg/dL) | 167.4 | 17.7 | 188.5 | 6.3 | 0.008 |
| HDL-Cholesterol (mg/dL) | 43.3 | 1.7 | 40.0 | 2.4 | 0.059 |
| Total Cholesterol/HDL-C | 3.5 | 0.2 | 5.0 | 0.3 | 0.003 |
| Systolic BP (mmHg) | 122.5 | 3.6 | 139.1 | 2.8 | 0.002 |
| Diastolic BP (mmHg) | 74.0 | 2.2 | 82.8 | 3.0 | 0.002 |
| Gene name | Gene symbol | SLR (Microarray) | Lean | Obese | RT-PCR p value | |||
|---|---|---|---|---|---|---|---|---|
| Mean | SD | Mean | SD | Mean | SD | |||
| Upregulated | ||||||||
| Activated leukocyte cell adhesion molecule | ALCAM | 0.73 | 0.33 | 1.0 | 0.2 | 4.9 | 3.9 | 0.048 |
| Cathepsin B | CTSB | 0.65 | 0.45 | 1.0 | 0.2 | 1.8 | 0.4 | 0.026 |
| Complement component 1, S subcomponent | C1S | 0.58 | 0.25 | 1.0 | 0.2 | 2.3 | 0.4 | 0.003 |
| Chitinase 3-like 1 (CHI3L1) or human cartilage glycoprotein-39 | YKL-40 | 1.28 | 0.53 | 1.0 | 0.2 | 1.9 | 0.4 | 0.026 |
| EGF-like-domain, multiple 6 | EGFL6 | 3.13 | 0.79 | 1.0 | 0.2 | 2.0 | 0.4 | 0.015 |
| Macrophage migration inhibitory factor | MIF | 0.58 | 0.10 | 1.0 | 0.4 | 2.8 | 1.0 | 0.031 |
| Palladin | PALLD | 1.10 | 0.22 | 1.0 | 0.3 | 2.5 | 1.7 | 0.037 |
| Serum amyloid A2 | SAA2 | 0.93 | 0.91 | 1.0 | 1.8 | 6.8 | 4.6 | 0.020 |
| Tenomodulin | TNMD | 1.53 | 0.56 | 1.0 | 0.2 | 5.0 | 0.3 | 0.003 |
| Downregulated | ||||||||
| Cbp/p300-interacting transactivator | CITED2 | −1.05 | 0.26 | 1.0 | 0.4 | 0.3 | 0.1 | 0.019 |
| v-Fos FBJ murine osteosarcoma viral oncogene | FOS | −2.75 | 2.10 | 1.0 | 0.2 | 0.9 | 0.4 | 0.998 |
| Nuclear receptor subfamily 3, group C, member 1 | NR3C1 | −0.90 | 0.18 | 1.0 | 0.2 | 0.2 | 0.1 | 0.028 |
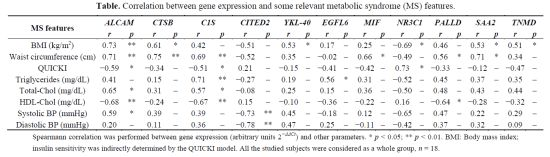
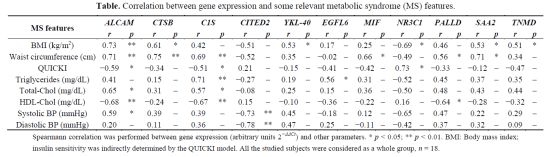
| MS features | ALCAM | CTSB | C1S | CITED2 | YKL-40 | EGFL6 | MIF | NR3C1 | PALLD | SAA2 | TNMD | |||||||||||
|---|---|---|---|---|---|---|---|---|---|---|---|---|---|---|---|---|---|---|---|---|---|---|
| r | p | r | p | r | p | r | p | r | p | r | p | r | p | r | p | r | p | r | p | r | p | |
| BMI (kg/m2) | 0.73 | ** | 0.61 | * | 0.42 | – | −0.51 | – | 0.53 | * | 0.17 | – | 0.25 | – | −0.69 | * | 0.46 | – | 0.53 | * | 0.51 | * |
| Waist circumference (cm) | 0.71 | ** | 0.75 | ** | 0.69 | ** | −0.52 | – | 0.35 | – | −0.02 | – | 0.66 | * | −0.49 | – | 0.56 | * | 0.71 | * | 0.34 | – |
| QUICKI | −0.59 | * | −0.34 | – | −0.51 | * | 0.21 | – | −0.15 | – | −0.41 | – | −0.42 | – | 0.73 | * | −0.33 | – | −0.12 | – | −0.47 | – |
| Triglycerides (mg/dL) | 0.41 | – | 0.15 | – | 0.71 | ** | −0.27 | – | 0.19 | – | 0.56 | * | 0.31 | – | −0.52 | – | 0.45 | – | 0.37 | – | 0.35 | – |
| Total-Chol (mg/dL) | 0.65 | * | 0.31 | – | 0.57 | * | −0.08 | – | 0.25 | – | 0.15 | – | 0.36 | – | −0.50 | – | 0.48 | – | 0.43 | – | 0.44 | – |
| HDL-Chol (mg/dL) | −0.68 | ** | −0.24 | – | −0.67 | ** | 0.15 | – | −0.10 | – | −0.36 | – | −0.22 | – | 0.16 | – | −0.64 | * | −0.28 | – | −0.32 | – |
| Systolic BP (mmHg) | 0.59 | * | 0.39 | – | 0.39 | – | −0.73 | ** | 0.45 | – | −0.18 | – | 0.12 | – | −0.65 | – | 0.47 | – | 0.22 | – | 0.29 | – |
| Diastolic BP (mmHg) | 0.20 | – | 0.11 | – | 0.36 | – | −0.78 | ** | 0.47 | – | 0.25 | – | −0.11 | – | −0.42 | – | 0.37 | – | 0.32 | – | 0.09 | – |
© 2013 by the authors; licensee MDPI, Basel, Switzerland This article is an open access article distributed under the terms and conditions of the Creative Commons Attribution license (http://creativecommons.org/licenses/by/3.0/).
Share and Cite
González-Muniesa, P.; Marrades, M.P.; Martínez, J.A.; Moreno-Aliaga, M.J. Differential Proinflammatory and Oxidative Stress Response and Vulnerability to Metabolic Syndrome in Habitual High-Fat Young Male Consumers Putatively Predisposed by Their Genetic Background. Int. J. Mol. Sci. 2013, 14, 17238-17255. https://0-doi-org.brum.beds.ac.uk/10.3390/ijms140917238
González-Muniesa P, Marrades MP, Martínez JA, Moreno-Aliaga MJ. Differential Proinflammatory and Oxidative Stress Response and Vulnerability to Metabolic Syndrome in Habitual High-Fat Young Male Consumers Putatively Predisposed by Their Genetic Background. International Journal of Molecular Sciences. 2013; 14(9):17238-17255. https://0-doi-org.brum.beds.ac.uk/10.3390/ijms140917238
Chicago/Turabian StyleGonzález-Muniesa, Pedro, María Pilar Marrades, José Alfredo Martínez, and María Jesús Moreno-Aliaga. 2013. "Differential Proinflammatory and Oxidative Stress Response and Vulnerability to Metabolic Syndrome in Habitual High-Fat Young Male Consumers Putatively Predisposed by Their Genetic Background" International Journal of Molecular Sciences 14, no. 9: 17238-17255. https://0-doi-org.brum.beds.ac.uk/10.3390/ijms140917238