Pattern Recognition Techniques Applied to the Study of Leishmanial Glyceraldehyde-3-Phosphate Dehydrogenase Inhibition

Abstract
:1. Introduction
2. Results and Discussion
2.1. Unsupervised Pattern Recognition
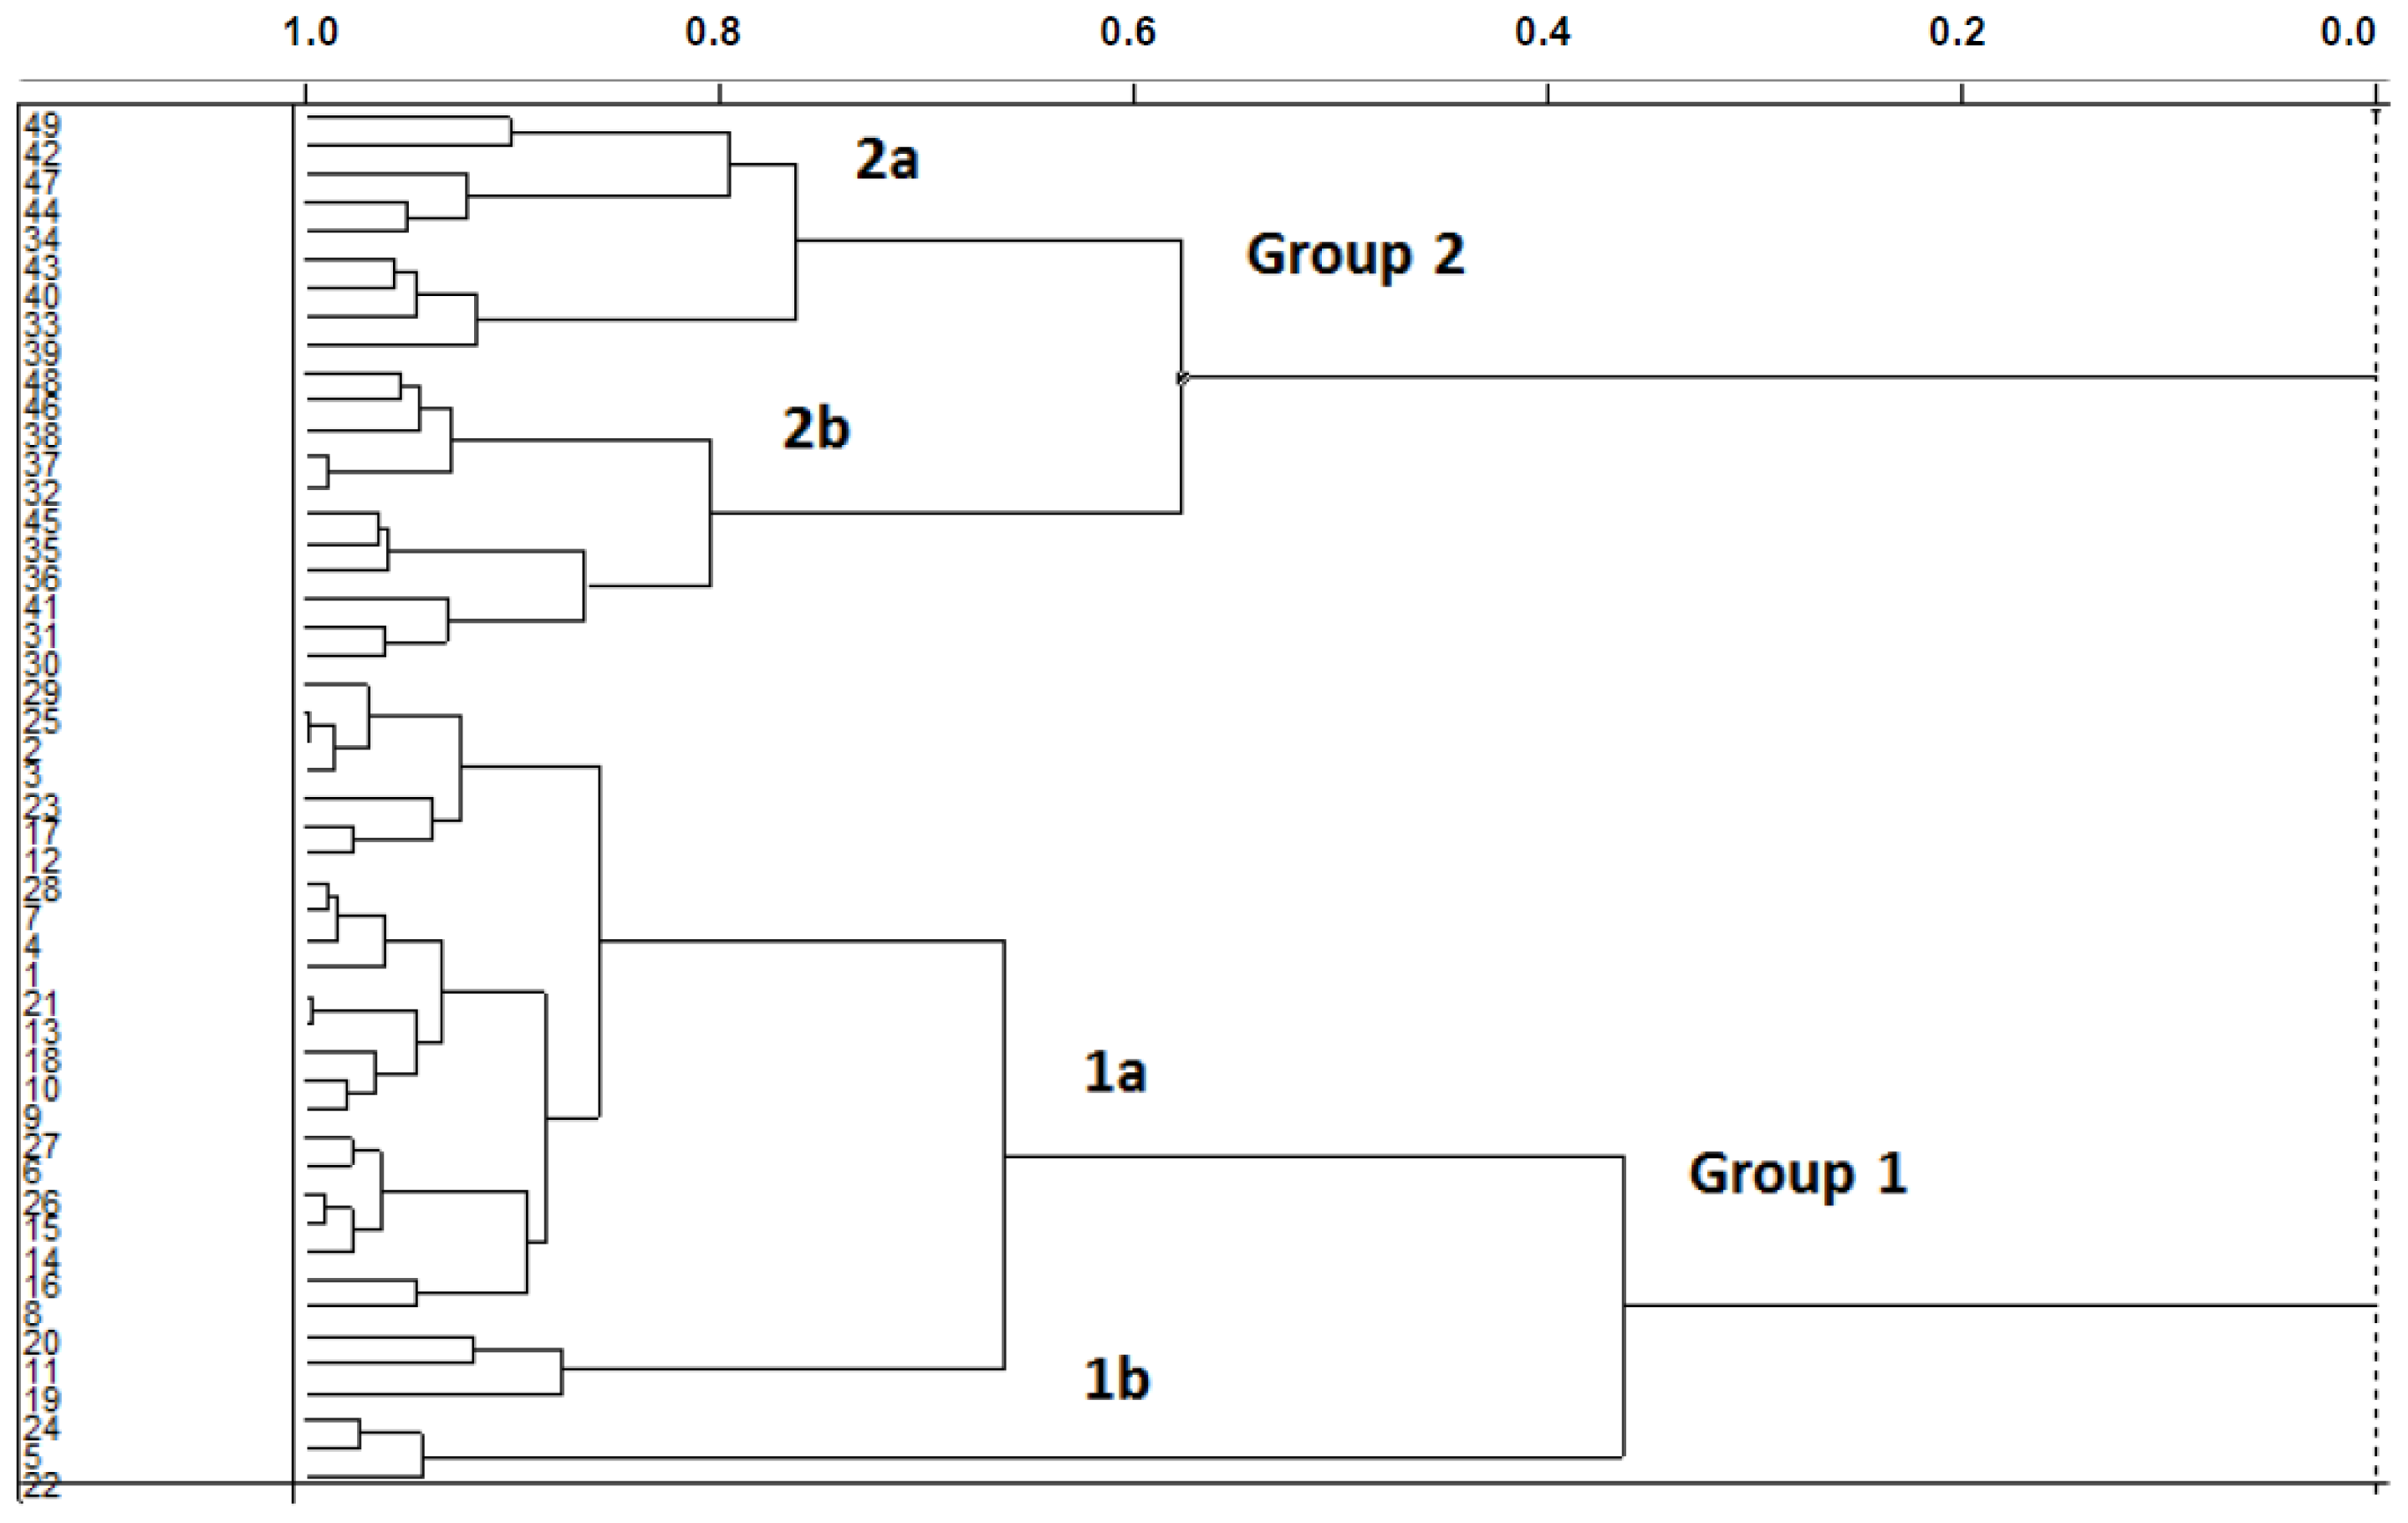
2.1.1. Hierarchical Cluster Analysis
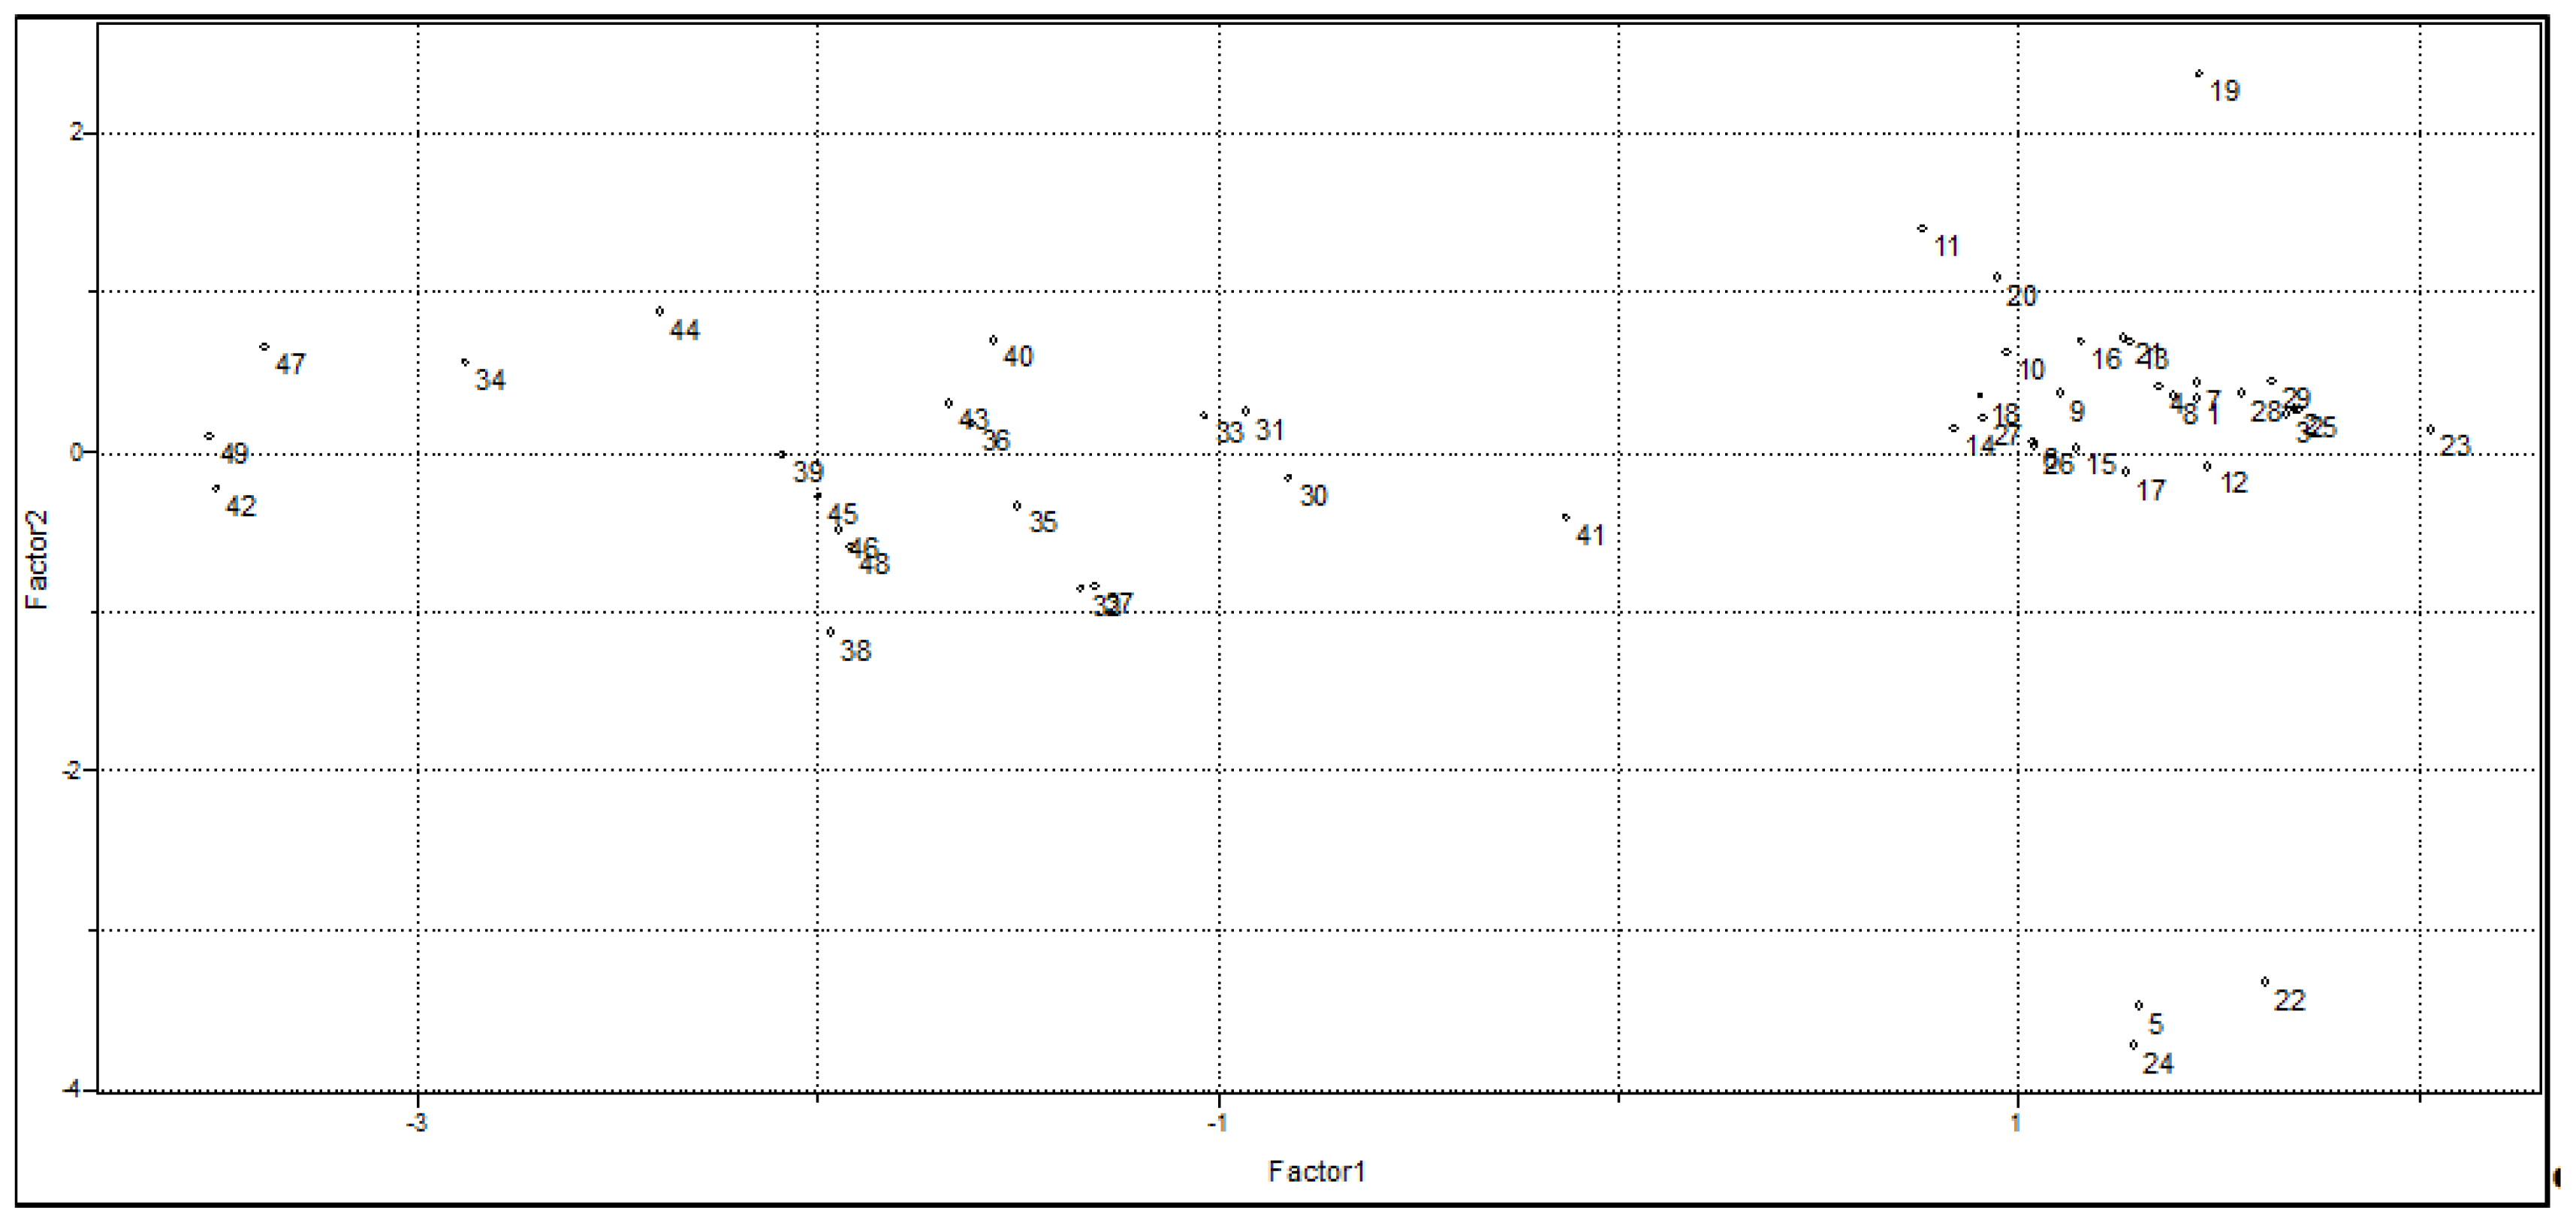
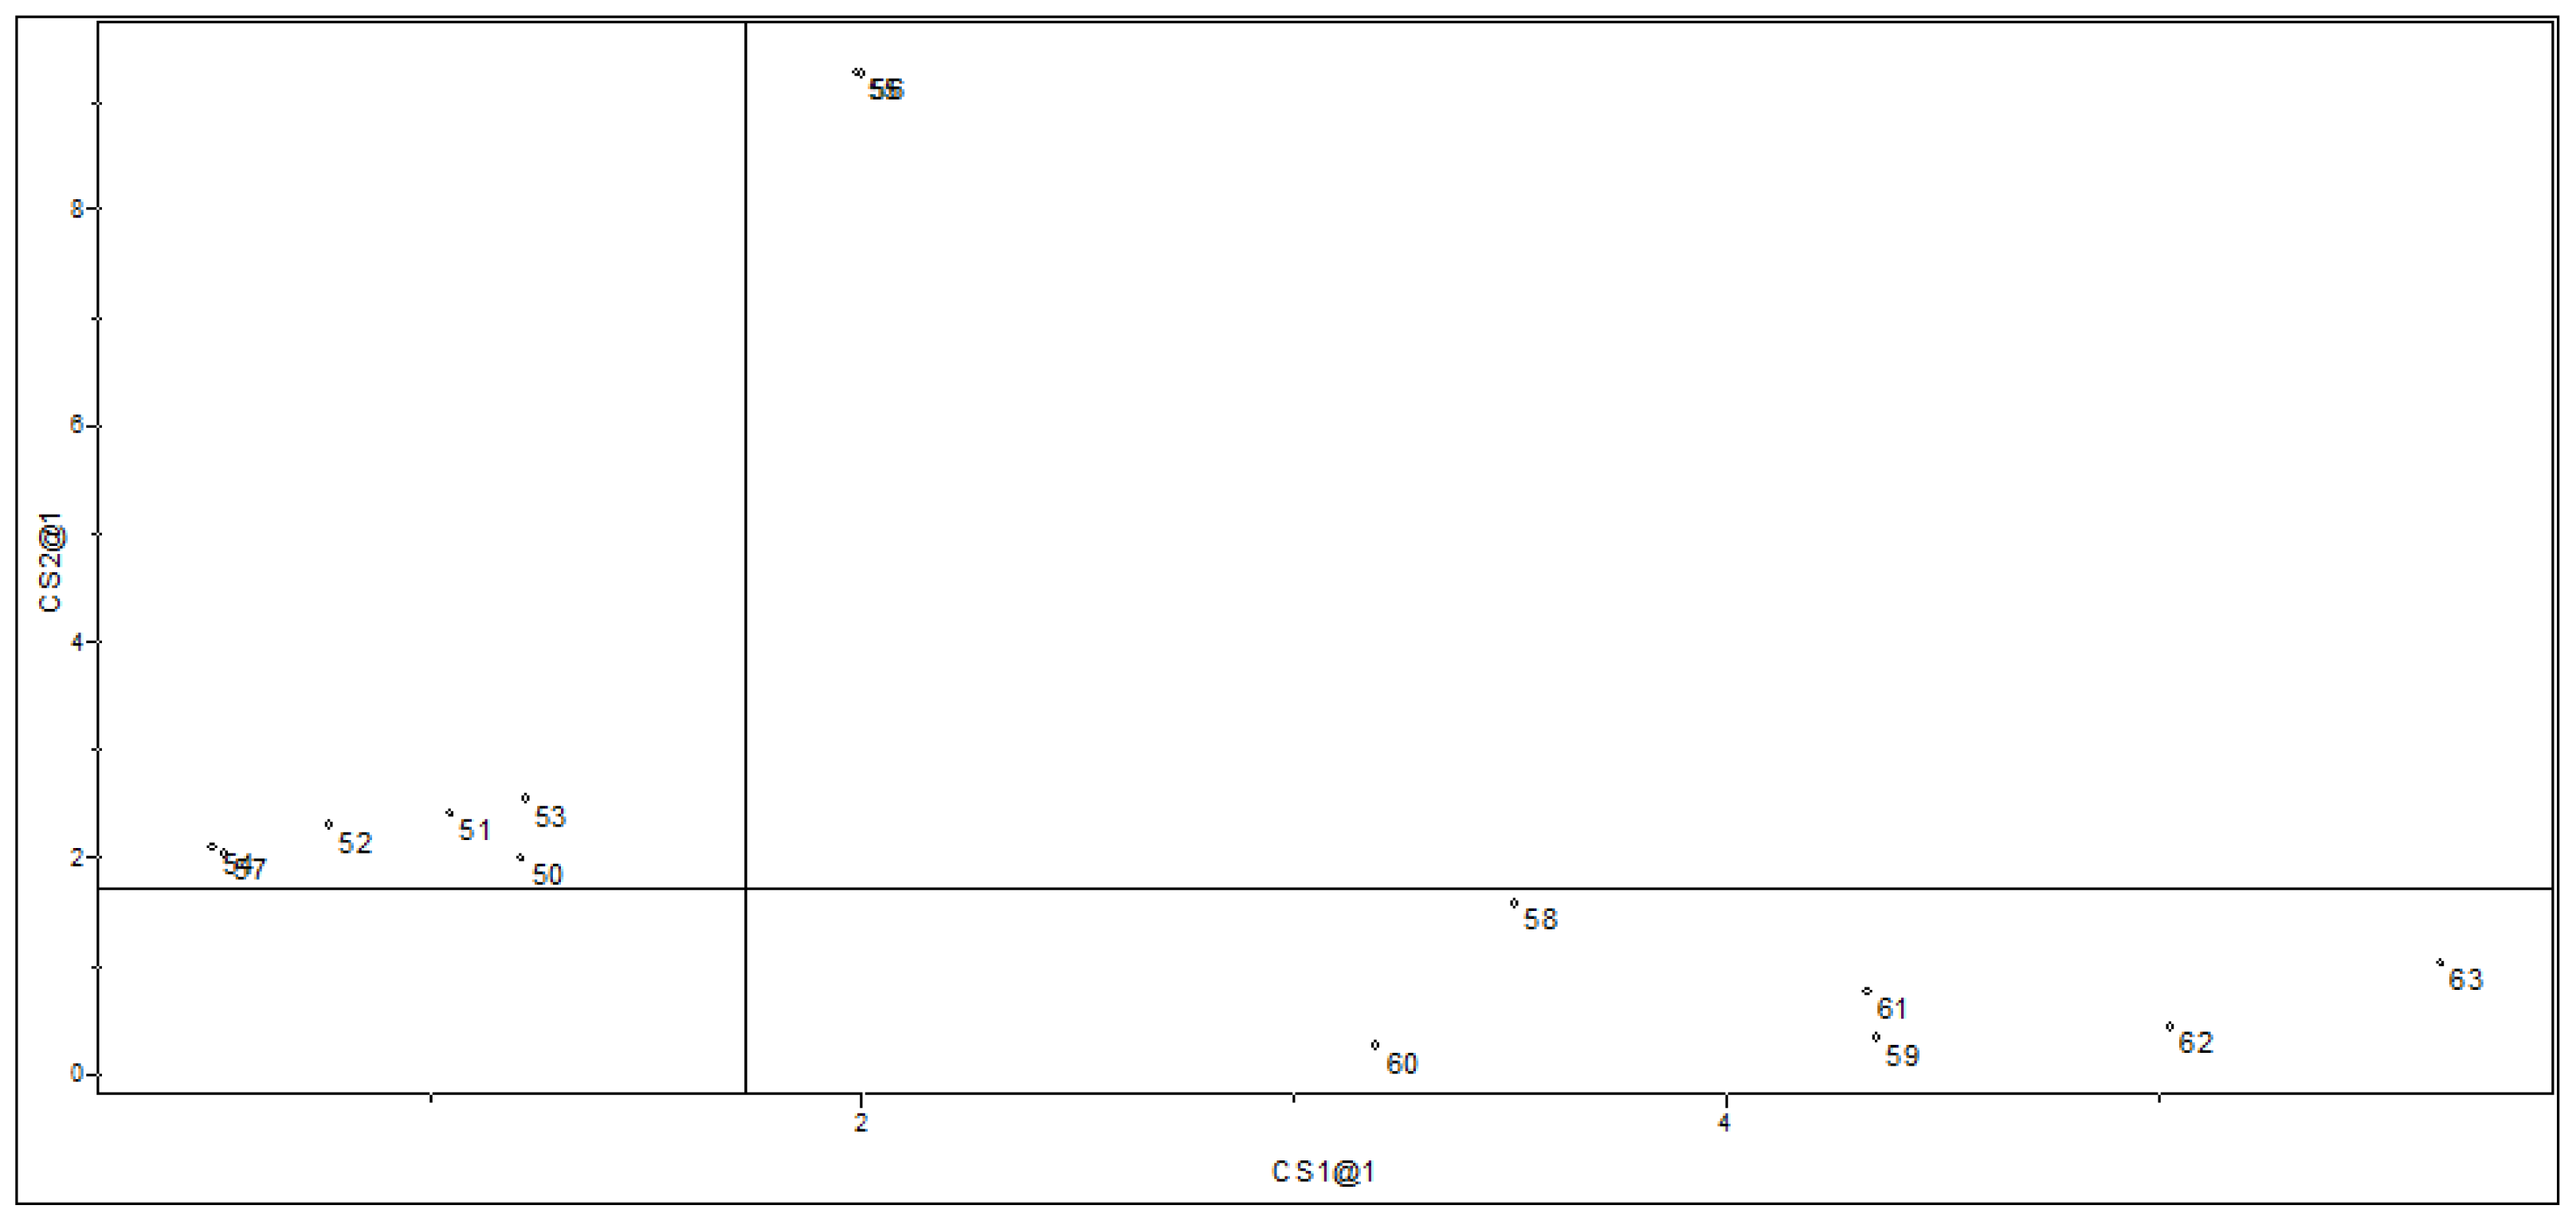
2.1.2. Principal Component Analysis
2.2. Supervised Pattern Recognition
2.2.1. KNN Results
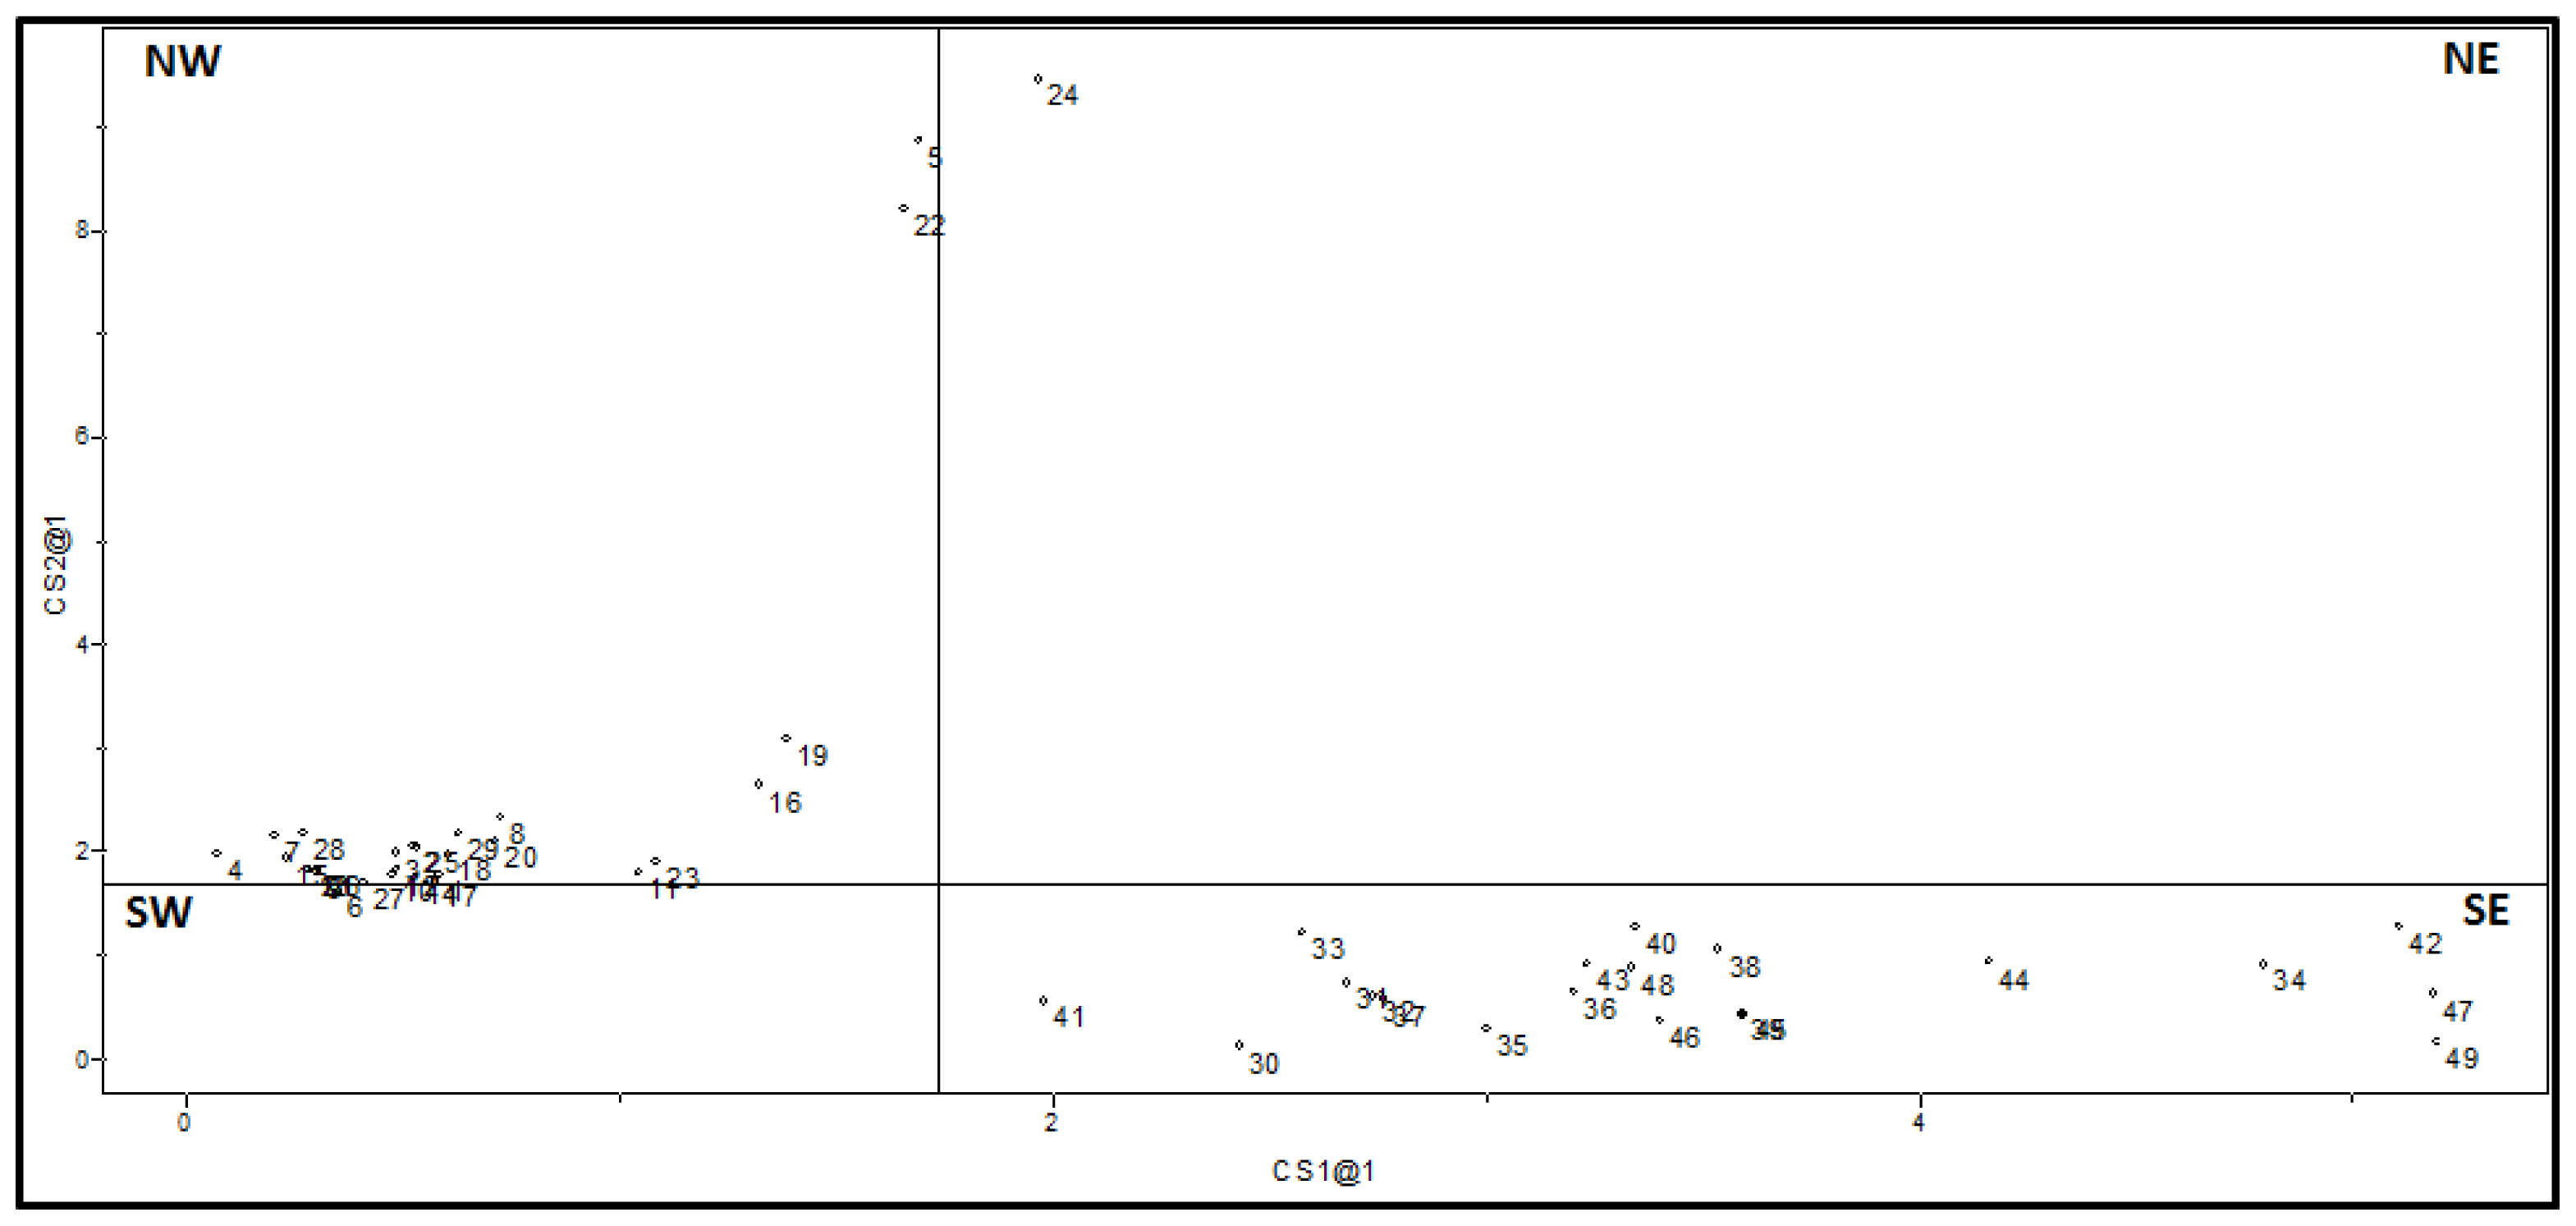
2.2.2. SIMCA Results
3. Experimental Section
3.1. Data Set
3.2. Geometry Optimization and Descriptor Calculations
3.3. Variable Selection and Chemometric Analyses
3.4. Pattern Recognition Analyses
4. Conclusions
Supplementary Information
ijms-15-03186-s001.pdfAcknowledgments
Conflicts of Interest
References
- World Health Organization. Control of the leishmaniases. Report of a WHO expert committee. World Health Organ. Tech. Rep. Ser 2010, 949, 1–186.
- Bell, A.S.; Mills, J.E.; Williams, G.P.; Brannigan, J.A.; Wilkinson, A.J.; Parkinson, T.; Leatherbarrow, R.J.; Tate, E.W.; Holder, A.A.; Smith, D.F. Selective inhibitors of protozoan protein N-myristoyltransferases as starting points for tropical disease medicinal chemistry programs. PLoS Negl. Trop. Dis 2012, 6, e1625. [Google Scholar]
- Den Boer, M.; Argaw, D.; Jannin, J.; Alvar, J. Leishmaniasis impact and treatment access. Clin. Microbiol. Infect 2011, 17, 1471–1477. [Google Scholar]
- Dorlo, T.P.C.; Eggelte, T.A.; Schoone, G.J.; de Vries, P.J.; Beijnen, J.H. A poor-quality generic drug for the treatment of visceral leishmaniasis: A case report and appeal. PLoS Negl. Trop. Dis 2012, 6, e1544. [Google Scholar]
- Ladame, S.; Castilho, M.S.; Silva, C.H.T.P.; Denier, C.; Hannaert, V.; Périé, J.; Oliva, G.; Willson, M. Crystal structure of Trypanosoma cruzi glyceraldehyde-3-phosphate dehydrogenase complexed with an analogue of 1,3-bisphospho-d-glyceric acid. Eur. J. Biochem 2003, 270, 4574–4586. [Google Scholar]
- Cook, W.J.; Senkovich, O.; Chattopadhyay, D. An unexpected phosphate binding site in glyceraldehyde 3-phosphate dehydrogenase: Crystal structures of apo, holo and ternary complex of Cryptosporidium parvum enzyme. BMC Struc. Biol 2009, 9, 9–22. [Google Scholar]
- Kim, H.; Ingeborg, K.; Feil, I.K.; Verlinde, C.L.; Petra, P.H.; Hol, W.G. Crystal structure of glycosomal glyceraldehyde-3-phosphate dehydrogenase from Leishmania mexicana: Implications for structure-based drug design and a new position for the inorganic phosphate binding site. Biochemistry 1995, 34, 14975–14986. [Google Scholar]
- Suresh, S.; Bressi, J.C.; Kennedy, K.J.; Verlinde, C.L.; Gelb, M.H.; Hol, W.G. Conformational changes in Leishmania mexicana glyceraldehyde-3-phosphate dehydrogenase induced by designed inhibitors. J. Mol. Biol 2001, 309, 423–435. [Google Scholar]
- Verlinde, C.L.; Callens, M.; van Calenbergh, S.; van Aerschot, A.; Herdewijn, P.; Hannaert, V.; Michels, P.A.; Opperdoes, F.R.; Hol, W.G. Selective inhibition of trypanosomal glyceraldehyde-3-phosphate dehydrogenase by protein structure-based design: Toward new drugs for the treatment of sleeping sickness. J. Med. Chem 1994, 37, 3605–3613. [Google Scholar]
- Van Calenbergh, S.; Verlinde, C.L.M.J.; Soenens, J.; de Bruyn, A.; Callens, M.; Blaton, N.M.; Peeters, O.M.; Herdewijn, P.; Rozenski, J.; Hal, W.G.J. Synthesis and structure-activity relationships of analogs of 2′-deoxy-2′-3(-methoxybenzamido)adenosine, a selective inhibitor of trypanosoma1 glycosomal glyceraldehyde-3-phosphate dehydrogenase. J. Med. Chem 1995, 38, 3838–3849. [Google Scholar]
- Aronov, A.M.; Verlinde, C.L.; Hol, W.G.; Gelb, M.H. Selective tight binding inhibitors of trypanosomal glyceraldehyde-3-phosphate dehydrogenase via structure-based drug design. J. Med. Chem 1998, 41, 4790–4799. [Google Scholar]
- Aronov, A.M.; Suresh, S.; Buckner, F.S.; van Voorhis, W.C.; Verlinde, C.L.; Opperdoes, F.R.; Hol, W.G.; Gelb, M.H. Structure-based design of submicromolar, biologically active inhibitors of trypanosomatid glyceraldehyde-3-phosphate dehydrogenase. Proc. Natl. Acad. Sci. USA 1999, 96, 4273–4278. [Google Scholar]
- Bressi, J.C.; Verlinde, C.L.; Aronov, A.M.; Shaw, M.L.; Shin, S.S.; Nguyen, L.N.; Suresh, S.; Buckner, F.S.; van Voorhis, W.C.; Kuntz, I.D.; et al. Adenosine analogues as selective inhibitors of glyceraldehyde-3-phosphate dehydrogenase of Trypanosomatidae via structure-based drug design. J. Med. Chem 2001, 44, 2080–2093. [Google Scholar]
- Putz, M.V.; Lacrămă, A.M. Introducing spectral structure activity relationship (S-SAR) analysis. Application to ecotoxicology. Int. J. Mol. Sci 2007, 8, 363–391. [Google Scholar]
- Putz, M.V. Residual-QSAR. Implications for genotoxic carcinogenesis. Chem. Cent. J 2011, 5, 1–11. [Google Scholar]
- Putz, M.V.; Ionaşcu, C.; Lacrămă, A.M.; Ostafe, V. Alert-QSAR. Implications for electrophilic theory of chemical carcinogenesis. Int. J. Mol. Sci 2011, 12, 5098–5134. [Google Scholar]
- Beebe, K.R.; Pell, R.J.; Seasholtz, M.B. Chemometrics: A Practical Guide; John Wiley & Sons: New York, NY, USA, 1998; p. 459. [Google Scholar]
- Arroio, A.; Honorio, K.M.; Da Silva, A.B.F. Propriedades químico-quânticas empregadas em estudos das relações estrutura-atividade. Quím. Nova 2010, 33, 694–699. [Google Scholar] [Green Version]
- Leslie, A.G.; Wonacott, A.J. Coenzyme binding in crystals of glyceraldehyde-3-phosphate dehydrogenase. J. Mol. Biol 1983, 165, 375–391. [Google Scholar]
- Pirouette: User’s Guide; Infometrix Inc.: Woodinville, DC, USA, 2002; p. 430.
- Guido, R.V.; Oliva, G.; Montanari, C.A.; Andricopulo, A.D. Structural basis for selective inhibition of trypanosomatid glyceraldehyde-3-phosphate dehydrogenase: Molecular docking and 3D QSAR studies. J. Chem. Inf. Mod 2008, 48, 918–929. [Google Scholar]
- Lozano, N.B.; Oliveira, R.F.; Weber, K.C.; Honorio, K.M.; Guido, R.V.; Andricopulo, A.D.; da Silva, A.B. Identification of electronic and structural descriptors of adenosine analogues related to inhibition of leishmanial glyceraldehyde-3-phosphate dehydrogenase. Molecules 2013, 18, 5032–5050. [Google Scholar]
- Stewart, J.J.P. Optimization of parameters for semiempirical methods. III Extension of PM3 to Be, Mg, Zn, Ga, Ge, As, Se, Cd, In, Sn, Sb, Te, Hg, Tl, Pb, and Bi. J. Comput. Chem 1991, 12, 320–341. [Google Scholar]
- Becke, A.D. Density-functional thermochemistry. III. The role of exact exchange. J. Chem. Phys 1993, 98, 5648–5652. [Google Scholar]
- Lee, C.; Yang, W.; Parr, R.G. Development of the colle-salvetti correlation-energy formula into a functional of the electron-density. Phys. Rev. B 1988, 37, 785–789. [Google Scholar]
- Gaussian, version 03, revision A.1; Frisch, M.J.; Trucks, G.W.; Schlegel, H.B.; Scuseria, G.E.; Robb, M.A.; Cheeseman, J.R.; Scalmani, G.; Barone, V.; Mennucci, B.; Petersson, G.A.; et al. Gaussian, Inc: Wallingford, CT, USA, 2003. [Google Scholar]
- Ivanciuc, O. HyperChem release 4.5 for windows. J. Chem. Inf. Comput. Sci 1996, 36, 612–614. [Google Scholar]
- Tetko, I.V.; Gasteiger, J.; Todeschini, R.; Mauri, A.; Livingstone, D.; Ertl, P.; Palyulin, V.A.; Radchenko, E.V.; Zefirov, N.S.; Makarenko, A.S.; et al. Virtual computational chemistry laboratory-design and description. J. Comput.-Aided Mol. Des 2005, 19, 453–463. [Google Scholar]
- Pirouette 3.11; Infometrix Inc.: Woodinville, DC, USA, 2002.


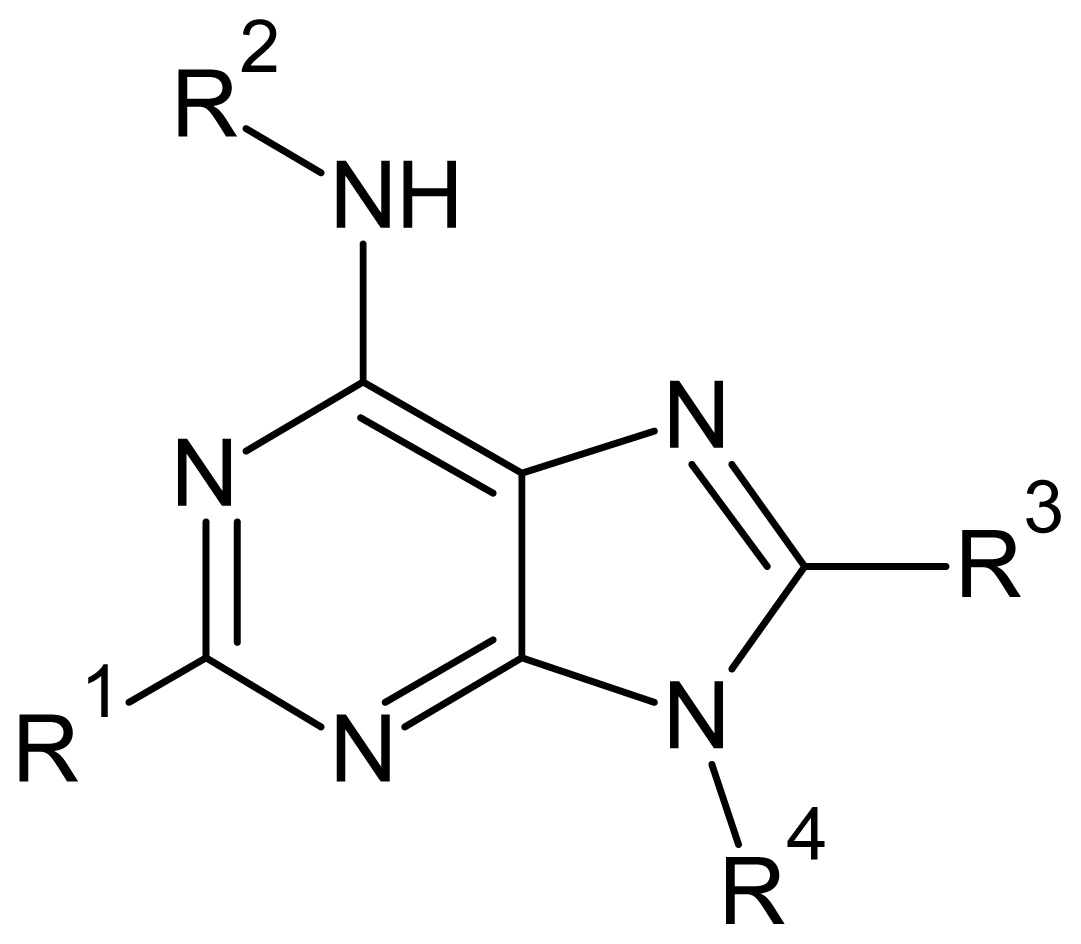
| Descriptor | Type | Definition |
|---|---|---|
| ELUMO | Electronic | Energy of the lowest unoccupied molecular orbital |
| QR2 | Electronic | Charge at substituent R2 |
| QR4 | Electronic | Charge at substituent R4 |
| Polarizability | Electronic | Molecular polarizability |
| Volume | Geometrical | Solvent-accessible surface-bounded molecular volume |
| Variable | PC1 | PC2 |
|---|---|---|
| ELUMO | 0.087 | −0.818 |
| QR2 | 0.497 | 0.299 |
| QR4 | −0.305 | 0.482 |
| Volume | 0.575 | 0.042 |
| Polarizability | 0.566 | 0.081 |
| Training set compounds | |||||
|---|---|---|---|---|---|
| Cpd | Structure | pIC50 | Cpd | Structure | pIC50 |
| 1 |  | 5.70 | 2 |  | 5.70 |
| 3 |  | 5.70 | 4 |  | 5.70 |
| 5 |  | 5.40 | 6 |  | 5.30 |
| 7 |  | 5.30 | 8 |  | 5.26 |
| 9 |  | 5.22 | 10 |  | 5.00 |
| 11 |  | 5.00 | 12 |  | 5.00 |
| 13 |  | 4.92 | 14 |  | 4.70 |
| 15 |  | 4.60 | 16 |  | 4.60 |
| 17 |  | 4.60 | 18 |  | 4.60 |
| 19 |  | 4.60 | 20 |  | 4.60 |
| 21 |  | 4.60 | 22 |  | 4.60 |
| 23 |  | 4.60 | 24 |  | 4.43 |
| 25 |  | 4.22 | 26 |  | 4.10 |
| 27 |  | 4.10 | 28 |  | 4.08 |
| 29 |  | 4.00 | 30 |  | 3.70 |
| 31 |  | 3.60 | 32 |  | 3.60 |
| 33 |  | 3.44 | 34 |  | 3.40 |
| 35 |  | 3.40 | 36 |  | 3.30 |
| 37 |  | 3.30 | 38 |  | 3.15 |
| 39 |  | 3.15 | 40 |  | 3.15 |
| 41 |  | 3.12 | 42 |  | 2.80 |
| 43 |  | 2.74 | 44 |  | 2.52 |
| 45 |  | 2.52 | 46 |  | 2.48 |
| 47 |  | 2.40 | 48 |  | 2.40 |
| 49 |  | 2.22 | |||
| Test Set Compounds | |||||
| Cpd | Structure | pIC50 | Cpd | Structure | pIC50 |
| 50 |  | 5.70 | 51 |  | 5.40 |
| 52 |  | 5.30 | 53 |  | 5.00 |
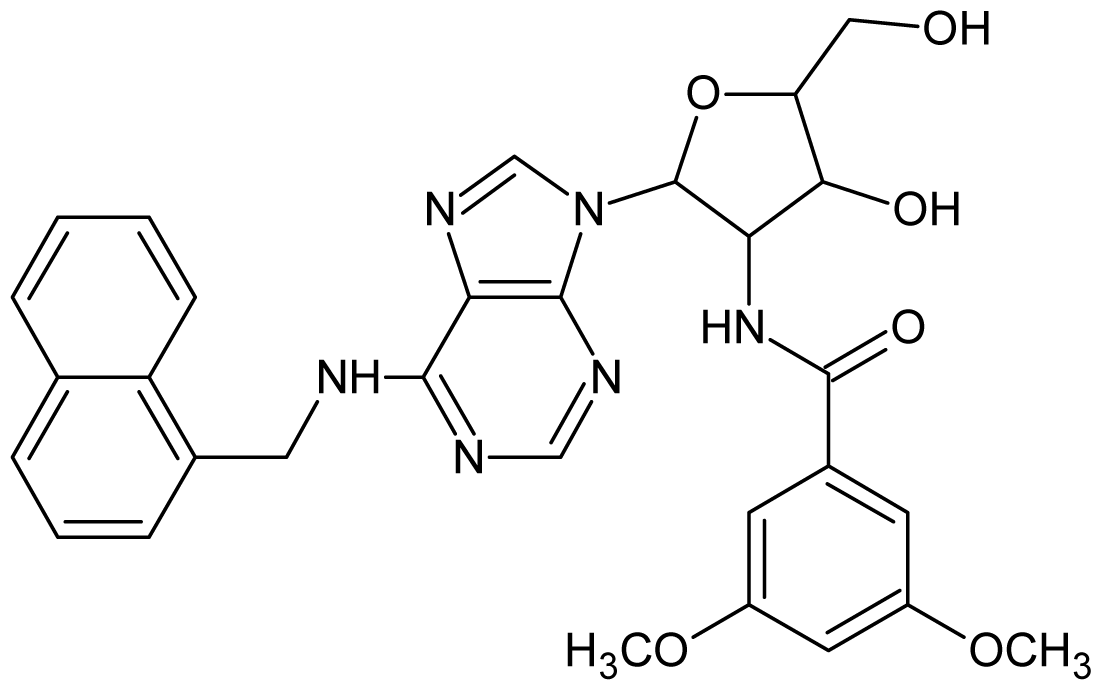
| 54 |  | 4.74 | 55 |  | 4.60 |
| Training set compounds | |||||
| Cpd | Structure | pIC50 | Cpd | Structure | pIC50 |
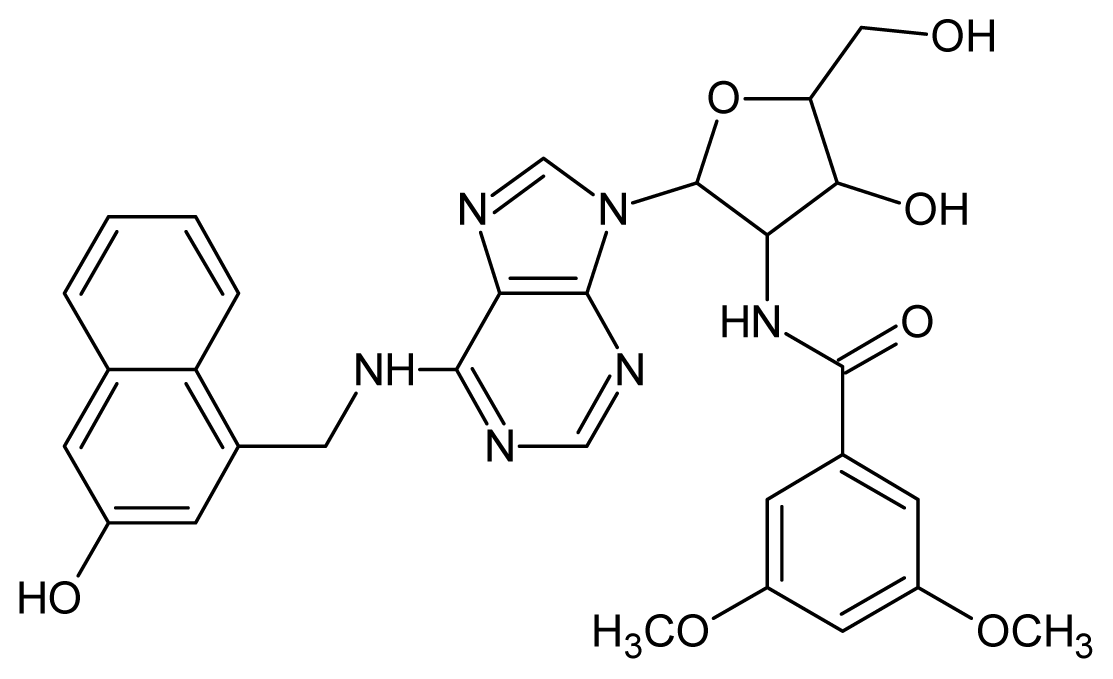
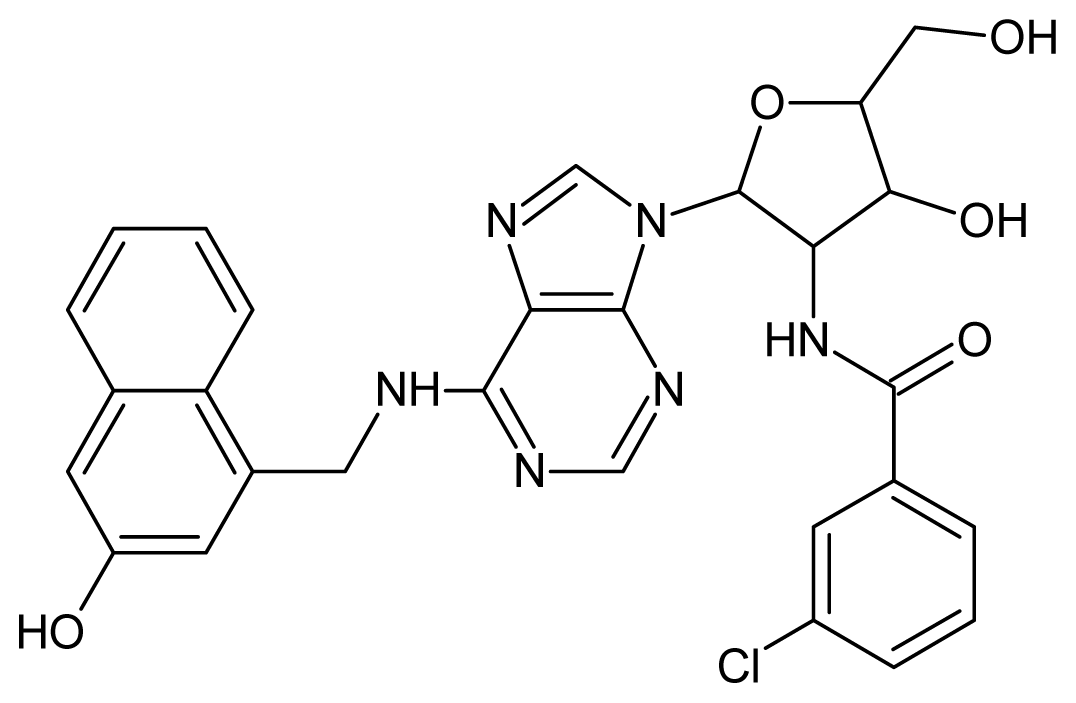
| 56 |  | 4.30 | 57 |  | 4.00 |
| 58 |  | 3.82 | 59 |  | 3.52 |
| 60 |  | 3.30 | 61 |  | 3.22 |
| 62 |  | 3.07 | 63 |  | 2.62 |
© 2014 by the authors; licensee MDPI, Basel, Switzerland This article is an open access article distributed under the terms and conditions of the Creative Commons Attribution license (http://creativecommons.org/licenses/by/3.0/).
Share and Cite
Lozano, N.B.H.; Oliveira, R.F.; Weber, K.C.; Honorio, K.M.; Guido, R.V.C.; Andricopulo, A.D.; De Sousa, A.G.; Da Silva, A.B.F. Pattern Recognition Techniques Applied to the Study of Leishmanial Glyceraldehyde-3-Phosphate Dehydrogenase Inhibition. Int. J. Mol. Sci. 2014, 15, 3186-3203. https://0-doi-org.brum.beds.ac.uk/10.3390/ijms15023186
Lozano NBH, Oliveira RF, Weber KC, Honorio KM, Guido RVC, Andricopulo AD, De Sousa AG, Da Silva ABF. Pattern Recognition Techniques Applied to the Study of Leishmanial Glyceraldehyde-3-Phosphate Dehydrogenase Inhibition. International Journal of Molecular Sciences. 2014; 15(2):3186-3203. https://0-doi-org.brum.beds.ac.uk/10.3390/ijms15023186
Chicago/Turabian StyleLozano, Norka B. H., Rafael F. Oliveira, Karen C. Weber, Kathia M. Honorio, Rafael V. C. Guido, Adriano D. Andricopulo, Alexsandro G. De Sousa, and Albérico B. F. Da Silva. 2014. "Pattern Recognition Techniques Applied to the Study of Leishmanial Glyceraldehyde-3-Phosphate Dehydrogenase Inhibition" International Journal of Molecular Sciences 15, no. 2: 3186-3203. https://0-doi-org.brum.beds.ac.uk/10.3390/ijms15023186