The G Protein-Coupled Receptor Heterodimer Network (GPCR-HetNet) and Its Hub Components

 ,
,
Abstract
:
1. Introduction
2. Results and Discussion
2.1. The GPCR-HetNet Dataset
2.2. Analysis of the GPCR-HetNet Architecture: Network Measures and Models
2.3. Hubs and Non-Hubs within the GPCR HetNet
2.4. Clustering and Modularity within the GPCR HetNet
3. Experimental Section
3.1. GPCR Receptor–Receptor Interaction Dataset
3.2. Network Construction and Analysis
3.3. Topological Features
3.4. Network Models
3.5. Hubs and Non-Hubs
3.6. Clusters and Motif
4. Conclusions
Acknowledgments
Conflicts of Interest
References
- Brinda, K.V.; Vishveshwara, S. Oligomeric protein structure networks: Insights into protein-protein interactions. BMC Bioinform 2005, 6, 296. [Google Scholar]
- Xia, Y.; Yu, H.; Jansen, R.; Seringhaus, M.; Baxter, S.; Greenbaum, D.; Zhao, H.; Gerstein, M. Analyzing cellular biochemistry in terms of molecular networks. Ann. Rev. Biochem 2004, 73, 1051–1087. [Google Scholar]
- Borroto-Escuela, D.O.; Agnati, L.F.; Fuxe, K.; Ciruela, F. Muscarinic acetylcholine receptor-interacting proteins (mAChRIPs): Targeting the receptorsome. Curr. Drug Targets 2012, 13, 53–71. [Google Scholar]
- Borroto-Escuela, D.O.; Correia, P.A.; Romero-Fernandez, W.; Narvaez, M.; Fuxe, K.; Ciruela, F.; Garriga, P. Muscarinic receptor family interacting proteins: Role in receptor function. J. Neurosci. Methods 2011, 195, 161–169. [Google Scholar]
- Choura, M.; Rebai, A. Application of computational approaches to study signalling networks of nuclear and Tyrosine kinase receptors. Biol. Direct 2010, 5, 58. [Google Scholar]
- Barabasi, A.L.; Oltvai, Z.N. Network biology: Understanding the cell’s functional organization. Nat. Rev. Genet 2004, 5, 101–113. [Google Scholar]
- Yook, S.H.; Oltvai, Z.N.; Barabasi, A.L. Functional and topological characterization of protein interaction networks. Proteomics 2004, 4, 928–942. [Google Scholar]
- Chandra, N.; Padiadpu, J. Network approaches to drug discovery. Expert Opin. Drug Discov 2013, 8, 7–20. [Google Scholar]
- Perica, T.; Marsh, J.A.; Sousa, F.L.; Natan, E.; Colwell, L.J.; Ahnert, S.E.; Teichmann, S.A. The emergence of protein complexes: Quaternary structure, dynamics and allostery. Colworth Medal Lecture. Biochem. Soc. Trans 2012, 40, 475–491. [Google Scholar]
- Dixon, R.A.; Kobilka, B.K.; Strader, D.J.; Benovic, J.L.; Dohlman, H.G.; Frielle, T.; Bolanowski, M.A.; Bennett, C.D.; Rands, E.; Diehl, R.E.; et al. Cloning of the gene and cDNA for mammalian beta-adrenergic receptor and homology with rhodopsin. Nature 1986, 321, 75–79. [Google Scholar]
- Fuxe, K.; Borroto-Escuela, D.O.; Romero-Fernandez, W.; Palkovits, M.; Tarakanov, A.O.; Ciruela, F.; Agnati, L.F. Moonlighting proteins and protein-protein interactions as neurotherapeutic targets in the G protein-coupled receptor field. Neuropsychopharmacology 2014, 39, 131–155. [Google Scholar]
- Borroto-Escuela, D.O.; Romero-Fernandez, W.; Garriga, P.; Ciruela, F.; Narvaez, M.; Tarakanov, A.O.; Palkovits, M.; Agnati, L.F.; Fuxe, K. G protein-coupled receptor heterodimerization in the brain. Methods Enzymol 2013, 521, 281–294. [Google Scholar]
- Borroto-Escuela, D.O.; Romero-Fernandez, W.; Rivera, A.; van Craenenbroeck, K.; Tarakanov, A.O.; Agnati, L.F.; Fuxe, K. On the G protein-coupled receptor heteromers and their allosteric receptor–receptor interactions in the central nervous system: Focus on their role in pain modulation. Evid. Based Complent. Altern. Med 2013, 2013, 563716. [Google Scholar]
- Fuxe, K.; Borroto-Escuela, D.O.; Marcellino, D.; Romero-Fernandez, W.; Frankowska, M.; Guidolin, D.; Filip, M.; Ferraro, L.; Woods, A.S.; Tarakanov, A.; et al. GPCR heteromers and their allosteric receptor–receptor interactions. Curr. Med. Chem 2012, 19, 356–363. [Google Scholar]
- Borroto-Escuela, D.O.; Tarakanov, A.O.; Guidolin, D.; Ciruela, F.; Agnati, L.F.; Fuxe, K. Moonlighting characteristics of G protein-coupled receptors: Focus on receptor heteromers and relevance for neurodegeneration. IUBMB Life 2011, 63, 463–472. [Google Scholar]
- Fuxe, K.; Marcellino, D.; Borroto-Escuela, D.O.; Frankowska, M.; Ferraro, L.; Guidolin, D.; Ciruela, F.; Agnati, L.F. The changing world of G protein-coupled receptors: From monomers to dimers and receptor mosaics with allosteric receptor–receptor interactions. J. Recept. Signal Transduct. Res 2010, 30, 272–283. [Google Scholar]
- Skieterska, K.; Duchou, J.; Lintermans, B.; van Craenenbroeck, K. Detection of G protein-coupled receptor (GPCR) dimerization by coimmunoprecipitation. Methods Cell Biol 2013, 117, 323–340. [Google Scholar]
- Van Craenenbroeck, K. GPCR oligomerization: Contribution to receptor biogenesis. In GPCR Signalling Complexes—Synthesis, Assembly, Trafficking and Specificity; Dupré, D.J., Hébert, T.E., Jockers, R., Eds.; Subcellular Biochemistry; Springer Netherlands: Dordrecht, The Netherland, 2012; Volume 63, pp. 43–65. [Google Scholar]
- Agnati, L.F.; Fuxe, K.; Zini, I.; Lenzi, P.; Hokfelt, T. Aspects on receptor regulation and isoreceptor identification. Med. Biol 1980, 58, 182–187. [Google Scholar]
- Agnati, L.F.; Fuxe, K.; Zoli, M.; Rondanini, C.; Ogren, S.O. New vistas on synaptic plasticity: The receptor mosaic hypothesis of the engram. Med. Biol 1982, 60, 183–190. [Google Scholar]
- Fuxe, K.; Agnati, L.F.; Benfenati, F.; Celani, M.; Zini, I.; Zoli, M.; Mutt, V. Evidence for the existence of receptor–receptor interactions in the central nervous system. Studies on the regulation of monoamine receptors by neuropeptides. J. Neural. Transm. Suppl 1983, 18, 165–179. [Google Scholar]
- Fuxe, K.; Agnati, L.F.; Benfenati, F.; Cimmino, M.; Algeri, S.; Hokfelt, T.; Mutt, V. Modulation by cholecystokinins of 3H-spiroperidol binding in rat striatum: evidence for increased affinity and reduction in the number of binding sites. Acta Physiol. Scand 1981, 113, 567–569. [Google Scholar]
- Zoli, M.; Agnati, L.F.; Hedlund, P.B.; Li, X.M.; Ferre, S.; Fuxe, K. Receptor–receptor interactions as an integrative mechanism in nerve cells. Mol. Neurobiol 1993, 7, 293–334. [Google Scholar]
- Marshall, F.H.; Jones, K.A.; Kaupmann, K.; Bettler, B. GABAB receptors—The first 7TM heterodimers. Trends Pharmacol. Sci 1999, 20, 396–399. [Google Scholar]
- Marshall, F.H. Is the GABA B heterodimer a good drug target? J. Mol. Neurosci 2005, 26, 169–176. [Google Scholar]
- Gurevich, V.V.; Gurevich, E.V. How and why do GPCRs dimerize? Trends Pharmacol. Sci 2008, 29, 234–240. [Google Scholar]
- Gurevich, V.V.; Gurevich, E.V. GPCR monomers and oligomers: It takes all kinds. Trends Neurosci 2008, 31, 74–81. [Google Scholar]
- Fuxe, K.; Ferre, S.; Zoli, M.; Agnati, L.F. Integrated events in central dopamine transmission as analyzed at multiple levels. Evidence for intramembrane adenosine A2A/dopamine D2 and adenosine A1/dopamine D1 receptor interactions in the basal ganglia. Brain Res. Brain Res. Rev 1998, 26, 258–273. [Google Scholar]
- Franco, R.; Ferre, S.; Agnati, L.; Torvinen, M.; Gines, S.; Hillion, J.; Casado, V.; Lledo, P.; Zoli, M.; Lluis, C.; et al. Evidence for adenosine/dopamine receptor interactions: Indications for heteromerization. Neuropsychopharmacology 2000, 23, S50–S59. [Google Scholar]
- Gines, S.; Hillion, J.; Torvinen, M.; le Crom, S.; Casado, V.; Canela, E.I.; Rondin, S.; Lew, J.Y.; Watson, S.; Zoli, M.; et al. Dopamine D1 and adenosine A1 receptors form functionally interacting heteromeric complexes. Proc. Natl. Acad. Sci. USA 2000, 97, 8606–8611. [Google Scholar]
- Angers, S.; Salahpour, A.; Bouvier, M. Biochemical and biophysical demonstration of GPCR oligomerization in mammalian cells. Life Sci 2001, 68, 2243–2250. [Google Scholar]
- Angers, S.; Salahpour, A.; Joly, E.; Hilairet, S.; Chelsky, D.; Dennis, M.; Bouvier, M. Detection of beta 2-adrenergic receptor dimerization in living cells using bioluminescence resonance energy transfer (BRET). Proc. Natl. Acad. Sci. USA 2000, 97, 3684–3689. [Google Scholar]
- Hebert, T.E.; Loisel, T.P.; Adam, L.; Ethier, N.; Onge, S.S.; Bouvier, M. Functional rescue of a constitutively desensitized beta2AR through receptor dimerization. Biochem. J 1998, 330, 287–293. [Google Scholar]
- Dean, M.K.; Higgs, C.; Smith, R.E.; Bywater, R.P.; Snell, C.R.; Scott, P.D.; Upton, G.J.; Howe, T.J.; Reynolds, C.A. Dimerization of G protein-coupled receptors. J. Med. Chem 2001, 44, 4595–4614. [Google Scholar]
- Gouldson, P.R.; Higgs, C.; Smith, R.E.; Dean, M.K.; Gkoutos, G.V.; Reynolds, C.A. Dimerization and domain swapping in G protein-coupled receptors: A computational study. Neuropsychopharmacology 2000, 23, S60–S77. [Google Scholar]
- Gouldson, P.R.; Snell, C.R.; Bywater, R.P.; Higgs, C.; Reynolds, C.A. Domain swapping in G-protein coupled receptor dimers. Protein Eng 1998, 11, 1181–1193. [Google Scholar]
- Devi, L.A. Heterodimerization of G protein-coupled receptors: Pharmacology, signaling and trafficking. Trends Pharmacol. Sci 2001, 22, 532–537. [Google Scholar]
- Kenakin, T. Drug efficacy at G protein-coupled receptors. Ann. Rev. Pharmacol. Toxicol 2002, 42, 349–379. [Google Scholar]
- Lee, S.P.; Xie, Z.; Varghese, G.; Nguyen, T.; O’Dowd, B.F.; George, S.R. Oligomerization of dopamine and serotonin receptors. Neuropsychopharmacology 2000, 23, S32–S40. [Google Scholar]
- Xie, Z.; Lee, S.P.; O’Dowd, B.F.; George, S.R. Serotonin 5-HT1B and 5-HT1D receptors form homodimers when expressed alone and heterodimers when co-expressed. FEBS Lett 1999, 456, 63–67. [Google Scholar]
- Zeng, F.; Wess, J. Molecular aspects of muscarinic receptor dimerization. Neuropsychopharmacology 2000, 23, S19–S31. [Google Scholar]
- Overton, M.C.; Blumer, K.J. G protein-coupled receptors function as oligomers in vivo. Curr. Biol. 2000, 10, 341–344. [Google Scholar]
- Bockaert, J.; Pin, J.P. Molecular tinkering of G protein-coupled receptors: An evolutionary success. EMBO J 1999, 18, 1723–1729. [Google Scholar]
- Portoghese, P.S. From models to molecules: Opioid receptor dimers, bivalent ligands, and selective opioid receptor probes. J. Med. Chem 2001, 44, 2259–2269. [Google Scholar]
- Waldhoer, M.; Fong, J.; Jones, R.M.; Lunzer, M.M.; Sharma, S.K.; Kostenis, E.; Portoghese, P.S.; Whistler, J.L. A heterodimer-selective agonist shows in vivo relevance of G protein-coupled receptor dimers. Proc. Natl. Acad. Sci. USA 2005, 102, 9050–9055. [Google Scholar]
- Stockton, S.D., Jr.; Devi, L.A. Functional relevance of mu-delta opioid receptor heteromerization: A role in novel signaling and implications for the treatment of addiction disorders: From a symposium on new concepts in mu-opioid pharmacology. Drug Alcohol Depend 2012, 121, 167–172. [Google Scholar]
- Perreault, M.L.; Hasbi, A.; O’Dowd, B.F.; George, S.R. Heteromeric dopamine receptor signaling complexes: Emerging neurobiology and disease relevance. Neuropsychopharmacology 2014, 39, 156–168. [Google Scholar]
- Pou, C.; Mannoury la Cour, C.; Stoddart, L.A.; Millan, M.J.; Milligan, G. Functional homomers and heteromers of dopamine D2L and D3 receptors co-exist at the cell surface. J. Biol. Chem 2012, 287, 8864–8878. [Google Scholar]
- Wang, M.; Wong, A.H.; Liu, F. Interactions between NMDA and dopamine receptors: A potential therapeutic target. Brain Res 2012, 1476, 154–163. [Google Scholar]
- Satake, H.; Matsubara, S.; Aoyama, M.; Kawada, T.; Sakai, T. GPCR Heterodimerization in the Reproductive System: Functional regulation and implication for biodiversity. Front. Endocrinol 2013, 4, 100. [Google Scholar]
- Suzuki, T.; Namba, K.; Mizuno, N.; Nakata, H. Hetero-oligomerization and specificity changes of G protein-coupled purinergic receptors: Novel insight into diversification of signal transduction. Methods Enzymol 2013, 521, 239–257. [Google Scholar]
- Borroto-Escuela, D.O.; Flajolet, M.; Agnati, L.F.; Greengard, P.; Fuxe, K. Bioluminescence resonance energy transfer methods to study G protein-coupled receptor–receptor tyrosine kinase heteroreceptor complexes. Methods Cell Biol 2013, 117, 141–164. [Google Scholar]
- Fernandez-Duenas, V.; Llorente, J.; Gandia, J.; Borroto-Escuela, D.O.; Agnati, L.F.; Tasca, C.I.; Fuxe, K.; Ciruela, F. Fluorescence resonance energy transfer-based technologies in the study of protein-protein interactions at the cell surface. Methods 2012, 57, 467–472. [Google Scholar]
- Achour, L.; Kamal, M.; Jockers, R.; Marullo, S. Using quantitative BRET to assess G protein-coupled receptor homo- and heterodimerization. Methods Mol. Biol 2011, 756, 183–200. [Google Scholar]
- Lohse, M.J.; Nuber, S.; Hoffmann, C. Fluorescence/bioluminescence resonance energy transfer techniques to study G protein-coupled receptor activation and signaling. Pharmacol. Rev 2012, 64, 299–336. [Google Scholar]
- Goupil, E.; Laporte, S.A.; Hebert, T.E. A simple method to detect allostery in GPCR dimers. Methods Cell Biol 2013, 117, 165–179. [Google Scholar]
- Hink, M.A.; Postma, M. Monitoring receptor oligomerization by line-scan fluorescence cross-correlation spectroscopy. Methods Cell Biol 2013, 117, 197–212. [Google Scholar]
- Herrick-Davis, K.; Grinde, E.; Cowan, A.; Mazurkiewicz, J.E. Fluorescence correlation spectroscopy analysis of serotonin, adrenergic, muscarinic, and dopamine receptor dimerization: the oligomer number puzzle. Mol. Pharmacol 2013, 84, 630–642. [Google Scholar]
- Kuhn, C.; Bufe, B.; Batram, C.; Meyerhof, W. Oligomerization of TAS2R bitter taste receptors. Chem. Senses 2010, 35, 395–406. [Google Scholar]
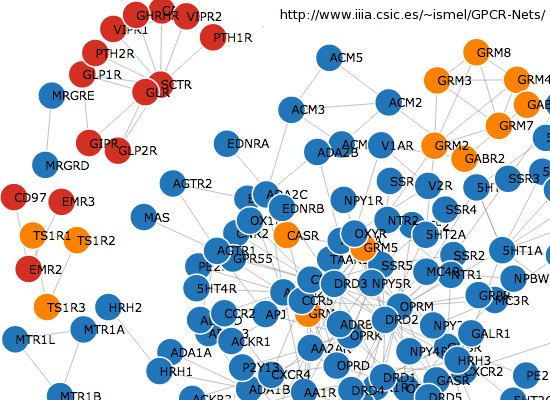
- GPCR-HetNet. Available online: http://www.iiia.csic.es/~ismel/GPCR-Nets/index.html accessed on 11 May 2014.
- Jassal, B.; Jupe, S.; Caudy, M.; Birney, E.; Stein, L.; Hermjakob, H.; D’Eustachio, P. The systematic annotation of the three main GPCR families in Reactome. Database (Oxford) 2010, 2010, baq018. [Google Scholar]
- Attwood, T.K.; Findlay, J.B. Fingerprinting G protein-coupled receptors. Protein Eng 1994, 7, 195–203. [Google Scholar]
- Cardoso, J.C.; Pinto, V.C.; Vieira, F.A.; Clark, M.S.; Power, D.M. Evolution of secretin family GPCR members in the metazoa. BMC Evol. Biol 2006, 6, 108. [Google Scholar]
- Sukhwal, A.; Sowdhamini, R. Oligomerisation status and evolutionary conservation of interfaces of protein structural domain superfamilies. Mol. Biosyst 2013, 9, 1652–1661. [Google Scholar]
- Havlickova, M.; Prezeau, L.; Duthey, B.; Bettler, B.; Pin, J.P.; Blahos, J. The intracellular loops of the GB2 subunit are crucial for G-protein coupling of the heteromeric gamma-aminobutyrate B receptor. Mol. Pharmacol 2002, 62, 343–350. [Google Scholar]
- Delprato, A. Topological and functional properties of the small GTPases protein interaction network. PLoS One 2012, 7, e44882. [Google Scholar]
- Agnati, L.F.; Guidolin, D.; Albertin, G.; Trivello, E.; Ciruela, F.; Genedani, S.; Tarakanov, A.; Fuxe, K. An integrated view on the role of receptor mosaics at perisynaptic level: Focus on adenosine A(2A), dopamine D(2), cannabinoid CB(1), and metabotropic glutamate mGlu(5) receptors. J. Recept. Signal Transduct. Res 2010, 30, 355–369. [Google Scholar]
- Cabello, N.; Gandia, J.; Bertarelli, D.C.; Watanabe, M.; Lluis, C.; Franco, R.; Ferre, S.; Lujan, R.; Ciruela, F. Metabotropic glutamate type 5, dopamine D2 and adenosine A2a receptors form higher-order oligomers in living cells. J. Neurochem 2009, 109, 1497–1507. [Google Scholar]
- Navarro, G.; Carriba, P.; Gandia, J.; Ciruela, F.; Casado, V.; Cortes, A.; Mallol, J.; Canela, E.I.; Lluis, C.; Franco, R. Detection of heteromers formed by cannabinoid CB1, dopamine D2, and adenosine A2A G protein-coupled receptors by combining bimolecular fluorescence complementation and bioluminescence energy transfer. Sci. World J 2008, 8, 1088–1097. [Google Scholar]
- Carriba, P.; Navarro, G.; Ciruela, F.; Ferre, S.; Casado, V.; Agnati, L.; Cortes, A.; Mallol, J.; Fuxe, K.; Canela, E.I.; et al. Detection of heteromerization of more than two proteins by sequential BRET-FRET. Nat. Methods 2008, 5, 727–733. [Google Scholar]
- Borroto-Escuela, D.O.; Narvaez, M.; Marcellino, D.; Parrado, C.; Narvaez, J.A.; Tarakanov, A.O.; Agnati, L.F.; Diaz-Cabiale, Z.; Fuxe, K. Galanin receptor-1 modulates 5-hydroxtryptamine-1A signaling via heterodimerization. Biochem. Biophys. Res. Commun 2010, 393, 767–772. [Google Scholar]
- Han, J.D.; Bertin, N.; Hao, T.; Goldberg, D.S.; Berriz, G.F.; Zhang, L.V.; Dupuy, D.; Walhout, A.J.; Cusick, M.E.; Roth, F.P.; et al. Evidence for dynamically organized modularity in the yeast protein-protein interaction network. Nature 2004, 430, 88–93. [Google Scholar]
- Albert, R.; Jeong, H.; Barabasi, A.L. Error and attack tolerance of complex networks. Nature 2000, 406, 378–382. [Google Scholar]
- Wuchty, S.; Almaas, E. Peeling the yeast protein network. Proteomics 2005, 5, 444–449. [Google Scholar]
- Vallabhajosyula, R.R.; Chakravarti, D.; Lutfeali, S.; Ray, A.; Raval, A. Identifying hubs in protein interaction networks. PLoS One 2009, 4, e5344. [Google Scholar]
- Batada, N.N.; Reguly, T.; Breitkreutz, A.; Boucher, L.; Breitkreutz, B.J.; Hurst, L.D.; Tyers, M. Stratus not altocumulus: A new view of the yeast protein interaction network. PLoS Biol 2006, 4, e317. [Google Scholar]
- Ekman, D.; Light, S.; Bjorklund, A.K.; Elofsson, A. What properties characterize the hub proteins of the protein-protein interaction network of Saccharomyces cerevisiae? Genome Biol 2006, 7, R45. [Google Scholar]
- Tarakanov, A.O.; Fuxe, K.G.; Borroto-Escuela, D.O. Integrin triplets of marine sponges in human D2 receptor heteromers. J. Recept. Signal Transduct. Res 2012, 32, 202–208. [Google Scholar]
- Tarakanov, A.O.; Fuxe, K.G. Triplet puzzle: Homologies of receptor heteromers. J. Mol. Neurosci 2010, 41, 294–303. [Google Scholar]
- Tarakanov, A.O.; Fuxe, K.G. The triplet puzzle of homologies in receptor heteromers exists also in other types of protein-protein interactions. J. Mol. Neurosci 2011, 44, 173–177. [Google Scholar]
- Tarakanov, A.O.; Fuxe, K.G.; Borroto-Escuela, D.O. On the origin of the triplet puzzle of homologies in receptor heteromers: Toll-like receptor triplets in different types of receptors. J. Neural Transm 2012, 119, 517–523. [Google Scholar]
- Tarakanov, A.O.; Fuxe, K.G.; Borroto-Escuela, D.O. On the origin of the triplet puzzle of homologies in receptor heteromers: immunoglobulin triplets in different types of receptors. J. Mol. Neurosci 2012, 46, 616–621. [Google Scholar]
- Fuxe, K.; Marcellino, D.; Woods, A.S.; Giuseppina, L.; Antonelli, T.; Ferraro, L.; Tanganelli, S.; Agnati, L.F. Integrated signaling in heterodimers and receptor mosaics of different types of GPCRs of the forebrain: Relevance for schizophrenia. J. Neural Transm 2009, 116, 923–939. [Google Scholar]
- STRING. Available online: http://string-db.org/ accessed on 11 May 2014.
- Cytoscape, Version 2.8.2. Available online: http://www.cytoscape.org/ accessed on 11 May 2014.
- Zhu, X.; Gerstein, M.; Snyder, M. Getting connected: Analysis and principles of biological networks. Genes Dev 2007, 21, 1010–1024. [Google Scholar]
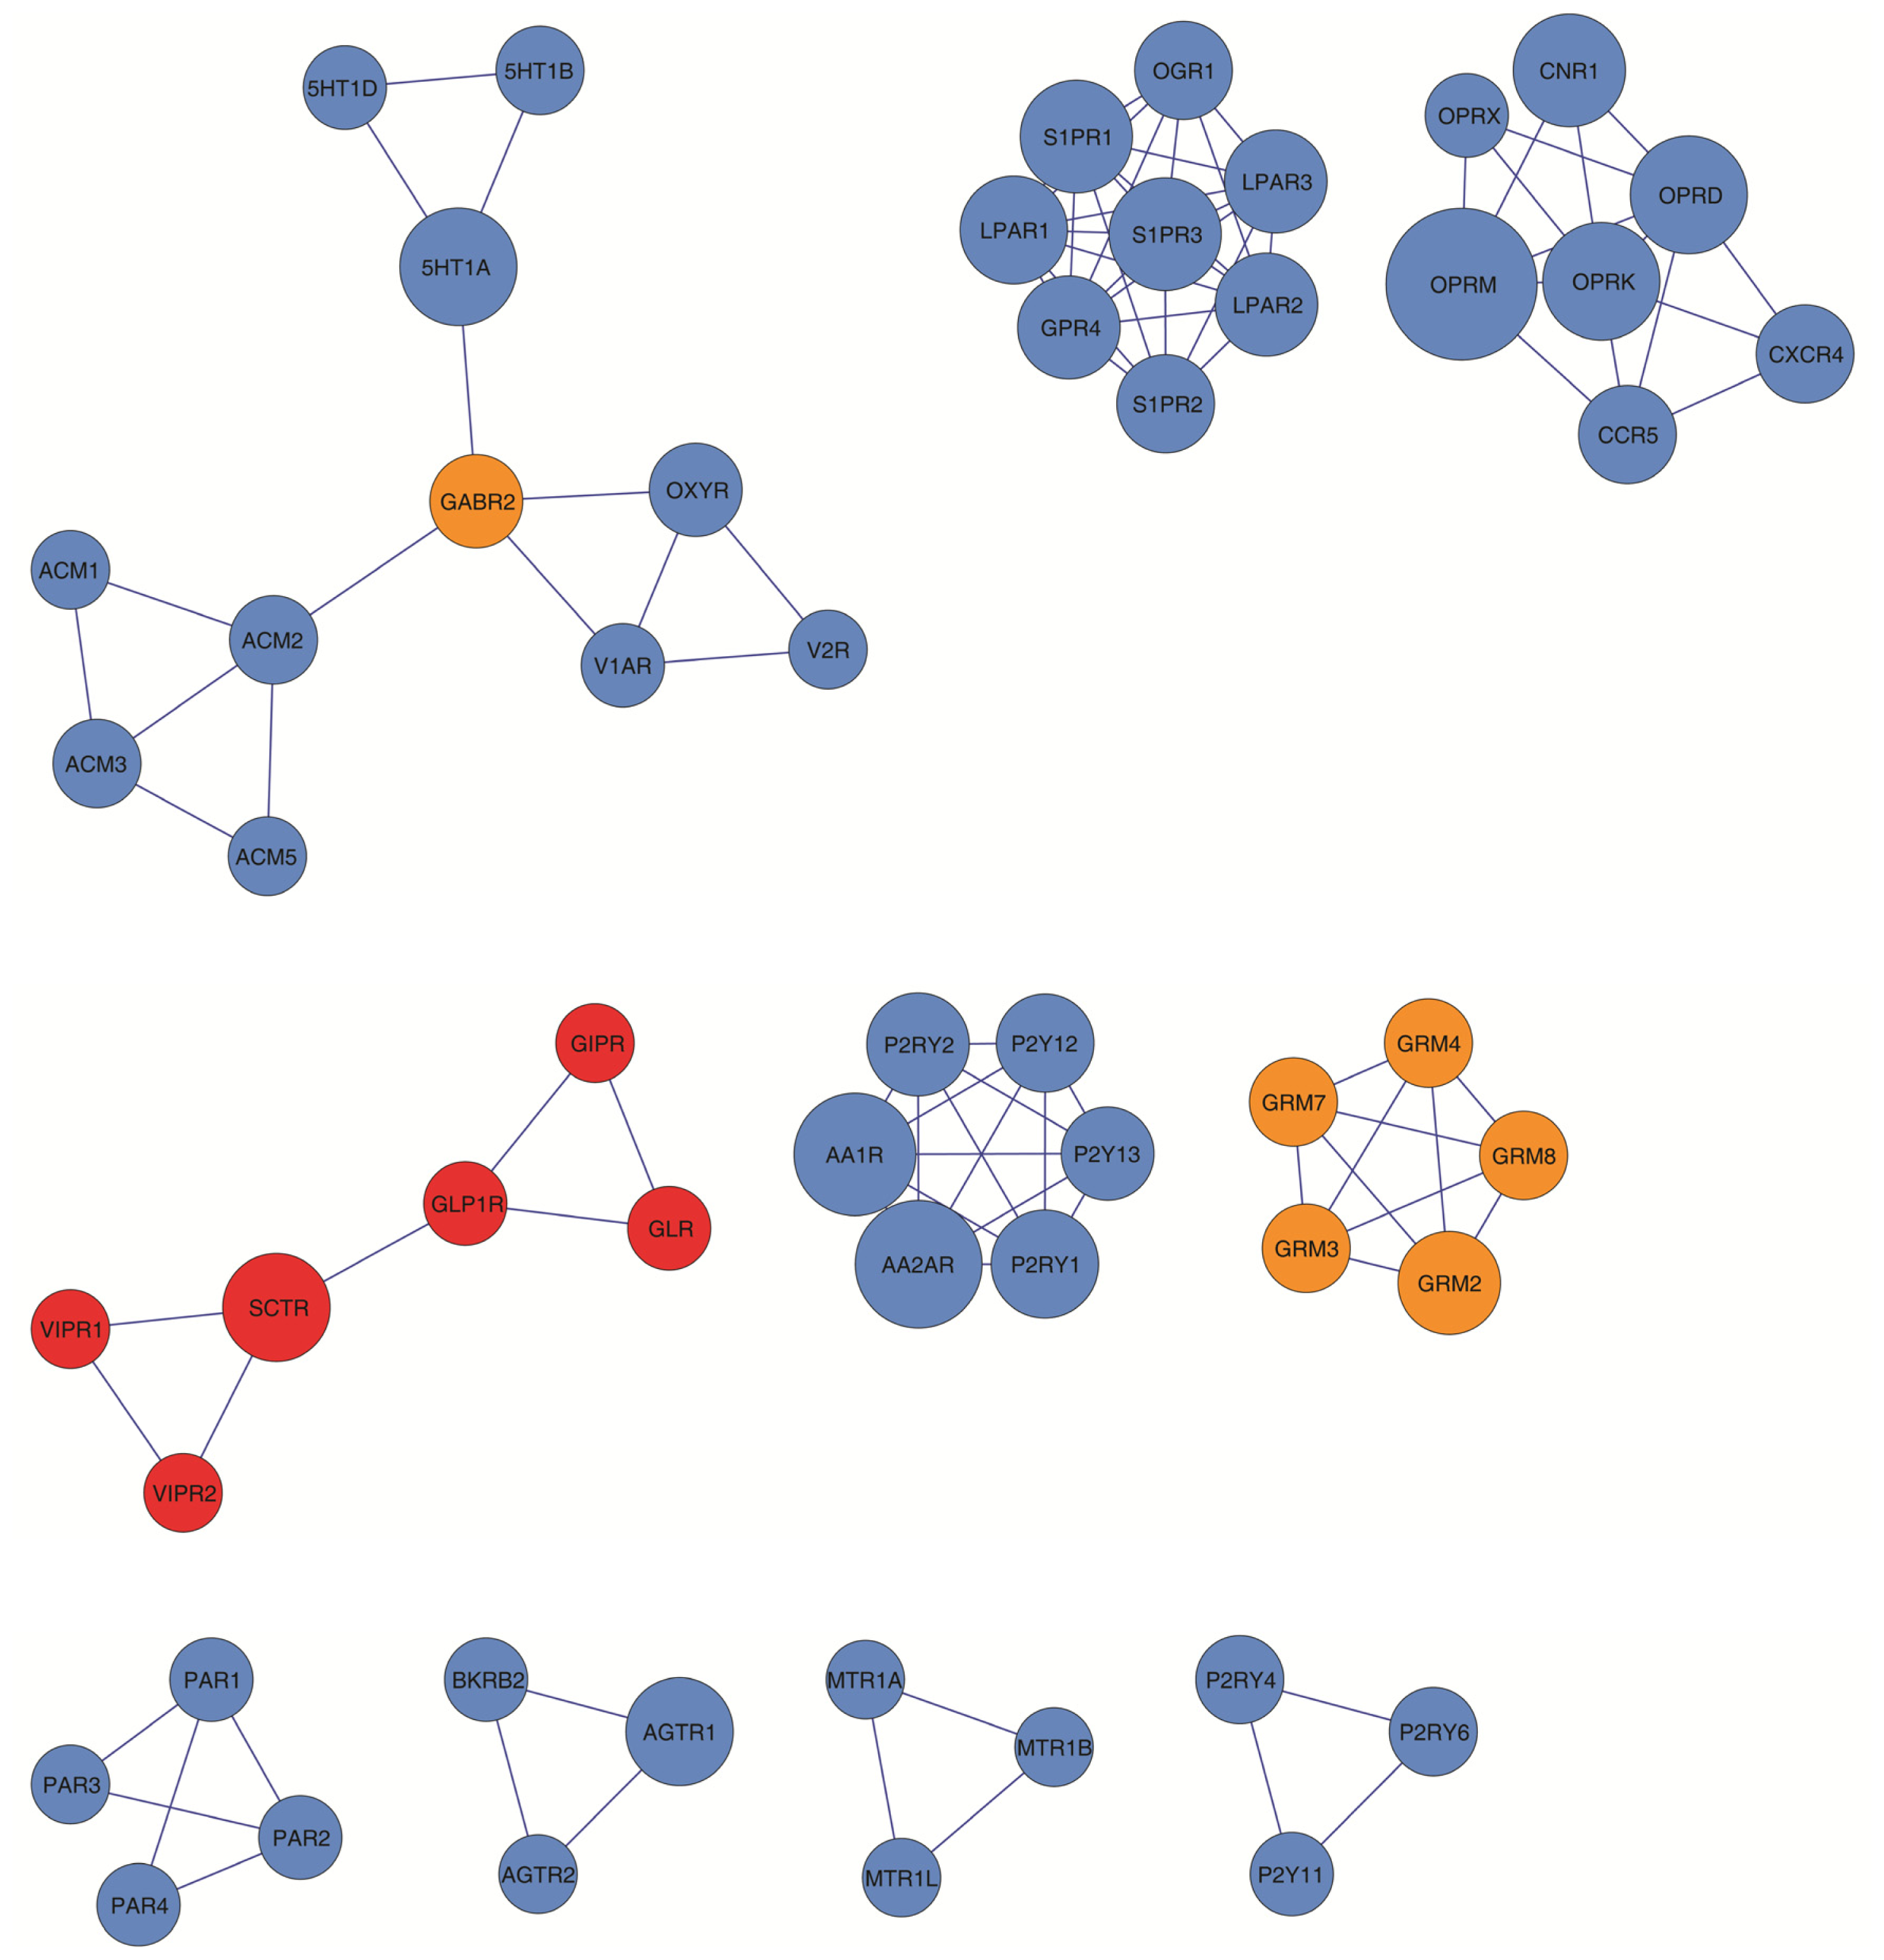
- Molecular Complex Detection (MCODE), Version 1.2. Available online: http://baderlab.org/Software/MCODE accessed on 11 May 2014.


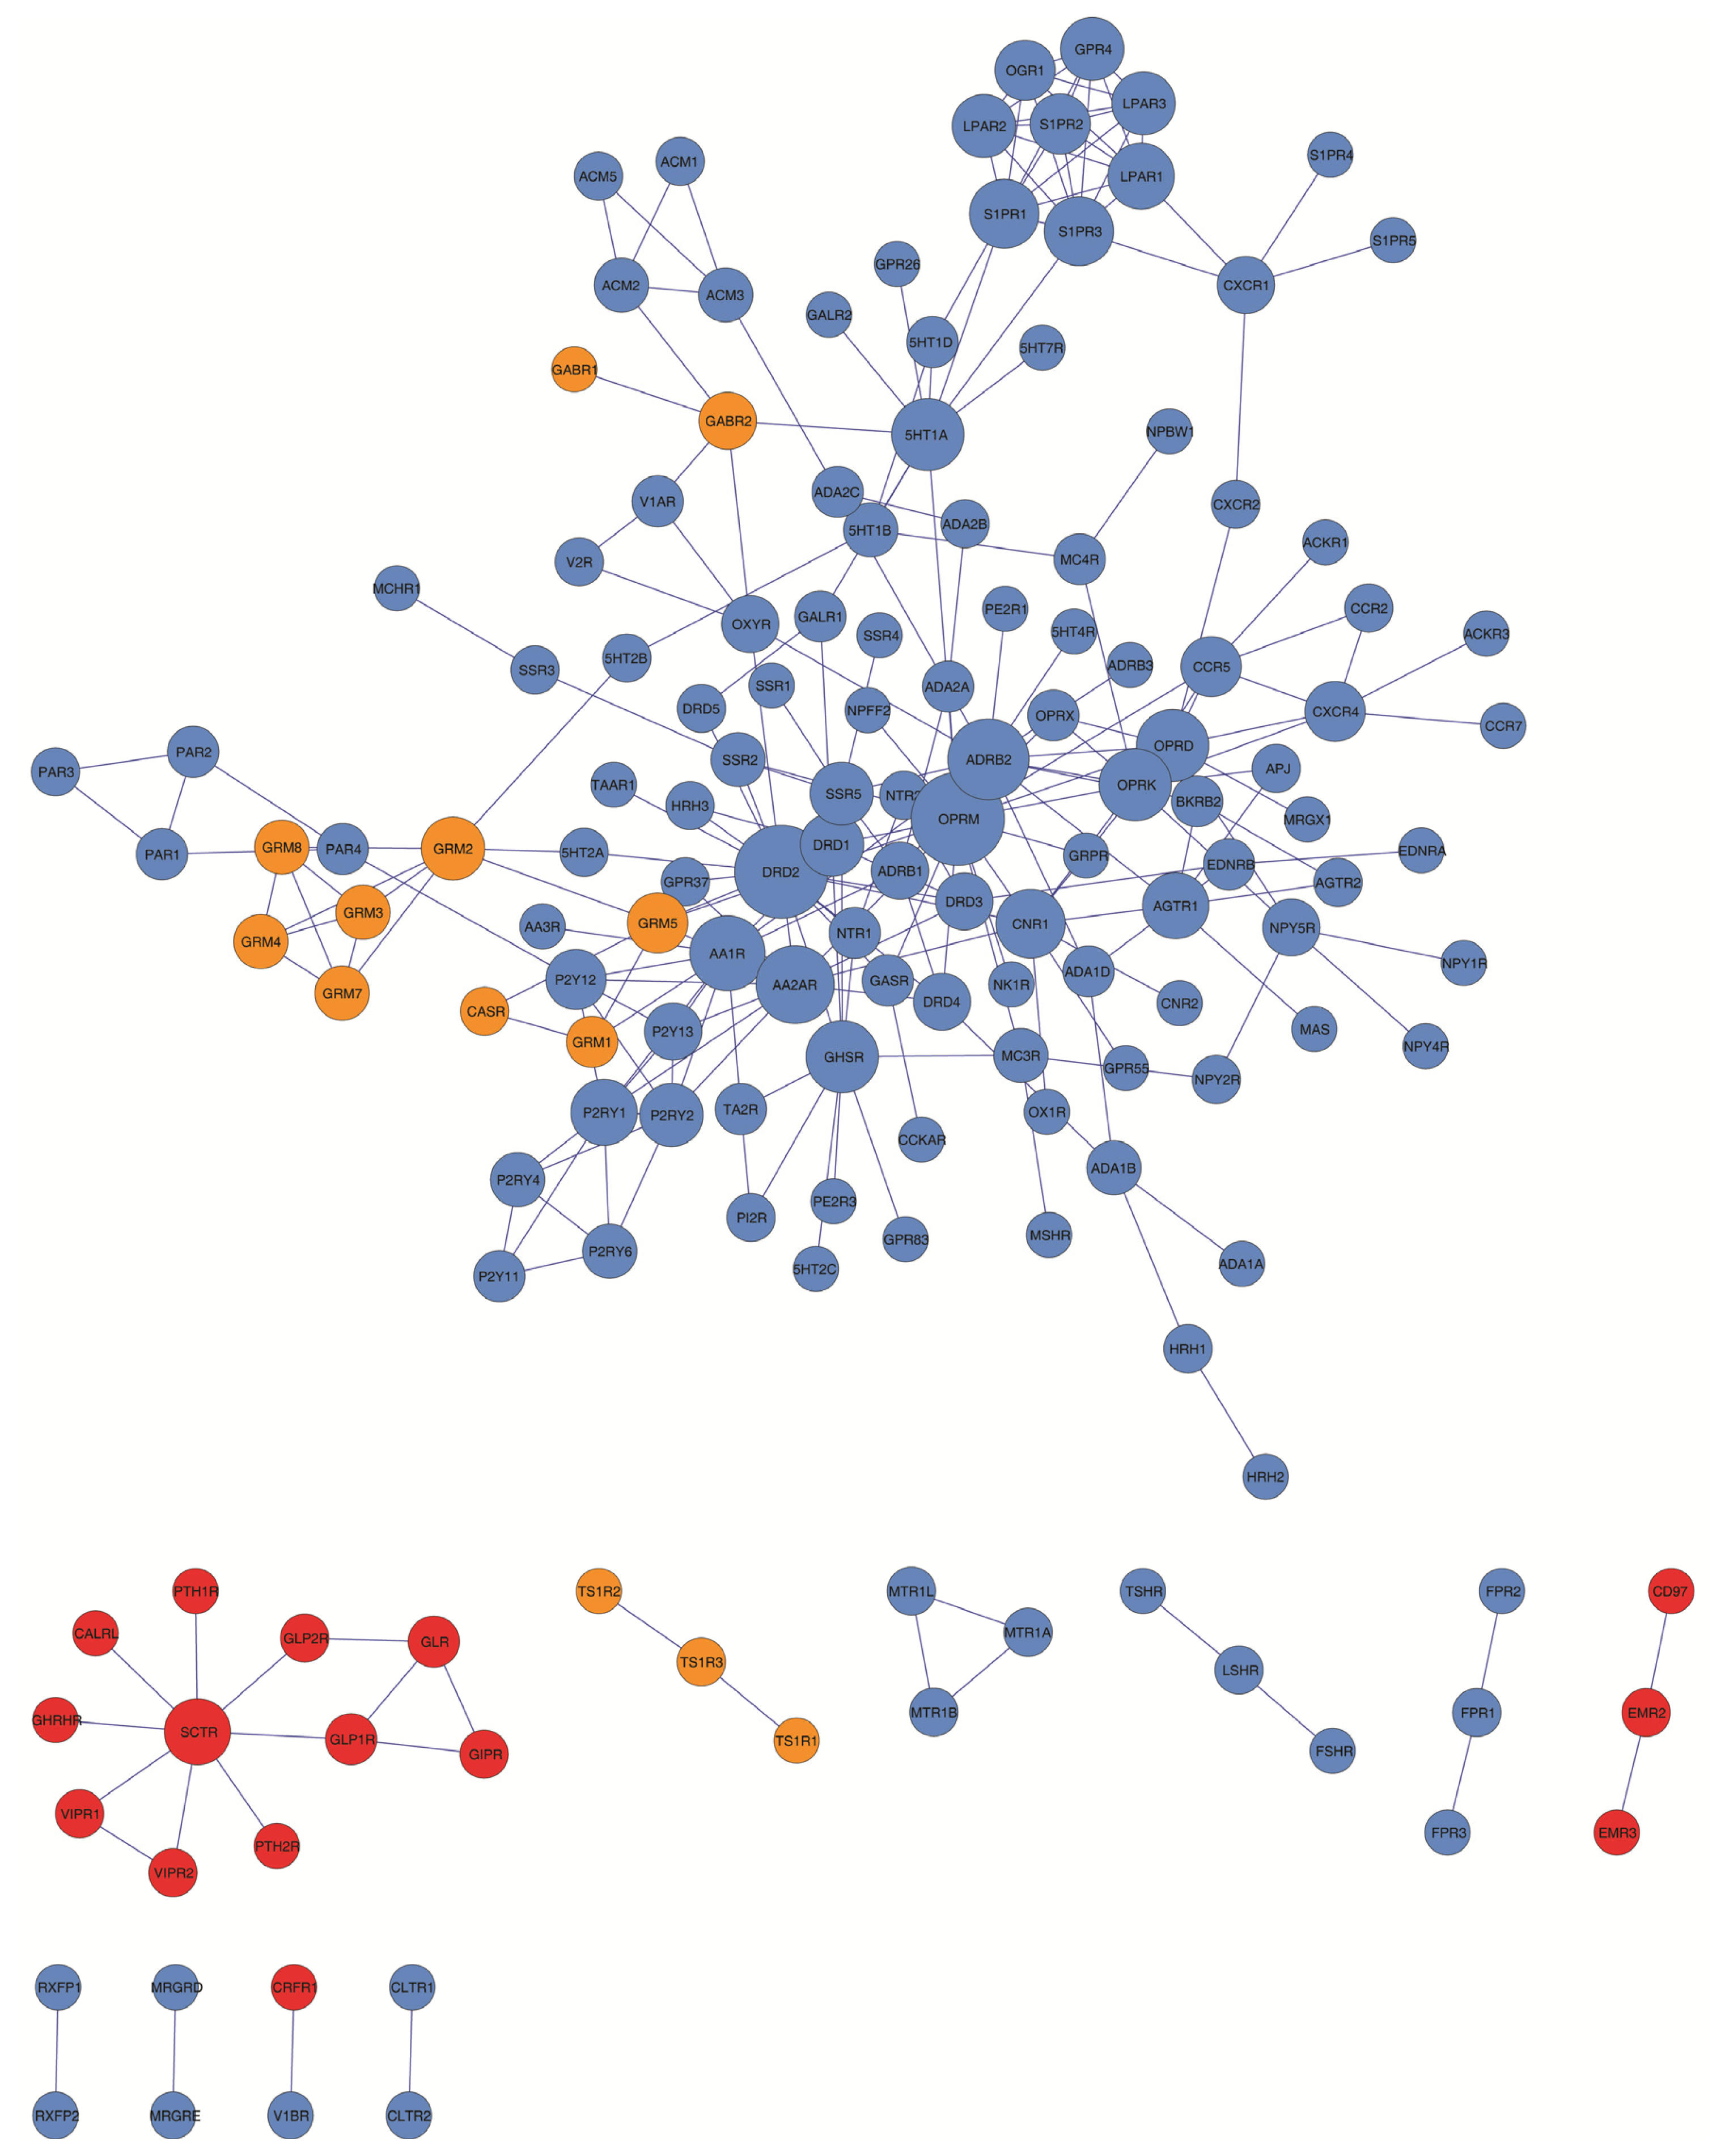
| Number of receptor protomers per GPCR family that showed to form at least one heteromer | Number of receptor interaction pairs/connectivity (intrafamily: F1, F2, F3 and interfamily) | |||||
|---|---|---|---|---|---|---|
| F1 | F2 | F3 | F1 | F2 | F3 | Interfamily |
| 128 | 15 | 13 | 219 | 15 | 17 | 9 |
| Protomers/nodes | Interactions/edges | Density | Diameter | Average degree | Clustering coefficient |
|---|---|---|---|---|---|
| 156 | 260 | 0.02 | 9 | 3.03 | 0.25 |
| Node degree distribution | Clustering coefficient distribution | ||
|---|---|---|---|
| Linear | Power-law | Linear | Power-law |
| 0.53 | 0.91 | 0.56 | 0.80 |
| No. hubs (degree = 1) | Hub selection criteria | |||||||
|---|---|---|---|---|---|---|---|---|
| Relative connectivity | Top 95% of the high degree nodes | Node degree > 5 | Node degree > 8 | |||||
| cutoff | #hubs | cutoff | #hubs | cutoff | #hubs | cutoff | #hubs | |
| 57 | 12 | 3 | 10 | 8 | 5 | 29 | 8 | 12 |
| Non-hubs | |||
|---|---|---|---|
| 5HT2B, 5HT2C, 5HT4R, AA3R, ACKR1, ACKR3, ADA1A, ADRB3, CALRL, CCKAR, CCR7, CD97, CLTR1, CLTR2, CNR2, CRFR1, EDNRA, EMR3, FPR2, FPR3, FSHR, GABR1, GALR2, GHRHR, GPR26, GPR55, GPR83, GRPR, HRH2, MAS, MCH1R, MRGRD, MRGRE, MRGX1, MSHR, NK1R, NPBW1, NPFF2, NPY1R, NPY4R, OX1R, PE2R1, PE2R3, PTH1R, PTH2R, RXFP1, RXFP2, SIPR4, S1PR5, SSR1, SSR4, TAAR1, TS1R1, TS1R2, TSHR, V1BR | |||
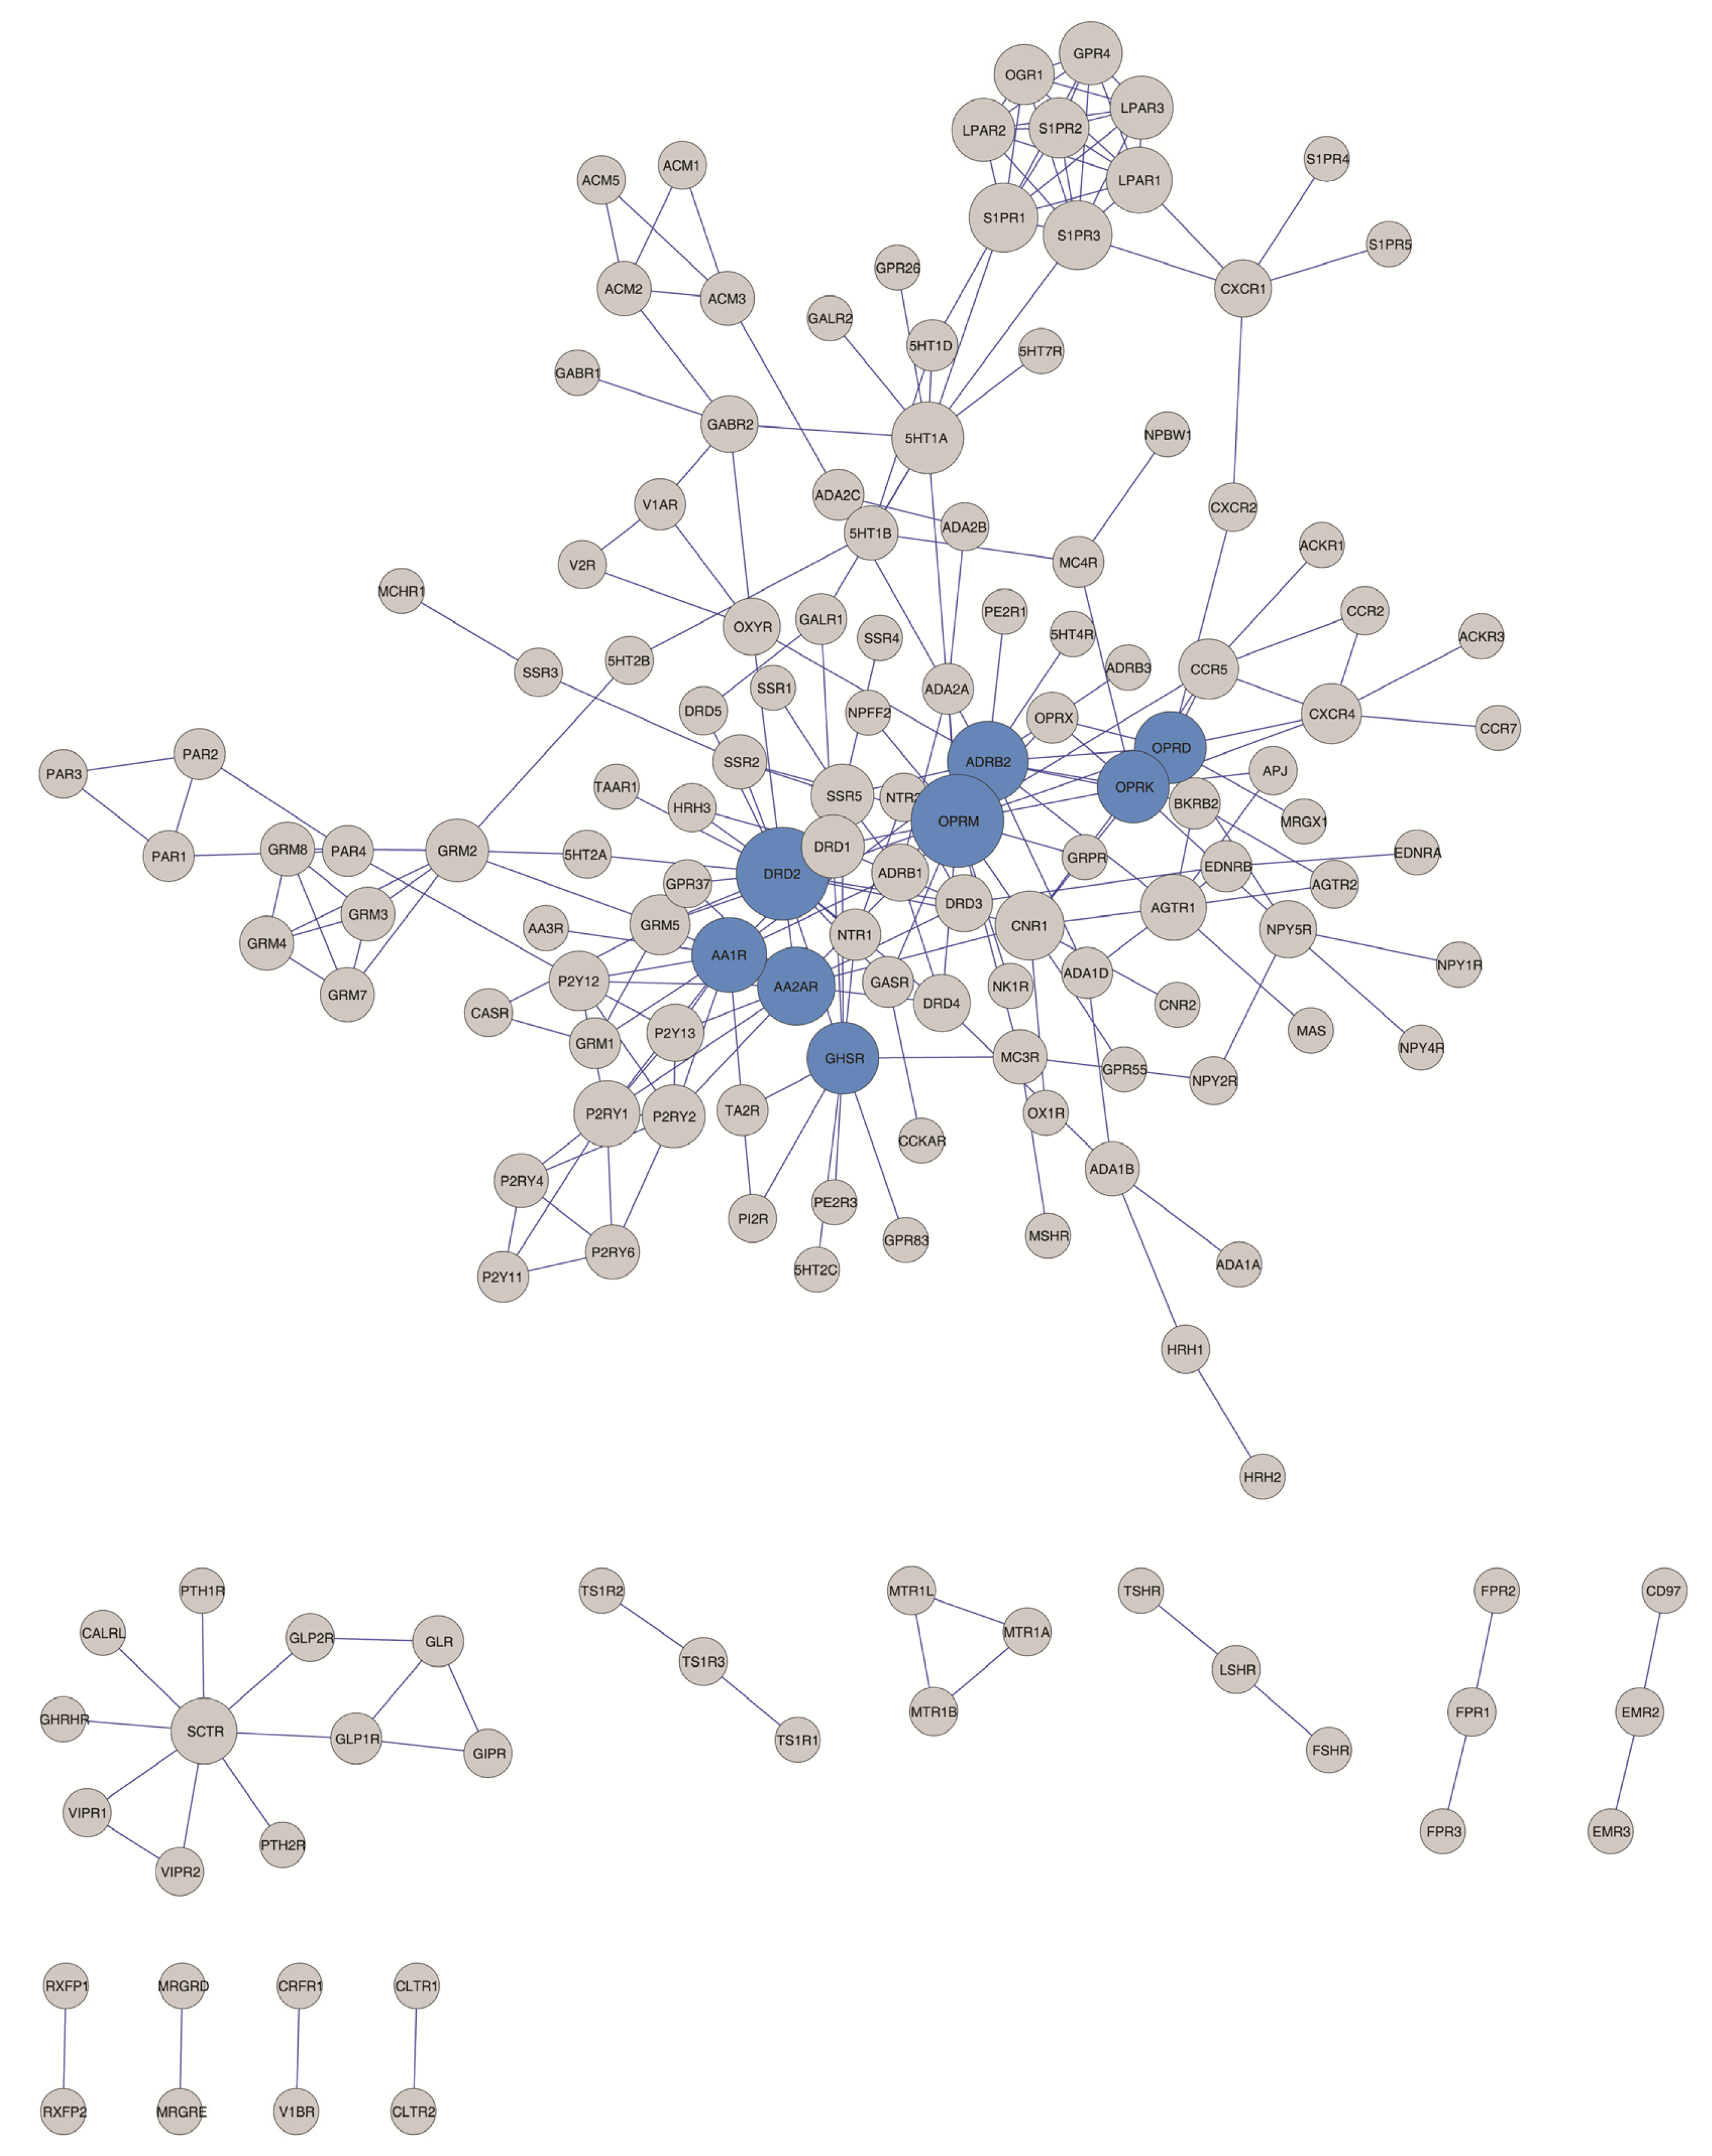
| Hub selection criteria | |||
| Relative connectivity | Top 95% of the high degree nodes | Node degree > 5 | Node degree > 8 |
| DRD2 = 17, | DRD2 = 17, | DRD2 = 17, | DRD2 = 17, |
| OPRM = 17, | OPRM = 17, | OPRM = 17, | OPRM = 17, |
| ADRB2 = 13 | ADRB2 = 13, | ADRB2 = 13, | ADRB2 = 13, |
| AA2AR = 12, | AA2AR = 12, | AA2AR = 12, | |
| AA1R = 11, | AA1R = 11, | AA1R = 11, | |
| OPRK = 10, | OPRK = 10, | OPRK = 10, | |
| OPRD = 10, | OPRD = 10, | OPRD = 10, | |
| GHSR = 10 | GHSR = 10, | GHSR = 10, | |
| 5HT1A = 10, | 5HT1A = 10, | ||
| S1PR3 = 9, | S1PR3 = 9, | ||
| S1PR1 = 9, | S1PR1 = 9, | ||
| CNR1 = 9, | CNR1 = 9 | ||
| SCTR = 8, | |||
| P2RY1 = 8, | |||
| LPAR1 = 8, | |||
| AGTR1 = 8, | |||
| SSR5 = 7, | |||
| P2RY2 = 7, | |||
| LPAR3 = 7, | |||
| LPAR2 =7, | |||
| GRM2 = 7, | |||
| GPR4 = 7, | |||
| DRD1 = 7, | |||
| S1PR2 = 6, | |||
| P2Y12 = 6, | |||
| OGR1 = 6, | |||
| GRM5 = 6, | |||
| CXCR4 = 6, | |||
| CCR5 = 6 | |||
© 2014 by the authors; licensee MDPI, Basel, Switzerland This article is an open access article distributed under the terms and conditions of the Creative Commons Attribution license (http://creativecommons.org/licenses/by/3.0/).
Share and Cite
Borroto-Escuela, D.O.; Brito, I.; Romero-Fernandez, W.; Di Palma, M.; Oflijan, J.; Skieterska, K.; Duchou, J.; Van Craenenbroeck, K.; Suárez-Boomgaard, D.; Rivera, A.; et al. The G Protein-Coupled Receptor Heterodimer Network (GPCR-HetNet) and Its Hub Components. Int. J. Mol. Sci. 2014, 15, 8570-8590. https://0-doi-org.brum.beds.ac.uk/10.3390/ijms15058570
Borroto-Escuela DO, Brito I, Romero-Fernandez W, Di Palma M, Oflijan J, Skieterska K, Duchou J, Van Craenenbroeck K, Suárez-Boomgaard D, Rivera A, et al. The G Protein-Coupled Receptor Heterodimer Network (GPCR-HetNet) and Its Hub Components. International Journal of Molecular Sciences. 2014; 15(5):8570-8590. https://0-doi-org.brum.beds.ac.uk/10.3390/ijms15058570
Chicago/Turabian StyleBorroto-Escuela, Dasiel O., Ismel Brito, Wilber Romero-Fernandez, Michael Di Palma, Julia Oflijan, Kamila Skieterska, Jolien Duchou, Kathleen Van Craenenbroeck, Diana Suárez-Boomgaard, Alicia Rivera, and et al. 2014. "The G Protein-Coupled Receptor Heterodimer Network (GPCR-HetNet) and Its Hub Components" International Journal of Molecular Sciences 15, no. 5: 8570-8590. https://0-doi-org.brum.beds.ac.uk/10.3390/ijms15058570