Article

Comparative Mitogenomics of the Genus Odontobutis (Perciformes: Gobioidei: Odontobutidae) Revealed Conserved Gene Rearrangement and High Sequence Variations

1
Key Lab of Freshwater Animal Breeding Certificated by Ministry of Agriculture, College of Fisheries, Huazhong Agricultural University, Wuhan 430070, China
2
Freshwater Aquaculture Collaborative Innovation Center of Hubei Province, Wuhan 430070, China
3
Georgikon Faculty, University of Pannonia, Keszthely 8360, Hungary
*
Author to whom correspondence should be addressed.
Int. J. Mol. Sci. 2015, 16(10), 25031-25049; https://0-doi-org.brum.beds.ac.uk/10.3390/ijms161025031
Submission received: 16 August 2015 / Revised: 9 October 2015 / Accepted: 14 October 2015 / Published: 20 October 2015
(This article belongs to the Special Issue Fish Molecular Biology)

Abstract

:
To understand the molecular evolution of mitochondrial genomes (mitogenomes) in the genus Odontobutis, the mitogenome of Odontobutis yaluensis was sequenced and compared with those of another four Odontobutis species. Our results displayed similar mitogenome features among species in genome organization, base composition, codon usage, and gene rearrangement. The identical gene rearrangement of trnS-trnL-trnH tRNA cluster observed in mitogenomes of these five closely related freshwater sleepers suggests that this unique gene order is conserved within Odontobutis. Additionally, the present gene order and the positions of associated intergenic spacers of these Odontobutis mitogenomes indicate that this unusual gene rearrangement results from tandem duplication and random loss of large-scale gene regions. Moreover, these mitogenomes exhibit a high level of sequence variation, mainly due to the differences of corresponding intergenic sequences in gene rearrangement regions and the heterogeneity of tandem repeats in the control regions. Phylogenetic analyses support Odontobutis species with shared gene rearrangement forming a monophyletic group, and the interspecific phylogenetic relationships are associated with structural differences among their mitogenomes. The present study contributes to understanding the evolutionary patterns of Odontobutidae species.

Graphical Abstract

1. Introduction

The vertebrate mitogenomes are usually small circular molecules (16–18 kb) containing 13 protein-coding genes (PCGs), two rRNA genes (rRNAs), 22 tRNA genes (tRNAs), and a putative control region (CR) [1,2]. Due to its simple structure, constant gene content, rapid evolutionary rate, and maternal inheritance, mtDNA has been extensively used for studying population genetics [3], biogeography [4], and phylogenetics [5,6]. Moreover, it is of great importance to offer genome- and sequence-level information, such as the gene rearrangement [7,8] and the evolutionary patterns of the CR [9].
The CR is usually regarded as the most variable part of the mitogenome in terms of nucleotide substitutions, short insertion/deletion, and variable number of tandem repeats (VNTRs) [10,11]. The tandem repeats in CR of mitogenomes have been documented in a wide range of taxa [10,12,13]. They are usually located in the extended termination-associated sequences (ETAS) domain or conserved sequence blocks (CSBs) domain, which are more variable than the central conserved domain [14]. So far, three main mechanisms have been proposed to explain the formation of the repeated sequences in different regions of the mitochondrial CR [13], including the illegitimate elongation model [15], the improper initiation model [16], and the pause-melting misalignment [17]. These tandem repeats provide a source of length polymorphism and heteroplasmy within individuals and species of particular vertebrate taxa [15,18]. Consequently, comparative analyses of tandem repeats may play a crucial role in studying mitogenome evolution or population dynamics from a population level perspective [19].
As an increasing number of complete mitogenomes of metazoan are sequenced, diverse gene rearrangements have been identified [2,20,21]. For instance, several marsupials and caecilian amphibians have derived rearrangement of trnW-trnA-trnN-trnC-trnY to trnA-trnC-trnW-trnN-trnY [22,23,24], three crocodilians share the exchange in position of trnS and trnH [25,26], and 10 parrotfishes possess the shared gene order trnI-trnM-trnQ which is different from the typical vertebrate gene order trnI-trnQ-trnM [27]. Thus far, there are three models usually applied to explain gene rearrangements in metazoan mitogenomes: Firstly, the recombination model, involving the breaking and rejoining of DNA strands [28]. The presence of mitochondrial DNA recombination has been proved by some direct evidence [29,30]. Secondly, the tandem duplication and random loss (TDRL) model [31], a commonly accepted hypothetical mechanism to clarify gene rearrangements occurred via tandem duplications of certain genes, followed by random deletion of some gene regions [24,32,33]. Last but not least, the tandem duplication and non-random loss (TDNL) model, which assumes that this process involves complete mitogenome duplication and gene loss. The non-random gene loss depended on their transcriptional polarities and locations in the genome, and resulted in the gene rearrangements with additional non-coding regions [34]. The TDNL model has been applied to explain the gene rearrangements of invertebrate mitogenomes [35,36]. Nevertheless, cases of convergence exist, particularly near hotspots of gene order rearrangements [24], where some flatfishes exhibit particular large-scale tRNA genes rearrangements [37,38].
The Gobioidei belongs to the order Perciformes and comprises about 2210 species [39]. Due to their worldwide distribution from tropical regions to temperate regions [40], these gobioids exhibit prominent variety in morphology, ecology, and behavior among other teleosts [41]. Odontobutidae is one of the basal families within the suborder Gobioidei [42], and this family comprises at least six genera and about 15 species [43]. Thus far, few studies have tackled with gobioid intra-relationships based on morphological and molecular data, especially rarely involving Odontobutids. As a consequence, the biology and classification of gobioids are still controversial [44], despite their evolutionary and ecological importance [45]. For instance, early studies about gobioids regarded the Rhyacichthyidae as the sister to all remainder gobioids [40,42,46,47,48]. However, recent molecular phylogenetic results have indicated that the Rhyacichthyidae + Odontobutidae clade is the sister group of all other gobioid lineages [44,49,50]. As for Odontobutidae, all phylogenetic hypothesis in previous studies just contained few Odontobutidae species and/or partial mitochondrial nucleotide sequences [40,42,44,45,48,49,51,52,53]. In particular, Zang et al. [54] analyzed the molecular phylogeny of the family Odontobutidae based on mitochondrial DNA, while they ambiguously explained the method and dataset used for constructing phylogenetic tree, and their intra-relationships of Odontobutidae were different from previous standardized reanalysis of molecular phylogenetic hypotheses (see figures S11 and S12 in [45]). Moreover, recent odontobutid mitogenomic phylogeny did not argue about mitochondrial gene order and mitogenome organization as phylogenetic markers [54]. Therefore, clarifications of the whole taxonomic and evolutionary relationships among Odontobutids remain to be completed.
Considering these perplexities and insufficient above, we report one new mitogenome of O. yaluensis and firstly present comparative mitogenomic analyses of Odontobutis species in the present study. We compare five Odontobutis mitogenomes in detail, regarding mitogenome structure, base composition, codon usage, gene order, evolutionary factors, and the tandem repeats in control regions. The features of this unique gene order and additional intergenic spacers provide sufficient evidence for the TDRL model, accounting for the conserved gene rearrangement in Odontobutis mitogenomes. In addition, the phylogenetic trees of the family Odontobutidae are reconstructed based on the concatenated nucleotide sequences of 13 mitochondrial PCGs datasets from seven odontobutids (one for Micropercops, one for Perccottus, and five for Odontobutis). Our comparative analyses of mitogenome sequences and gene rearrangement provide novel insights into the evolutionary relationships within Odontobutidae.

2. Results and Discussion

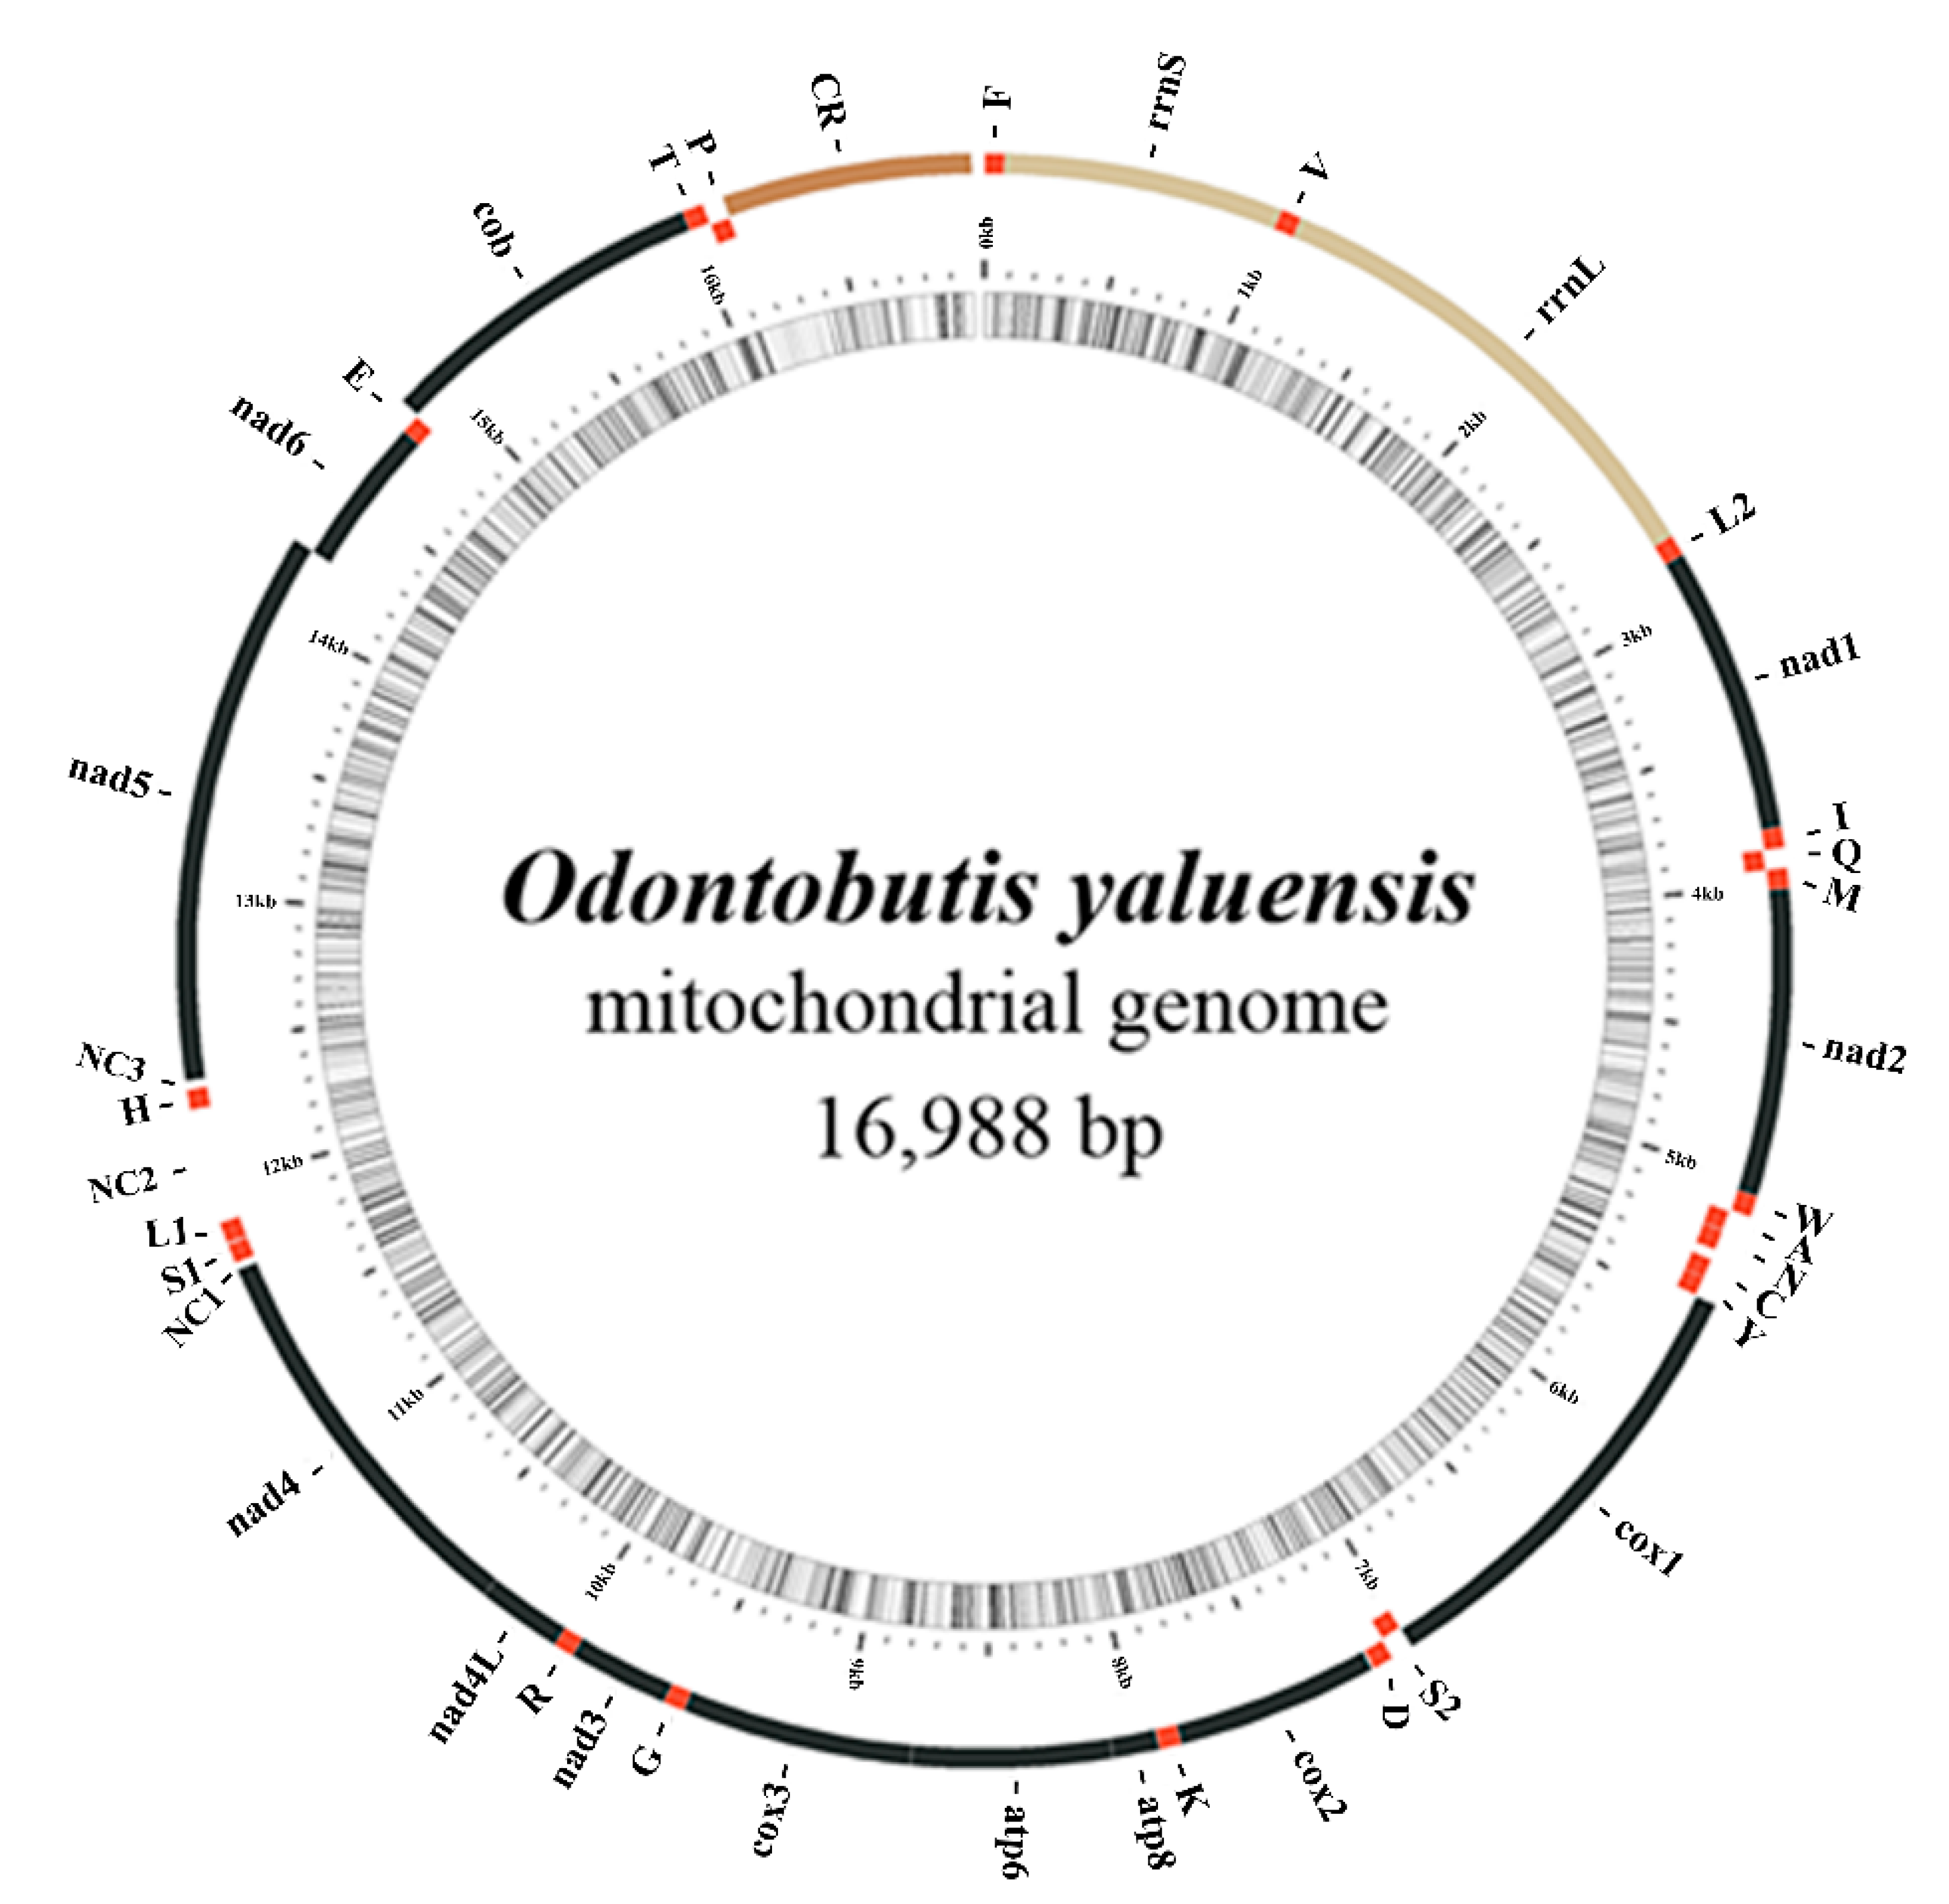
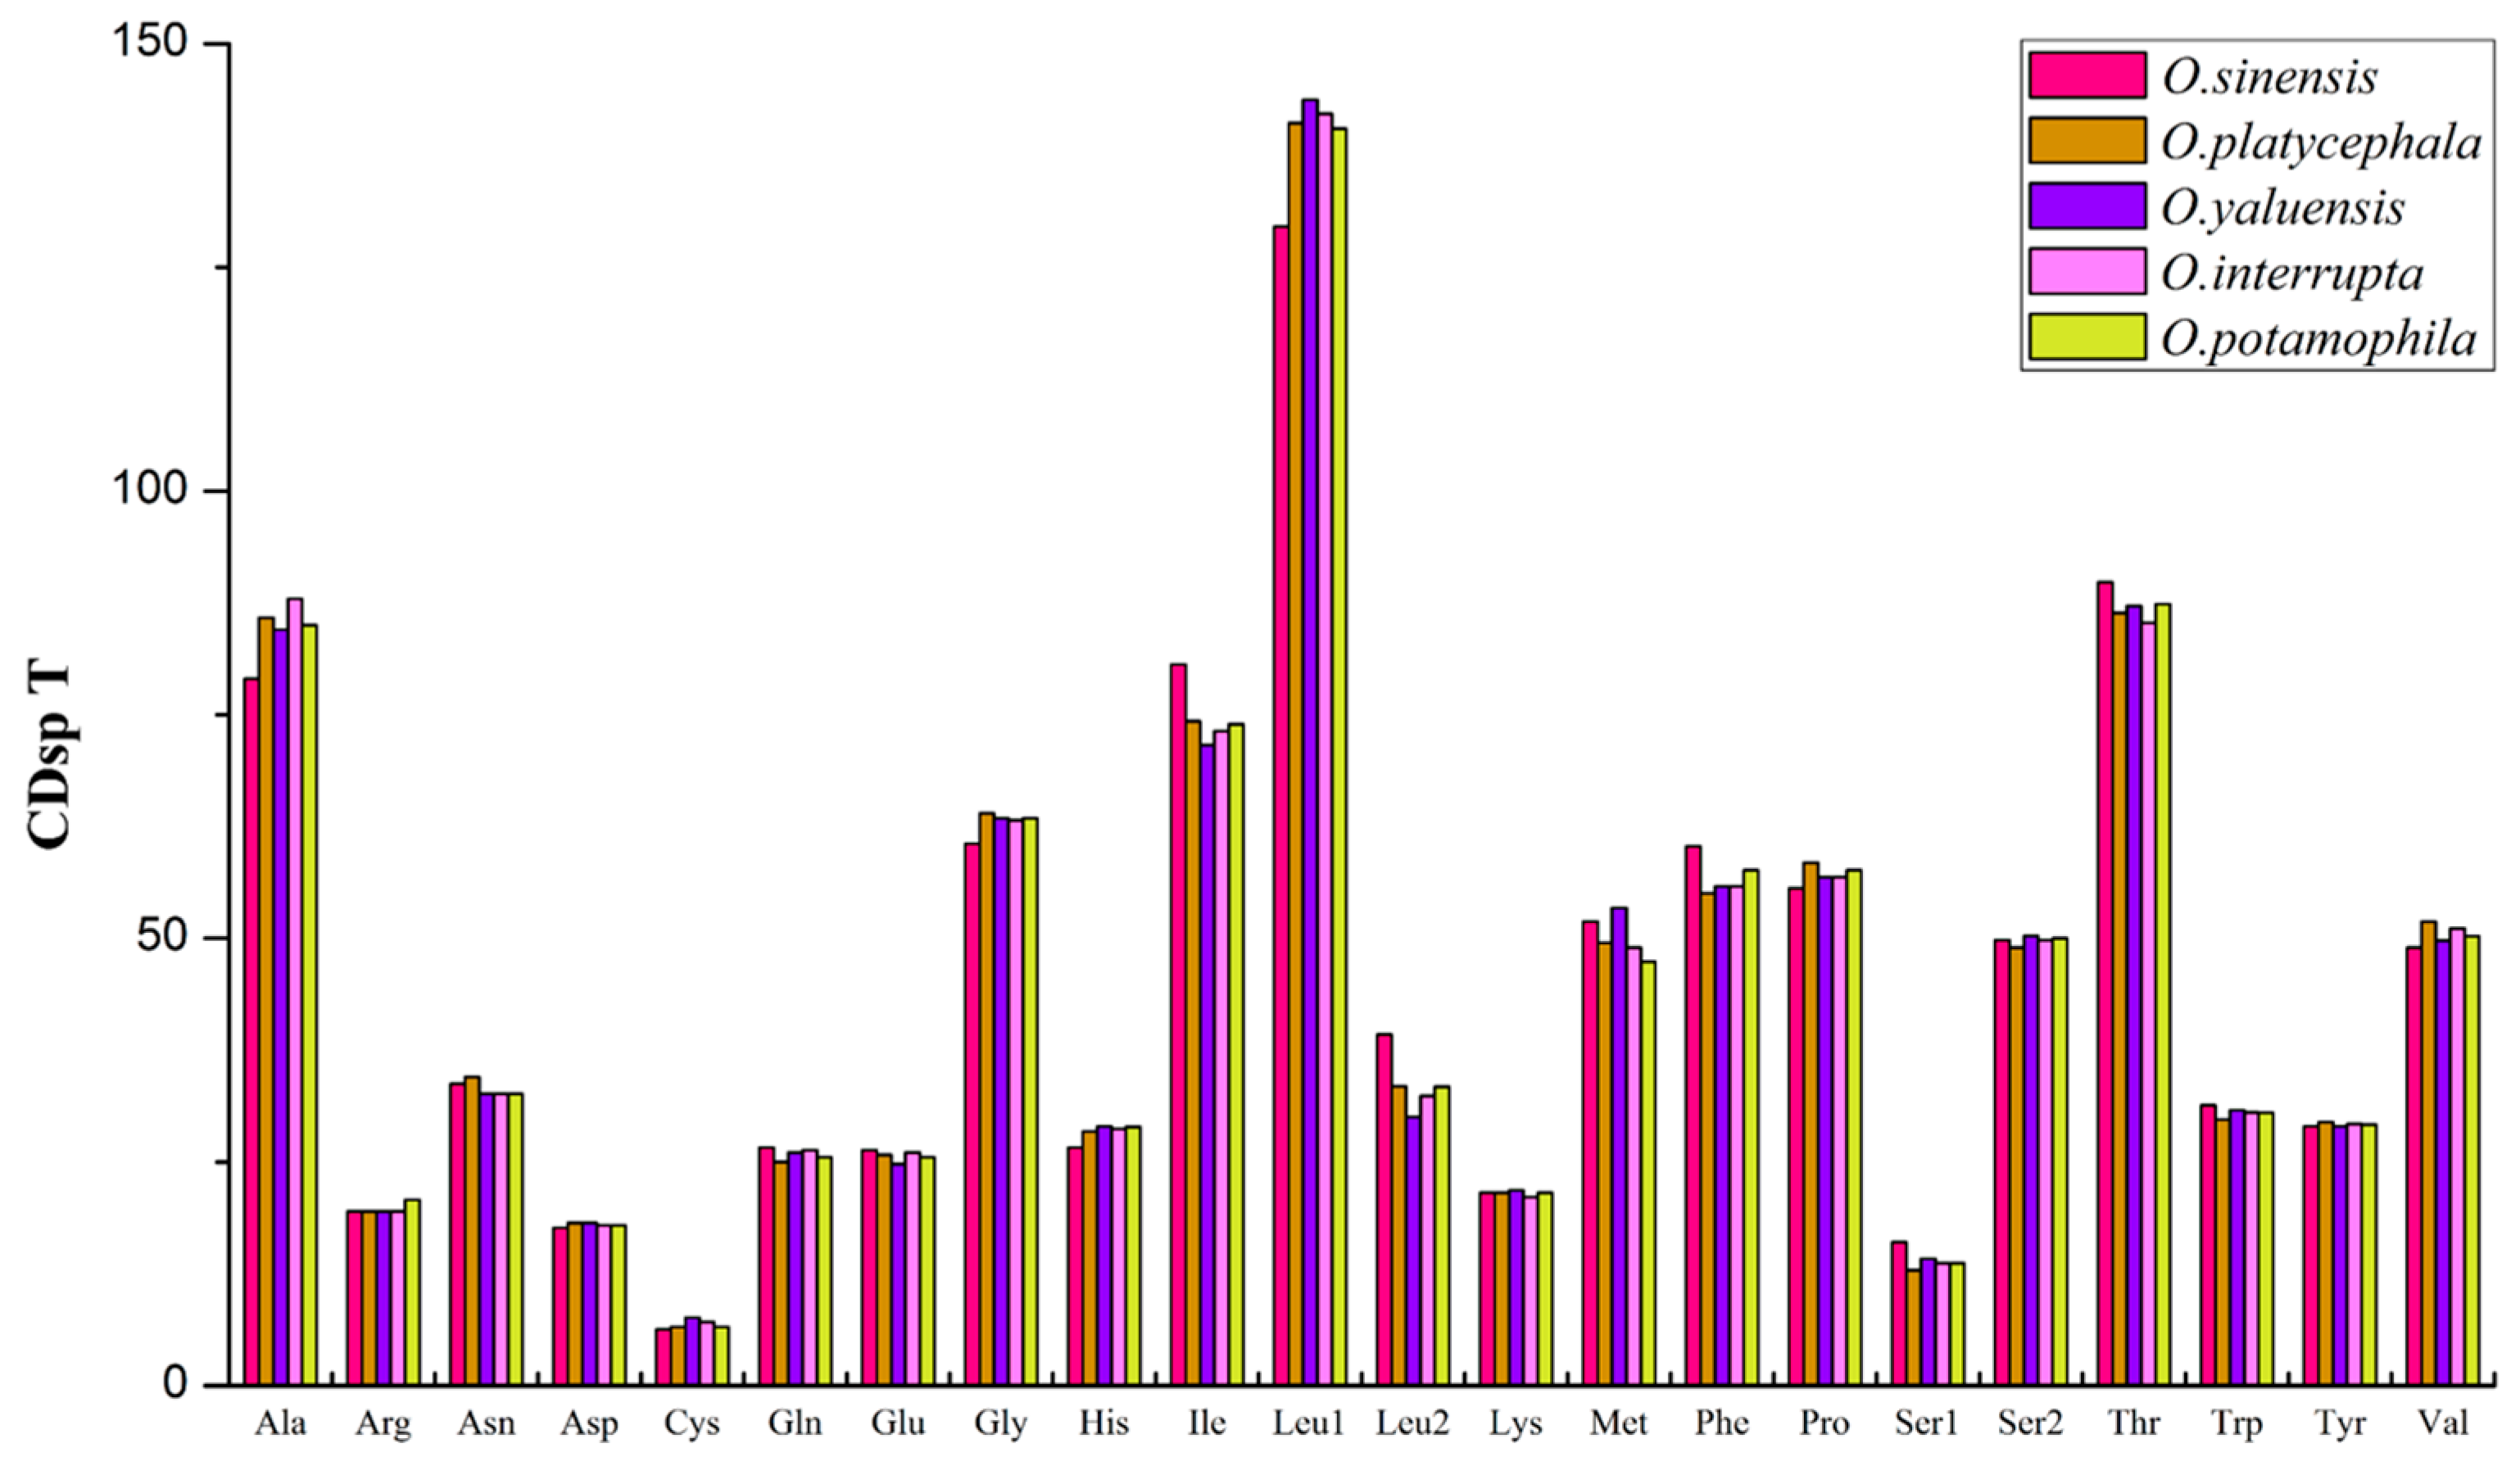
2.1. Mitogenome Composition

The new mitogenome of O. yaluensis was sequenced, annotated and deposited in the NCBI database (GenBank accession number: KM207149). Aligning overlapping mitochondrial DNA amplifications spanning the whole mitogenome indicated that the total length was 16,988 bp, slightly longer than that of O. potamophila (16,932 bp, KF305680) and O. interrupta (16,802 bp, KR364945) while significantly shorter than that of O. sinensis (17,441 bp, KF154120) and O. platycephala (17,588 bp, DQ010651). Moreover, the size of the newly sequenced O. yaluensis mitogenome was 79 bp longer than that of another O. yaluensis mitogenome (16,909 bp, KM277942), primarily due to the significant sequence variation of intergenic non-coding region between trnL(CUN) and trnH.
As expected, it displayed 37 typical mitochondrial genes (13 PCGs, 22 tRNAs, and two rRNAs) and the putative CR. Most gene sequences were on the H-strand, however, eight tRNAs (trnQ, trnA, trnN, trnC, trnY, trnS(UCN), trnE, and trnP) and nad6 were encoded on the L-strand (Figure 1). The mitogenome structure and individual gene size (Table S1) were largely identical to those of other Odontobutis species, with the unusual trnS-trnL-trnH gene arrangement which differs from that determined in other non-Odontobutis lineages of Gobioidei [53,55,56,57].
Figure 1. The gene map of Odontobutis yaluensis mitogenome. Genes located at the H- or L-strand are mapped outside or inside of the circle. The names of protein-coding genes and rRNAs are expressed by standard abbreviations, while names of tRNAs are abbreviated by a single letter. “CR” refers to the control region, while “NC1”, “NC2” and “NC3” refer to additional large intergenic non-coding spacers. The innermost circle of the images represents (G + C)% per every 5 bp of the mitogenome; the darker lines are, the higher their (G + C)% are. The figure was initially generated by MitoFish and MitoAnnotator program [58], and modified manually.
Ijms 16 25031 g001
Comparative analyses also showed that base composition in five Odontobutis species was similar, with a slight A+T bias (Table 1). In addition, the bias against G was prominent at the second and third codon of protein-coding genes, especially at the third codon. Such relaxed selection at the third codon position was considered to result from different natural selection or mutational pressures [59], and might affect the base composition of the whole mitogenomes.
Table 1. A+T contents, AT/GC-skew of the mitochondrial genomes of five Odontobutis species.
RegionA+TAT-skewGC-skew
OsiOplOyaOinOpoOsiOplOyaOinOpoOsiOplOyaOinOpo
Whole genome58.9156.8755.7955.3355.430.080.090.030.080.02−0.30−0.30−0.31−0.30−0.30
Protein-coding genes58.3955.8655.1754.6354.760.030.01−0.03−0.01−0.05−0.31−0.32−0.33−0.31−0.32
1st codon position50.9648.2148.4348.0348.420.070.160.010.140.01−0.05−0.05−0.07−0.05−0.06
2nd codon position59.2058.7958.5758.6158.48−0.16−0.38−0.17−0.38−0.17−0.34−0.36−0.35−0.35−0.35
3rd codon position65.0060.5858.5257.2757.370.170.260.060.250.03−0.62−0.64−0.63−0.59−0.60
tRNA genes56.6355.3555.9755.1155.430.150.140.130.110.110.03−0.150.03−0.140.03
rrnL57.8556.0154.7256.3055.740.210.240.170.280.19−0.13−0.11−0.11−0.10−0.10
rrnS54.9553.8053.1552.0052.680.170.260.130.270.12−0.12−0.14−0.14−0.16−0.14
Control region68.7768.2864.9864.7964.670.190.010.20−0.010.19−0.25−0.15−0.13−0.13−0.13
Osi, Opl, Oya, Opo, and Oin indicate O. sinensis, O. platycephala, O. yaluensis, O. potamophila, and O. interrupta, respectively.

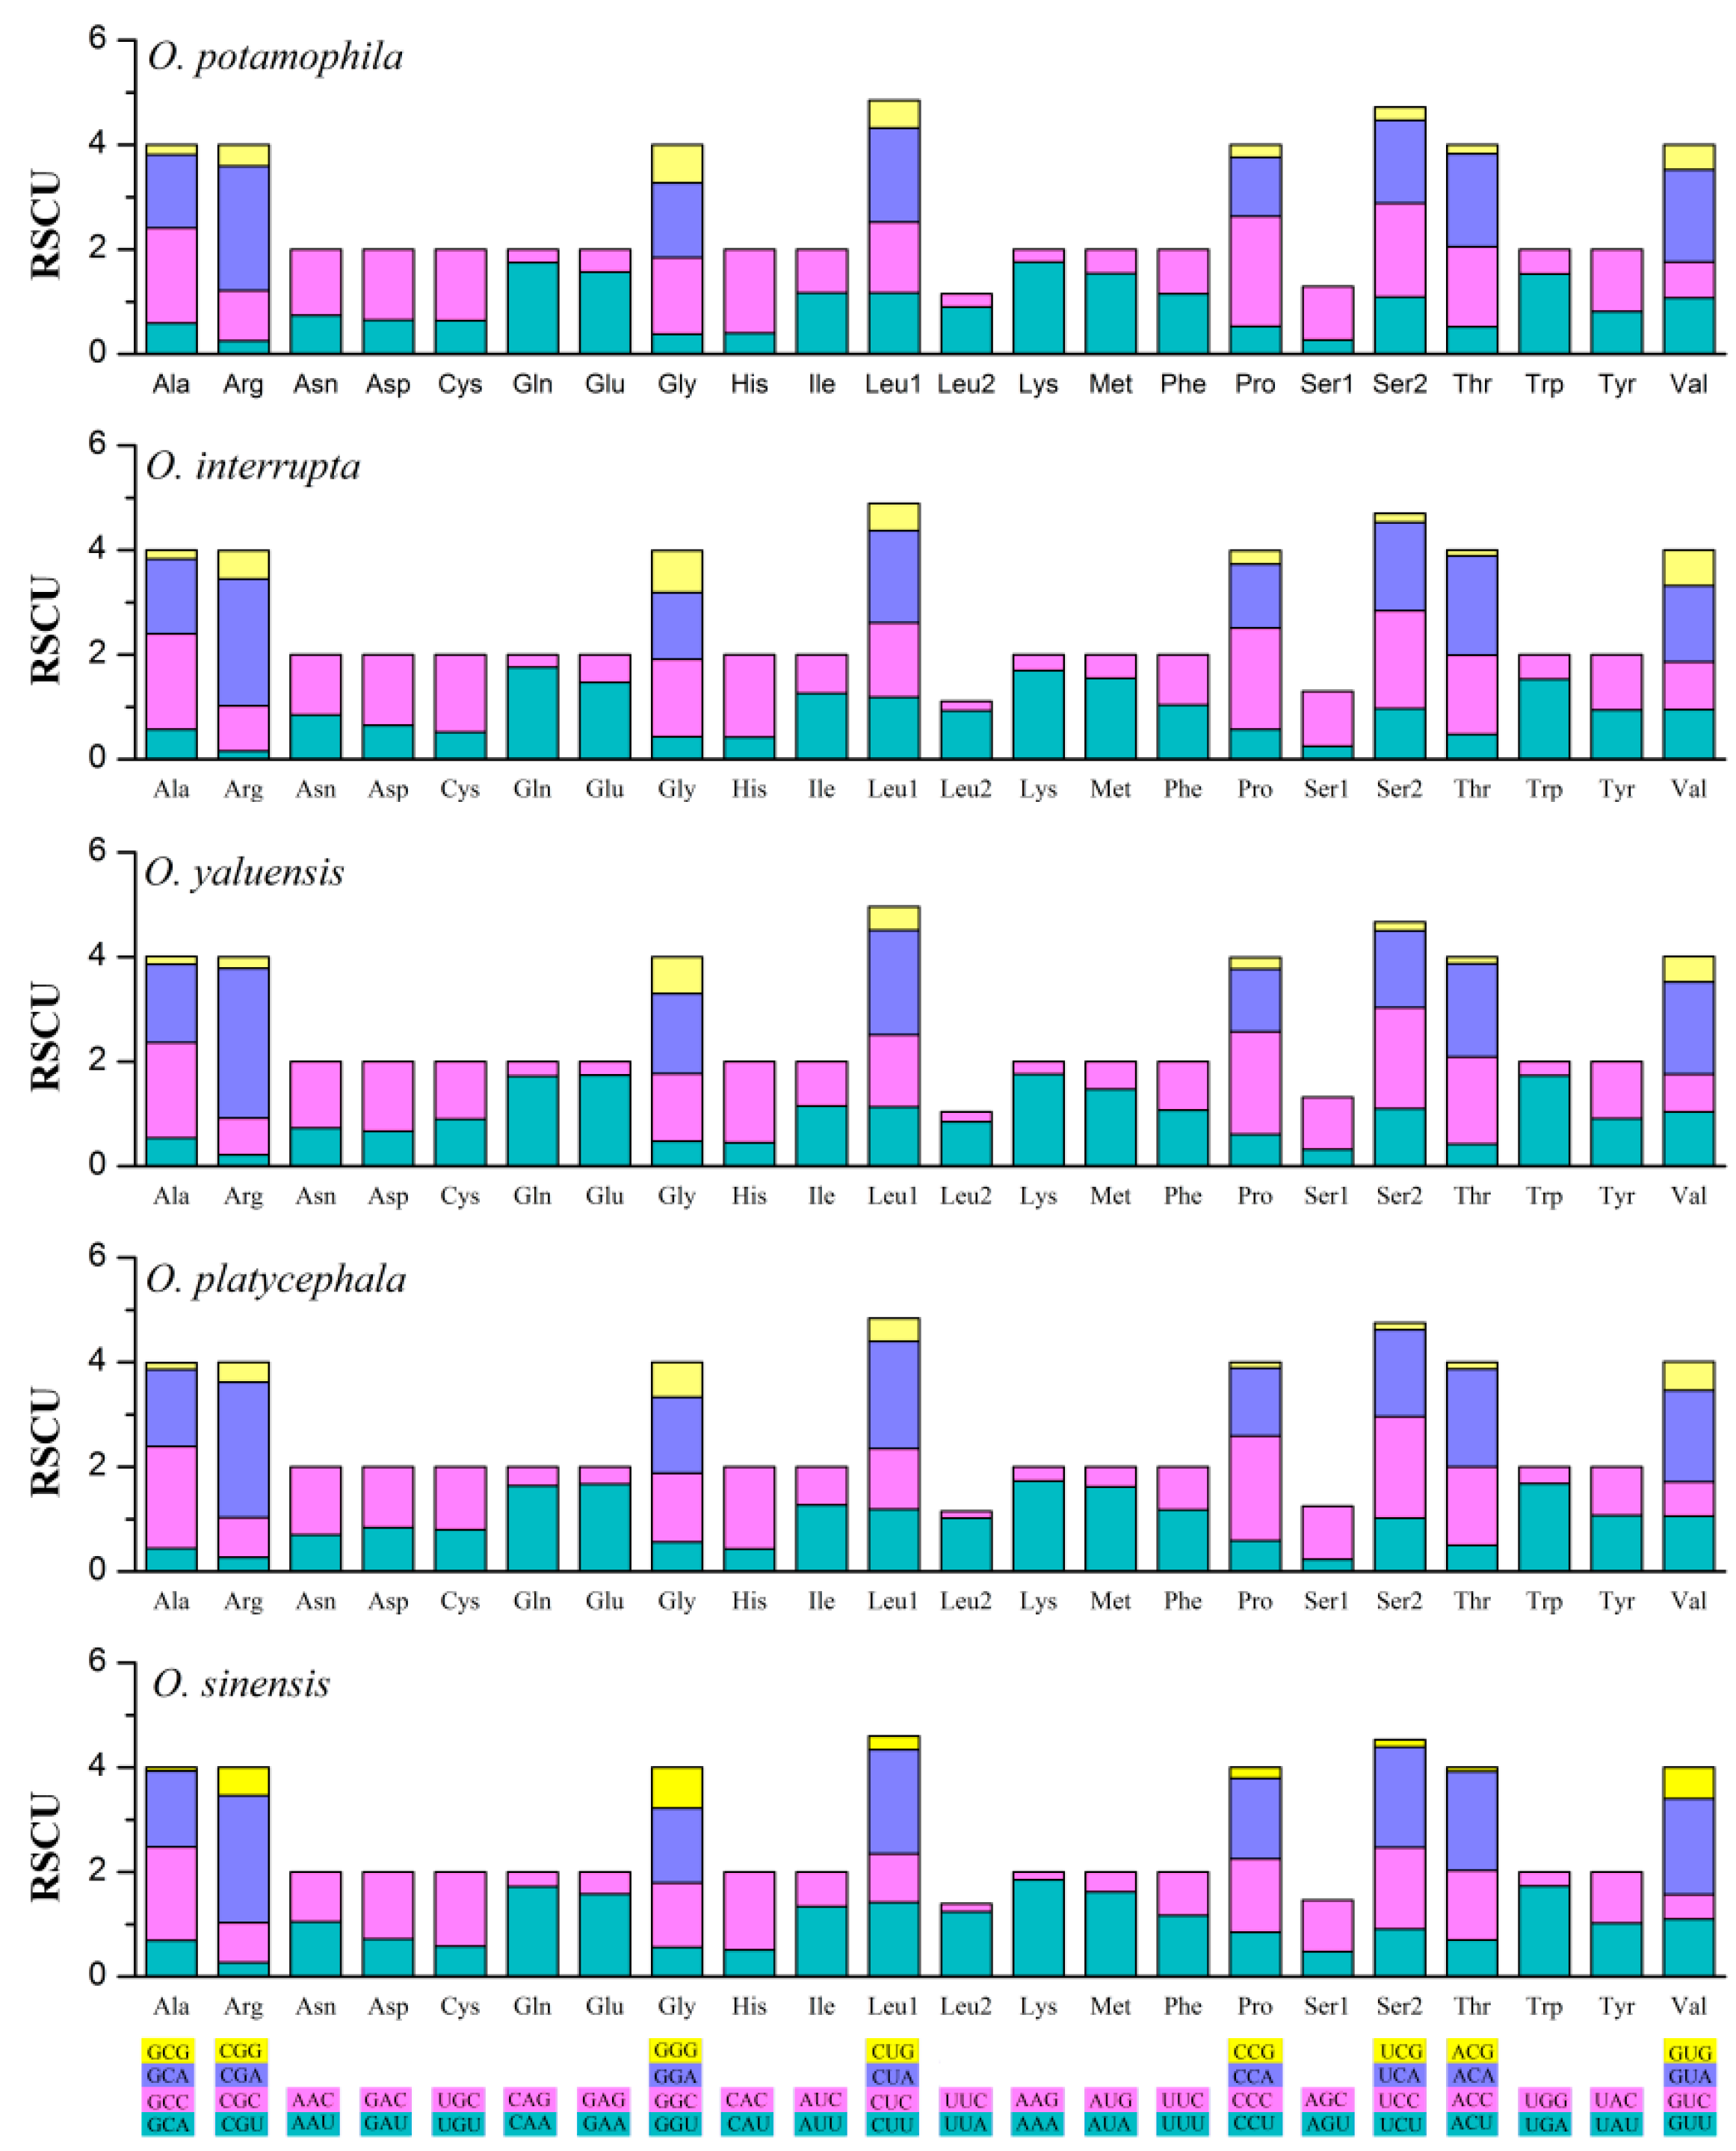
2.2. Comparison of Protein-Coding Genes

All PCGs shared ATG start codon, except for cox1, which began with GTG. The stop codons varied with TAA, TAG, TA, or T (Table S1), and the incomplete stop codons were presumably completed by post-transcriptional polyadenylation [60]. Comparative analyses showed differences among gobioids that the cox1 gene stopped with TAG in O. sinensis but TAA in other four Odontobutis species, and even varied with AGA or AGG in other gobioids [61,62]. The results reveal that the cox1 gene of gobioids may select a different mechanism for transcription termination during the evolutionary process. Additionally, gene overlapping regions have been detected in all these Odontobutis mitogenomes. For example, atp8-atp6 and nad4L-nad4 each overlap by seven nucleotides, and nad5-nad6 share four nucleotides, which agree with those of most other vertebrate mitogenomes [63].
Excluding stop codons, the 13 PCGs in these five Odontobutis mitogenomes consisted of 3797–3800 codons (CDs) in total, with a very similar behavior of codon usage (Figure 2). The four most predominant codon families were Leu1 (CUN), Thr, Ala, and Ile, each with more than 70 CDsp T (codons per thousand codons). Among them, Leu1 (CUN), as one of the hydrophobic amino acids, possessed the highest usage bias (129.5–143.7 CDsp T), which might be associated with the encoding function of chondriosome [64]. By contrast, Cys had the least CDsp T.
Subsequently, we utilized the relative synonymous codon usage (RSCU) to determine the preference for particular synonymous codons [65,66]. The codon usage pattern among these five Odontobutis species were similar, with both two- and four-fold degenerate codons exhibiting an over-usage of A and T at the third codon positions (Figure 3), which was consistent with other teleosts [67]. This phenomenon might relate to genome bias, optimal selection of tRNA usage, or the efficiency of DNA repair [68,69].
Figure 2. The codon usage pattern of five Odontobutis mitogenomes. The codon families are shown on the X-axis and CDsp T on the Y-axis.
Ijms 16 25031 g002
Figure 3. The RSCU of five Odontobutis mitogenomes. The codons are shown on the X-axis, and the RSCU values are shown on the Y-axis.
Ijms 16 25031 g003
To explore the sequence divergence among Odontobutis mitogenomes, we analyzed the pairwise genetic distances based on 13 PCGs (Table 2). The cox2 gene showed the smallest genetic distance among the 13 single PCG (mean distance: 0.120, Kimura two-parameter distance; K2P), while nad5 gene showed the largest genetic distance (mean distance: 0.835), revealing different mutation pressures among genes [70]. The K2P pairwise genetic distance of nad5 gene exhibited low variation within O. yaluensis, O. potamophila, O. interrupta, and O. platycephala (averaged 0.165, range 0.062–0.237) but high sequence divergence between these four species and O. sinensis (averaged 1.839, range 1.759–1.920). Furthermore, we also calculated the pairwise distance based on amino acid sequences, showing higher values than those calculated by nucleotide sequences. Our results show that synonymous substitutions are less than nonsynonymous substitutions in the PCGs of Odontobutis mitogenomes, revealing some protein-coding genes may have experienced positive selection.
Table 2. Pairwise genetic distances for 13 PCGs.
GeneOsi-OplOsi-OyaOsi-OpoOsi-OinOpl-OyaOpl-OpoOpl-OinOya-OpoOya-OinOpo-OinMean
atp60.2500.2280.2340.2450.2140.2160.2330.0970.1130.0550.189
atp80.2490.2620.2880.2910.2380.2660.2390.1300.1380.0450.215
cox10.1480.1430.1420.1530.1450.1520.1460.0810.0810.0400.123
cox20.1680.1570.1700.1620.1230.1320.1280.0660.0630.0340.120
cox30.1630.1660.1870.1780.1470.1720.1640.0940.1060.0590.143
cob0.2130.2080.1920.1950.1760.1440.1280.0930.0980.0490.150
nad10.2170.2390.2480.2490.1910.1920.2070.1290.1320.0580.186
nad20.2280.2500.2570.2580.2270.2430.2470.1700.1710.0630.211
nad30.2940.2790.3000.2630.2320.3340.2550.2070.1330.1280.243
nad40.2680.2680.2670.2570.2290.2460.2410.1130.1180.0630.207
nad4L0.1590.1500.2070.1450.1820.2720.2030.1750.0950.1110.170
nad51.9201.8191.7591.8600.2180.2370.2290.1250.1200.0620.835
nad60.2690.2780.2950.2970.2710.2620.2770.1260.1230.0660.226
Nt0.9240.9341.2591.2570.2921.2331.2511.1251.1480.0580.948
AA1.0571.0511.5191.5230.2551.4831.4921.4501.4620.0401.133
The abbreviations for five scientific names agree with those in Table 1; In addition, “Nt” indicates “the nucleotide of concatenated 13 PCGs”, and “AA” indicates “the amino acid of concatenated 13 PCGs”.
Among all 10 groups, the Ka/Ks values of most PCGs were less than 0.3 (Figure 4), indicating that they were under purifying selection. However, the Ka/Ks values of nad5 in these four groups (Osi-Opl, Osi-Oya, Osi-Opo, and Osi-Oin) were greater than 1, which showed a strong positive selection. Previous study has illustrated that energetic functional constraints are the major factors shaping different patterns of mitochondrial-encoded protein evolution [71,72]. Combining the Ka/Ks and genetic distance data suggests that O. sinensis is a relatively distinct lineage from other Odontobutis species, and nad5 gene has played a crucial role in the evolutionary process of selective adaptation.
Figure 4. The evolutionary rates (Ka/Ks) for each PCG among five Odontobutis mitogenomes. The names of 13 PCGs are shown on the X-axis, and the Ka/Ks values are shown on the Y-axis.
Ijms 16 25031 g004

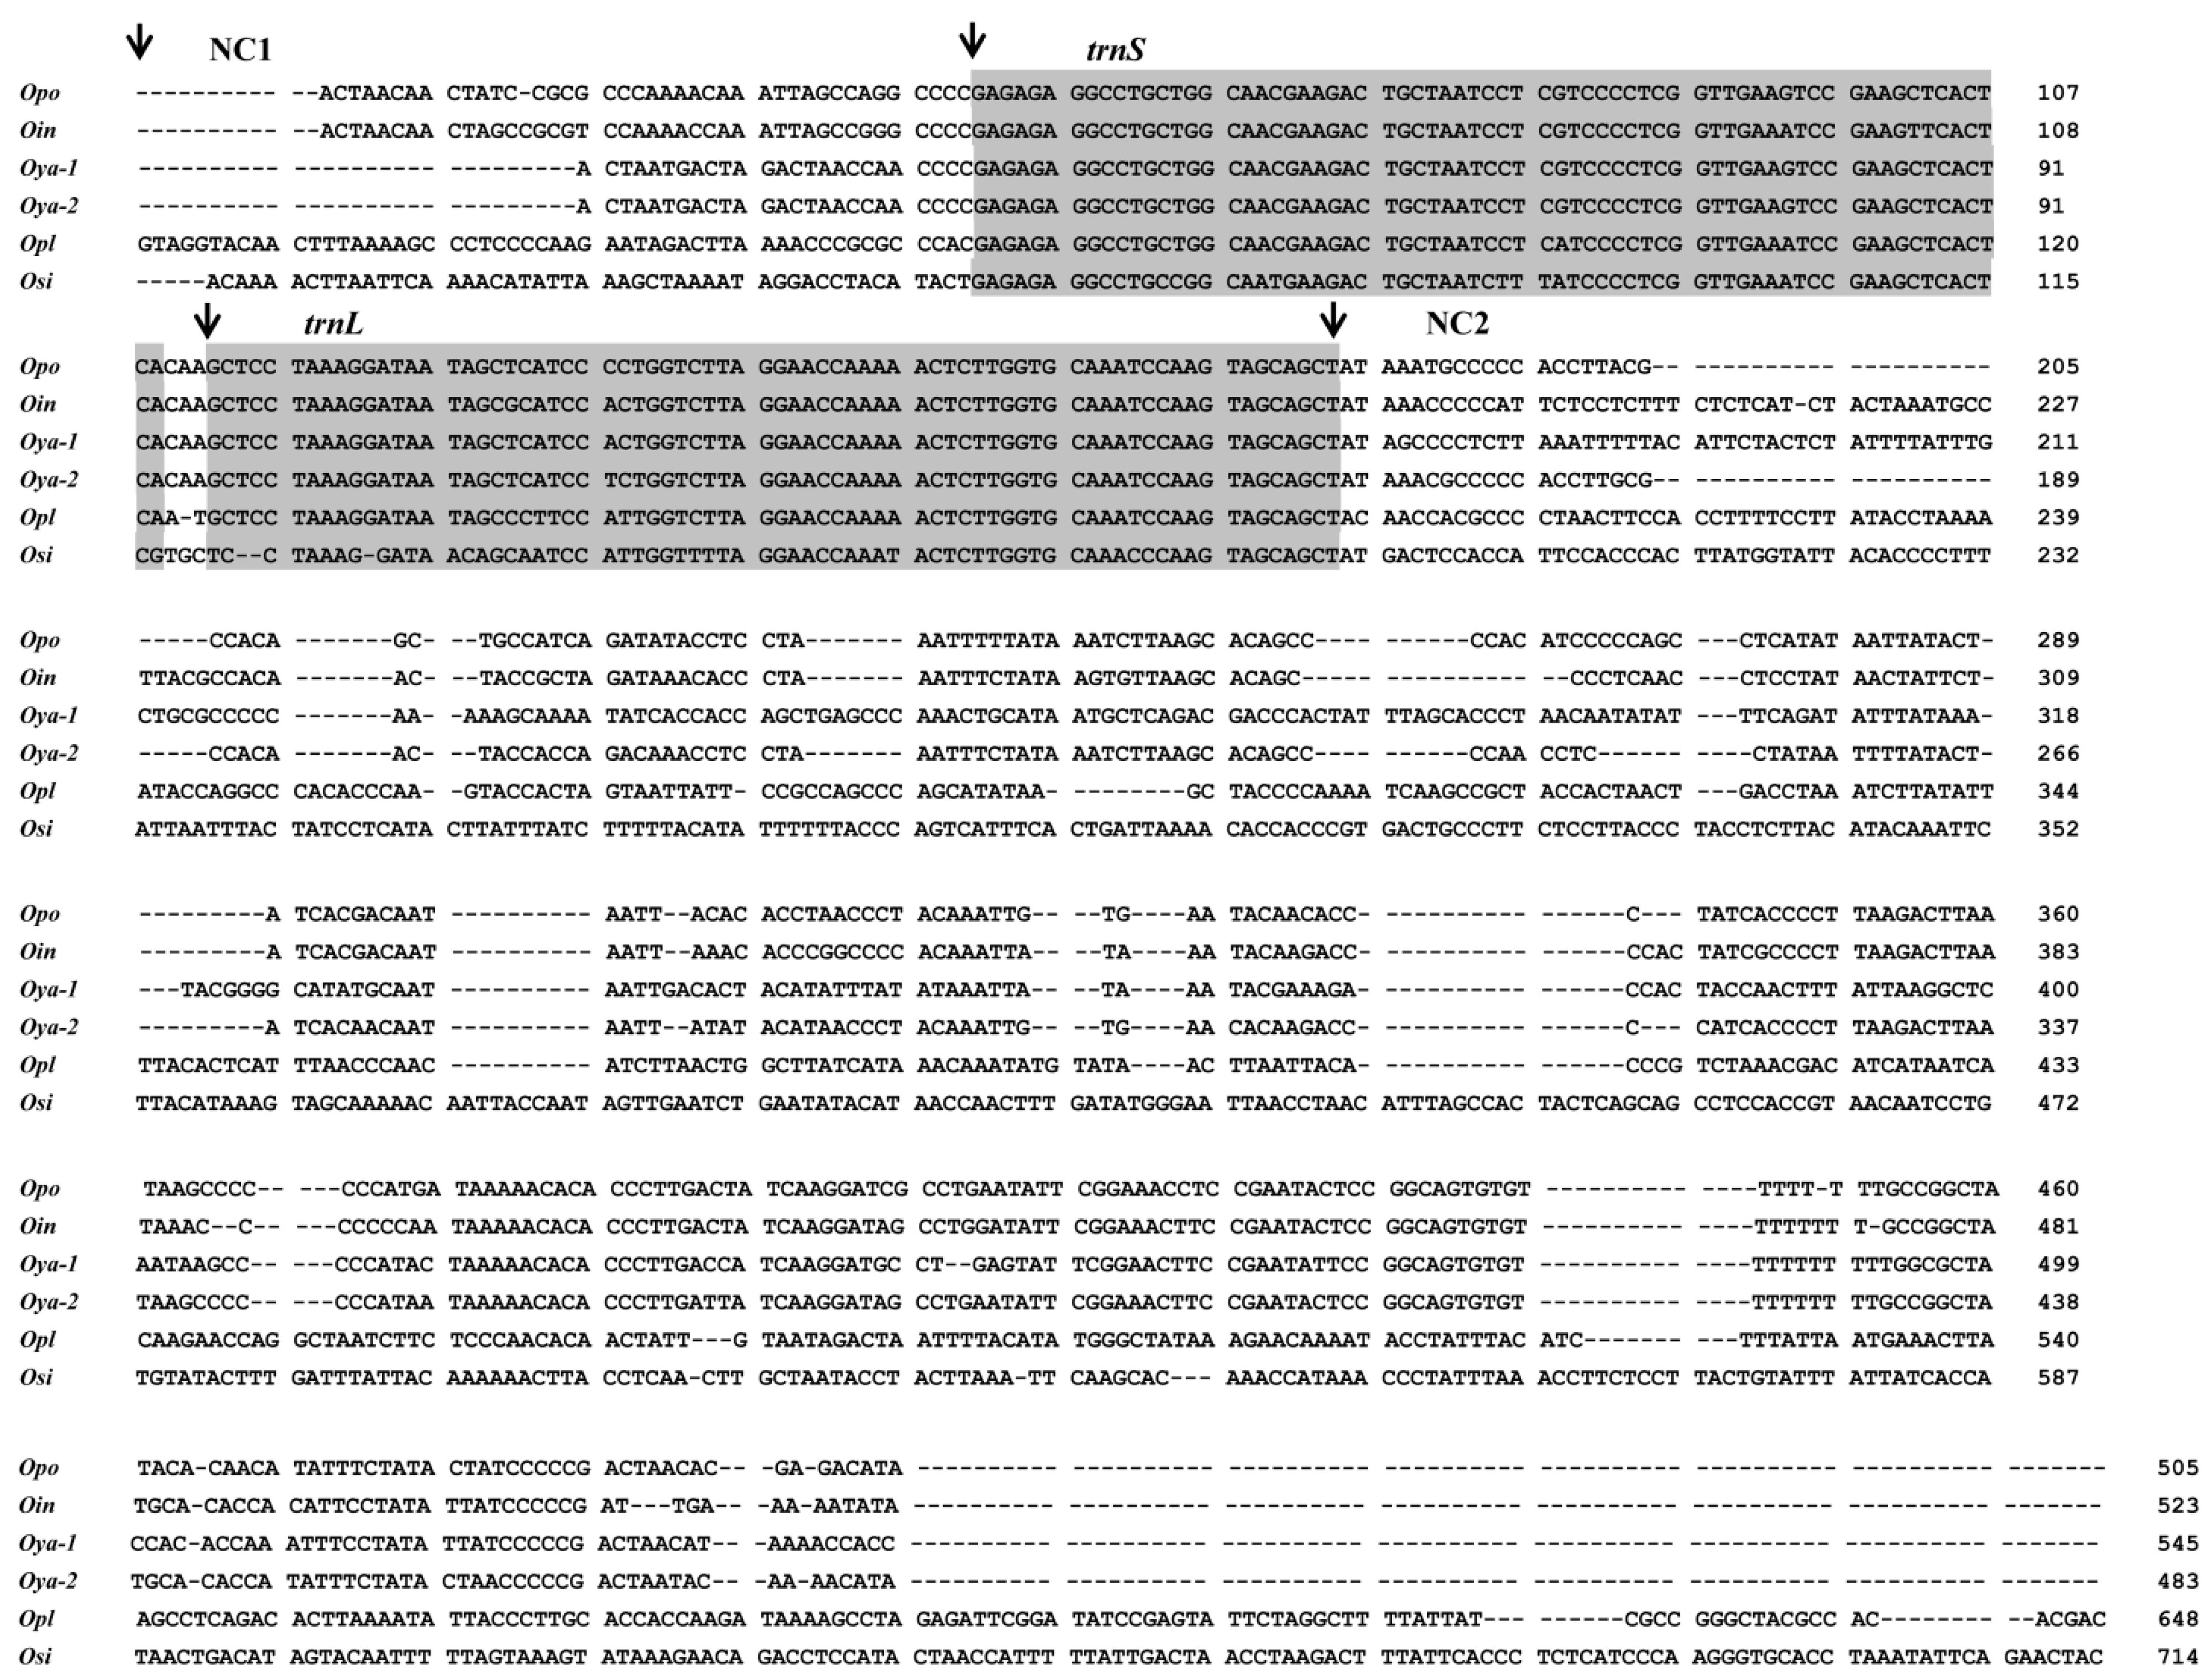
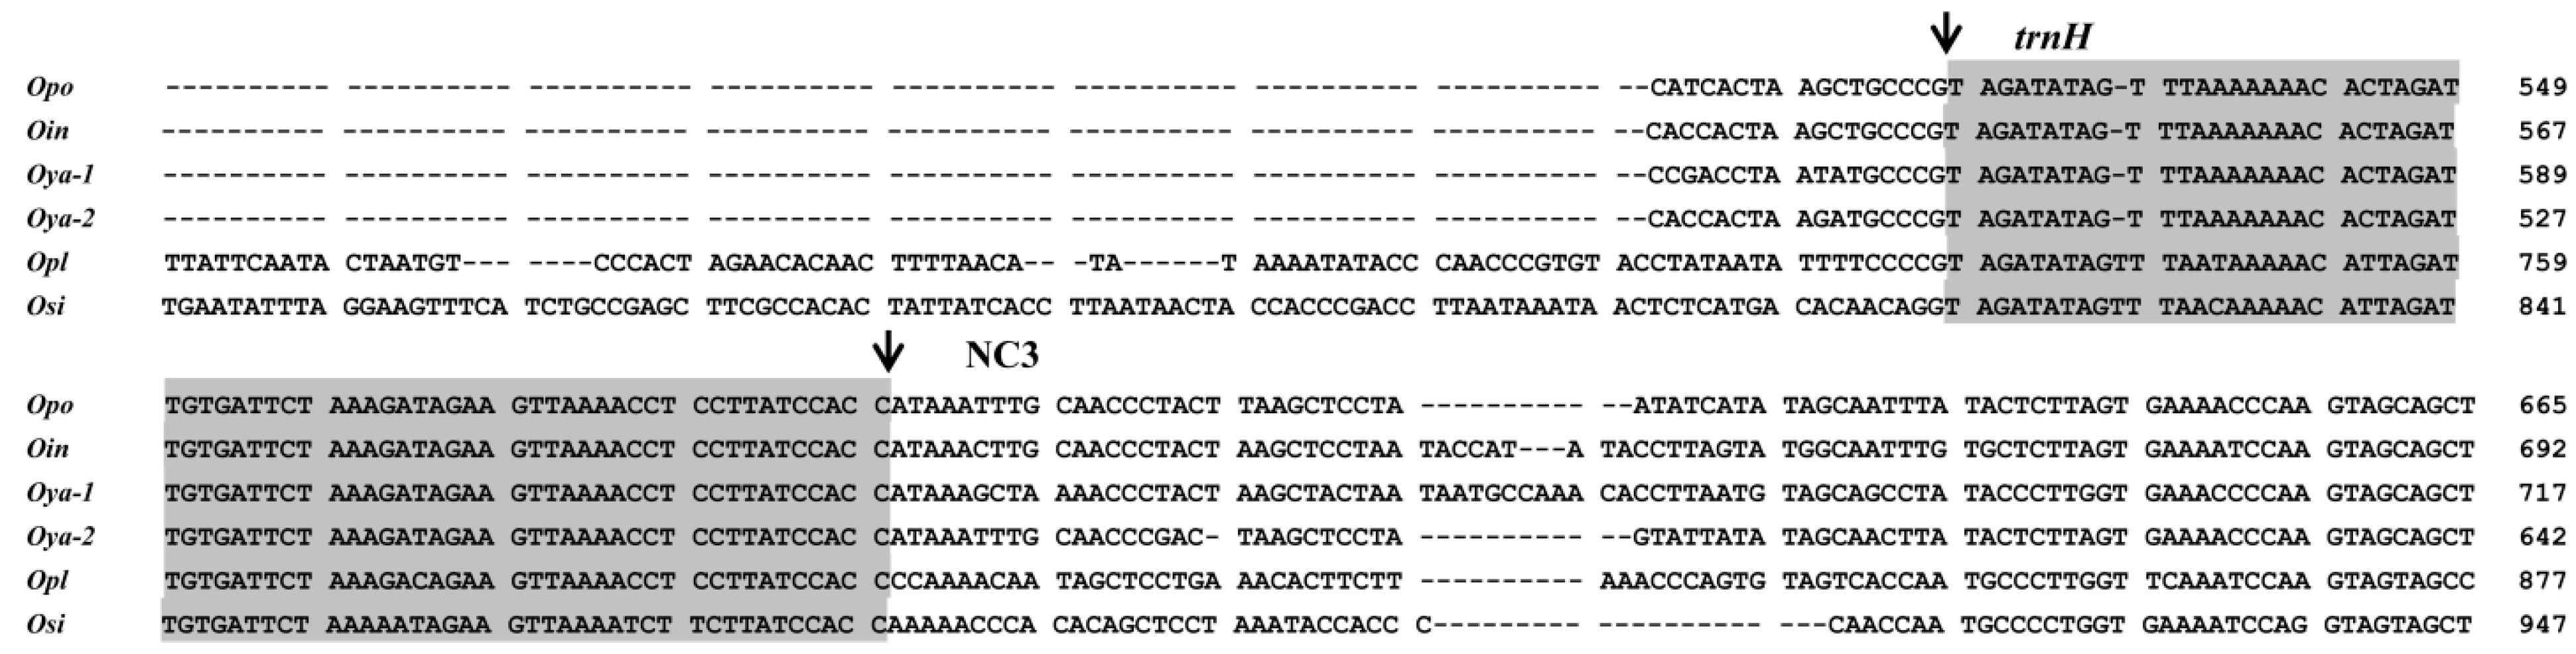
2.3. High Variations in Control Regions

Previous studies have indicated that the CR of O. platycephala contained a tandem repeat (TR) region consisting of 14 copies of 34 bp unit (476 bp in total) [53], and the CR of O. sinensis comprised seven 46 bp repeat units (322 bp in total) [57]. However, the CR of O. potamophila was composed of non-repetitive sequences [56], which was identical to that of O. yaluensis and O. interrupta. It was not difficult to find that these TRs bear responsibility for the length heteroplasmy in CRs of Odontobutis mitogenomes.
Upstream of CR in most animal mitogenomes, there was a conserved structure including the motif “ATGTA” in TAS-complementary TAS block sequence, which had been suggested as a terminate signal for CR strand synthesis [63]. We had detected the conserved motif “ATGTA” in every repeat unit in the CR of O. sinensis and O. platycephala (Figures S1 and S2). Buroker et al. [15] had proposed the illegitimate elongation model to account for the formation of the repeated sequences in the mitogenome, and this model was targeted at explaining the generation of the TAS motif in the 5′ of the CR. In the present study, the TRs in the O. sinensis and O. platycephala exactly contained the sequence associated with TAS domain. Thus, the heteroplasmy of TRs in O. sinensis and O. platycephala mitochondrial CR could be explained by the illegitimate elongation model.

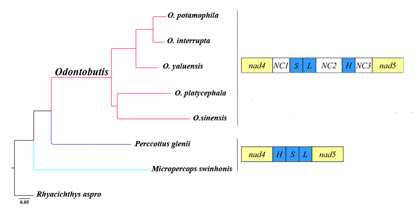
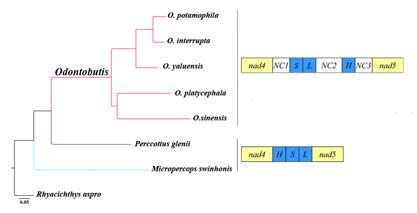
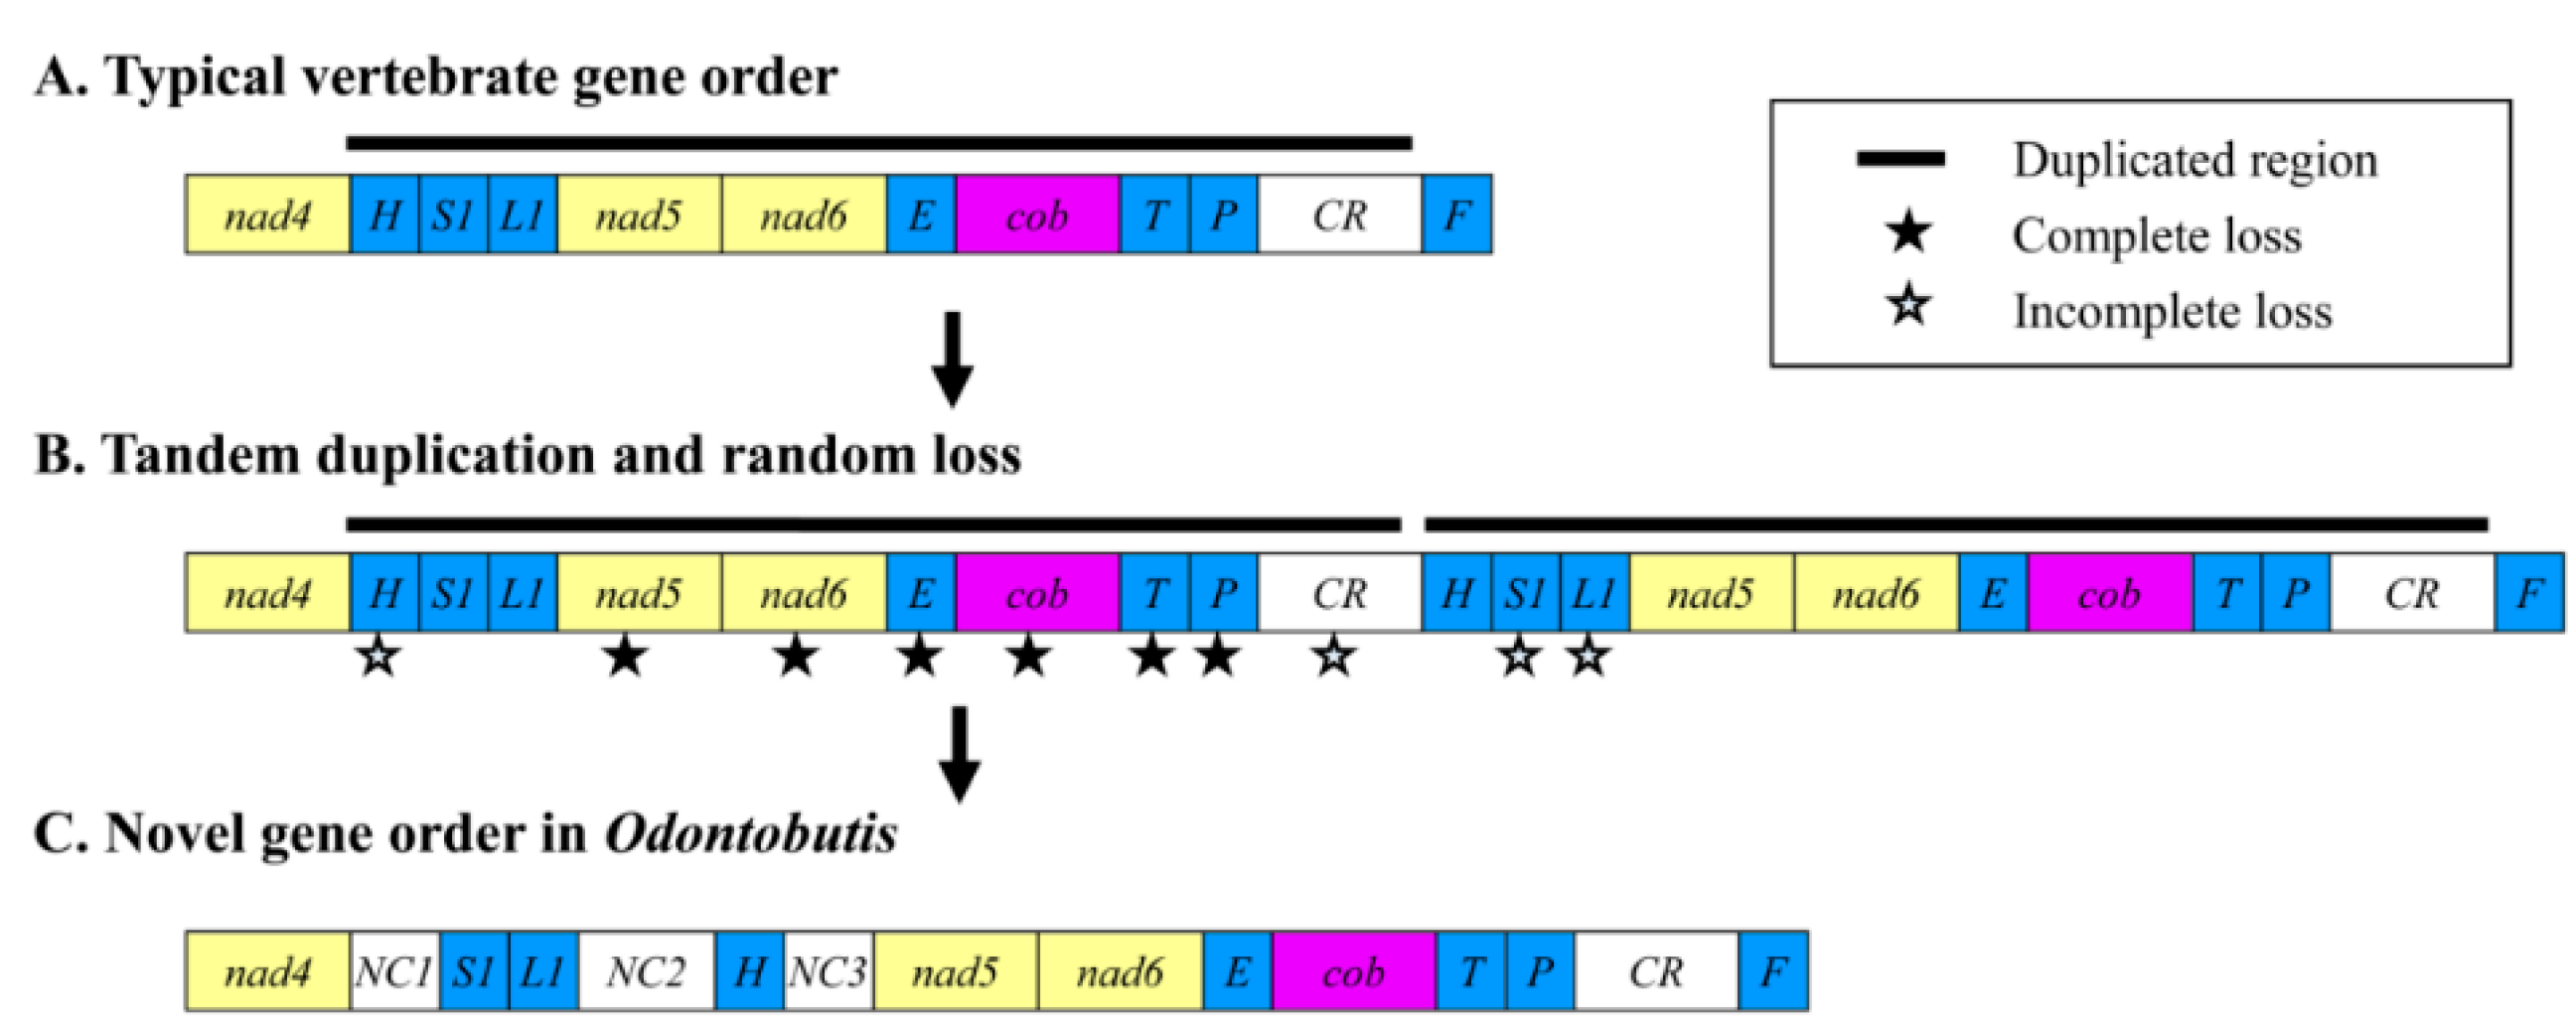
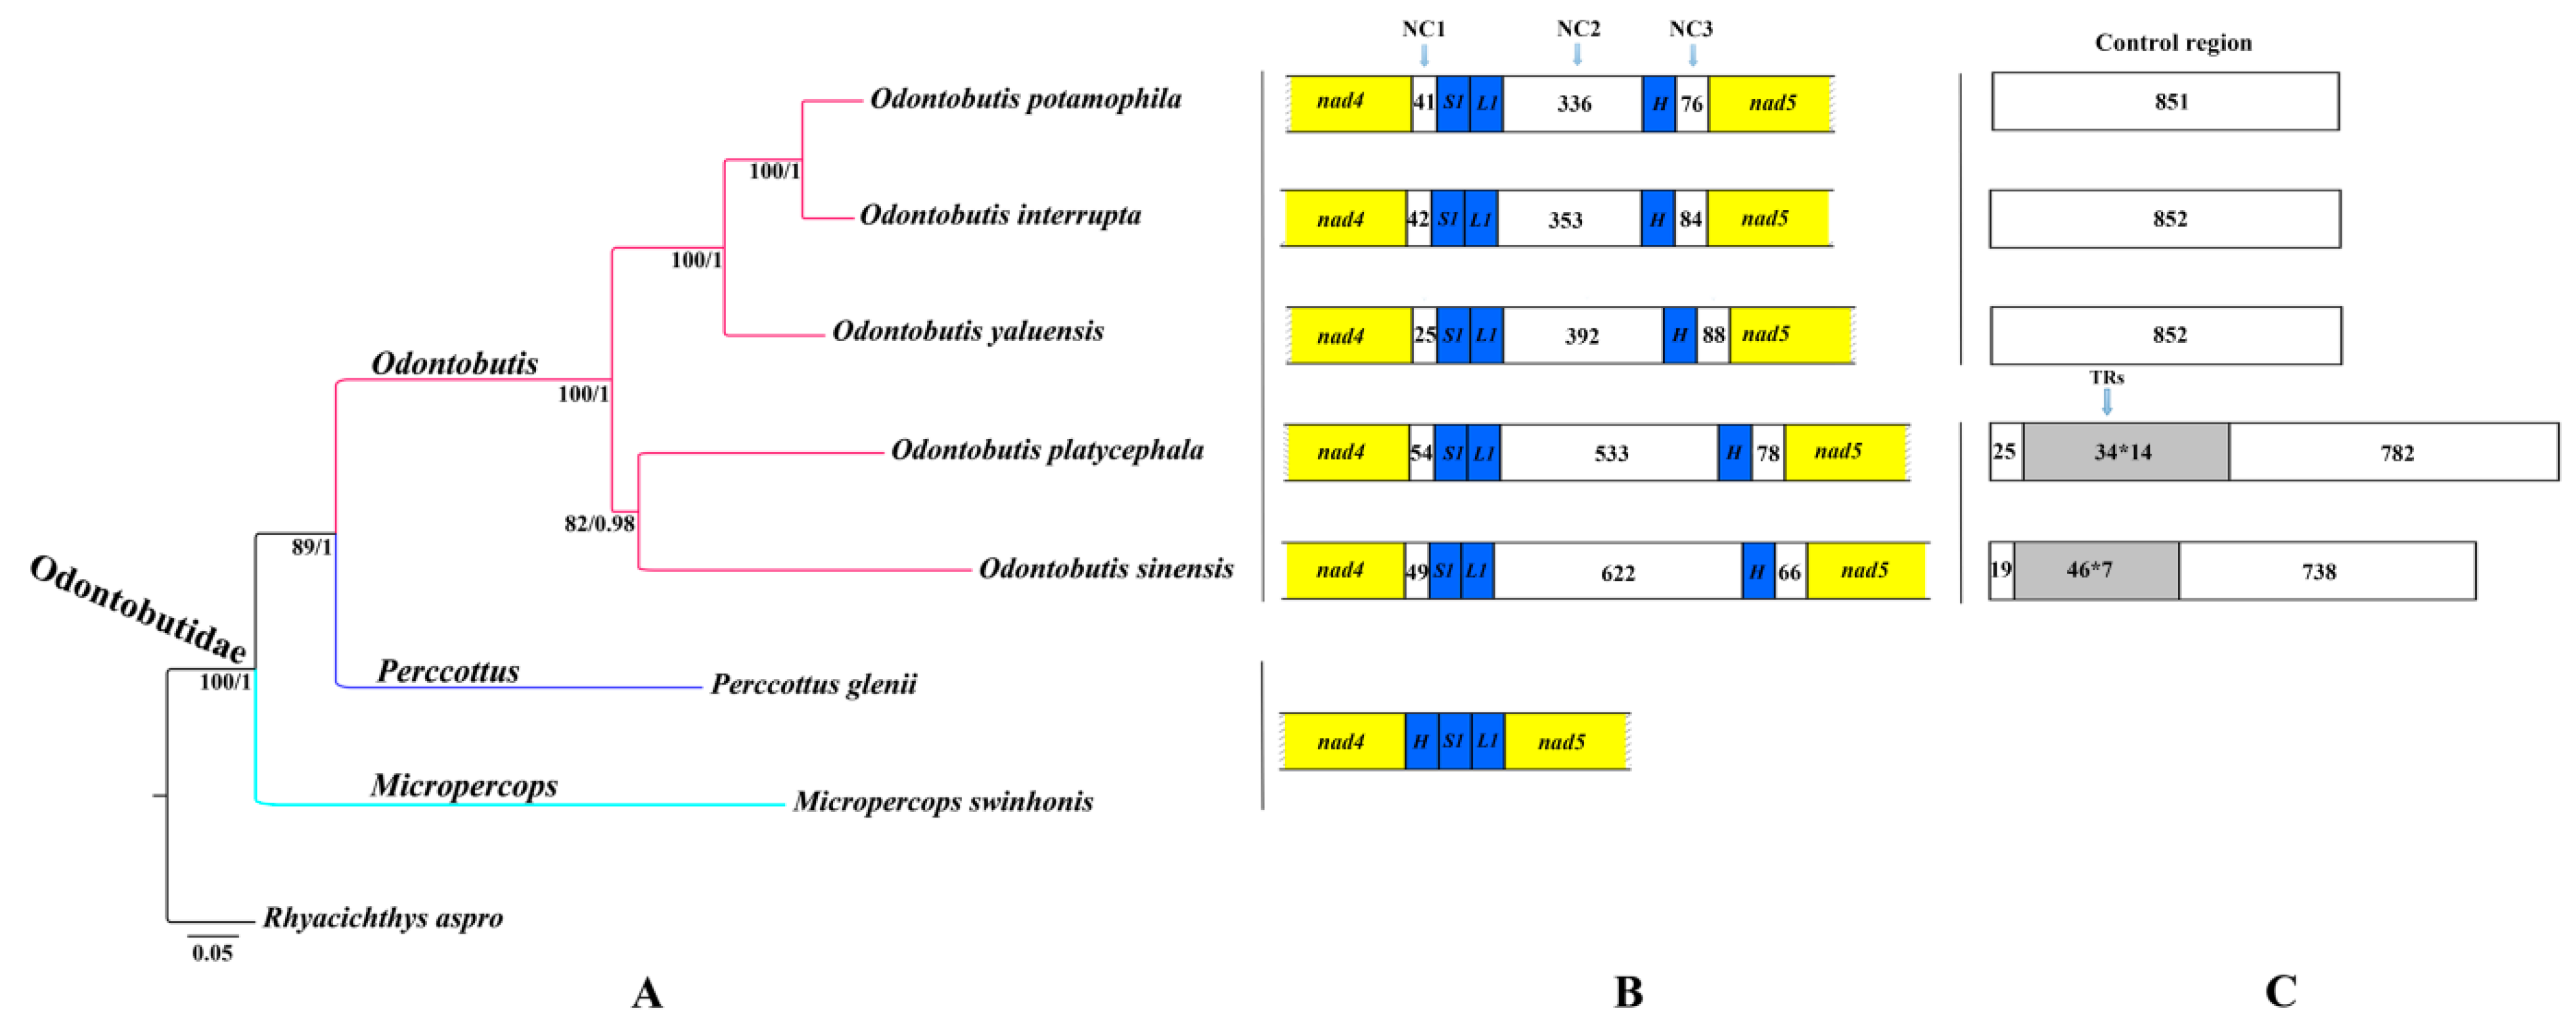
2.4. Gene Rearrangement and Possible Mechanisms

For a typical vertebrate mitogenome, the tRNA-gene cluster between nad4 and nad5 genes includes trnH, trnS, and trnL genes in this order [63]. However, in the O. yaluensis mitogenome, the position of trnH gene had been translocated to the downstream of the trnL gene in the order S–L–H. This novel gene order was identical to that of recently reported Odontobutis mitogenomes with three large intergenic non-coding sequences that respectively named NC1, NC2, and NC3 in this study (Figure 1). Previous study about the mitogenome of O. platycephala has reported this novel S–L–H gene order accompanied with three large intergenic spacers [53]. However, due to the lack of comparative mitogenomics data, the authors speculated this phenomenon might have occurred independently in certain species rather than all members of the genus Odontobutis [53]. As this gene rearrangement had not been observed in other vertebrates, our results suggest that this gene rearrangement is conserved in Odontobutis mitogenomes.
As shown in Figure 5, these intergenic spacers exhibited high variations among interspecific and intraspecific mitogenomes. The positions and sizes of intergenic spacers in each mitogenome indicate that the NC1 is the pseudogene of trnH gene and NC3 appears to be the residual sequence of combined trnS and trnL genes. Further sequence alignment could also provide evidence for our hypothesis (Figures S3 and S4). In addition, although the sequence similarity between NC2 and CR was low (<50%), we still infer the NC2 as the residual sequence of CR for the following reason: the NC2 in each mitogenome included some residual sequences of conserved sequence blocks (TAS, CSB-C, -D, -F, -1, and -2; Figures S1, S2, and S5–S7).
Figure 5. Aligned sequences of gene rearrangement regions of Odontobutis mitogenomes. Arrows indicate portions of three intergenic spacers and arranged genes. The positions of black arrows represent the starting sites of different regions. Gray boxes denote the tRNA genes. The numbers reveal the positional relationships among sequences. The abbreviations for their scientific names agree with those in Table 1. In addition, the Oya-1 indicates the O. yaluensis (KM207149), while Oya-2 indicates another O. yaluensis (KM277942).
Ijms 16 25031 g005aIjms 16 25031 g005b
Considering gene rearrangements occurring by tandem duplication of gene regions and deletions of redundant genes [27,73,74], the present rearranged genes and the associated intergenic spacers (pseudogenes) of Odontobutis mitogenomes could be explained by such process as follows (Figure 6): Firstly, tandem duplication occurred in the trnH-CR region, and the mitogenome would have contained two sets of the same region (Figure 6B); Then, to maintain the normal function of the mitogenome, one of the duplicated genes and CR randomly lost its function and became a pseudogene or even was completely lost during subsequent evolutionary events. Actually, as described above, NC1, NC2, and NC3 respectively corresponded to trnH, CR, and trnS-L; however, the approximately 3700 bp sequence (the nad5-trnP duplication) left no trace in NC2. This observation supports our hypothesis that the gene rearrangement events have occurred via tandem duplication of the whole trnH-CR region. Eventually, the existing gene order and intergenic spacers of the Odontobutis mitogenome were established (Figure 6C).
Figure 6. The mechanism proposed for the gene rearrangement in Odontobutis mitogenomes in tandem duplication and random loss (TDRL) model. The background colors correspond to the attributes of different gene clusters. The gene names are identical with those in Figure 1.
Ijms 16 25031 g006

2.5. Phylogenetic Relationships

Mitochondrial sequences are widely used to infer phylogenetic relationships among teleosts [5,21,75]. To have a better insight into the phylogenetic interrelationships within Odontobutidae, we obtained the concatenated nucleotide sequences of 13 PCGs from seven Odontobutidae species, including five Odontobutis species, one Perccottus species and one Micropercops species. Besides this, we used Rhyacichthys aspro as an outgroup because there was compelling evidence that Rhyacichthyidae was most closely related to Odontobutidae [44,45,49]. The phylogenetic trees reconstructed by two methods (maximum likelihood (ML) and Bayesian inference (BI)) exhibit a coincident topology (Figure 6A). Almost all nodes have high ML bootstrap supports (>90) and Bayesian posterior probabilities (>0.95).
Odontobutidae contains six genera (Odontobutis, Perccottus, Micropercops, Neodontobutis, Sineleotris, Terateleotris) [43,76], while no representatives of the latter three genera could be included here or in previous phylogenetic researches. In the present study, the phylogenetic trees showed that five Odontobutis species which shared conserved mitochondrial gene rearrangement were clustered into one clade (Figure 7A,B), indicating this gene rearrangement event may occur after Odontobutis diverges from other Odontobutidae lineages. In addition, the monophyly of the genus Odontobutis was also supported by the sampled taxa (Figure 7A), which was consistent with previous phylogenetic hypotheses [45,52,54]. The phylogenetic topologies exhibited that O. sinensis and O. platycephala shared a closer relationship, and the remainders formed another distinct clade. In addition, this phylogenetic interrelationship of Odontobutis exactly corresponded to the above comparative analysis based on whether they possessed tandem repeats in the mitochondrial control region (Figure 7C). The present study proves that the gene order and genome organization provide useful genetic information for understanding the evolutionary relationships among Odontobutidae species.
Figure 7. (A) Phylogenetic relationships of Odontobutidae species using concatenated nucleotide sequences of 13 mitochondrial PCGs. Numbers at the nodes show ML bootstrap percentages (left) and BI posterior probabilities (right), respectively; (B) Comparison of mitogenome structure between nad4 and nad5 genes within Odontobutidae. The protein-coding genes, tRNA genes, and non-coding regions are shown with yellow, blue, and white boxes, respectively. The numbers in white boxes (NC1, NC2, and NC3) represent the number of unassigned nucleotides of intergenic spacers; (C) Comparative analyses of the structure of CR among Odontobutis species. In white boxes, the numbers indicate the length of fragment. The gray shaded boxes represent the tandem repeat (TR) regions.
Ijms 16 25031 g007

3. Experimental Section

3.1. Samples and DNA Extraction

Specimens of O. yaluensis were collected from Dandong in Liaoning Province, China (40°31′22.74′′N, 123°55′14.24′′E), and identified according to Wu et al. [77]. Subsequently, caudal fins were preserved in 100% ethanol. Total genomic DNA was extracted by the modified ammonium acetate precipitation protocol [78]. The DNA integrity was examined by electrophoresis in agarose gel, and the purity and concentration were measured on the NanoDrop 2000 (Thermo Scientific, Wilmington, DE, USA).

3.2. PCR Amplification and Sequencing

Based on conserved nucleotide sequences of published Odontobutis mitogenomes, a total of 20 pairs of species-specific primers (Table S2) were designed using Primer Premier 5.0 software (PREMIER Biosoft International, Palo Alto, CA, USA) for the amplification of the entire O. yaluensis mitogenome. To sequence the complete mitogenome and assemble correctly, we make sure that adjacent two fragments overlap more than 50 bp.
The PCR reactions were carried out on an Eppendorf Thermal Cycler (Berlin, Germany) in 25 μL reaction volumes containing 2 μL of each primer, 2 μL PCR buffer II (Mg2+), 1.25 mM of dNTPs, 1.25 U LA Taq polymerase, about 100 ng template DNA, and sterile doubly-distilled water to final volume. Conditions for PCR amplification were as follows: one initial denaturation step at 94 °C for 2 min; then 94 °C for 30 s (denaturation), 50–58 °C for 45 s (annealing), 72 °C for 1–3 min (extension) for 35 cycles; followed by a final extension step at 72 °C for 10 min. The PCR products were examined by 1.0% agarose gel electrophoresis, and purified using the TaKaRa MiniBEST Agarose Gel DNA Extraction Kit (Takara, Dalian, China). Sequencing was completed in Tsingke Biotech Co., Ltd. (Wuhan, China).

3.3. Gene Annotation and Sequence Analysis

The DNA sequences were assembled using SeqMan program of Lasergene 7.0 (DNAstar, Madison, WI, USA) to create complete mitogenome. During the walking sequencing of large fragments, we regularly examine the assembly to ensure its reliability. The annotation of 13 PCGs and two rRNAs, and the definition of each gene boundaries were determined by both DOGMA [79] and MitoFish [58] programs. tRNAs and their secondary structures were predicted by tRNAscan-SE 1.21 [80], and the cut-off value was 1. Non-coding regions were identified via sequence homology with Clustal W2 [81]. Tandem repetitive elements were detected by using the Tandem Repeats Finder 4.04 [82].
Nucleotide base compositions and codon usage were calculated with MEGA 5.2 [83]. AT-skew ((A−T)/(A+T)) and GC-skew ((G−C)/(G+C)) were used to measure nucleotide bias [84]. The genetic distance of different PCGs were also analyzed in MEGA 5.2 [83]. The Ks and Ka in each protein-coding gene were determined by DnaSP 5.0 [85] for ten groups: O. sinensis-O. platycephala (Osi-Opl), O. sinensis-O. yaluensis (Osi-Oya), O. sinensis-O. potamophila (Osi-Opo), O. sinensis-O. interrupta (Osi-Oin), O. platycephala-O. yaluensis (Opl-Oya), O. platycephala-O. potamophila (Opl-Opo), O. platycephala-O. interrupta (Opl-Oin), O. yaluensis-O. potamophila (Oya-Opo), O. yaluensis-O. interrupta (Oya-Oin), O. potamophila-O. interrupta (Opo-Oin). The gene map of the O. yaluensis mitogenome was generated by MitoFish and MitoAnnotator program [58].

3.4. Phylogenetic Analyses

A total of seven Odontobutidae species were used to reconstruct the phylogenetic trees. Beside this, we selected Rhyacichthys aspro (AP004454) as an outgroup (Table S3). The nucleotide sequences of 13 mitochondrial PCGs were concatenated and a multiple sequence alignment was performed with Clustal W built-in MEGA 5.2 [83]. Phylogenetic analyses were carried out by both ML and BI methods. We implemented the ML analyses in RAxML version 8.0.0 (BlackBox webserver; http://embnet.vital-it.ch/raxml-bb/) to generate phylogenetic trees under GTR+G+I model [86]. The Bayesian analyses was performed using Mrbayes 3.2.4 [87] with four independent chains running for 3 million generations, sampling a tree every 1000 generations, the first 750 trees were removed as burn-in and the remaining trees were used to calculated Bayesian posterior probabilities (BPP). Phylogenetic trees were viewed and edited in Figtree 1.4.0 [88].

4. Conclusions

The mitogenome of O. yaluensis is similar to those of other four Odontobutis species. The identical gene rearrangement of trnS-trnL-trnH tRNA cluster observed in these mitogenomes suggests that this unique gene order is conserved within the genus Odontobutis. The present rearranged genes and associated intergenic spacers reveal that this gene rearrangement results from tandem duplication and random loss (TDRL) of large-scale gene regions. Phylogenetic analyses of the family Odontobutidae support Odontobutis species which share gene rearrangement forming a monophyletic group, and the interspecific evolutionary relationships within the genus Odontobutis are consistent with the features, whether or not they share tandem repeats in their control regions.

Supplementary Materials

Acknowledgments

We are grateful to Qian Wang for providing the species of O. yaluensis. We also thank Ping Qiu, Hongxia Xu, and Zhujin Ding for their kindly help in the laboratory work. This work was financially supported by the Fundamental Research Funds for the Central Universities (No. 2012ZYTS027 and No. 2013SC05) and Project of Wetland Restoration and Protection of Liangzi Lake.

Author Contributions

Ruibin Yang designed the research; Zhihong Ma finalized the paper writing; Zhihong Ma, Xuefen Yang, Miklos Bercsenyi, Junjie Wu, Yongyao Yu and Kaijian Wei performed the experiments and contributed to the data collection, statistical analysis; Qixue Fan contributed to the revisions of this manuscript. All authors have read and approved the final manuscript.

Conflicts of Interest

The authors declare no conflict of interest.

References

  1. Brown, W.M. The mitochondrial genome of animals. In Molecular Evolutionary Genetics; McIntyre, R.J., Ed.; Plenum Press: New York, NY, USA, 1985; pp. 95–130. [Google Scholar]
  2. Boore, J.L. Animal mitochondrial genomes. Nucleic Acids Res. 1999, 27, 1767–1780. [Google Scholar] [CrossRef] [PubMed]
  3. Li, Y.; Guo, X.; Cao, X.; Deng, W.; Luo, W.; Wang, W.M. Population genetic structure and post-establishment dispersal patterns of the red swamp crayfish Procambarus clarkii in China. PLoS ONE 2012, 7, e40652. [Google Scholar] [CrossRef] [PubMed]
  4. Xiao, W.; Zhang, Y.; Liu, H. Molecular systematics of Xenocyprinae (Teleotei: Cyprinidae): Taxonomy, biogeography, and coevolution of a special group restricted in East Asia. Mol. Phylogenet. Evol. 2001, 18, 163–173. [Google Scholar] [CrossRef] [PubMed]
  5. Miya, M.; Takeshima, H.; Endo, H.; Ishiguro, N.B.; Inoue, J.G.; Mukai, T.; Satoh, T.P.; Shirai, S.M.; Yamaguchi, A.; Mabuchi, K.; et al. Major patterns of higher teleostean phylogenies: A new perspective based on 100 complete mitochondrial DNA sequences. Mol. Phylogenet. Evol. 2003, 26, 121–138. [Google Scholar] [CrossRef]
  6. Wang, Y.; Chen, J.; Jiang, L.Y.; Qiao, G.X. Hemipteran mitochondrial genomes: Features, structures and implications for phylogeny. Int. J. Mol. Sci. 2015, 16, 12382–12404. [Google Scholar] [CrossRef] [PubMed]
  7. Boore, J.L. The use of genome-level characters for phylogenetic reconstruction. Trends Ecol. Evol. 2006, 21, 439–446. [Google Scholar] [CrossRef] [PubMed]
  8. Boore, J.L.; Brown, W.M. Big trees from little genomes: Mitochondrial gene orders as a phylogenetic tool. Curr. Opin. Genet. Dev. 1998, 8, 668–674. [Google Scholar] [CrossRef]
  9. Arnason, E.; Rand, D.M. Heteroplasmy of short tandem repeats in mitochondrial DNA of Atlantic cod, Gadus morhua. Genetics 1992, 132, 211–220. [Google Scholar] [PubMed]
  10. Matson, C.W.; Baker, R.J. DNA sequence variation in the mitochondrial control region of red-backed voles (Clethrionomys). Mol. Biol. Evol. 2001, 18, 1494–1501. [Google Scholar] [CrossRef] [PubMed]
  11. Crochet, P.A.; Desmarais, E. Slow rate of evolution in the mitochondrial control region of gulls (Aves: Laridae). Mol. Biol. Evol. 2000, 12, 1797–1806. [Google Scholar] [CrossRef]
  12. Ray, D.A.; Densmore, L.D. Repetitive sequences in the crocodilian mitochondrial control region: Poly-A sequences and heteroplasmic tandem repeats. Mol. Biol. Evol. 2003, 20, 1006–1013. [Google Scholar] [CrossRef] [PubMed]
  13. Gong, L.; Shi, W.; Si, L.Z.; Wang, Z.M.; Kong, X.Y. The complete mitochondrial genome of peacock sole Pardachirus pavoninus (Pleuronectiformes: Soleidae) and comparative analysis of the control region among 13 soles. Mol. Biol. 2015, 49, 461–471. [Google Scholar] [CrossRef]
  14. Anderson, S.; Bankier, A.T.; Barrell, B.G.; de Bruijn, M.H.L.; Coulson, A.R.; Drouin, J.; Eperon, I.C.; Nierlich, D.P.; Roe, B.A.; Sanger, F.; et al. Sequence and organization of the human mitochondrial genome. Nature 1981, 290, 457–465. [Google Scholar] [CrossRef] [PubMed]
  15. Buroker, N.E.; Brown, J.R.; Gilbert, T.A.; O’Hara, P.J.; Beckenbach, A.T.; Thomas, W.K.; Smith, M.J. Length heteroplasmy of sturgeon mitochondrial DNA: An illegitimate elongation model. Genetics 1990, 124, 157–163. [Google Scholar] [PubMed]
  16. Broughton, R.E.; Dowling, T.E. Length variation in mitochondrial DNA of the minnow Gyprinella spiloptera. Genetics 1994, 138, 179–190. [Google Scholar] [PubMed]
  17. Shi, W.; Kong, X.Y.; Wang, Z.M.; Yu, S.S.; Chen, H.X.; de Stasio, E.A. Pause-melting misalignment: A novel model for the birth and motif indel of tandem repeats in the mitochondrial genome. BMC Genom. 2013. [Google Scholar] [CrossRef] [PubMed]
  18. Macey, J.R.; Larson, A.; Anajeva, N.B.; Fang, Z.; Papenfuss, T.J. Two novel gene orders and the role of light-strand replication in rearrangement of the vertebrate mitochondrial genome. Mol. Biol. Evol. 1997, 14, 91–104. [Google Scholar] [CrossRef] [PubMed]
  19. Hoelzel, A.R.; Hancock, J.M.; Dover, G.A. Generation of VNTRs and heteroplasmy by sequence turnover in the mitochondrial control region of two elephant seal species. J. Mol. Evol. 1993, 37, 190–197. [Google Scholar] [CrossRef] [PubMed]
  20. D’Onorio de Meo, P.; D’Antonio, M.; Griggio, F.; Lupi, R.; Borsani, M.; Pavesi, G.; Pesole, G.; Castrignanò, T.; Gissi, C. MitoZoa 2.0: A database resource and search tools for comparative and evolutionary analyses of mitochondrial genomes in Metazoa. Nucleic Acids Res. 2012, 40, D1168–D1172. [Google Scholar] [CrossRef] [PubMed]
  21. Miya, M.; Nishida, M. The mitogenomic contributions to molecular phylogenetics and evolution of fishes: A 15-year retrospect. Ichthyol. Res. 2015, 62, 29–71. [Google Scholar] [CrossRef]
  22. Janke, A.; Xu, X.; Arnason, U. The complete mitochondrial genome of the wallaroo (Macropus robustus) and the phylogenetic relationship among Monotrema, Marsupialia and Eutheria. Porc. Natl. Acad. Sci. USA 1991, 94, 1276–1281. [Google Scholar] [CrossRef]
  23. Pääbo, S.; Thomas, W.K.; Whitfield, K.M.; Kumazawa, Y.; Wilson, A.C. Rearrangements of mitochondrial transfer RNA genes in marsupials. J. Mol. Evol. 1991, 33, 426–430. [Google Scholar] [CrossRef] [PubMed]
  24. San Mauro, D.; Gower, D.J.; Zardoya, R.; Wilkinson, M. A hotspot of gene order rearrangement by tandem duplication and random loss in the vertebrate mitochondrial genome. Mol. Biol. Evol. 2006, 23, 227–234. [Google Scholar] [CrossRef] [PubMed]
  25. Janke, A.; Arnason, U. The complete mitochondrial genome of Alligator mississippiensis and the separation between recent archosauria (birds and crocodiles). Mol. Biol. Evol. 1997, 14, 1266–1272. [Google Scholar] [CrossRef] [PubMed]
  26. Kumazawa, Y.; Nishida, M. Variations in mitochondrial tRNA gene organization of reptiles as phylogenetic markers. Mol. Biol. Evol. 1995, 12, 759–772. [Google Scholar] [PubMed]
  27. Mabuchi, K.; Miya, M.; Satoh, T.P.; Westnest, M.W.; Nishida, M. Gene rearrangements and evolution of tRNA pseudogenes in the mitochondrial genome of the parrotfish (Teleostei: Perciformes: Scaridae). J. Mol. Evol. 2004, 59, 287–297. [Google Scholar] [CrossRef] [PubMed]
  28. Lunt, D.H.; Hyman, B.C. Animal mitochondrial DNA recombination. Nature 1997, 387, 247. [Google Scholar] [CrossRef] [PubMed]
  29. Burzynski, A.; Zbawicka, M.; Skibinski, D.O.; Wenne, R. Evidence for recombination of mtDNA in the marine mussel Mytilus trossulus from the Baltic. Mol. Biol. Evol. 2003, 20, 388–392. [Google Scholar] [CrossRef] [PubMed]
  30. Kraytsberg, Y.; Schwartz, M.; Brown, T.A.; Ebralidse, K.; Kunz, W.S.; Clayton, D.A.; Vissing, J.; Khrapko, K. Recombination of human mitochondrial DNA. Science 2004, 304, 981. [Google Scholar] [CrossRef] [PubMed]
  31. Boore, J.L. The duplication/random loss model for gene rearrangement exemplified by mitochondrial genomes of deuterostome animals. In Comparative Genomics; Sankoff, D., Nadeau, J., Eds.; Kluwer Academic Publisher: Dordrecht, The Netherlands, 2000; Volume 1, pp. 133–147. [Google Scholar]
  32. Inoue, J.G.; Miya, M.; Tsukamoto, K.; Nishida, M. Complete mitochondrial DNA sequence of Conger myriaster (Teleostei: Anguilliformes): Novel gene order for vertebrate mitochondrial genomes and the phylogenetic implications for anguilliform families. J. Mol. Evol. 2001, 52, 311–320. [Google Scholar] [PubMed]
  33. Shi, W.; Gong, L.; Wang, S.Y.; Miao, X.G.; Kong, X.Y. Tandem duplication and random loss for mitogenome rearrangement in Symphurus (Teleost: Pleuronectiformes). BMC Genom. 2015. [Google Scholar] [CrossRef] [PubMed]
  34. Lavrov, D.V.; Boore, J.L.; Brown, W.M. Complete mtDNA sequences of two millipedes suggest a new model for mitochondrial gene rearrangements: Duplication and nonrandom loss. Mol. Biol. Evol. 2002, 19, 163–169. [Google Scholar] [CrossRef] [PubMed]
  35. Beckenbach, A.T. Mitochondrial genome sequences of Nematocera (lower Diptera): Evidence of rearrangement following a complete genome duplication in a winter crane fly. Genome Biol. Evol. 2012, 4, 89–101. [Google Scholar] [CrossRef] [PubMed]
  36. Gai, Y.; Song, D.; Sun, H.; Yang, Q.; Zhou, K. The complete mitochondrial genome of Symphylella sp. (Myriapoda: Symphyla): Extensive gene order rearrangement and evidence in favor of Progoneata. Mol. Phylogenet. Evol. 2008, 49, 574–585. [Google Scholar] [CrossRef] [PubMed]
  37. Kong, X.; Dong, X.; Zhang, Y.; Shi, W.; Wang, Z.; Yu, Z. A novel rearrangement in the mitochondrial genome of tongue sole, Cynoglossus semilaevis: Control region translocation and a tRNA gene inversion. Genome 2009, 52, 975–984. [Google Scholar] [PubMed]
  38. Shi, W.; Dong, X.L.; Wang, Z.M.; Miao, X.G.; Wang, S.Y.; Kong, X.Y. Complete mitogenome sequences of four flatfishes (Pleuronectiformes) reveal a novel gene arrangement of L-strand coding genes. BMC Evol. Biol. 2013. [Google Scholar] [CrossRef] [PubMed]
  39. Nelson, J.S. Fishes of the World, 4th ed.; John Wiley and Sons: New York, NY, USA, 2006. [Google Scholar]
  40. Thacker, C.E. Molecular phylogeny of the gobioid fishes (Teleostei: Perciformes: Gobioidei). Mol. Phylogenet. Evol. 2003, 26, 354–368. [Google Scholar] [CrossRef]
  41. Zander, C.D. Morphological adaptations to special environments of gobies. In The Biology of Gobies; Patzner, R.A., van Tassell, J.L., Kovačić, M., Kapoor, B.G., Eds.; Science Publishers: Enfield, NH, USA, 2011; pp. 345–366. [Google Scholar]
  42. Thacker, C.E.; Hardman, M.A. Molecular phylogeny of basal gobioid fishes: Rhyacichthyidae, Odontobutidae, Xenisthmidae, Eleotridae (Teleostei: Perciformes: Gobioidei). Mol. Phylogenet. Evol. 2005, 37, 858–871. [Google Scholar] [CrossRef] [PubMed]
  43. Iwata, A. Systematics of Odontobutidae. In The Biology of Gobies; Patzner, R.A., van Tassell, J.L., Kovačić, M., Kapoor, B.G., Eds.; Science Publishers: Enfield, NH, USA, 2011; pp. 61–77. [Google Scholar]
  44. Agorreta, A.; San Mauro, D.; Schliewen, U.; van Tassell, J.L.; Kovačić, M.; Zardoya, R.; Rüber, L. Molecular phylogenetics of Gobioidei and phylogenetic placement of European gobies. Mol. Phylogenet. Evol. 2013, 69, 619–633. [Google Scholar] [CrossRef] [PubMed]
  45. Agorreta, A.; Rüber, L. A standardized reanalysis of molecular phylogenetic hypotheses of Gobioidei. Syst. Biodivers. 2012, 10, 375–390. [Google Scholar] [CrossRef]
  46. Hoese, D.F.; Gill, A.C. Phylogenetic relationships of eleotridid fishes (Perciformes: Gobioidei). Bull. Mar. Sci. 1993, 52, 415–440. [Google Scholar]
  47. Miller, P.J. The osteology and adaptive features of Rhyacichthys aspro (Teleostei: Gobioidei) and the higher classification of gobioid fishes. J. Zool. 1973, 171, 397–434. [Google Scholar] [CrossRef]
  48. Wang, H.Y.; Tsai, M.P.; Dean, J.; Lee, S.C. Molecular phylogeny of gobioid fishes (Perciformes: Gobioidei) based on mitochondrial 12S rRNA sequences. Mol. Phylogenet. Evol. 2001, 20, 390–408. [Google Scholar] [CrossRef] [PubMed]
  49. Thacker, C.E. Phylogeny of Gobioidei and placement within Acanthomorpha, with a new classification and investigation of diversification and character evolution. Copeia 2009, 1, 93–104. [Google Scholar] [CrossRef]
  50. Tornabene, L.; Chen, Y.; Pezold, F. Gobies are deeply divided: Phylogenetic evidence from nuclear DNA (Teleostei: Gobioidei: Gobiidae). Syst. Biodivers. 2013, 11, 345–361. [Google Scholar] [CrossRef]
  51. Iwata, A.; Kobayashi, T.; Ikeo, K.; Imanishi, T.; Ono, H.; Umehara, Y.; Hamamatsu, C.; Ikeda, Y.; Sugiyama, K.; Sakamoto, K.; et al. Evolutionary aspects of gobioid fishes based upon a phylogenetic analysis of mitochondrial cytochrome b genes. Gene 2000, 259, 5–15. [Google Scholar]
  52. Ren, G.; Zhang, Q. Molecular phylogeny of the genus Odontobutis based upon partial sequences of mitochondrial 12S rRNA genes. Acta Hydrobiol. Sin. 2007, 31, 473–478. (In Chinese) [Google Scholar]
  53. Ki, J.S.; Jung, S.O.; Hwang, D.S.; Lee, Y.M.; Lee, J.S. Unusual mitochondrial genome structure of the freshwater goby Odontobutis platycephala: Rearrangement on tRNAs and an additional non-coding region. J. Fish Biol. 2008, 73, 414–428. [Google Scholar] [CrossRef]
  54. Zang, X.; Wang, X.; Zhang, G.; Wang, Y.; Ding, Y.; Yin, S. Complete mitochondrial genome and phylogenic analysis of Odontobutis yaluensis, Perciformes, Odontobutidae. Mitochondrial DNA 2014. [Google Scholar] [CrossRef]
  55. Jin, X.X.; Sun, Y.N.; Wang, R.X.; Tang, D.; Zhao, S.L.; Xu, T.J. Chracteristics and phylogenetic analysis of mitochondrial genome in the gobies. Hereditas (Beijing) 2013, 35, 1391–1402. (In Chinese) [Google Scholar] [CrossRef]
  56. Ma, Z.; Yang, X.; Zhang, X.; Yang, R. Complete mitochondrial genome of the freshwater goby Odontobutis potamophila (Perciformes: Odontobutidae). Mitochondrial DNA 2013, 26, 299–300. [Google Scholar] [CrossRef] [PubMed]
  57. Ma, Z.; Yang, X.; Zhang, X.; Yang, R.; Qiu, P. Organization of the mitochondrial genome of Odontobutis sinensis (Perciformes: Odontobutidae): Rearrangement of tRNAs and additional non-coding regions. Mitochondrial DNA 2013, 26, 327–328. [Google Scholar] [CrossRef] [PubMed]
  58. Iwasaki, W.; Fukunaga, T.; Isagozawa, R.; Yamada, K.; Maeda, Y.; Sado, T.; Mabuchi, K.; Takeshima, H.; Miya, M.; Nishida, M. MitoFish and MitoAnnotator: A mitochondrial genome database of fish with an accurate and automatic annotation pipeline. Mol. Biol. Evol. 2013, 30, 2531–2540. [Google Scholar] [CrossRef] [PubMed]
  59. Bachtrog, D. Reduced selection for codon usage bias in Drosophila miranda. J. Mol. Evol. 2007, 64, 586–590. [Google Scholar] [CrossRef] [PubMed]
  60. Ojala, D.; Montoya, J.; Attardi, G. tRNA punctuation model of RNA processing in human mitochondria. Nature 1981, 290, 470–474. [Google Scholar] [CrossRef] [PubMed]
  61. Quan, X.; Jin, X.; Sun, Y. The complete mitochondrial genome of Lophiogobius ocellicauda (Perciformes, Gobiidae). Mitochondrial DNA 2013, 25, 95–97. [Google Scholar] [CrossRef] [PubMed]
  62. Kim, I.C.; Kweon, H.S.; Kim, Y.J.; Kim, C.B.; Gye, M.C.; Lee, W.O.; Lee, Y.S.; Lee, J.S. The complete mitochondrial genome of the javeline goby Acanthogobius hasta (Perciformes, Gobiidae) and phylogenetic considerations. Gene 2004, 336, 147–153. [Google Scholar] [CrossRef] [PubMed]
  63. Broughton, R.E.; Milam, J.E.; Roe, B.A. The complete sequence of the zebrafish (Danio rerio) mitochondrial genome and evolutionary patterns in vertebrate mitochondrial DNA. Genome Res. 2001, 11, 1958–1967. [Google Scholar] [PubMed]
  64. Lu, H.F.; Su, T.J.; Luo, A.R.; Zhu, C.D.; Wu, C.S. Characterization of the complete mitochondrion genome of diurnal moth Amata emma (Butler) (Lepidoptera: Erebidae) and its phylogenetic implications. PLoS ONE 2013, 8, e72410. [Google Scholar] [CrossRef] [PubMed]
  65. Grantham, R.; Gautier, C.; Gouy, M. Codon catalog usage and the genome hypothesis. Nucleic Acids Res. 1980, 8, r49–r62. [Google Scholar] [CrossRef] [PubMed]
  66. Meganathan, P.R.; Pagan, H.J.T.; McCulloch, E.S.; Stevens, R.D.; Ray, D.A. Complete mitochondrial genome sequences of three bats species and whole genome mitochondrial analyses reveal patterns of codon bias and lend support to a basal split in Chiroptera. Gene 2012, 492, 121–129. [Google Scholar] [CrossRef] [PubMed]
  67. Fischer, C.; Koblmüller, S.; Gülly, C.; Schlötterer, C.; Sturmbauer, C.; Thallinger, G.G. Complete mitochondrial DNA sequences of the threadfin cichlid (Petrochromis trewavasae) and the blunthead cichlid (Tropheus moorii) and patterns of mitochondrial genome evolution in cichlid fishes. PLoS ONE 2013, 8, e67048. [Google Scholar] [CrossRef] [PubMed]
  68. Crozier, R.H.; Crozier, Y.C. The mitochondrial genome of the honeybee Apis mellifera: Complete sequence and genome organization. Genetics 1993, 133, 97–117. [Google Scholar] [PubMed]
  69. Chai, H.N.; Du, Y.Z. The complete mitochondrial genome of the pink stem borer, Sesamia inferens, in comparison with four other noctuid moths. Int. J. Mol. Sci. 2012, 13, 10236–10256. [Google Scholar] [CrossRef] [PubMed]
  70. Zhao, G.; Li, H.; Zhao, P.; Cai, W. Comparative mitogenomics of the assassin bug genus Peirates (Hemiptera: Reduviidae: Peiratinae) reveal conserved mitochondrial genome organization of P. atromaculatus, P. fulvescens and P. turpis. PLoS ONE 2015, 10, e0117862. [Google Scholar] [CrossRef] [PubMed]
  71. Yang, Z.; Nielsen, R. Estimating synonymous and nonsynonymous substitution rates under realistic evolutionary models. Mol. Biol. Evol. 2000, 17, 32–43. [Google Scholar] [CrossRef] [PubMed]
  72. Sun, Y.B.; Shen, Y.Y.; Irwin, D.M.; Zhang, Y.P. Evaluating the roles of energetic functional constraints on teleost mitochondrial-encoded protein evolution. Mol. Biol. Evol. 2011, 28, 39–44. [Google Scholar] [CrossRef] [PubMed]
  73. Levinson, G.; Gutman, G.A. Slipped-strand mispairing: A major mechanism for DNA sequence evolution. Mol. Biol. Evol. 1987, 4, 203–221. [Google Scholar] [PubMed]
  74. Moritz, C.; Brown, W.M. Tandem duplications in animal mitochondrial DNAs: Variation in incidence and gene content among lizards. Proc. Natl. Acad. Sci. USA 1987, 84, 7183–7187. [Google Scholar] [CrossRef] [PubMed]
  75. Miya, M.; Kawaguchi, A.; Nishida, M. Mitogenomic exploration of higher teleostean phylogenies: A case study for moderate-scale evolutionary genomics with 38 newly determined complete mitochondrial DNA sequences. Mol. Biol. Evol. 2001, 18, 1993–2009. [Google Scholar] [CrossRef] [PubMed]
  76. Chen, I.S.; Kottelat, M.; Wu, H.L. A new genus of freshwater sleeper (Teleostei: Odontobutididae) from southern China and mainland Southeast Asia. J. Fish. Soc. Taiwan 2002, 29, 229–235. [Google Scholar]
  77. Wu, H.L.; Chen, I.S.; Chong, D.H. A new species of the genus Odontobutis (Pesces, Odontobutidae) from China. J. Shanghai Fish. Univ. 2002, 11, 6–13. (In Chinese) [Google Scholar]
  78. Li, Y.H.; Wang, W.M.; Liu, X.L.; Luo, W.; Zhang, J.; Gui, Y. DNA extraction from crayfish exoskeleton. Indian J. Exp. Biol. 2011, 49, 953–957. [Google Scholar] [PubMed]
  79. Wyman, S.K.; Jansen, R.K.; Boore, J.L. Automatic annotation of organellar genomes with DOGMA. Bioinformatics 2004, 20, 3253–3255. [Google Scholar] [CrossRef] [PubMed]
  80. Lower, T.M.; Eddy, S.R. tRNAscan-SE: A program for improved detection of transfer RNA genes in genome sequence. Nucleic Acids Res. 1997, 25, 955–964. [Google Scholar]
  81. Larkin, M.A.; Blackshields, G.; Brown, N.P.; Chenna, R.; McGettigan, P.A.; McWillian, I.M.; Wilm, A.; Lopez, R.; Thompsom, J.D.; Gibson, T.J.; et al. Clustal W and Clustal X version 2.0. Bioinformatics 2007, 23, 2947–2948. [Google Scholar] [CrossRef] [PubMed]
  82. Benson, G. Tandem repeats finder: A program to analyze DNA sequences. Nucleic Acids Res. 1999, 27, 573–580. [Google Scholar] [CrossRef] [PubMed]
  83. Tamura, K.; Peterson, D.; Peterson, N.; Stecher, G.; Nei, M.; Kumar, S. MEGA 5: Molecular evolutionary genetics analysis using maximum likelihood, evolutionary distance, and maximum parsimony methods. Mol. Biol. Evol. 2011, 28, 2731–2739. [Google Scholar] [CrossRef] [PubMed]
  84. Perna, N.T.; Kocher, T.D. Patterns of nucleotide composition of four fold degenerate sites of animal mitochondrial genomes. J. Mol. Evol. 1995, 41, 353–358. [Google Scholar] [CrossRef] [PubMed]
  85. Librado, P.; Rozas, J. DnaSP v5: A software for comprehensive analysis of DNA polymorphism data. Bioinformatics 2009, 25, 1451–1452. [Google Scholar] [CrossRef] [PubMed]
  86. Stamatakis, A.; Hoover, P.; Rougemont, J. A rapid bootstrap algorithm for the RAxML Web-Servers. Syst. Biol. 2008, 75, 758–771. [Google Scholar] [CrossRef] [PubMed]
  87. Huelsenbeck, J.P.; Ronquist, F. MRBAYES: Bayesian inference of phylogenetic trees. Bioinformatics 2001, 17, 754–755. [Google Scholar] [CrossRef] [PubMed]
  88. Rambaut, A. FigTree, a graphical viewer of phylogenetic trees. Available online: http://tree.bio.ed.ac.uk/software/figtree (accesse on 24 July 2015).

