Article

Leptin Genes in Blunt Snout Bream: Cloning, Phylogeny and Expression Correlated to Gonads Development

1
College of Fisheries, Key Lab of Agricultural Animal Genetics, Breeding and Reproduction of Ministry of Education/Key Lab of Freshwater Animal Breeding, Ministry of Agriculture, Huazhong Agricultural University, Wuhan 430070, China
2
Freshwater Aquaculture Collaborative Innovation Center of Hubei Province, Wuhan 430070, China
3
Hubei Bai Rong Improved Aquatic Seed Co., Ltd., Huanggang 438800, China
*
Author to whom correspondence should be addressed.
Int. J. Mol. Sci. 2015, 16(11), 27609-27624; https://0-doi-org.brum.beds.ac.uk/10.3390/ijms161126044
Submission received: 15 September 2015 / Revised: 19 October 2015 / Accepted: 28 October 2015 / Published: 18 November 2015
(This article belongs to the Special Issue Fish Molecular Biology)

Abstract

:
To investigate the leptin related genes expression patterns and their possible function during the gonadal development in fish, the cDNA and genomic sequences of leptin, leptin receptor (leptinR), and leptin receptor overlapping transcript like-1 (leprotl1) were cloned and their expression levels were quantified in the different gonadal development stages of Megalobrama amblycephala. The results showed that the full length cDNA sequences of leptin, leptinR and leprotl1 were 953, 3432 and 1676 bp, coding 168, 1082, and 131 amino acid polypeptides, and the genomic sequences were 1836, 28,528 and 5480 bp, which respectively had 3, 15 and 4 exons, respectively. The phylogenetic analysis revealed that three genes were relatively conserved in fish species. Quantitative real-time PCR results showed that the three genes were ubiquitously expressed in all examined tissues during the different gonadal development stages. The leptin and leptinR took part in the onset of puberty, especially in female M. amblycephala, by increasing the expression levels in brain during the stage I to III of ovary. The expression levels of leptin and leptinR had significant differences between male and female in hypothalamic-pituitary-gonadal (HPG) axis tissues (p < 0.05). The leptinR had the same variation tendency with leptin, but the opposite changes of expression levels were found in leprotl1, which may resist the expression of leptinR for inhibiting the function of leptin in target organ. These findings revealed details about the possible role of these genes in regulating gonadal maturation in fish species.

1. Introduction

Leptin, a hormone mainly secreted by fat, is the protein product of the obese gene (OB) and belongs to the type I cytokine family. Since Zhang [1] successfully cloned OB gene in mice by positional cloning technologies, many studies had been conducted on Leptin orthologous [2,3]. As to teleosts, leptin gene was firstly characterized in pufferfish (Takifugu rubripes) [4]. Subsequent identifications of leptin had been reported in other fish species, including goldfish (Carassius auratus) [5], common carp (Cyprinus carpio) [6], rainbow trout (Oncorhynchus mykiss) [7], zebrafish (Danio rerio) [8], grass carp (Ctenopharyngodon idella), silver carp (Hypophthalmichthys molitrix) [9], and yellow catfish (Pelteobagrus fulvidraco) [10]. Leptin receptor (leptinR) could mediate the physiological actions of leptin through associating with membrane, so it is necessary to analyze the leptinR to know the physiological role of leptin in fish. Right now, leptinR of many fish species have been identified, including zebrafish (D. rerio) [11], puffer fish (T. rubripes) [12], Japanese medaka (Oryzias latipes) [13] and crucian carp (C. auratus) [14]. As to leptin receptor overlapping transcript gene (leprot), it shares the first and second exons with leptinR in human, and had been suggested that both leptinR and leprot were under control of a single promoter and encoded by a single gene [15]. However, Kurokawa et al. [12] suggested that leptinR and leprotl of pufferfish were homologous genes with human leptinR and leprotl, but pufferfish leptinR and leprotl were not located sequentially on the same chromosome. Kurokawa and Murashita [13] also found that leptinR and leprotl were encoded by separate genes in medaka (Oryzias latipes). Generally, the information about fish leprotl was relatively scanty.
Although the function of leptin has been explored extensively in mammals, its role in fish is far from fully understood. Most studies about the physiological role of leptin had been focused on its function in appetite [16], body weight regulation [5] and metabolism [17] in teleosts. As in many mammalian species, the nutritional status of an individual is important for initiation of sexual maturation in teleosts [18]. However, few researches had considered the possible role of leptin in teleost reproduction [18,19]. In a previous study, Peyon [20] demonstrated that recombinant mouse leptin stimulated basal release of luteinizing hormone (LH) in sea bass (Dicentrarchus labrax) pituitary cell culture in the late pre-pubertal, early post-pubertal and adult stages. In an in vitro study on female rainbow trout (Oncorhynchus mykiss), leptin protein, directly stimulated follicle-stimulating hormone (FSH) and LH release by acting at the level of the pituitary [21]. Trombley and Schmitz [18] had proved that leptin had a possible physiological role during sexual maturation in male Atlantic salmon (Salmo salar). As to the leptinR and leprotl1, few studies have been conducted to investigate their possible role in fish maturation and expression correlation with leptin gene.
Blunt snout bream (Megalobrama amblycephala) is naturally habited in inland lakes along the Yangtze River. Due to its desirable qualities for aquaculture such as herbivorous feeding habit, general hardiness, resistance to disease, good seinability and reproductive performance, M. amblycephala has been recognized as one of the main freshwater aquaculture species since the 1960s in China. Recently, its total production is enormously and vigorously growing [22]. However, after domestication of blunt snout bream since the 1960s, germplasm resources of this bream are under threat of recession and mixture due to its artificial breeding. In a cultured M. amblycephala population, early sexual maturity was found at one year old, which was normally reached by two or three years of age in natural populations [23]. In this study, we isolated and characterized the leptin, leptinR and leprotl1 genes of M. amblycephala and detected their expression patterns during different gonadal developmental stages to investigate the relationships between these three genes and fish maturation.

2. Results

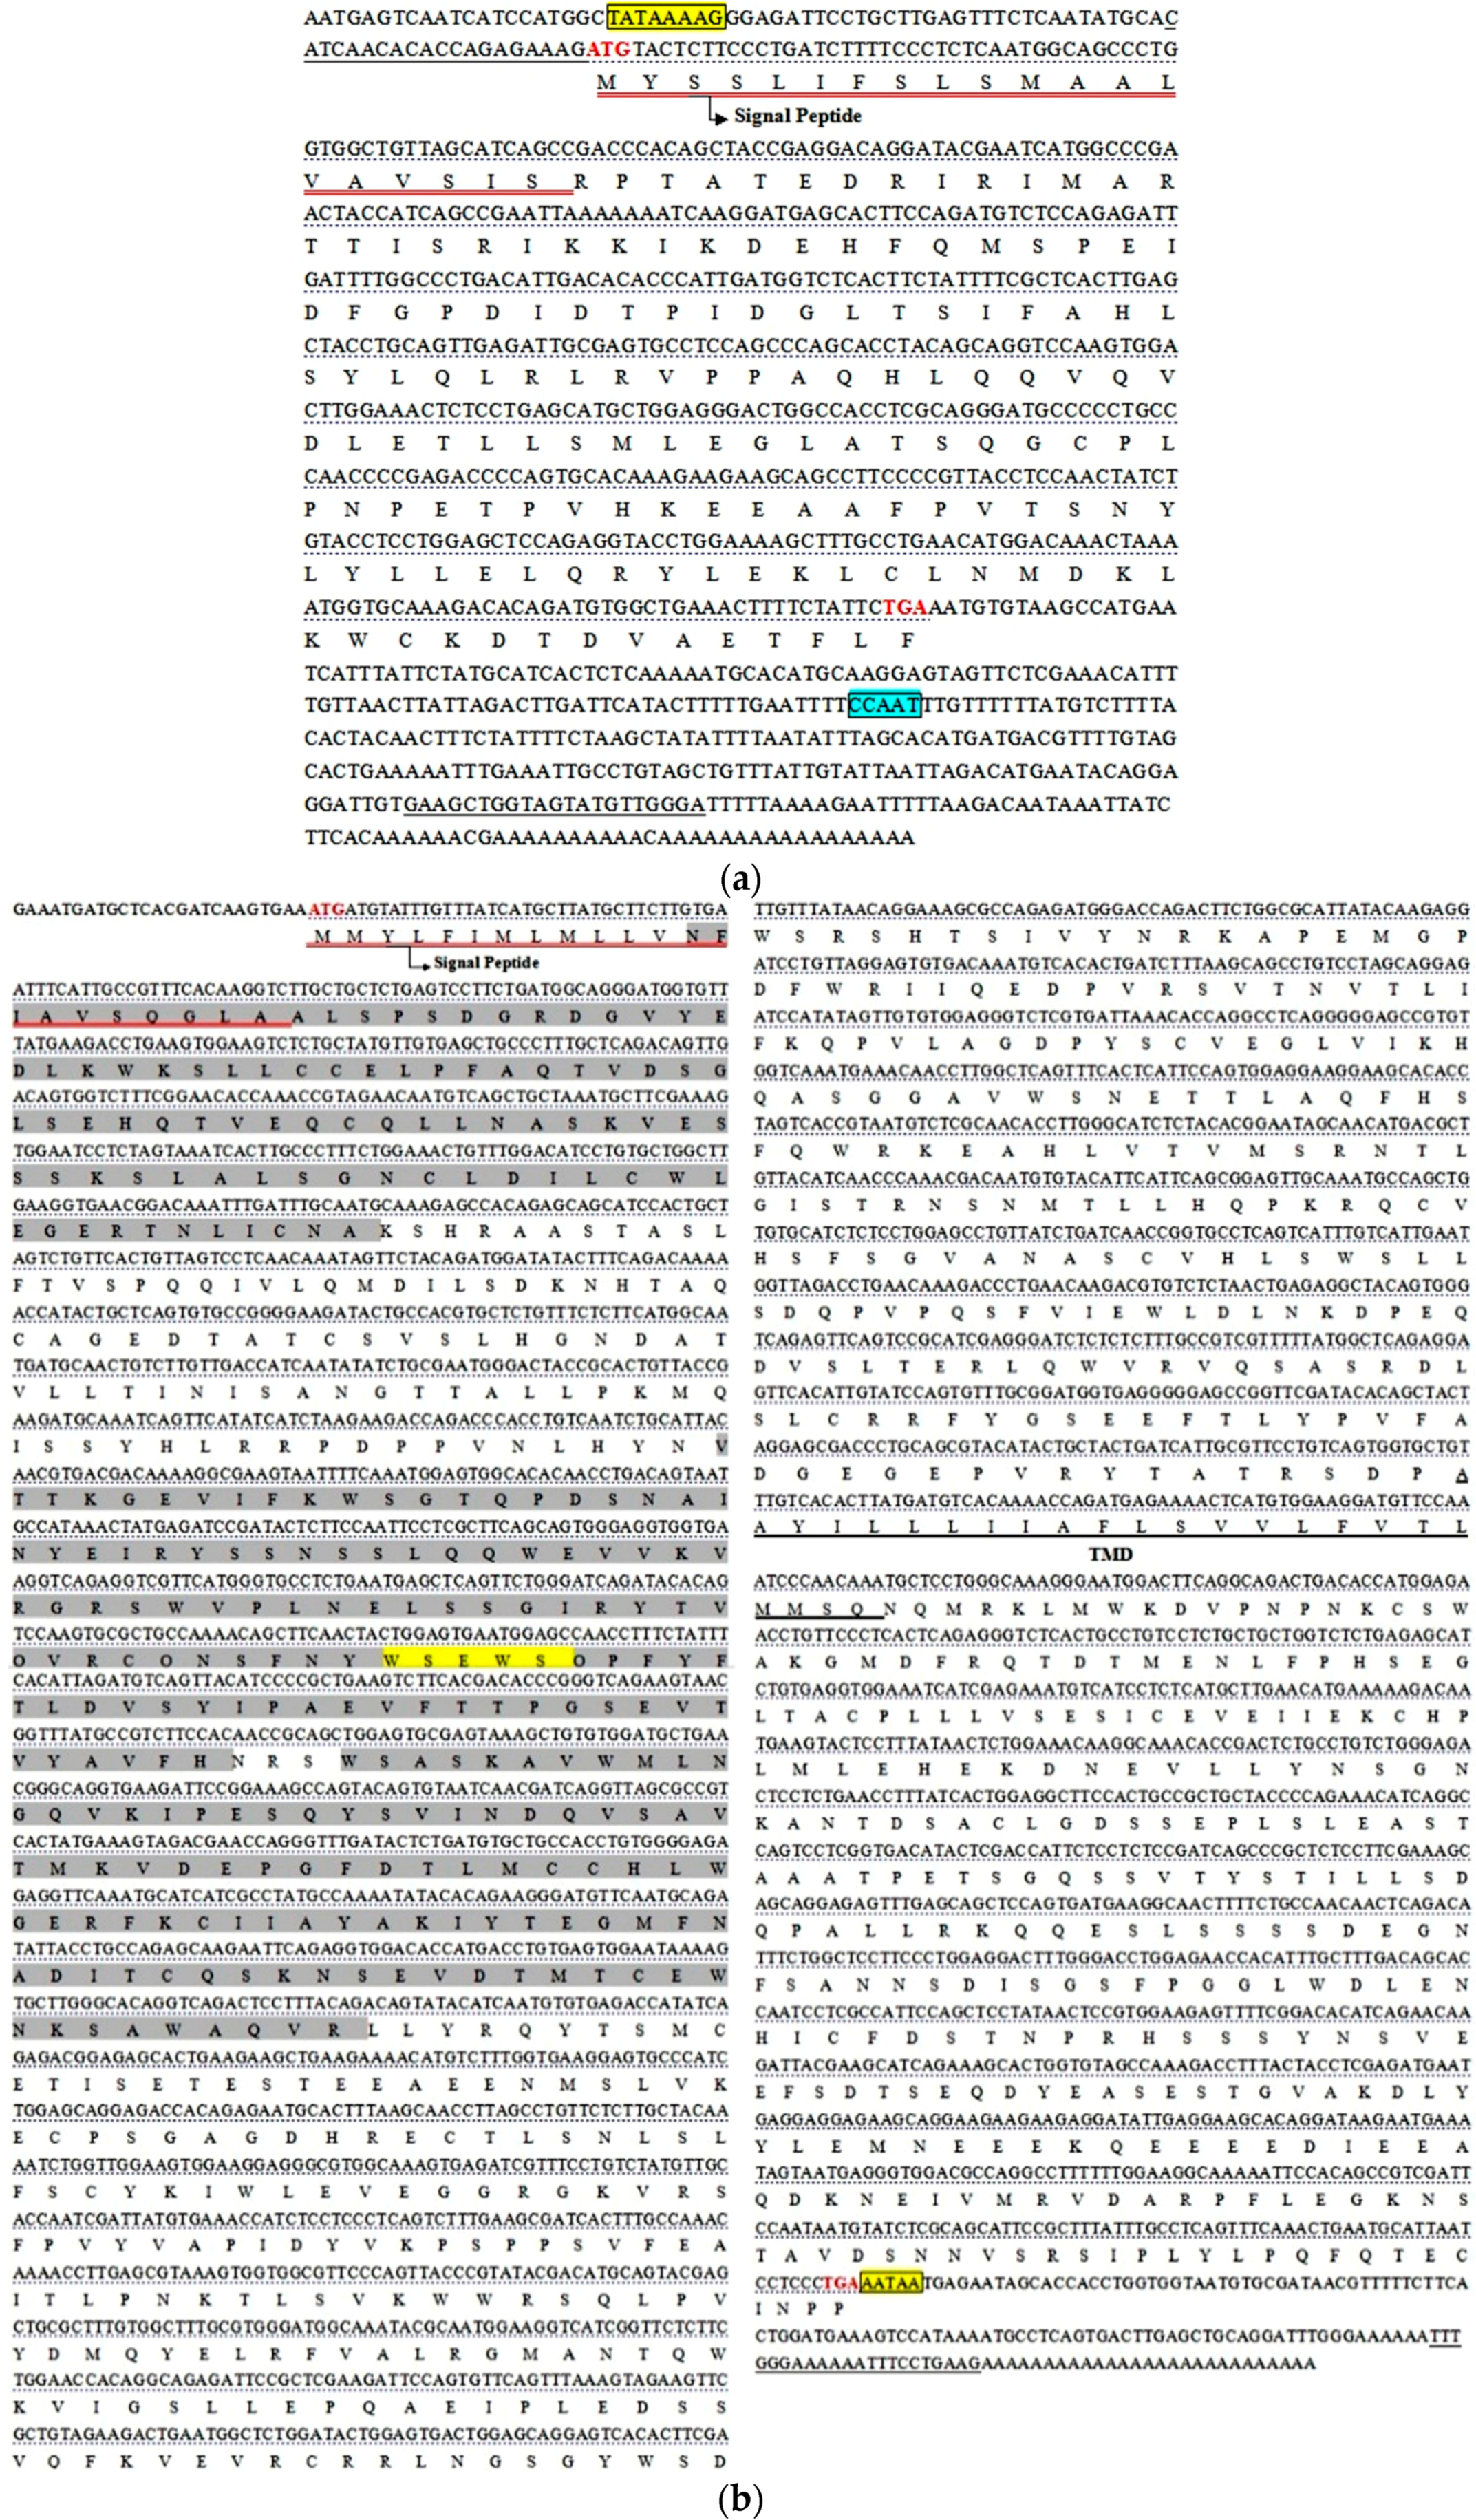
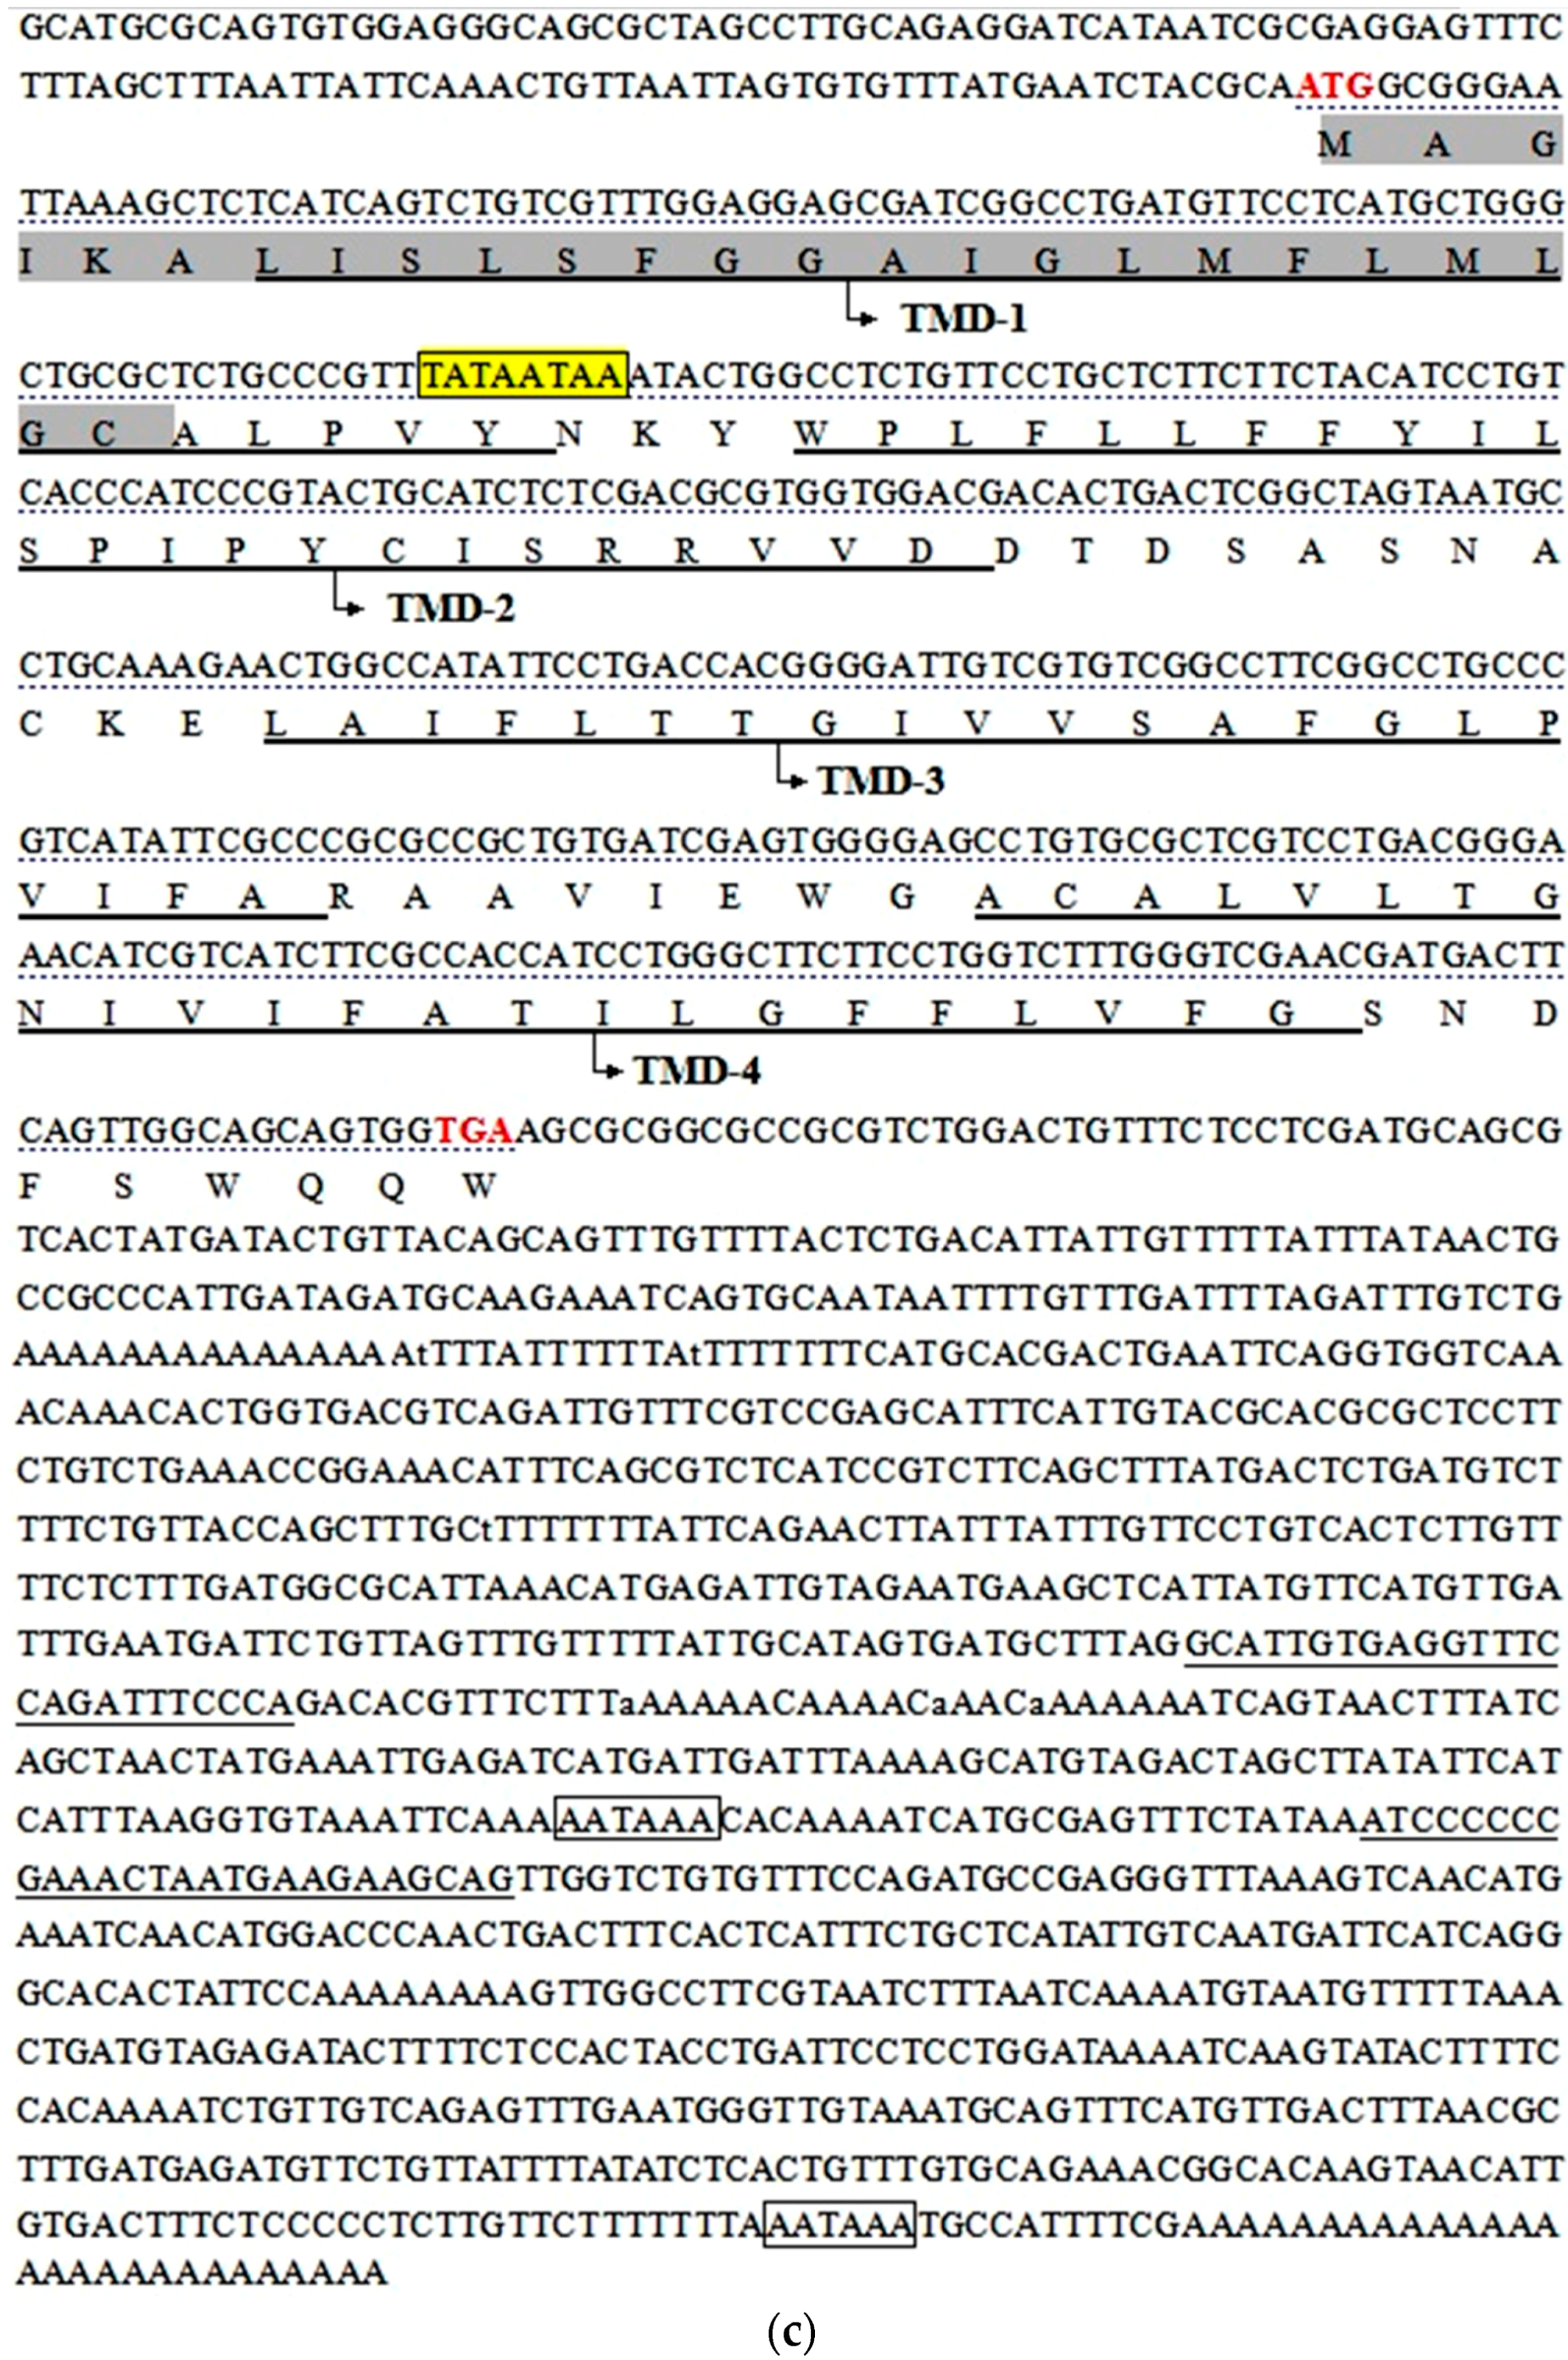
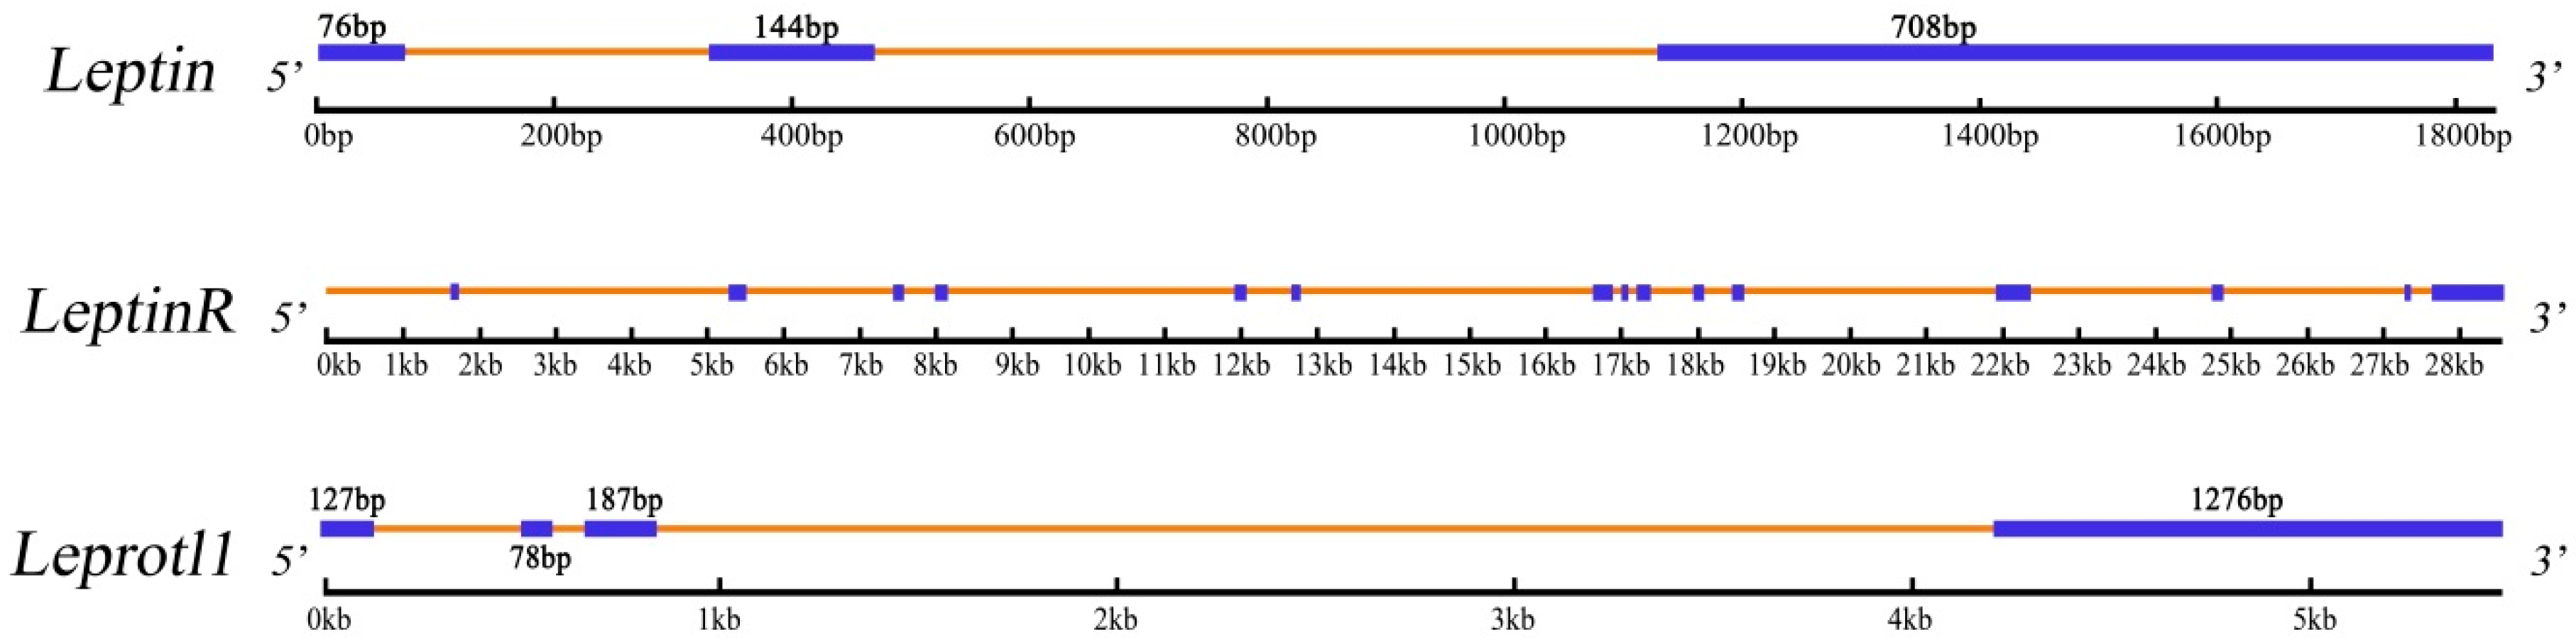
2.1. Identification and Characterization of Three Genes

The full length cDNA sequences of leptin, leptinR, and leprotl1 of M. amblycephala were 953, 3432 and 1676 bp, coding 168, 1082, and 131 amino acid polypeptides, respectively. The genomic sequences of leptin, leptinR, and leprotl1 genes were 1836, 28,528 and 5480 bp, which respectively had 3, 15 and 4 exons. The basic characterizations of these three genes were showed in Table 1. The regulating elements of TATA box and C/EBP binding sequence were found from the upstream 52 bp of the promoter in leptin 5′ flanking region. In leptinR, there was a splice site at 18th aa. The conserved structures and the basic characteristics of the three genes were showed in Figure 1. The exon and intron domains were identified by comparing the full-length cDNA sequences with their whole genomic sequences, and the results were showed in Figure 2.
Figure 1. Nucleotide and deduced amino acid sequences of M. amblycephala leptin (a); leptinR (b); and leprotl1 (c). The open reading frame (ORF) were underlined; the start and stop codons were bold and red; the signal peptide sequence were red underlined and marked; the transmembrane domains were underlined and marked with transmembrane domain (TMD); the conserved site sequences were boxed and shaded; the deduced amino acid sequences of fibronectin type-III domain profiles of leptinR were filled in gray and a conserved motif (WSXWS) in leptinR was boxed and shaded; predicted amino acid sequence of prokaryotic membrane lipoprotein lipid attachment site profiles in leprotl1 were filled in gray. The TATA boxes and conservative motif have been highlighted in yellow, the transcription factor “CCAAT” was marked in blue.
Ijms 16 26044 g001aIjms 16 26044 g001b
Table 1. The basic characterizations of three genes in M. amblycephala.
Target GeneLeptinLeptinRLeprotl1
cDNA length95334321676
5’-Untranslated Region (UTR)8125111
Open Reading Frame (ORF)5143249396
ORF Encoding aa1681082131
3’-UTR3711581169
GeneBank No.KJ 193854KJ 193855KJ 193853
CpG Island041
Transmembrane Domain (TMD)014
Signal Peptide110
Fibronectin type-III domain 030
Genome Length (bp)183628,5285480
Exon3154
GeneBank No.KP 269244KP 269245KP 269246
Figure 2. The whole genome of M. amblycephala leptin, leptinR and leprotl1 were shown with predicted coding exons and introns with their length. The exons were represented by blue threads and introns were represented by yellow threads.
Ijms 16 26044 g002

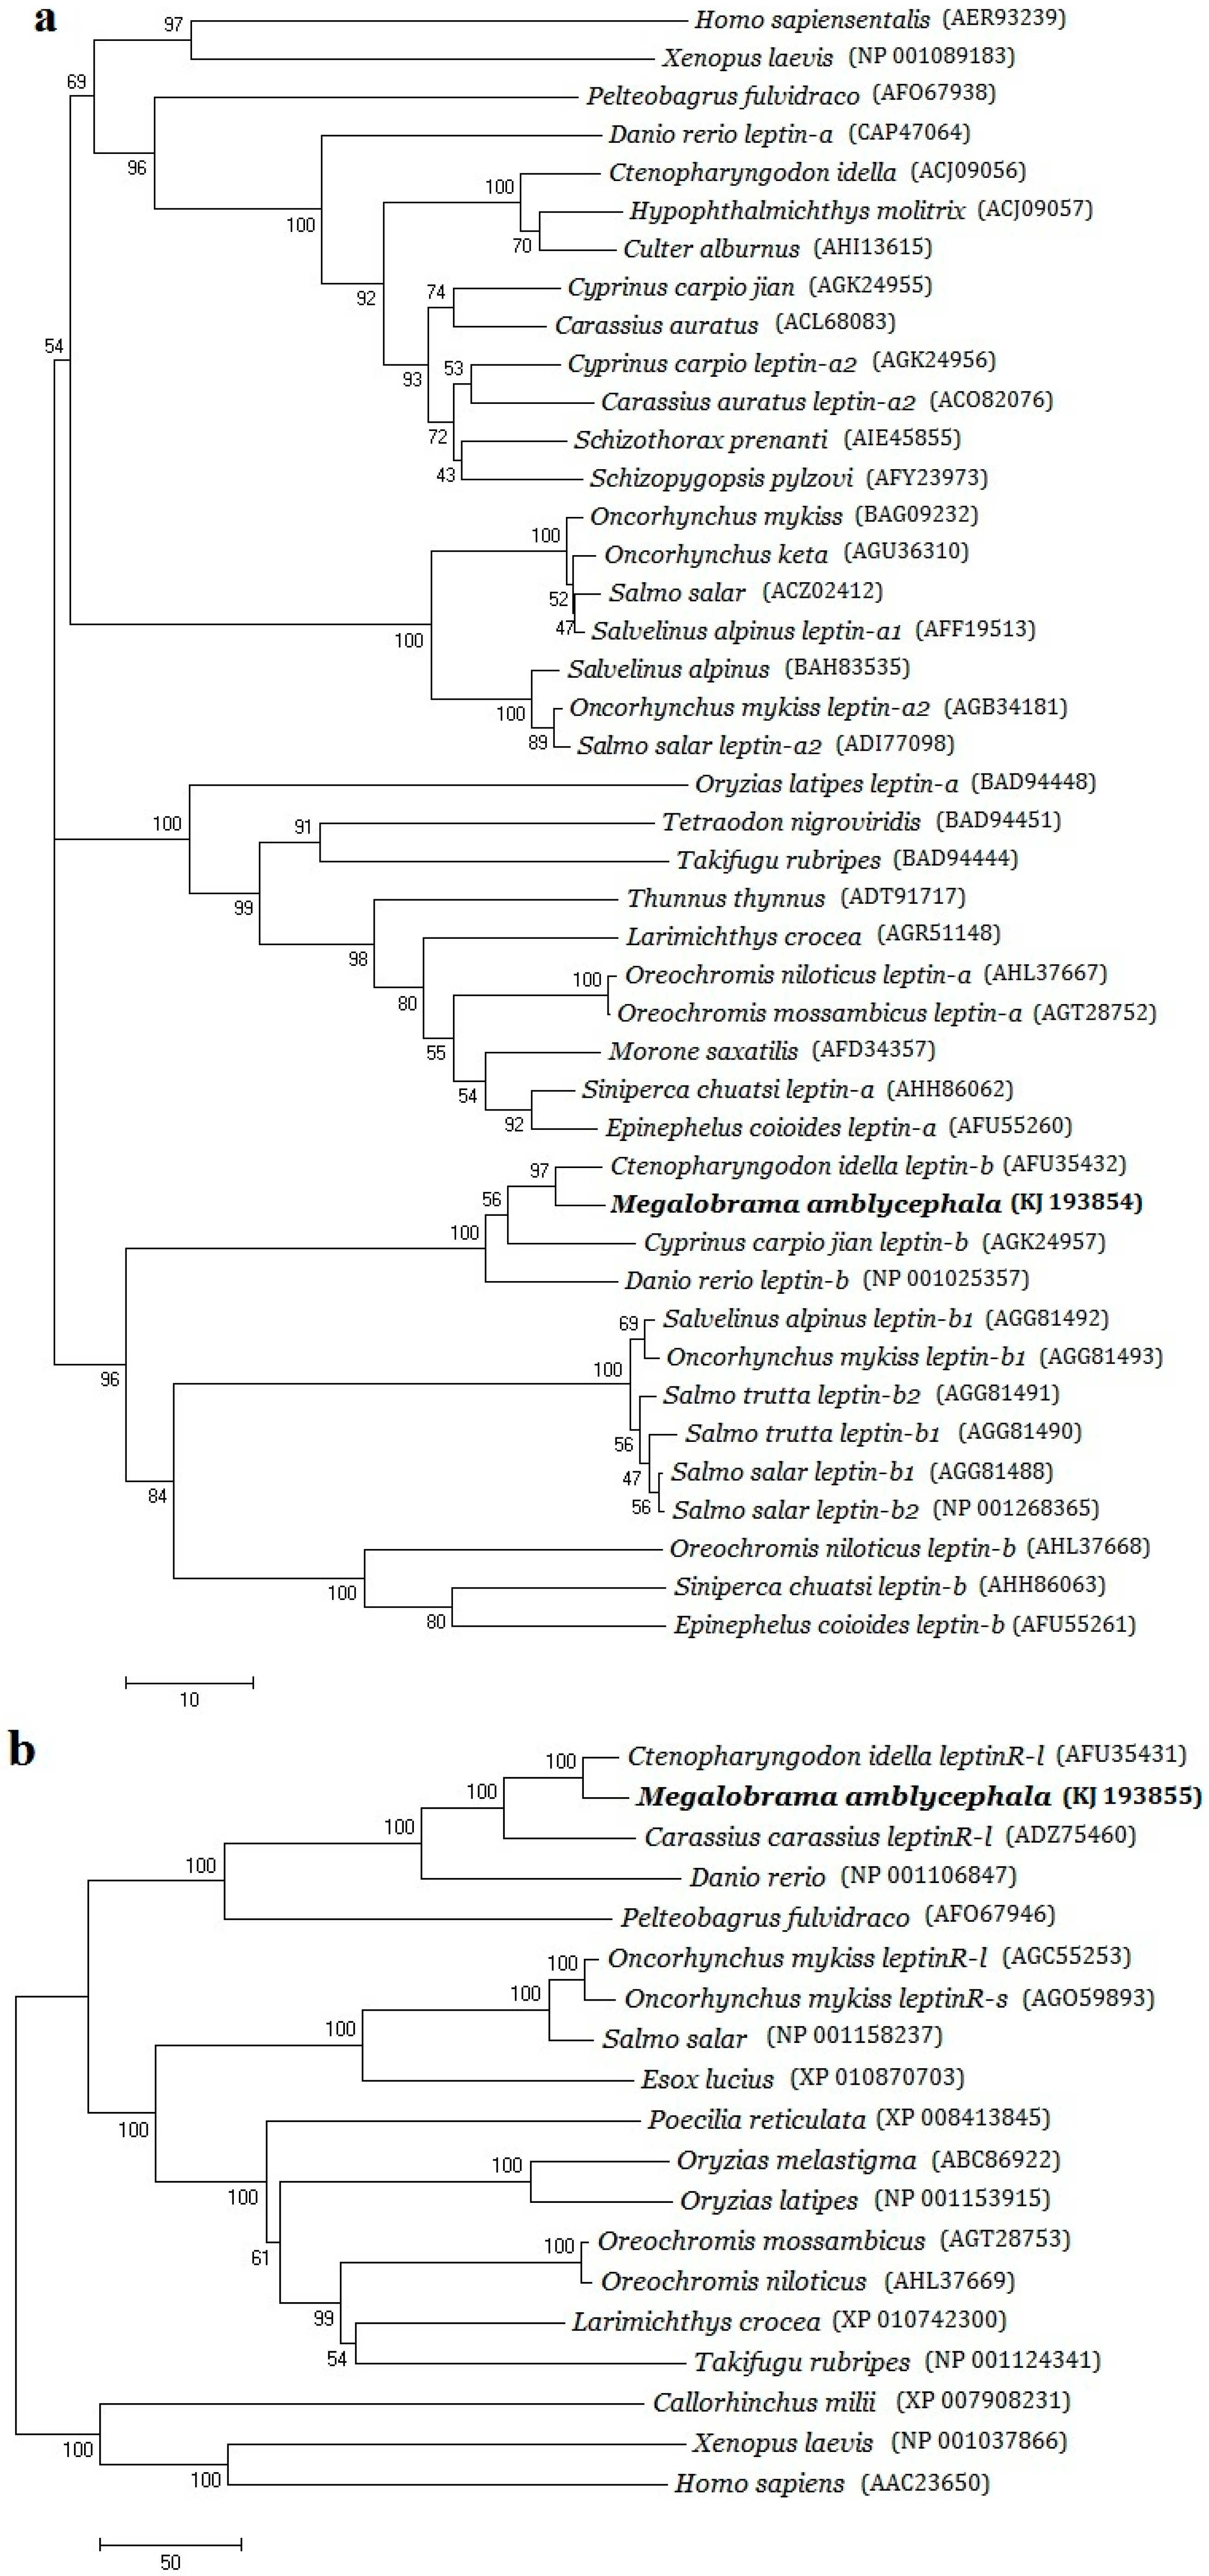
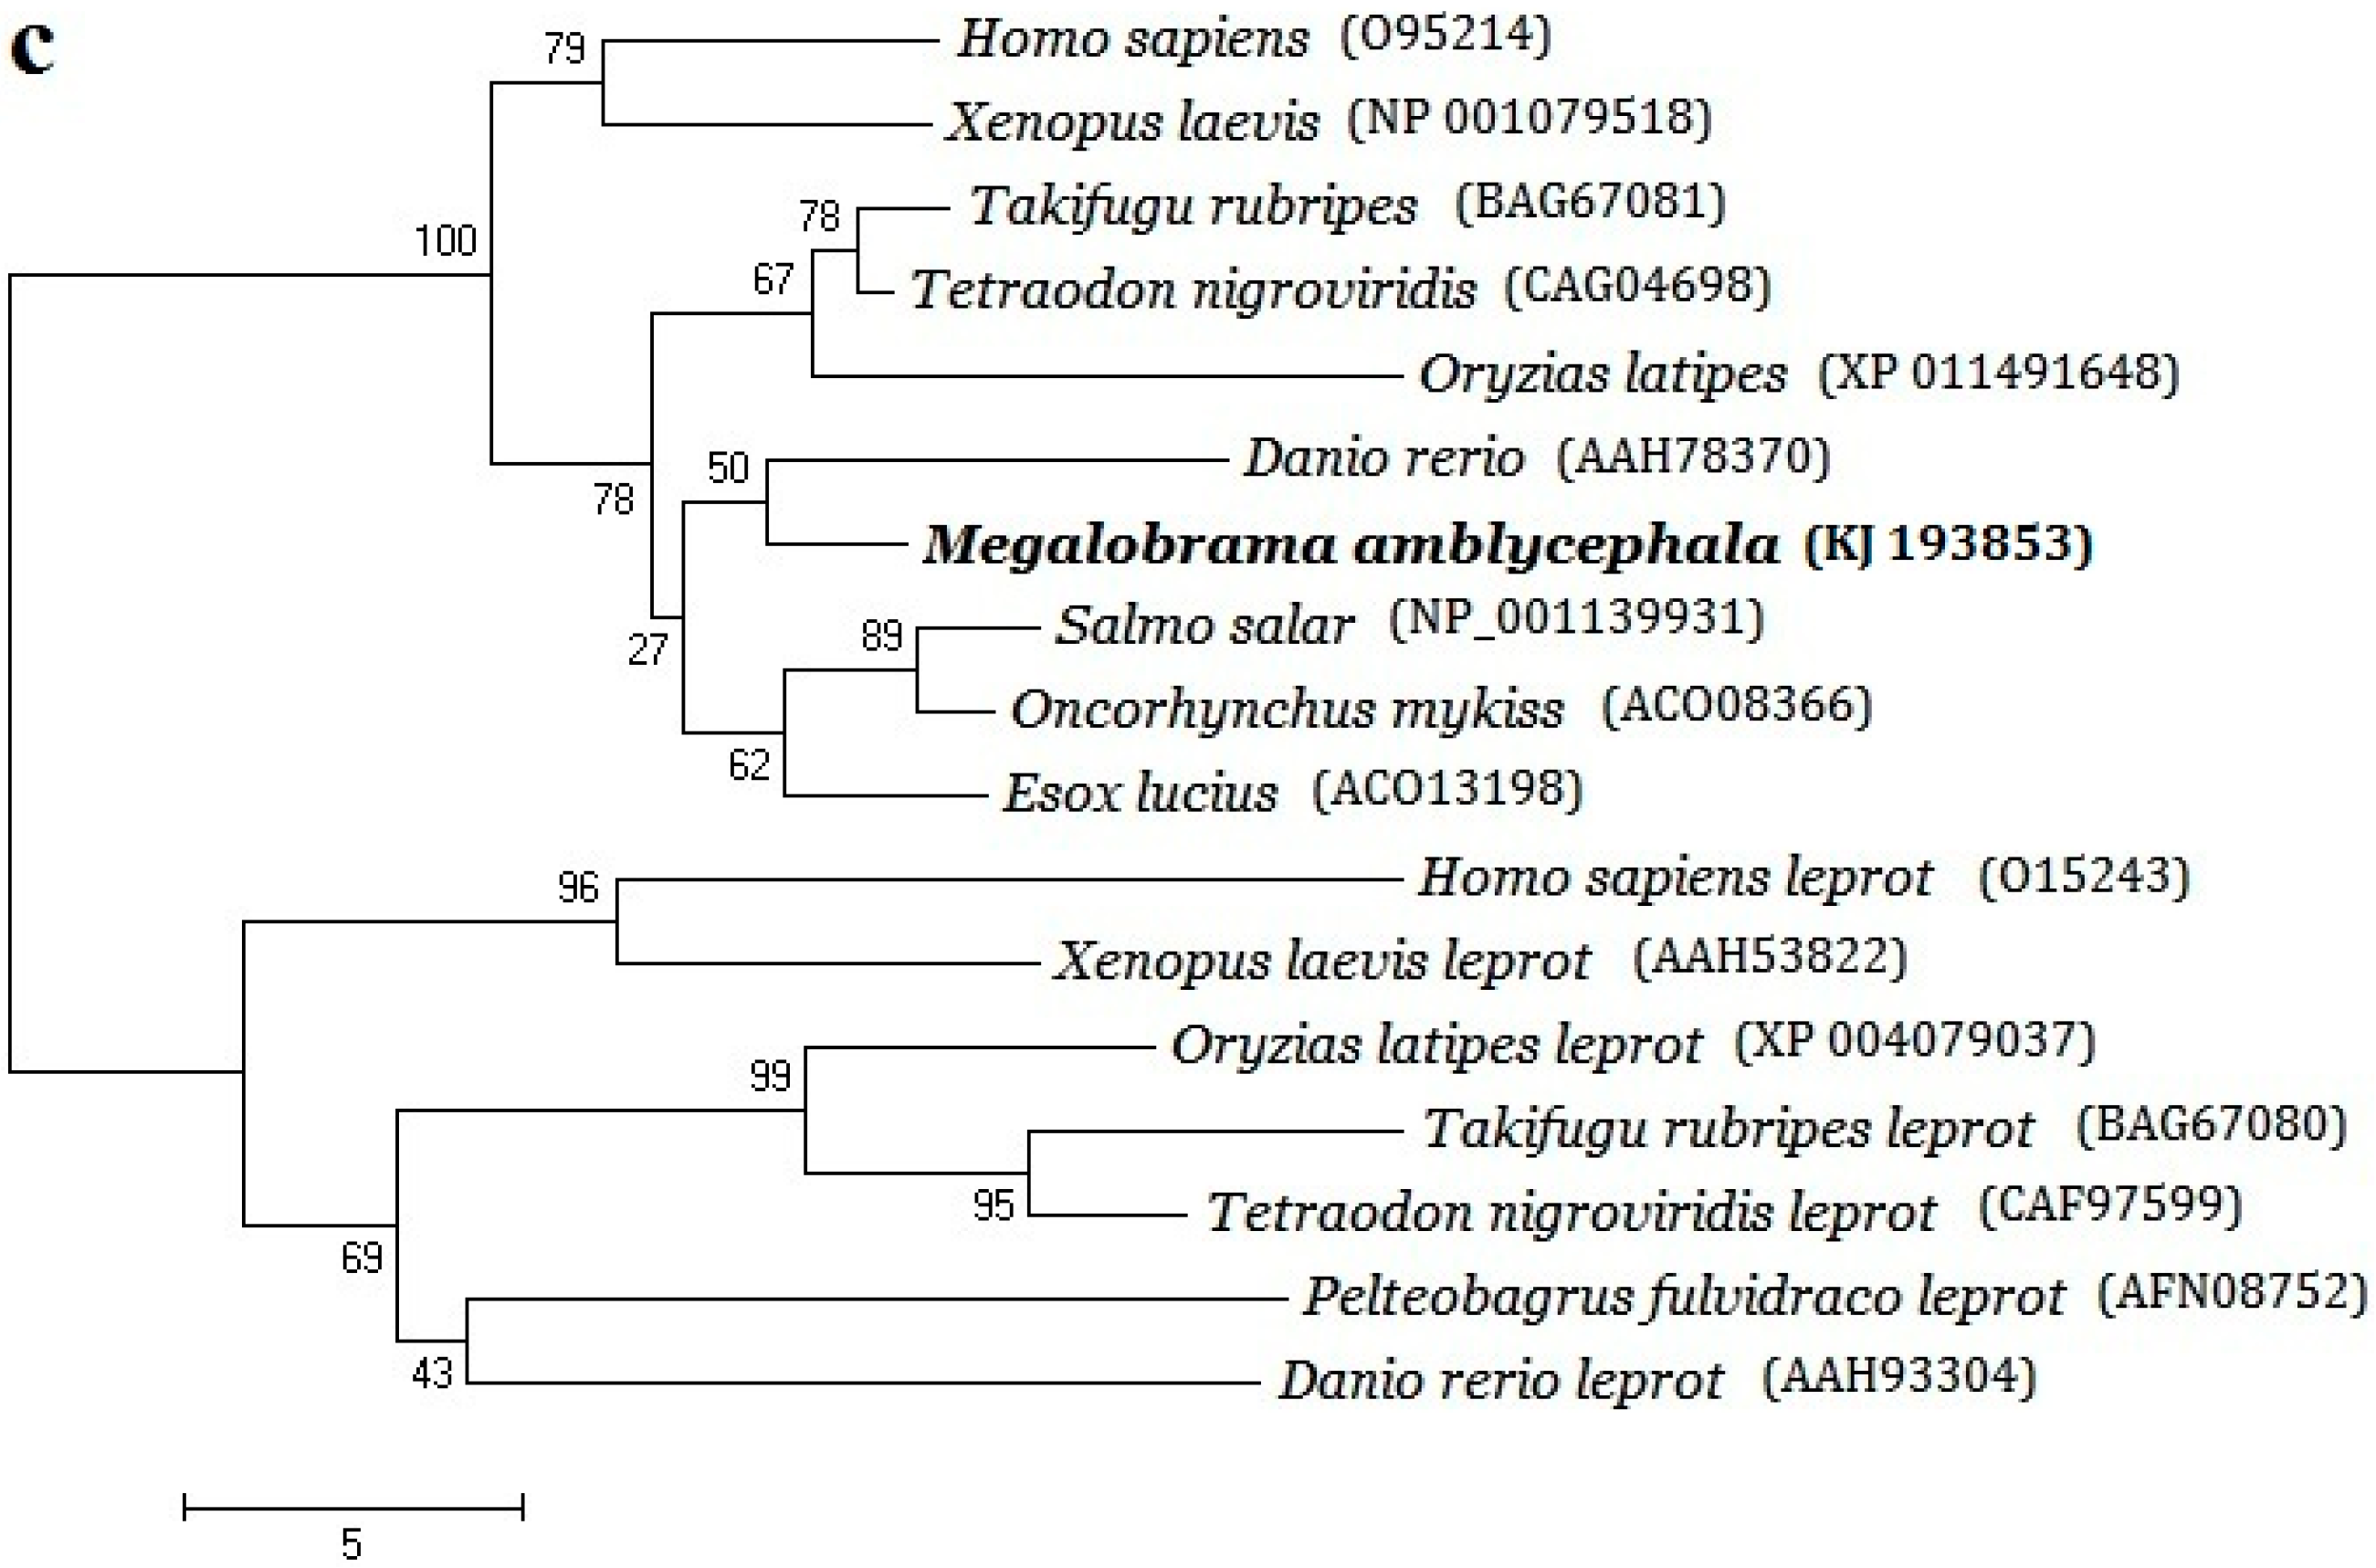
2.2. Phylogenetic Evolution Analysis

Phylogenetic trees of the three genes are shown in Figure 3, and the multiple amino acid sequences alignments of leptin, leptinR and leprotl1 are supplied as Supplemental Figures S1–S3. The consequences of multiple amino acid sequences alignment revealed that the conservative amino acid fragments of M. amblycephala leptin were malposed by compared to Perciformes, Tetraodontiformes and Cyprinodontiformes, which were also separated in different branches of the leptin phylogenetic tree. Phylogenetic tree of leptin had two branches and the obtained M. amblycephala leptin formed a cluster with fishes leptin-B (Figure 3A).
The multiple amino acid sequences alignment of leptinR showed that M. amblycephala leptinR shared the highest similarities with C. idella and the WSEWS motif that located in the second fibronectin type-III domain profile shared in all compared species (Figure 3B). In phylogenetic tree, M. amblycephala leptinR gathered in one branch with Cypriniformes and Siluriformes long-form leptinR. This result was in accordance with the conventional taxonomic relationship of these species.
The predicted amino acid sequence of M. amblycephala leprotl1 included a prokaryotic membrane lipoprotein lipid attachment site and three transmembrane domains, which were shared in all compared species. The phylogenetic analysis of leprotl1 (Figure 3C) showed that M. amblycephala was relatively more close to D. rerio, S. salar and O. mykiss than the other teleostean species.
Figure 3. Phylogenetic tree of M. amblycephala leptin (a); leptinR (b); and leprotl1 (c). Phylogenetic tree was constructed by neighbor-joining method in Clustal X and MEGA 5.0 program by alignment of the ORF encoding peptide sequences of Leptin gene family among M. amblycephala and other organism species. The GenBank accession No. was also showed behind the Latin name of each individual.
Ijms 16 26044 g003aIjms 16 26044 g003b

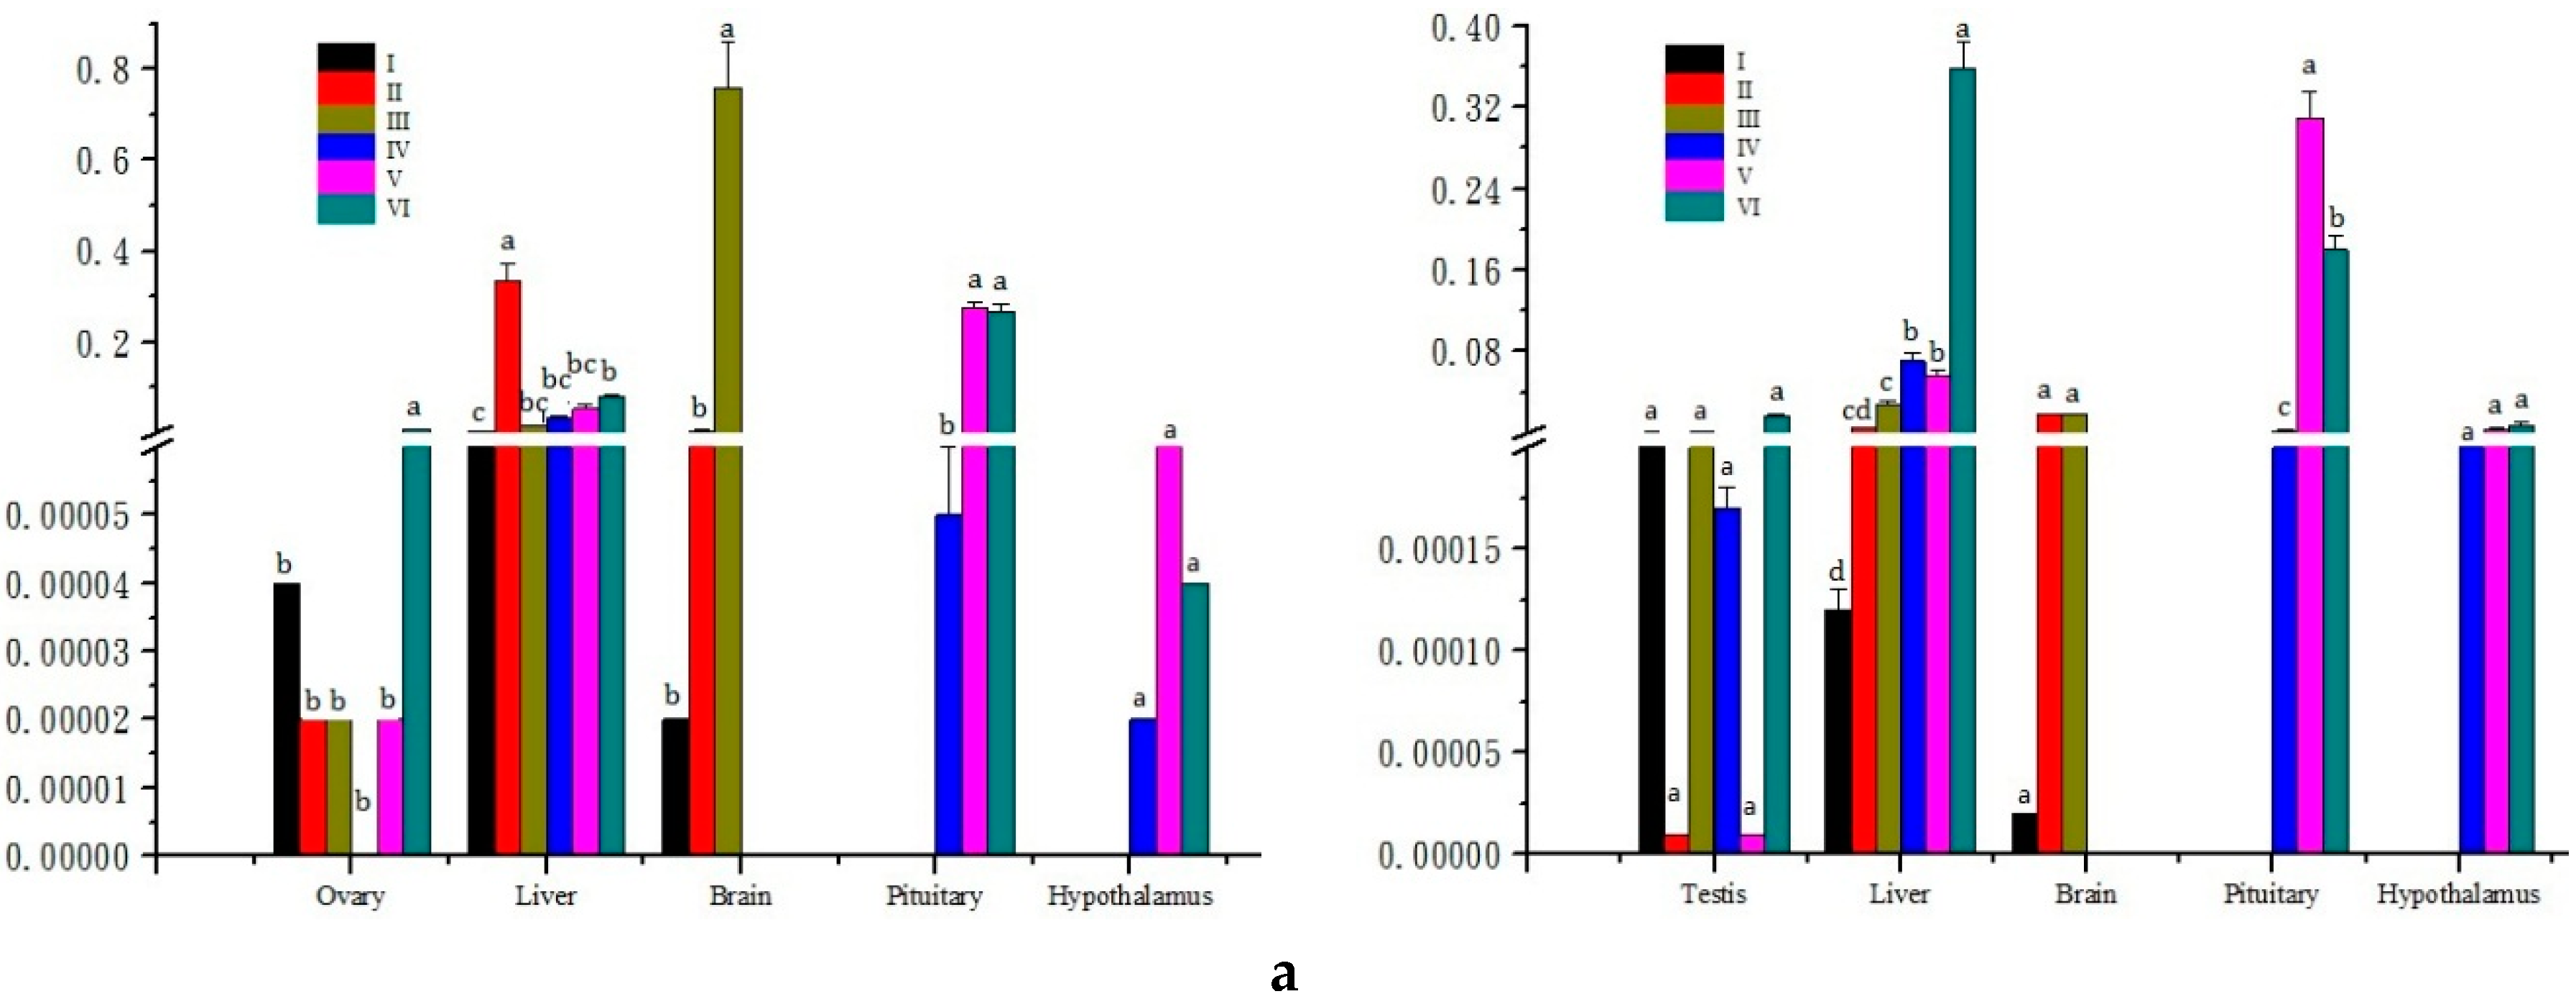
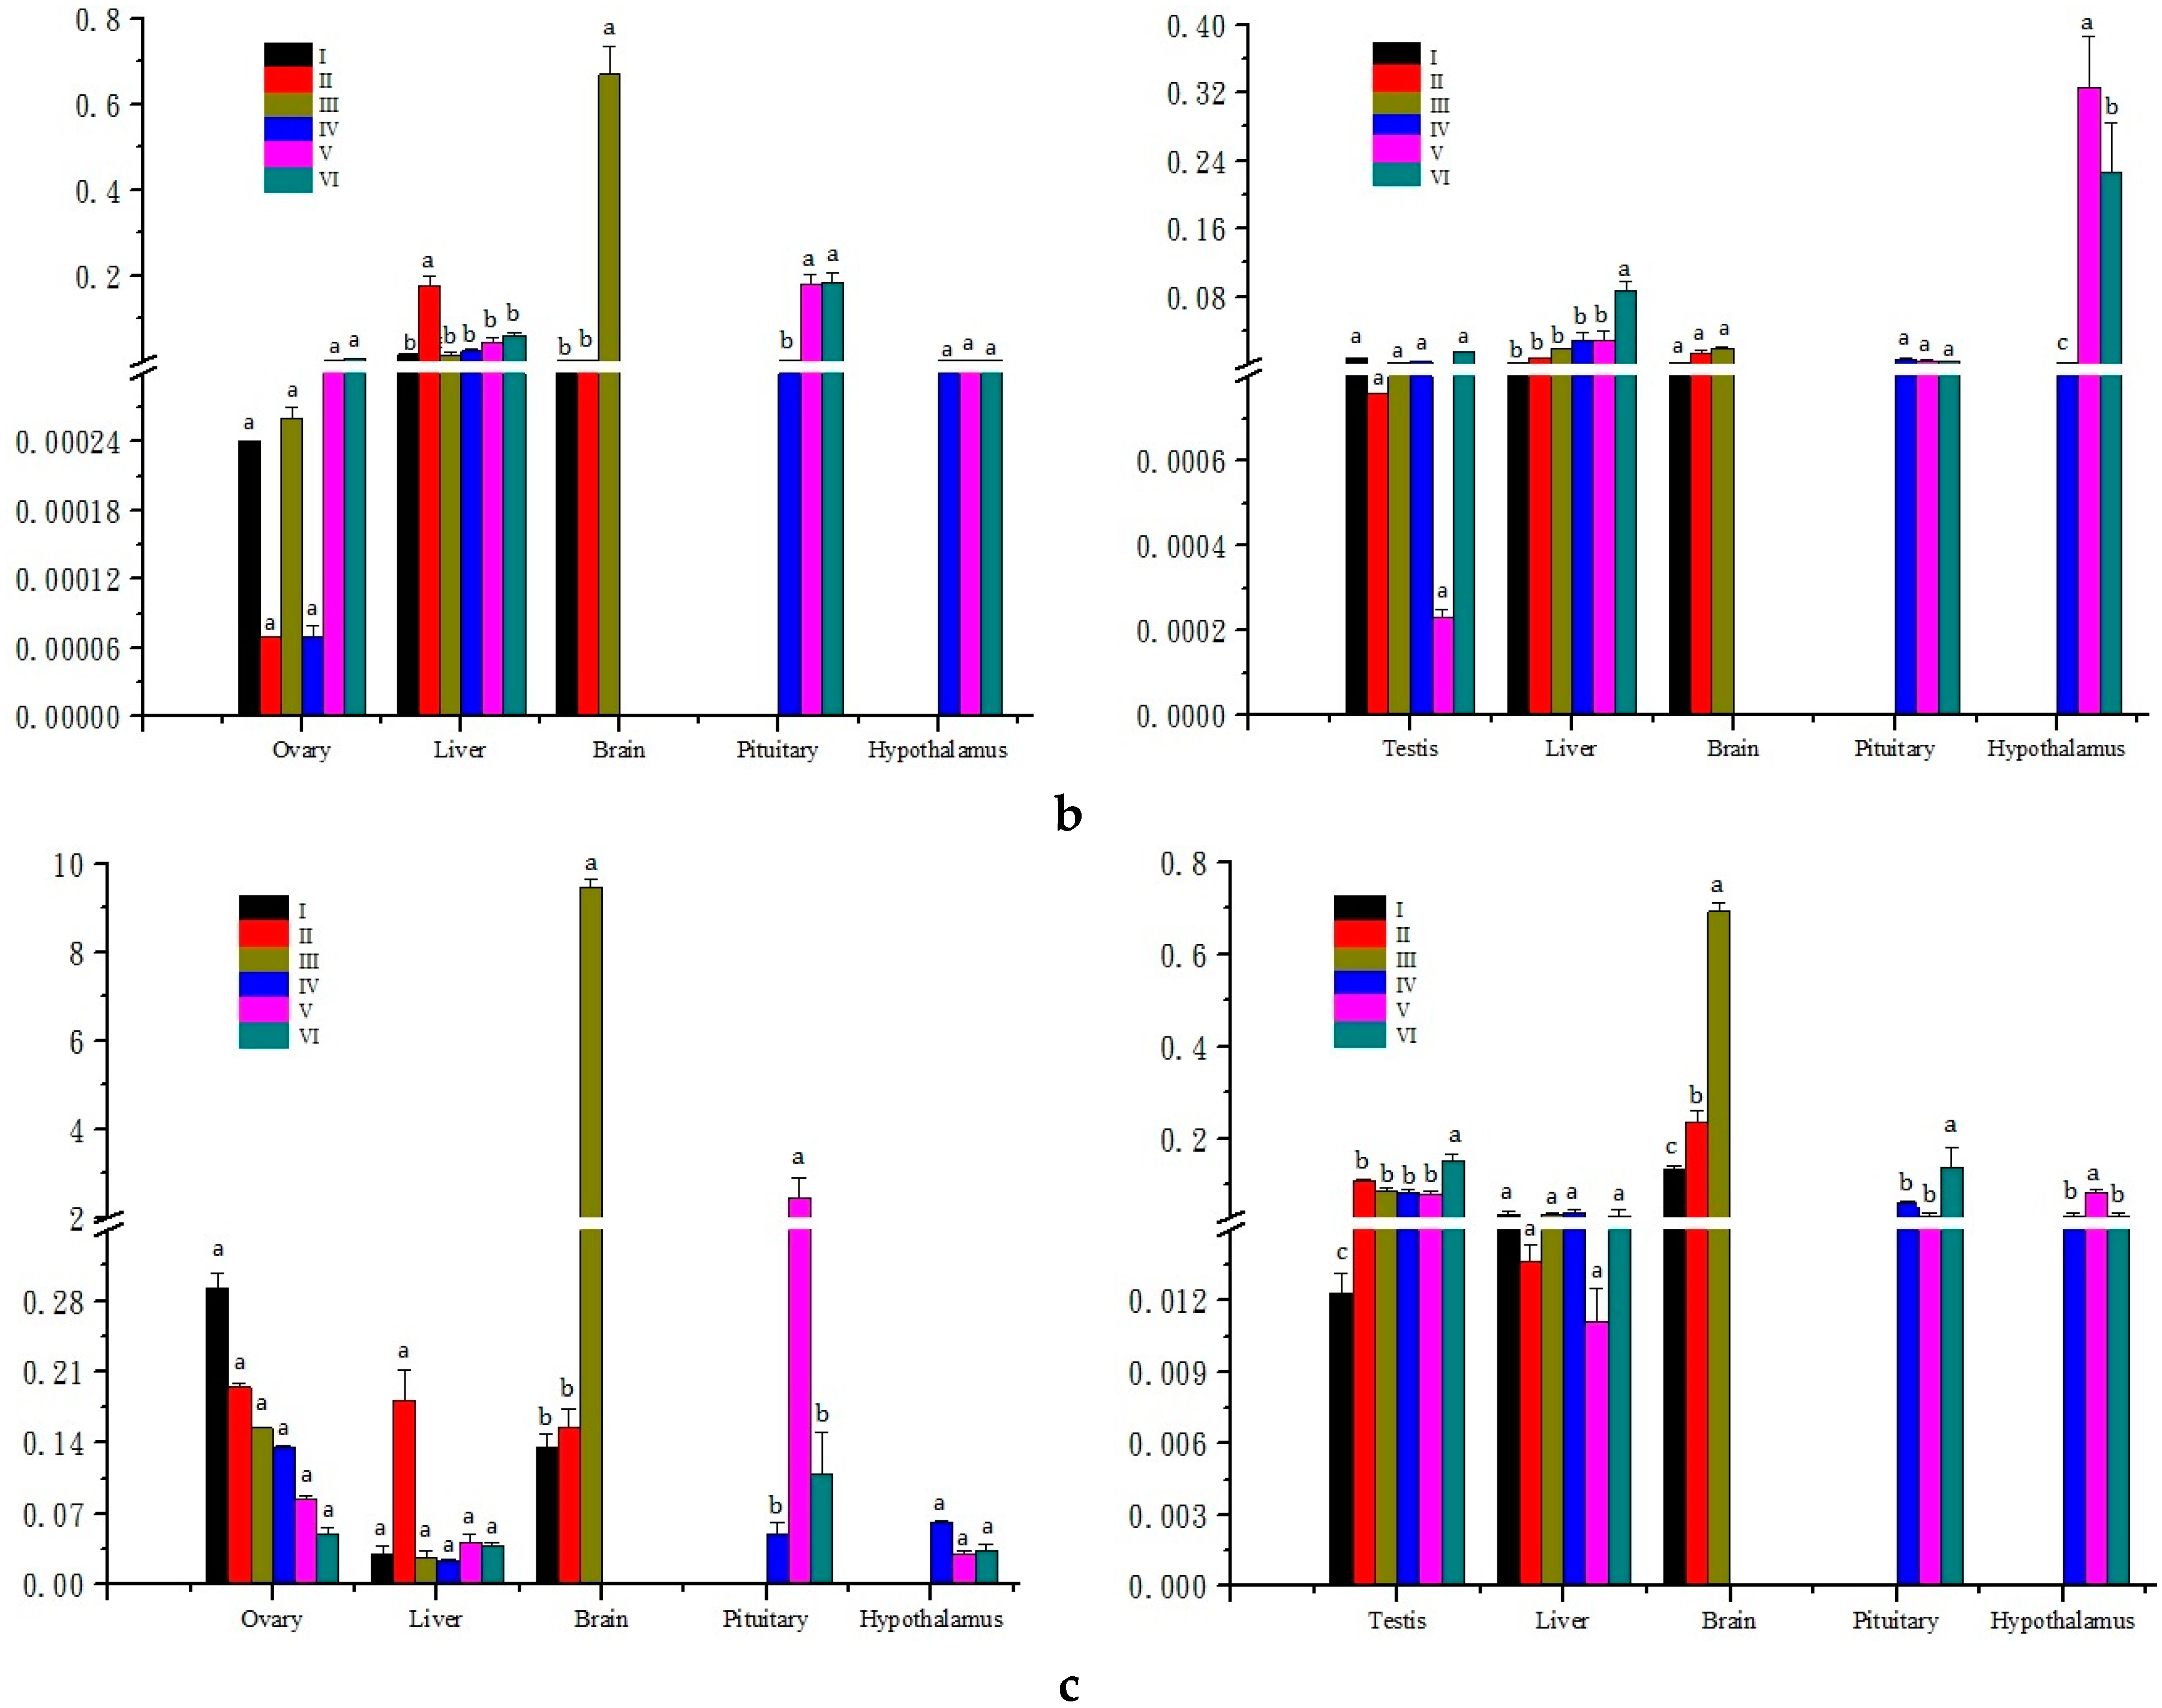
2.3. Expression Analysis in Different Developmental Stages of Gonads

The results of mRNA expression quantity of three genes in the five examined tissues during the different developmental stages of gonad were showed in Figure 4. No significant variation was observed in the expression levels of leptin in testis except the stage VI which was the highest; while leptin showed differential expression with relatively lower levels in ovary compared to testis (p < 0.05), and the highest expression level was also detected at stage VI of ovary. The expression levels in liver of the leptin gene were highest at stage II of female and stage VI of male, with relatively higher expression quantity in male compared to female from stage III to VI. Moreover, the expression of leptin in pituitary increased to the peak from stage IV to V and then again decreased at stage VI of both male and female, respectively. The variation tendency of expression level in M. amblycephala female hypothalamus was totally different from the male. For the female, the levels increased to the peak value from stage IV to V and then decreased at stage VI; but for the male, the levels increased to the peak value at stage VI.
Figure 4. The expression levels of M. amblycephala leptin (a); leptinR (b); and leprotl1 (c) in different tissues during the developmental periods of ovary (left) and testis (right). The β-actin was used as an internal control to calibrate the cDNA template for all the samples. Vertical bars represent the mean ± SE, and bars with different letters mean significantly different (p < 0.05).
Ijms 16 26044 g004aIjms 16 26044 g004b
Significant variation was observed in the expression levels of leptinR, whereas male and female showed differential expression in the same tissue at the same stage (p < 0.05). The expression levels of leptinR were highest at stage VI for both ovary and testis with different variation tendency. For female, the levels in the ovary were increased from stage II to III and decreased at stage IV, then increased again to the peak value at stage VI; the levels in the testis were in fluctuation, respectively. In addition, the expression levels of leptinR in both male and female hypothalamus increased to the peak value from stage IV to V and then decreased at stage VI. The variation tendency of expression quantity in M. amblycephala female pituitary was totally different from the male. For female, the levels increased to the peak value from stage IV to VI, while the levels in male decreased from stage IV to stage VI and the highest level was detected at stage IV. In addition, the significant differences of expression levels for leptinR between males and females were showed in Supplemental Table S1 (p < 0.05).
Finally, M. amblycephala leprotl1 had different expression patterns from both leptin and leptinR. At first, the expression levels of leprotl1 in ovary were decreased during the different developmental stages, while the levels in testis were increased from stage I to stage II and then decreased from stage II to stage V; at last, the levels increased to the peak value at stage VI. Meanwhile, the variation trend of expression quantity of leprotl1 in brain was the same as leptin and leptinR. The expression levels of leprotl1 also had significant differences between male and female (p < 0.05) (Supplemental Table S1).

2.4. Correlation Analysis of Three Genes

The correlation coefficients among leptin, leptinR and leprotl1 mRNA expression in the different development stages of M. amblycephala gonad were showed in Table 2. The results of correlation analysis showed that there were significant positive correlations between every two genes (p < 0.01) and the three genes (leptin, leptinR and leprotl1) all had fairly strict relevance with the other two (r > 0.7).
Table 2. The correlation coefficients among leptin, leptinR and leprotl1 expression in the different development stages of M. amblycephala gonad.
Target GeneLeptinLeptinrLeprotl1
leptin0.752 **0.751 **
leptinR0.0000.799 **
leprotl10.0000.000
Data above the diagonal showed the development-related correlation coefficient and the below expressed the level of significant difference. **, correlation is significant at the 0.01 level (2-tailed).

3. Discussion

3.1. Structural Characterizations and Evolution Analysis of Three Genes

The leptin, leptinR and leprotl1 of M. amblycephala were isolated, cloned and characterized for M. amblycephala in the present study. The functionally important residues have been predicted, while the results showed that some functional domains in M. amblycephala leptin, leptinR and leprotl1 sequences were highly conserved among fish species. These three genes are highly conserved molecular chaperones among the course of evolution in teleost [24]. In addition, many conservative amino acid residues were discretely existed in the sequences of the teleosteans, amphibians, birds, mammalians and human leptins, which may be caused by the base deletion, gene mutation or rearrangement that occurred in the process of gene replication and many other mechanisms of adaptive evolution, meanwhile these heritable variations were reserved during the species evolution [25].
In fish, prior studies also proposed that all fishes expressed two leptin paralogs [8], with the possible exception of T. rubripes [4], while M. amblycephala leptin took the same branch with Cyprinid, Salmonidae, Bagridae fishes leptin-B and kept away from other vertebrates leptin-A, therefore we deduced that M. amblycephala leptin should belong to the type B. Meanwhile our leptin was in disparate branch with the C. idella, which had closest ties of consanguinity with M. amblycephala. This result could be due to one or more leptin-B paralogs being in existence [26]. On the other hand, more recent work indicated that some fishes lost the second leptin-B ortholog, such as striped bass Morone saxatilis, stickleback Gasterosteus aculeatus [16] and Chinese perch Siniperca chuatsi [27]. The leptin of M. amblycephala entirely belonged to the type B, whether M. amblycephala leptin has the type A needs to be further studied.
Moreover, M. amblycephala leptinR had nearest genetic distance with C. idella, followed by C. auratus, C. carpiojian” and D. rerio respectively. These results were in accordance with conventional taxonomy of teleosts, similar results were found in GHRs, IGFs and MSTNs genes of M. amblycephala [28]. Additionally, two forms of leptinR have been identified in previous studies. The most obvious grouping of leptinR forms is to distinguish the length of intracellular domain and the leptinR-long is the signaling transduction form [29]. By compared with other species leptinRs, M. amblycephala leptinR should be the long-form.
M. amblycephala leprotl1 occupied a branch with L. oculatus, L. chalumnae, S. salar, O. mykiss, T. nigroviridis, O. niloticus and Xenopus laevis. It had relatively higher homologies with L. chalumnae, O. niloticus and T. nigroviridis. However, due to the information involved in leprotl gene was very limited in fish, we cannot ensure the evolution state of M. amblycephala leprotl1.
In general, the three genes were conserved in population evolution due to their important functions [30]. The results of adaptive evolution indicated that the branch of these M. amblycephala genes had undergone Darwin positive selection to adapt ever-changing environment [24,31].

3.2. Analysis of Genes Exons and Introns

In the present study, the regulating elements of TATA box and C/EBP binding sequence were found from the upstream 52 bp of the promoter in M. amblycephala leptin 5′ flanking region. The mutation experiment found that the TATA box and C/EBP binding sequence had significant effects on the expression of mouse leptin [32], as the point mutation of various regulatory elements would cause the decline of promoter activity. If multiple regulatory elements mutated at one time, it would produce the superimposed effect. Therefore M. amblycephala leptin sequence had multiple regulatory sites. The functions of the regulating elements in 5′ flanking region for regulating the transcription of M. amblycephala leptin needs future studies.
By comparing and aligning the genomic, transcript or protein sequences, the evolution of genes was studied and reconstructed [25]. Fishes, by far, were the logical organisms to study leptin gene among non-mammal species [33]. In contrast to the whole genome structure of other vertebrates leptin [27], in present study, we found that M. amblycephala leptin gene was encoded by 3 exons, they were separated by a 252 bp intron with consensus 5′ donor (GT) and 3′ acceptor (AG) splice sites and a 660 bp intron, respectively. The number of leptin intron and exon was unanimous by comparing the C. idella, H. molitrix, human and mice leptins [34]. For the structure of teleostean leptins, the length of the intron1, 2 and exon3 had significant discrepancy among species.
There are some studies have indicated that leptinR and leprot located in the same chromosome, which transcripts shared the first two exons that were not translated in the leptinR gene [35]. In our study, M. amblycephala leptinR and leprotl1 didn’t share the first two exons. However, the genome references of M. amblycephala are not available, so we couldn’t define whether M. amblycephala leptinR locate in the same chromosome with leprotl1.

3.3. Expression Analysis of Three Genes

According to the results of quantitative analysis of three genes in relative tissues of HPG axis at different developmental stages of gonad, we found that this axis played a major role in the regulation of gonadal development and functions. In addition to the simulative effect at the hypothalamus level, leptin had direct actions on the anterior pituitary [36]. Gonadotropin-releasing hormone (GnRH) was released by hypothalamus neurons, and then it could stimulate the release of pituitary gonadotropin, including luteinizing hormone (LH) and follicle-stimulating hormone (FSH), which regulate the formation of sex hormones and germ cell, respectively [37]. The leptin may indirectly regulate the development of M. amblycephala gonad and took part in the reproductive manipulation through the HPG axis [38]. The leptin may act as an important factor to link between the reproductive system and adipose tissue, which could indicate whether adequate energy are available for normal reproductive action [39]. The leprotl negatively regulates cell surface expression of growth hormone (GH) receptor in liver. It may participate in resistance to GH in liver during stages of reduced available nutrient [40]. In present study, we can also speculate that leprotl1 may negatively regulated surface expression of leptinR, which may participate in resisting to leptin.
The increasing expression levels of leptin and leptinR genes were detected at stage III in brain and the booming expression levels in liver at stage II declared that M. amblycephala stimulated energy in liver at stage II for Leptin gene system and indirectively participated in the reproductive start of M. amblycephala at stage III by brain physiological signals. The increasing levels of leptinR in gonad explained that gonad was the main target organ of reproductive start, while the testis had the same variation tendency with ovary. The expression levels of Leptin gene system had significant differences between males and females in HPG axis tissues (p < 0.05).
Based on the results from this study, it was suggested that these three genes indirectly took part in the reproductive start at stage III before the sexual maturity of M. amblycephala and may participate in reproductive regulation by the HPG axis during the process of the reproductive cycle. In addition, the leptin cooperated with leptinR to complete the gonadal development and reproduction. Moreover, as the expression levels of these genes in male were fluctuate and difficult to find a change rule, it was speculated that they may mainly control the development of ovary in M. amblycephala. Further studies are needed to fully elucidate the function of these genes in fishes and to better understand the crucial interplay between the expression of leptin, leptinR and leprotl1 or some impact factors in gene expression.

3.4. Correlation Analysis of Three Genes

According to the results of correlation analysis of three genes in the relative tissues of HPG axis at different developmental stages of gonad, we found that these genes had significant positive and fairly strict correlations (p < 0.05, r > 0.7) in the regulation of gonadal development. However, in the previous studies, a positive relationship between leptin and leptinR mRNA levels in interaction from humans to fish species had been reported [24]. Theoretically, leptin was thought to be in a positive relationship with leptinR, due to the auxo-action of appetite, body weight regulation and metabolism [41]. The leptinR may participate in stimulation on body protein synthesis.
Unfortunately, few studies examined the relationship between leptin and leprotl or leptinR and leprotl. Nevertheless, some studies about the relationship between leprotl1 and some genes or hormones might further help to understand the complex relationships among these genes. An inverse relationship between growth hormone (GH) and leprotl1 had been reported in mice, which indicated that leprotl1 influenced the liver GH signaling [40]. The related relationships and functions during the gonadal development of these three genes in fishes need be further studied.

4. Experimental Section

4.1. Experimental Animals

Healthy blunt snout bream used in this study were collected from a culture farm in Tuanfeng, Huanggang, Hubei Province, China. The experimental fish were acclimatized in the laboratory in the College of Fisheries, Huazhong Agricultural University for two weeks with water temperature being about 28 °C. Fish were fed with a commercial pelleted feed twice a day. For the gene expression analysis, six individuals from each gonadal development stage (stage I to VI for ovary and testis) were anesthetized by 100 mg·L−1 MS-222 (Sigma, St. Louis, MO, USA) (n = 6). From the development stage I to III, four tissues were sampled, including liver, ovary, testis and brain (difficult to separate the hypothalamus and pituitary at those stages); and five tissues were collected from stages IV to VI, which included hypothalamus, pituitary, liver, ovary, and testis. All sampled tissues were preserved at −80 °C after frozen in liquid nitrogen overnight. The sex of the fish and gonadal developmental stages were identified by the contour of gonad and the observed results of gonad tissue slice [23,42]. Briefly, for the female M. amblycephala, the oocyte was surrounded by a few squamous follicle cells and had a large nucleus surrounded by a thin layer of cytoplasm (stage I, the nucleus 2.5–10.0 μm; cell size 3.6–16.0 μm); concomitant with oocyte growth, the nucleus increased in size and the cytoplasm stained uniformly (stage II); the stage III was characterized by the appearance of yolk vesicles in the cytoplasm; the yolk vesicles increased in size and number to form several peripheral rows and give rise to cortical alveoli, the radiation belt shaped in the intercellular substance (stage IV); ovary at stage V was full of cyto-architecture vacuoles; ovulation resulted in ruptured empty or postovulatory follicles, new postovulatory follicles were readily identifiable, but they rapidly degenerated (stage VI). For the male M. amblycephala, testis contained spermatogonial stem cells associated with sertoli cells (stage I); spermatocyst with primary or secondary spermatocyte appeared and the appearance of spermatocytes indicated that meiosis has initiated (stage II); the lobule diameter increased and spermatocyst with spermatids appeared (stage III); all stages of developing germ cells may be present in testis, but germ cells in the same spermatogenic cysts showed the synchronous development (stage IV); large number of sperm were in the seminiferous tubules (stage V); testis declined to stage III after spermiation (stage VI).
“Guidelines for Experimental Animals” of the Ministry of Science and Technology (Beijing, China) was compiled during the experiments. Institutional Animal Care and Use Ethics Committee of Huazhong Agricultural University had approved our study. All efforts were made to minimize suffering of sampled fish species.

4.2. Molecular Cloning

The tissues were homogenized by grinding apparatus to extract total RNA. The total RNA were respectively dissolved in 50 µL RNase-free water after the extraction using RNAiso reagent (TaKaRa, Shuzo, Japan) according to the manufacturer’s instructions. Total RNA quality was checked with the agarose gel and concentration were measured by NanoDrop 2000 (Thermo Scientific, Waltham, MA, USA). The PrimeScript RT reagent Kit with gDNA Eraser (TaKaRa, Shuzo, Japan) was used to reverse-transcribe the first strand cDNA from the total RNA. The partial cDNA sequences of M. amblycephala leptin, leptinR and leprotl1 were obtained from M. amblycephala transcriptome database [43]. The 5′-/3′- Full RACE kit (TaKaRa, Shuzo, Japan) was used to amplify the 5′ and 3′ end sequences of these genes cDNA (special amplified primers were shown in Table 3). The 5′-RACE and 3′-RACE products were ligated into pGEM-T Easy vector (Promega, Madison, WI, USA) for sequencing. After compared the cDNA sequences of M. amblycephala with the whole genomic sequence of D. rerio on National Center for Biotechnology Information (NCBI) [44], the degenerate primers of leptin, leptinR and leprotl1 were designed for amplifying the introns. The full-length cDNA sequences and genomic sequences of these three genes were assembled by the SeqMan software (DNASTAR Inc., Madison, WI, USA).
Table 3. The primer sequences for genes cloning and expression in the study.
Target GenePrimer NamePrimer Sequence (5’–3’)
Internal Control Primers for qRT-PCR
β-actin primersβ-actin-FCGGACAGGTCATCACCATTG
β-actin-RCGCAAGACTCCATACCCAAGA
18S primers18S-FCGGAGGTTCGAAGACGATCA
18S-RGGGTCGGCATCGTTTACG
Quantitative Primers of Three Genes
leptin primersleptin-FCAGTTGAGATTGCGAGTGCC
leptin-RGTTGGAGGTAACGGGGAAGG
leptinR primersleptinR-FTAGACGAACCAGGGTTTGATA
leptinR-RATTCTTGCTCTGGCAGGTAA
leprotl1 primersleprotl1-FCAGTTGGCAGCAGTGGTGAAG
leprotl1-RCATCTATCAATGGGCGGCAGT
Gene Specific Primers for RACE
leptin specific primers for 3’ RACE3’-1TTTTCCCTCTCAATGGCAGCCCTGGG
3’-2GTACCTGGAAAAGCTTTGCCTGAA
leptin specific primers for 5’ RACE5’-1CACATCAACACACCAGAGAAAGTC
5’-2CCAACATACTACCAGCTTC
leptinR specific primers for 3’ RACE3’-1TTTTCCCTCTCAATGGCAGCCCTGG
3’-2GGTACCTGGAAAAGCTTTGCCTGAA
leptinR specific primers for 5’ RACE5’-1CACATCAACACACCAGAGAAAG
5’-2TCCCAACATACTACCAGCTTC
leprotl1 specific primers for 3’ RACE3’-1GCATTGTGAGGTTTCCAGATTTCCCA
3’-2ATCCCCCCGAAACTAATGAAGAAGCAG
leprotl1 specific primers for 5’ RACE5’-1GTGTGTTTATGAATCTACGCA
5’-2CGAAAATGGCATTTATTTAAAAAAAGAAC
Introns Primers for Genomic Sequence
leptin-IntronF-primerATCATGGCCCGAACTACCATC
R-primerTGTCCATGTTCAGGCAAAGC
leptinR-Intron-1F-primerTTCATTGCCGTTTCACAAGG
R-primerAGGGCAAGTGATTTACTAGAGG
leptinR-Intron-2F-primerTTGTGAGCTGCCCTTTGCTC
R-primerATCTTCGGTAACAGTGCGGT
leptinR-Intron-3F-primerATCTGCGAATGGGACTACCG
R-primerTTCAGAGGCACCCATGAACG
leptinR-Intron-4F-primerAGGTCAGAGGTCGTTCATGG
R-primerAGCTTCTTCAGTGCTCTCCG
leptinR-Intron-5F-primerGTGCGAGTAAAGCTGTGTGG
R-primerTGCCTTCTGTGATTGAGCACT
leptinR-Intron-6F-primerTGGAACCACAGGCAGAGATT
R-primerCACTGACAGGAACGCAATGAT
leptinR-Intron-7F-primerATTGCGTTCCTGTCAGTGGT
R-primerGAAGTCCATTCCTTTTGCCCAG
leptinR-Intron-8F-primerCCTGGGCAAAAGGAATGGAC
R-primerCTGGAATGGCGAGGATTGGT
leprotl1-Intron-1F-primerTCGCGAGGAGTTTCTTTAGCTT
R-primerTATAAACGGGCAGAGCGCAG
leprotl1-Intron-2F-primerAGTCTGTCGTTTGGAGGAGC
R-primerCAATCCCCGTGGTCAGGAAT
leprotl1-Intron-3F-primerACTCGGCTAGTAATGCCTGC
R-primerTGAAGACGGATGAGACGCTG

4.3. Sequence Analysis

After genes assemble in M. amblycephala, the putative amino acid sequences of leptin, leptinR and leprotl1 were predicted by Open Reading Frame Finder on the NCBI [44]. We searched homologous sequences of leptin, leptinR and leprotl1 cDNA in GenBank using the searching tool Blastn from NCBI website and predicted amino acid sequences of these three genes analyzed by DNAstar software (Madison, WI, USA). For the presence of signal peptides, SignalP 4.0 Server [45] was used to analyze the putative amino acid sequences. Besides, based on the UniProt [46] and SMART [47] database, the protein domains were marked and ExPASy online tools [48] were used to perform their analysis. TMHMM [49] were used to detect the transmembrane domains. MEGA 5.0 with the neighbor-joining method was used to construct the phylogenetic analysis of the putative amino acid sequences of leptin, leptinR and leprotl1. The bootstrap method with 1000 pseudo-replications was conducted to evaluate the reliability of the estimated tree.

4.4. Quantitative Real-Time PCR Analysis of Tissue Expression

Expression patterns of the three genes (leptin, leptinR and leprotl1) were analyzed basing on quantitative real-time PCR (qRT-PCR) and using the cDNA of various tissues in different stages of M. amblycephala gonad as templates. The β-actin and 18S rRNA were selected as two reference genes based on their expression stability, and all primer sequences were described in Table 3. The qRT-PCR assay was performed using SYBR Premix Ex Taq™ (TaKaRa, Dalian, China) on a Roche Light Cycler 480 machine (Roche, Sussex, UK). The qRT-PCR conditions were as follows: denaturation at 95 °C for 30 s, followed by 40 cycles of 95 °C for 5 s, annealing at 58 °C (β-actin)/55 °C (leptin)/58 °C (leptinR)/57.3 °C (leprotl1) for 20 s, and elongation at 72 °C for 15 s. The relative quantification of the target and reference genes was evaluated according to standard curves. Each experiment was conducted in triplicate. The relative stability measure (M) of the reference genes was calculated by GeNorm [50] as described in our previous studies was used to select the reference genes with the most stable expression [51]. According to the results, the β-actin was chosen as the reference gene in following analysis for its more stable than 18S rRNA.

4.5. Statistical Analysis

For statistical analysis, data from qRT-PCR was presented as the mean ± SE. The optimized comparative Ct (2−ΔΔCt) value method [52] was utilized to compute the relative expression value. One-way ANOVA and t-test were used to compare the significance of leptin, leptinR and leprotl1 genes between males and females as well as different gonadal development stages. Duncan’s test was applied to multiple comparisons by IBM SPSS Statistics 19.0 (SPSS, Chicago, IL, USA). Differences were considered significant at p < 0.05 and greatly significant at p < 0.01.

5. Conclusions

In conclusion, this study firstly reported the relationship between leptin, leptinR and leprotl1, as well as the differential expression patterns of these tree genes in M. amblycephala. Additionally, our results had revealed that the expressions of leptin, leptinR and leprotl1 were correlated with each other both in related tissues of HPG axis during the different developmental stages of gonad. These results could be useful for further investigation about the regulation mechanism of leptin, leptinR and leprotl1 genes in fish reproduction system.

Supplementary Materials

Acknowledgments

This work was financially supported by National Natural Science Foundation of China (No. 31472271), Modern Agriculture Industry Technology System Construction Projects of China titled as-Staple Freshwater Fishes Industry Technology System (No. CARS-46-05), Hubei Cooperation and Exchanges (No. 2013BHE006), Excellent Youth Foundation of Hubei Scientific Committee (No. 2013CFA032) and Fundamental Research Funds for the Central Universities (No. 2013PY066 and 2014PY013).

Author Contributions

Zexia Gao conceived the idea and designed the project. Honghao Zhao, Shaokui Yi, Shiming Wan and Boxiang Chen performed the experiments. Honghao Zhao and Cong Zeng analyzed the data. Honghao Zhao and Zexia Gao wrote the manuscript. All authors have read and approved the final manuscript.

Conflicts of Interest

The authors declare no conflict of interest.

References

  1. Zhang, Y.; Proenca, P.; Maffei, M.; Barone, M.; Leopold, L.; Friedman, J.M. Positional cloning of the mouse obese gene and its human homologue. Nature 1994, 372, 425–432. [Google Scholar] [CrossRef] [PubMed]
  2. Boswell, T.; Dunn, I.C.; Wilson, P.W.; Joseph, N.; Burt, D.W.; Sharp, P.J. Identificationofanon mammalian leptin-like gene: Characterization and expression in the tiger salamander (Ambystoma tigrinum). Gen. Comp. Endocrinol. 2006, 146, 157–166. [Google Scholar] [CrossRef] [PubMed]
  3. Crespi, E.J.; Denver, R.J. Leptin (ob gene) of the South African clawed frog Xenopus laevis. Proc. Natl. Acad. Sci. Biol. 2006, 103, 10092–10097. [Google Scholar] [CrossRef] [PubMed]
  4. Kurokawa, T.; Uji, S.; Suzuki, T. Identification of cDNA coding for a homologue to mammalian leptin from pufferfish Takifugu rubripes. Peptides 2005, 26, 745–750. [Google Scholar] [CrossRef] [PubMed]
  5. Pedro, N.D.; Alvarez, R.M.; Delgado, M.J. Acute and chronic leptin-reduces food intake and body weight in goldfish (Carassius auratus). Endocrinology 2006, 188, 513–520. [Google Scholar] [CrossRef] [PubMed]
  6. Huising, M.O.; Geven, E.J.W.; Kruiswijk, C.P.; Nabuurs, S.B.; Stolte, E.H.; Spanings, F.A.T.; Kemenade, B.M.L.V.; Flik, G. Increased leptin expression in common carp (Cyprinus carpio) after food intake but not after fasting or feeding to satiation. Endocrinology 2006, 147, 5786–5797. [Google Scholar] [CrossRef] [PubMed] [Green Version]
  7. Murashita, K.; Uji, S.; Yamamoto, T.; Rønnestad, I.; Kurokawa, T. Production of recombinant leptin and its effects on food intake in rainbow trout (Oncorhynchus mykiss). Biochem. Mol. Biol. 2008, 150, 377–384. [Google Scholar] [CrossRef] [PubMed]
  8. Gorissen, M.; Bernier, N.J.; Nabuurs, S.B.; Flik, G.; Huising, M.O. Two divergent leptin paralogues in zebrafish (Danio rerio) that originate early in teleostean evolution. Endocrinology 2009, 201, 329–339. [Google Scholar] [CrossRef] [PubMed]
  9. Li, G.G.; Liang, X.F.; Xie, Q.; Li, G.; Yu, Y.; Lai, K. Gene structure, recombinant expression and functional characterization of grass carp leptin. Gen. Comp. Endocrinol. 2010, 166, 117–127. [Google Scholar] [CrossRef] [PubMed]
  10. Gong, Y.; Luo, Z.; Qing, L.Z.; Jia, L.Z.; Xiao, Y.T.; Qi, L.C.; Yu, C.L.; Rong, H.L. Characterization and tissue distribution of leptin, leptin receptor and leptin receptor overlapping transcript genes in yellow catfish Pelteobagrus fulvidraco. Gen. Comp. Endocrinol. 2013, 182, 1–6. [Google Scholar] [CrossRef] [PubMed]
  11. Tang, R.; Dodd, A.; Lai, D.; McNabb, W.C.; Love, D.R. Validation of zebrafish (Danio rerio) reference genes for quantitative real-time RT-PCR normalization. Acta Biochim. Biophys. Sin. 2007, 39, 384–390. [Google Scholar] [CrossRef] [PubMed]
  12. Kurokawa, T.; Murashita, K.; Suzuki, T.; Uji, S. Genomic characterization and tissue distribution of leptinR and leptinR overlapping transcript genes in the pufferfish Takifugu rubripes. Gen. Comp. Endocr. 2008, 158, 108–114. [Google Scholar] [CrossRef] [PubMed]
  13. Kurokawa, T.; Murashita, K. Genomic characterization of multiple Leptin genes and a leptinR gene in the Japanese medaka Oryzias latipes. Gen. Comp. Endocrinol. 2009, 161, 229–237. [Google Scholar] [CrossRef] [PubMed]
  14. Cao, Y.B.; Xue, J.L.; Wu, L.Y.; Jiang, W.; Hu, P.N.; Zhu, J. The detection of leptinR isoforms in crucian carp gill and the influence of fasting and hypoxia on their expression. Domest. Anim. Endocrinol. 2011, 4, 74–80. [Google Scholar] [CrossRef] [PubMed]
  15. Bailleul, B.; Akerblom, I.; Strosberg, A.D. The leptin receptor promoter controls expression of a second distinct protein. Nucleic Acids Res. 1997, 25, 2752–2758. [Google Scholar] [CrossRef] [PubMed]
  16. Won, E.T.; Baltzegar, D.A.; Picha, M.E.; Borski, R.J. Cloning and characterization of leptin in a Perciform fish, the striped bass (Morone saxatilis): Control of feeding and regulation by nutritional state. Gen. Comp. Endocrinol. 2012, 178, 98–107. [Google Scholar] [CrossRef] [PubMed]
  17. Mark, R.D.; Qin, L.; Mason, D.K.; Brian, B.; Richard, L.L. Leptin expression affects metabolic rate in zebrafish embryos (D. rerio). Front. Physiol. 2013, 4. [Google Scholar] [CrossRef]
  18. Trombley, S.; Schmitz, M. Leptin in fish: Possible role in sexual maturation in male Atlantic salmon. Fish Physiol. Biochem. 2013, 39, 103–106. [Google Scholar] [CrossRef] [PubMed]
  19. Denver, R.J.; Bonett, R.M.; Boorse, G.C. Evolution of leptin structure and function. Neuroendocrinology 2011, 94, 21–38. [Google Scholar] [CrossRef] [PubMed]
  20. Peyon, P.; Zanuy, S.; Carillo, M. Actions of leptin on in vitro luteinizing hormone release in the European sea bass (Dicentrarchus labrax). Biol. Reprod. 2001, 65, 1573–1578. [Google Scholar] [CrossRef] [PubMed]
  21. Weil, C.; Le, B.P.Y.; Sabin, N.; Le, G.F. In vitro action of leptin on FSH and LH production in rainbow trout (Onchorynchus mykiss) at different stages of the sexual cycle. Gen. Comp. Endocrinol. 2003, 130, 2–12. [Google Scholar] [CrossRef]
  22. Zhao, Y.H.; Yasmeen, G.; Li, S.; Wang, W.M. Cloning, identification and accurate normalization expression analysis of PPARα gene by GeNorm in Megalobrama amblycephala. Fish Shellfish Immun. 2011, 31, 462–468. [Google Scholar] [CrossRef] [PubMed]
  23. Wen, J.F.; Gao, Z.X.; Luo, W.; Tong, J.G.; Wang, W.M. Observation of gonad at different development stages and expression analysis of Kiss2/Kiss2r genes in Megalobrama amblycephala. South China Fish. Sci. 2013, 9, 44–50. [Google Scholar]
  24. Prokop, J.W.; Duff, R.J.; Ball, H.C.; Copeland, D.L.; Londraville, R.L. Leptin and leptin receptor analysis of a structure to function relationship in interaction and evolution from humans to fish. Peptide 2012, 38, 326–336. [Google Scholar] [CrossRef] [PubMed]
  25. Jin, L.; Kryukov, K.; Clemente, J.C.; Komiyama, T.; Suzuki, Y.; Imanishi, T. The evolutionary relationship between gene duplication and alternative splicing. Gene 2008, 427, 19–31. [Google Scholar] [CrossRef] [PubMed]
  26. Anna, R.A.; Sigurd, O.S.; Tom, O.N.; Raja, M.R.; Ivar, R. Molecular cloning and genomic characterization of novel leptin-like genes in salmonids provide new insight into the evolution of the Leptin gene family. Gen. Comp. Endocrinol. 2013, 187, 48–59. [Google Scholar] [CrossRef] [PubMed]
  27. Shan, H.; Xu, F.L.; Ling, L.; Wei, H.; Dan, S.; Ya, X.T. Gene structure and expression of leptin in Chinese perch. Gen. Comp. Endocrinol. 2013, 194, 183–188. [Google Scholar] [CrossRef] [PubMed]
  28. Zeng, C.; Liu, X.L.; Wang, W.M.; Tong, J.G.; Luo, W.; Zhang, J.; Gao, Z.X. Characterization of GHRs, IGFs and MSTNs, and analysis of their expression relationships in blunt snout bream, Megalobrama amblycephala. Gene 2014, 535, 239–249. [Google Scholar] [CrossRef] [PubMed]
  29. Louis, A.T. The Leptin Receptor. J. Biol. Chem. 1997, 272, 6093–6096. [Google Scholar] [CrossRef] [PubMed]
  30. Zou, G.; Zhang, Y.P.; Yu, L. Natural selection and adaptive evolution of leptin. Chin. Sci. Bull. 2013, 58, 2104–2112. [Google Scholar] [CrossRef]
  31. Yu, L.; Jin, W.; Zhang, X.; Wang, D.; Zheng, J.S.; Yang, G.; Xu, S.X. Evidence for positive selection on the Leptin gene in cetacea and pinnipedia. PLoS ONE 2011, 6. [Google Scholar] [CrossRef] [PubMed]
  32. Mason, M.M.; He, Y.; Chen, H.; Quon, M.J.; Reitman, M. Regulation of leptin promoter function by SP1, C/EBP, and a novel factor. Endocrinology 1998, 139, 1013–1022. [Google Scholar] [CrossRef] [PubMed]
  33. Donald, L.C.; Robert, J.D.; Qin, L.; Jeremy, P.; Richard, L.L. Leptin in teleost fishes: An argument for comparative study. Front. Physiol. 2011, 2. [Google Scholar] [CrossRef]
  34. Yu, Y.; Liang, X.F.; Li, G.G.; Wang, L.; Li, G.Z. Molecular cloning and analysis of leptin gene in grass carp (Ctenopharyngodon idellus) and silver carp (Hypophthalmichthys molitrix). Zool. Res. 2009, 30, 480–486. [Google Scholar]
  35. Mercer, J.G.; Moar, K.M.; Hoggard, N.; Strosberg, A.D.; Froguel, P.; Bailleul, B. B219/OB-R 5′-UTR and leptin receptor gene-related protein gene expression in mouse brain and placenta: Tissue-specific leptin receptor promoter activity. J. Neuroendocrinol. 2000, 12, 649–655. [Google Scholar] [CrossRef] [PubMed]
  36. Carol, F.E.; Darshana, P. Leptin signaling and circuits in puberty and fertility. Cell. Mol. Life Sci. 2013, 70, 841–862. [Google Scholar] [CrossRef] [PubMed]
  37. David, L.; Frank, C.; Luc, J.M. Implications of leptin in neuroendocrine regulation of male reproduction. Reprod. Biol. 2013, 13, 1–14. [Google Scholar] [PubMed]
  38. Dhirender, V.R.; Carol, F.E. Chemical identity of hypothalamic neurons engaged by leptin in reproductive control. Chem. Neuroanat. 2014, 61, 233–238. [Google Scholar]
  39. Stergios, M.; Jean, L.C.; Christos, S.M. Leptin and reproduction: A review. Fertil. Steril. 2002, 10, 433–444. [Google Scholar]
  40. Thierry, T.; Françoise, C.A.; Olivier, B.; Céline, C.; Réjane, P.; Sandrine, C.; Eric, B.; Yves, R.; Jean, P.S.; Bart, S.; et al. LEPROT and LEPROTL1 cooperatively decrease hepatic growth hormone action in mice. Clin. Investig. 2009, 199, 3830–3838. [Google Scholar]
  41. Chisada, S.; Kurokawa, T.; Murashita, K.; Rønnestad, I.; Taniguchi, Y.; Toyoda, A.; Sakaki, Y.; Takeda, S.; Yoshiura, Y. Leptin receptor-deficient (knockout) medaka, Oryzias latipes, show chronical up-regulated levels of orexigenic neuropeptides, elevated food intake and stage specific effects on growth and fat allocation. Gen. Comp. Endocrinol. 2014, 195, 9–20. [Google Scholar] [CrossRef] [PubMed]
  42. Ke, H.W. An excellent freshwater food fish, Megalobrama amblycephala, and its propagating and culturing. Acta Hydrobiol. Sin. 1975, 5, 293–312. [Google Scholar]
  43. Gao, Z.; Luo, W.; Liu, H.; Zeng, C.; Liu, X.; Yi, S.; Wang, W. Transcriptome analysis and SSR/SNP markers information of the blunt snout bream (Megalobrama amblycephala). PLoS ONE 2012, 7, e42637. [Google Scholar] [CrossRef] [PubMed]
  44. NCBI. Available online: http://0-www-Ncbi-Nlm-Nih-Gov.brum.beds.ac.uk/gorf/orfig.cgi (accessed on 14 February 2014).
  45. Signal 4.0 Server. Available online: http://www.cbs.dtu.dk/services/SignalP/ (accessed on 20 January 2014).
  46. Uniprot. Available online: http://www.uniprot.org/ (accessed on 20 January 2014).
  47. SMART. Available online: http://smart.embl- heidelberg.de/ (accessed on 23 January 2014).
  48. ExPASy. Available online: http://us.ex pasy.org/tools (accessed on 22 January 2014).
  49. TMHMM. Available online: http://www.cbs.dtu.dk/services/TMHMM-2.0/ (accessed on 2 May 2014).
  50. GeNorm. Available online: http://medgen.ugent.be/genorm/ (accessed on 10 December 2013).
  51. Zhang, H.; Chen, H.; Zhang, Y.; Li, S.; Lu, D.; Zhang, H.; Meng, Z.; Liu, X.; Lin, H. Molecular cloning, characterization and expression profiles of multiple leptin genes and leptinR genes in orange-spotted grouper (Epinephelus coioides). Gen. Comp. Endocrinol. 2013, 181, 295–305. [Google Scholar] [CrossRef] [PubMed]
  52. Kenneth, J.L.; Thomas, D.S. Analysis of Relative Gene Expression Data Using Real-Time Quantitative PCR and the 2−ΔΔCt Method. Methods 2001, 25, 402–408. [Google Scholar] [CrossRef] [PubMed]

