1. Introduction
Genome integrity is constantly challenged by endogenous and exogenous DNA damaging stresses, such as exposures to reactive oxygen species originating from oxidative cellular metabolism, to external chemical and physical agents, to background and medical ionizing radiation. Processes such as aging, tumorigenesis, age-related diseases are regulated by a multitude of genetic factors controlling DNA integrity. This control is executed via several intricately related pathways, such as DNA damage signaling, cell cycle checkpoints, DNA repair, and apoptosis [
1,
2]. Ataxia telangiectasia mutated (ATM) is a key factor that senses DNA damage and phosphorylates its main downstream target histone H2AX to form γH2AX, leading to the activation of p53 and the execution of the downstream programs of cell cycle arrest, DNA repair or apoptosis [
3,
4,
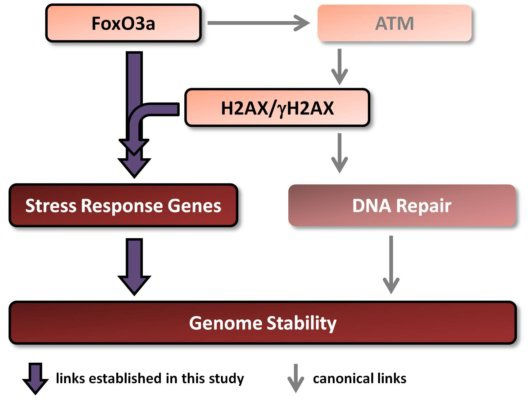
5]. The ATM-γH2AX-p53 axis is a canonical DNA damage pathway that regulates the cellular response to DNA damage and, depending on the context, determines the outcome.
Among other factors shown to play a key role in regulating cellular stress responses the most important is a transcription factor FoxO3a belonging to the Foxo transcription factors family [
6,
7,
8]. The mammalian Foxo transcription factors have been implicated in a variety of crucial and diverse cellular processes, transcriptionally regulating apoptosis, cell cycle, DNA repair, glucose metabolism, cellular differentiation and other biological functions [
9]. They were also found at chromosomal translocations in human tumors, indicating their role in tumor suppression [
10]. One of the most striking features of FoxO3 is the prominent role it plays in longevity. In
C. elegans and
D. melanogaster, Foxo orthologs DAF-16 and dFoxo, respectively, were shown to increase lifespan by transcriptionally activating genes involved in resistance to oxidative stress, pathogens and damage to proteins and by facilitating chromatin remodeling [
11,
12,
13]. Epidemiological studies showed that the
Foxo3a genotype in humans is also strongly associated with longevity [
14,
15,
16]. Recent evidence suggested that the mechanism by which FoxO3 activates the transcription of its target genes is mediated by the chromatin remodeling complex SWItch/Sucrose Non-Fermentable (SWI/SNF) that relaxes the chromatin to initiate transcription [
13].
There is a link between aging/longevity and genomic instability. Both H2AX and FoxO3a play important roles in these processes. Importantly, FoxO3a has been shown, in addition to its well known transcriptional regulation of stress response genes, to directly interact with ATM to trigger all downstream canonical DNA damage signaling including phosphorylation of H2AX [
17,
18]. γH2AX is known to exert a positive feedback effect on maintaining and amplifying ATM activity via MDC1 [
19]. Would it be sensible to assume that H2AX or its phosphorylated form may also impact FoxO3a in a similar feedback manner? This question becomes even more appropriate given the fact that the regulation of longevity in worms by chromatin modifications was dependent on Foxo [
20].
Therefore, in this study we examined whether H2AX may play a role in the transcription of genes regulated by FoxO3a. Additionally, we studied the transcriptional responses of these genes to ionizing radiation in comprehensive dose-response and time-course experiments in the context of the presence or absence of histone H2AX. We show that both baseline and radiation-modulated expression of several genes is affected by the H2AX status. Results of experiments examining direct FoxO3a transcriptional activity, FoxO3a post-translational modification and intracellular FoxO3a localization all show that FoxO3a behavior is substantially changed in the H2AX−/− compared to H2AX+/+ cells. Finally, we show that these differences were accompanied by increased genomic instability and radiosensitivity and that knockdown of H2AX in H2AX+/+ cells resulted in the effects similar to those observed in H2AX−/− cells, providing a potential link between H2AX and FoxO3a in relation to the maintenance of genome integrity.
3. Discussion
We addressed the question of whether H2AX has a role in the FoxO3a-regulated transcriptional activities by using a cell culture model consisting of two mouse embryonic fibroblast cell lines, one of which was wild type (
H2AX+/+ cells) and another was
H2AX knockout cell line (
H2AX−/− cells). The use of these genetically matched cell lines allows the attribution of differences in measured endpoints to H2AX status. The validation of the chosen model showed not only that the H2AX transcript was not expressed and H2AX/γH2AX was not detected under control and irradiated conditions in the knockout cells, but also that the upstream event in the DNA damage response, phosphorylation of ATM at Ser 1981 (pATM), was unaffected by the
H2AX status (
Figure 1). Since FoxO3a plays an important role in ATM activation and downstream DNA damage signaling [
17], this observation indicates that H2AX has no role in this step of the molecular DNA damage response. However, pATM foci did not form in
H2AX−/− cells, indicating an aberrant DNA damage response (
Figure 4A). We did observe slightly lower growth rate in H2AX deficient cells. However, in the context of current work when most of the responses studied were within 48 h of irradiation, it is reasonable to assume that cell cycle differences exert minimal effect.
The fact that we found significant differences between
H2AX+/+ and
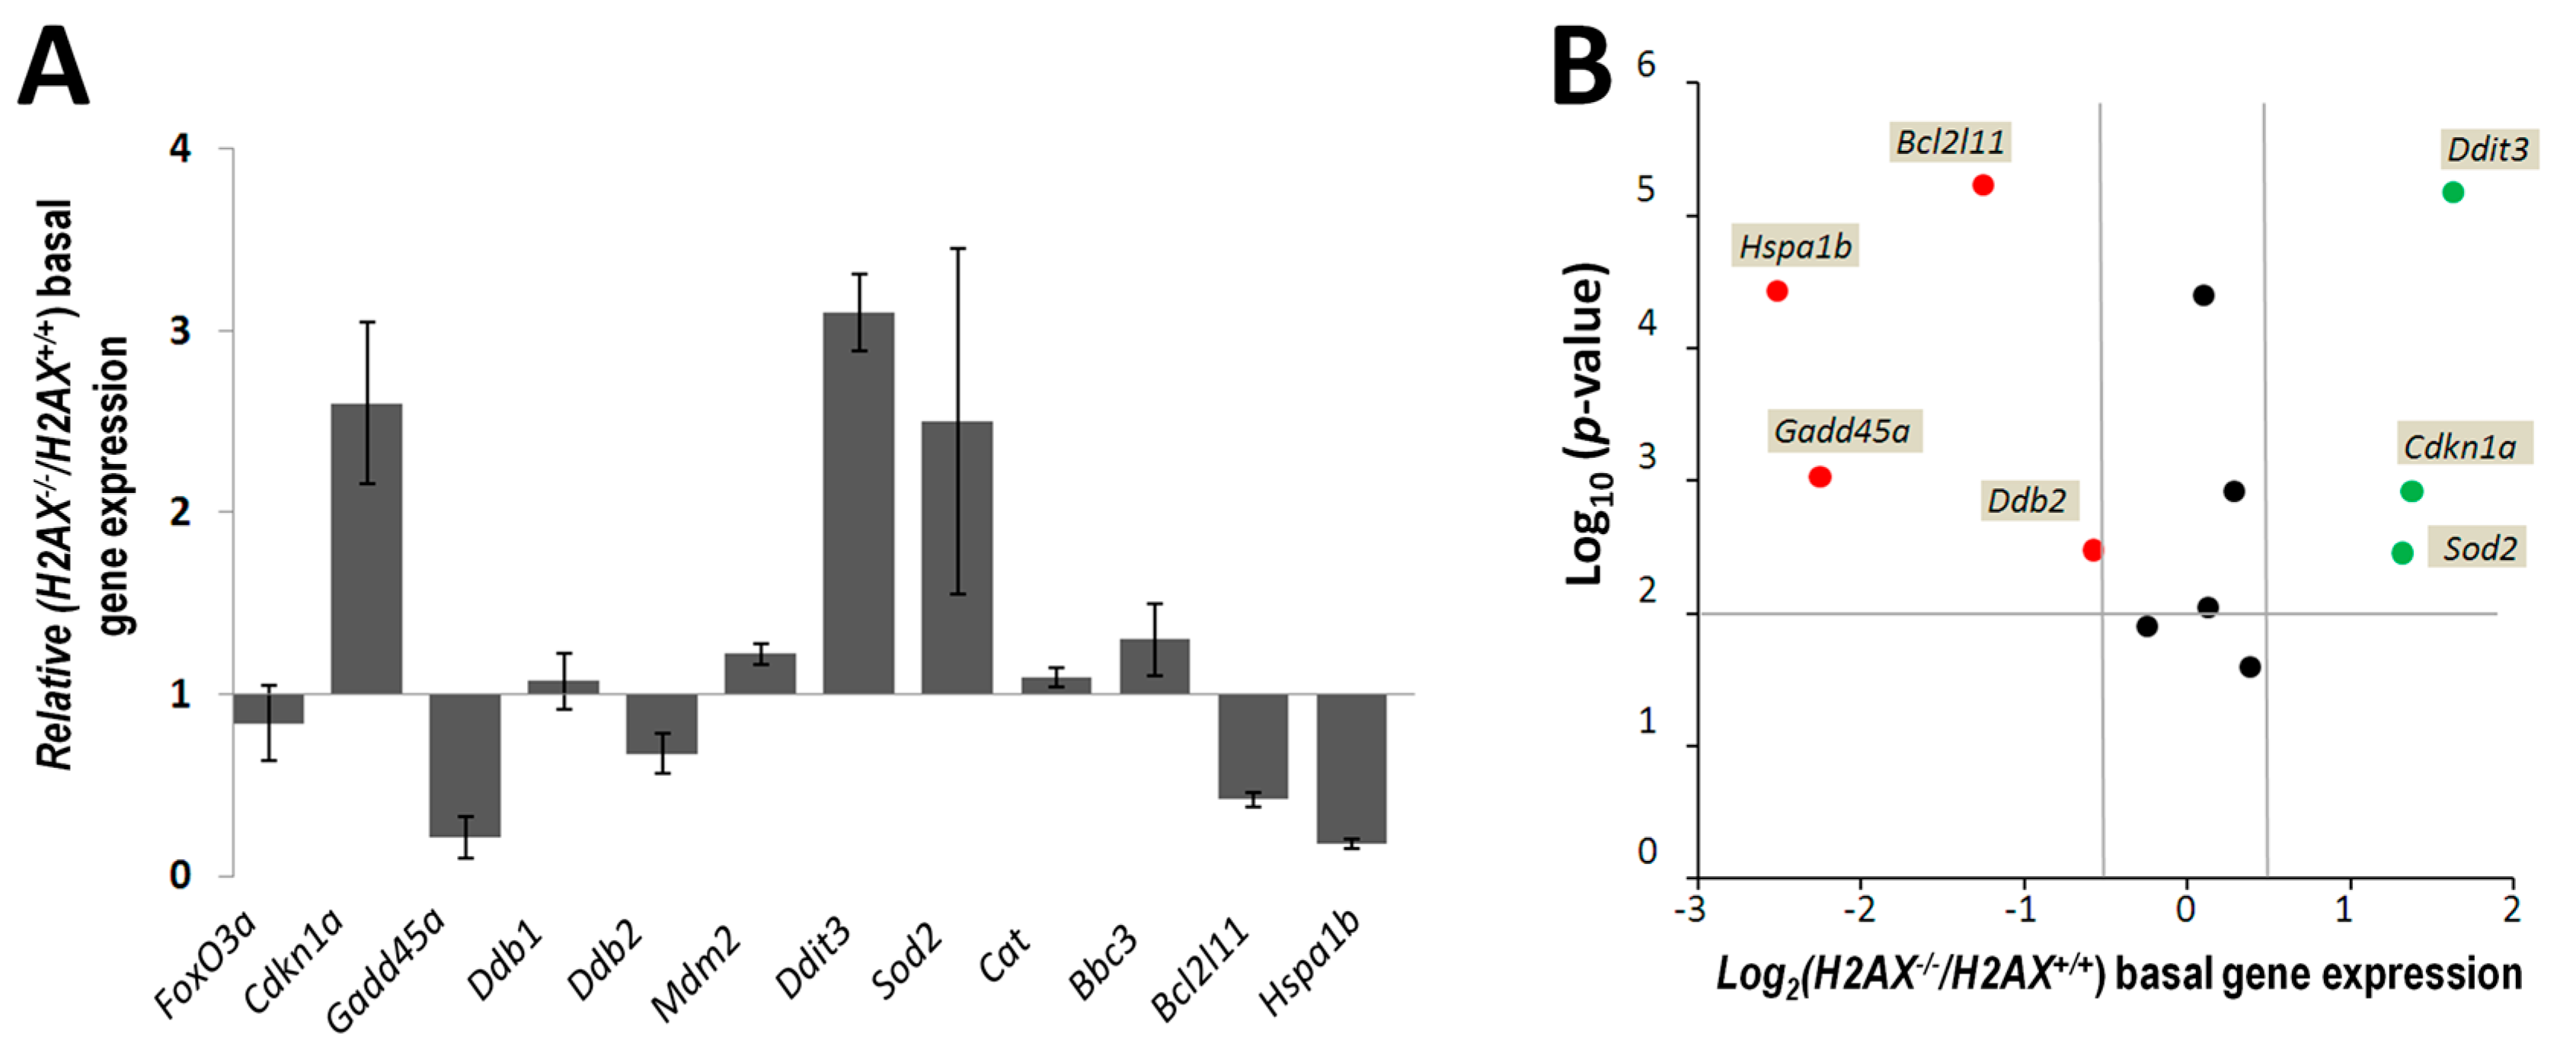
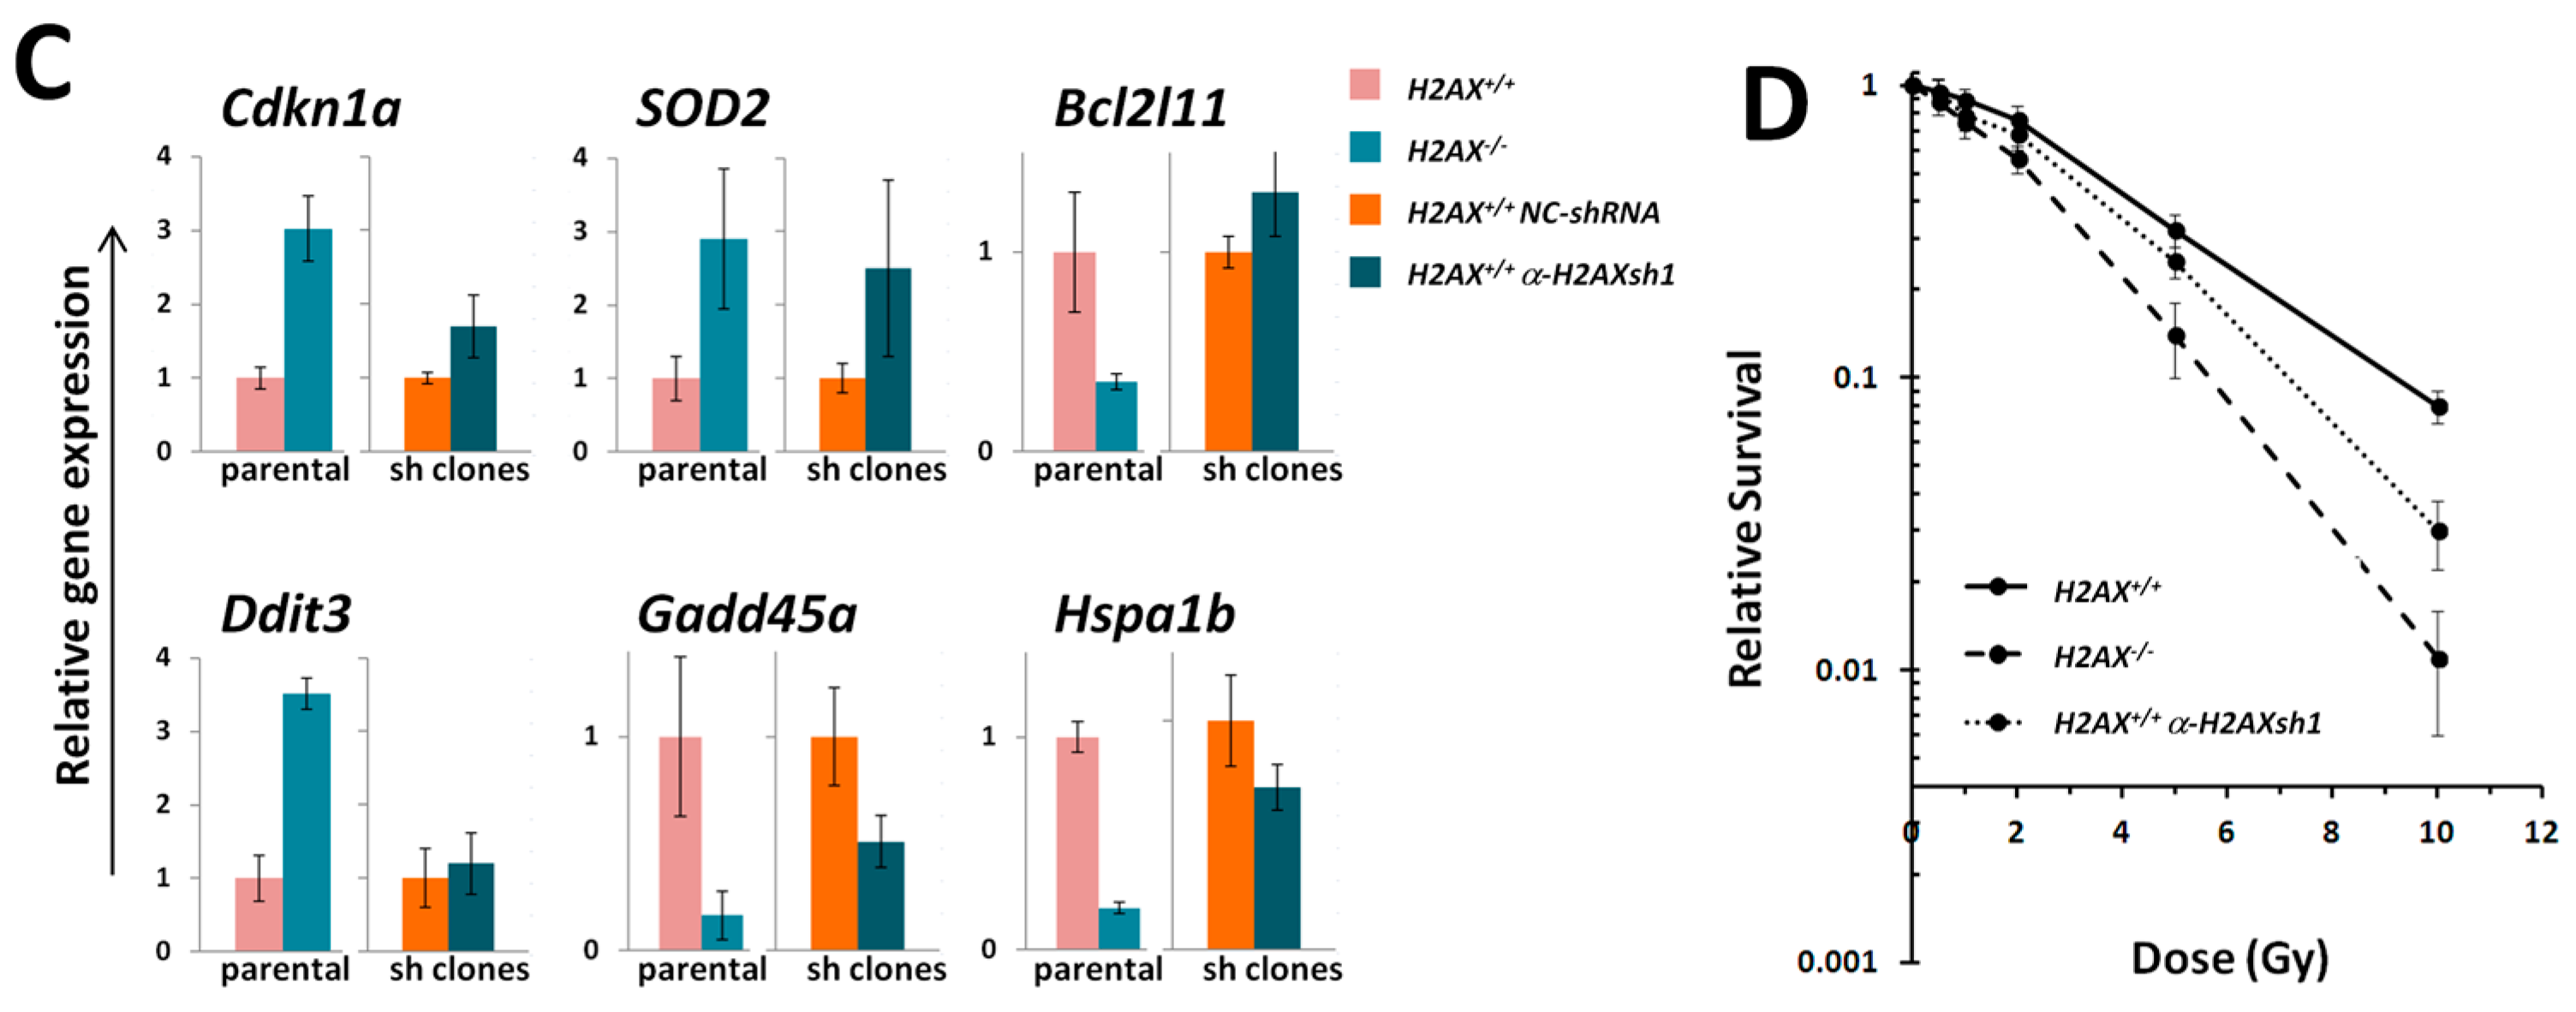
H2AX−/− cells in the basal level of the expression of several genes that are targets for FoxO3a is an indication that unphosphorylated form of H2AX predominant in untreated cells, rather than γH2AX, mediates these differences (
Figure 2). The altered genes include apoptosis mediator
Bcl2l11, chaperone protein gene
Hspa1b, cell cycle regulator
Cdkn1a, and DNA damage and repair genes
Ddit3,
Gadd45α,
Ddb2, and anti-oxidant defense gene
Sod2. Although their role is essential for responses to stressed conditions, even under normal physiological conditions cells are continuously exposed to DNA damaging by-products of oxygen metabolism, reactive oxygen species. Therefore the defense mechanisms are never completely dormant and differences in the way low level damage is coped with may result in significant consequences. Indeed, the
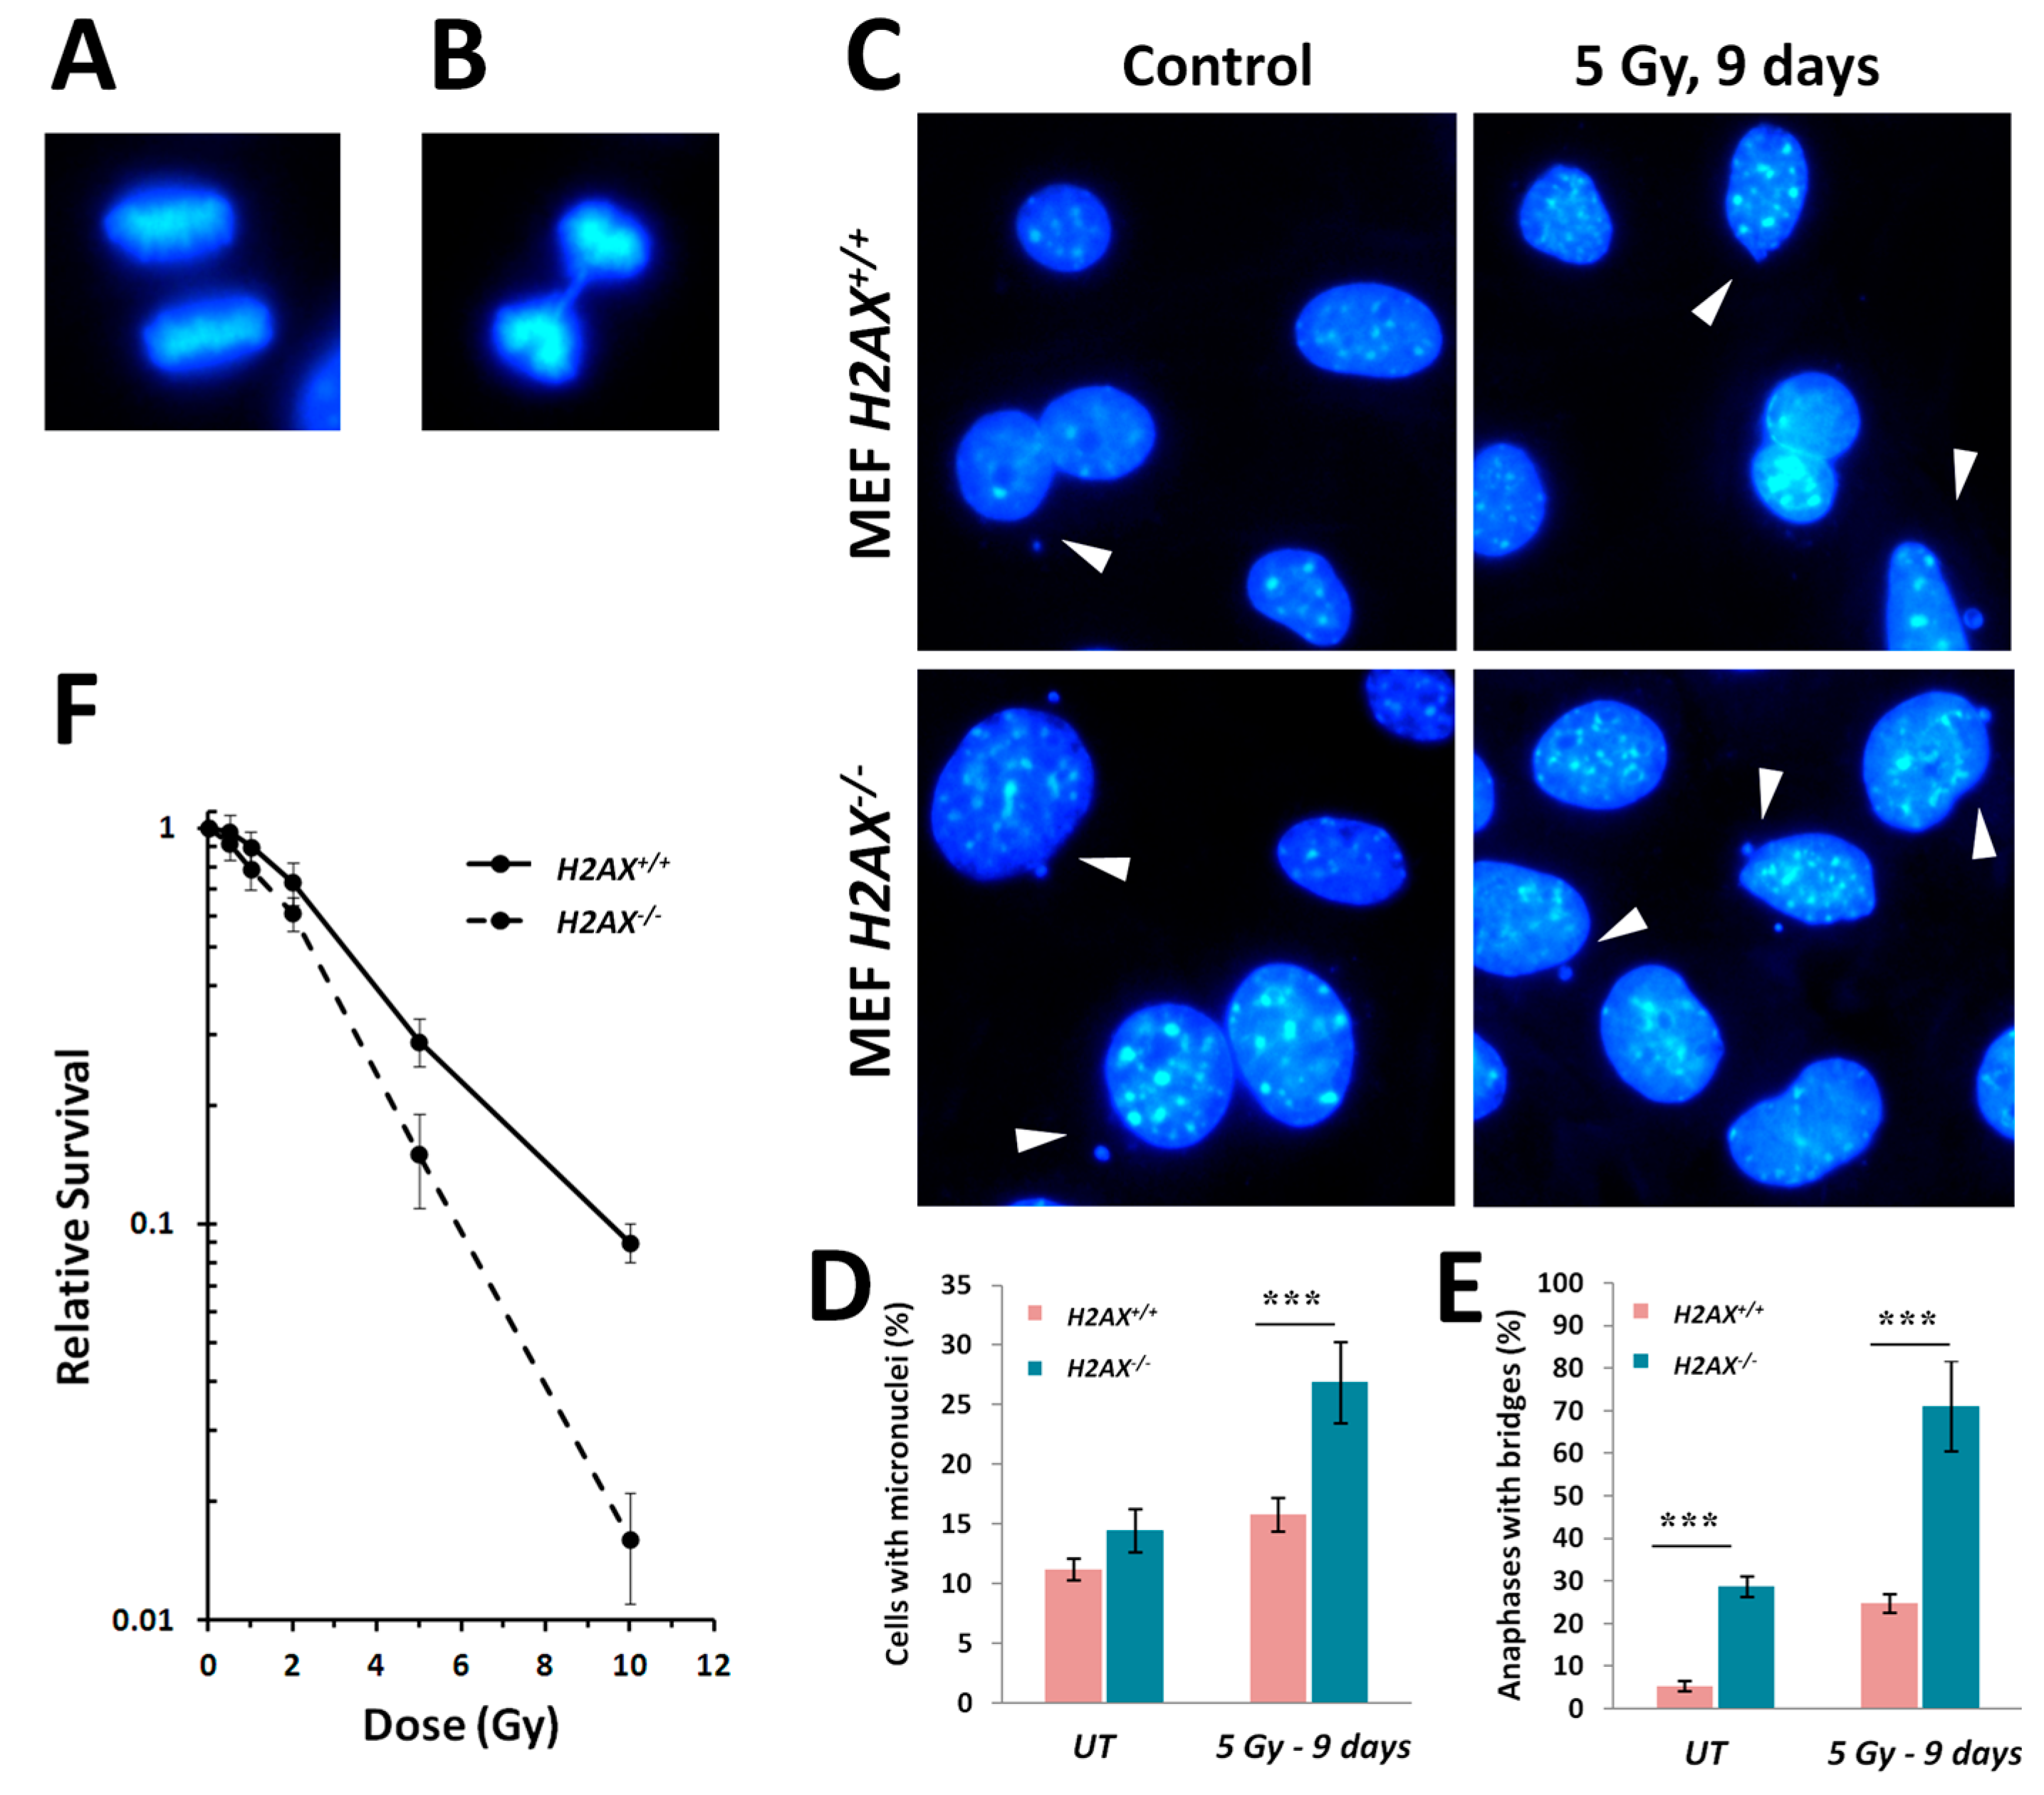
H2AX−/− cells display strikingly higher levels of various markers of genomic instability [
5], such as micronucleated cells and anaphase bridges, compared to wild type cells (
Figure 5). The lack of H2AX has a negative impact on the cells’ ability to repair DNA damage [
5] since γH2AX is known to recruit and sequester DNA repair factors at the broken DNA ends [
35].
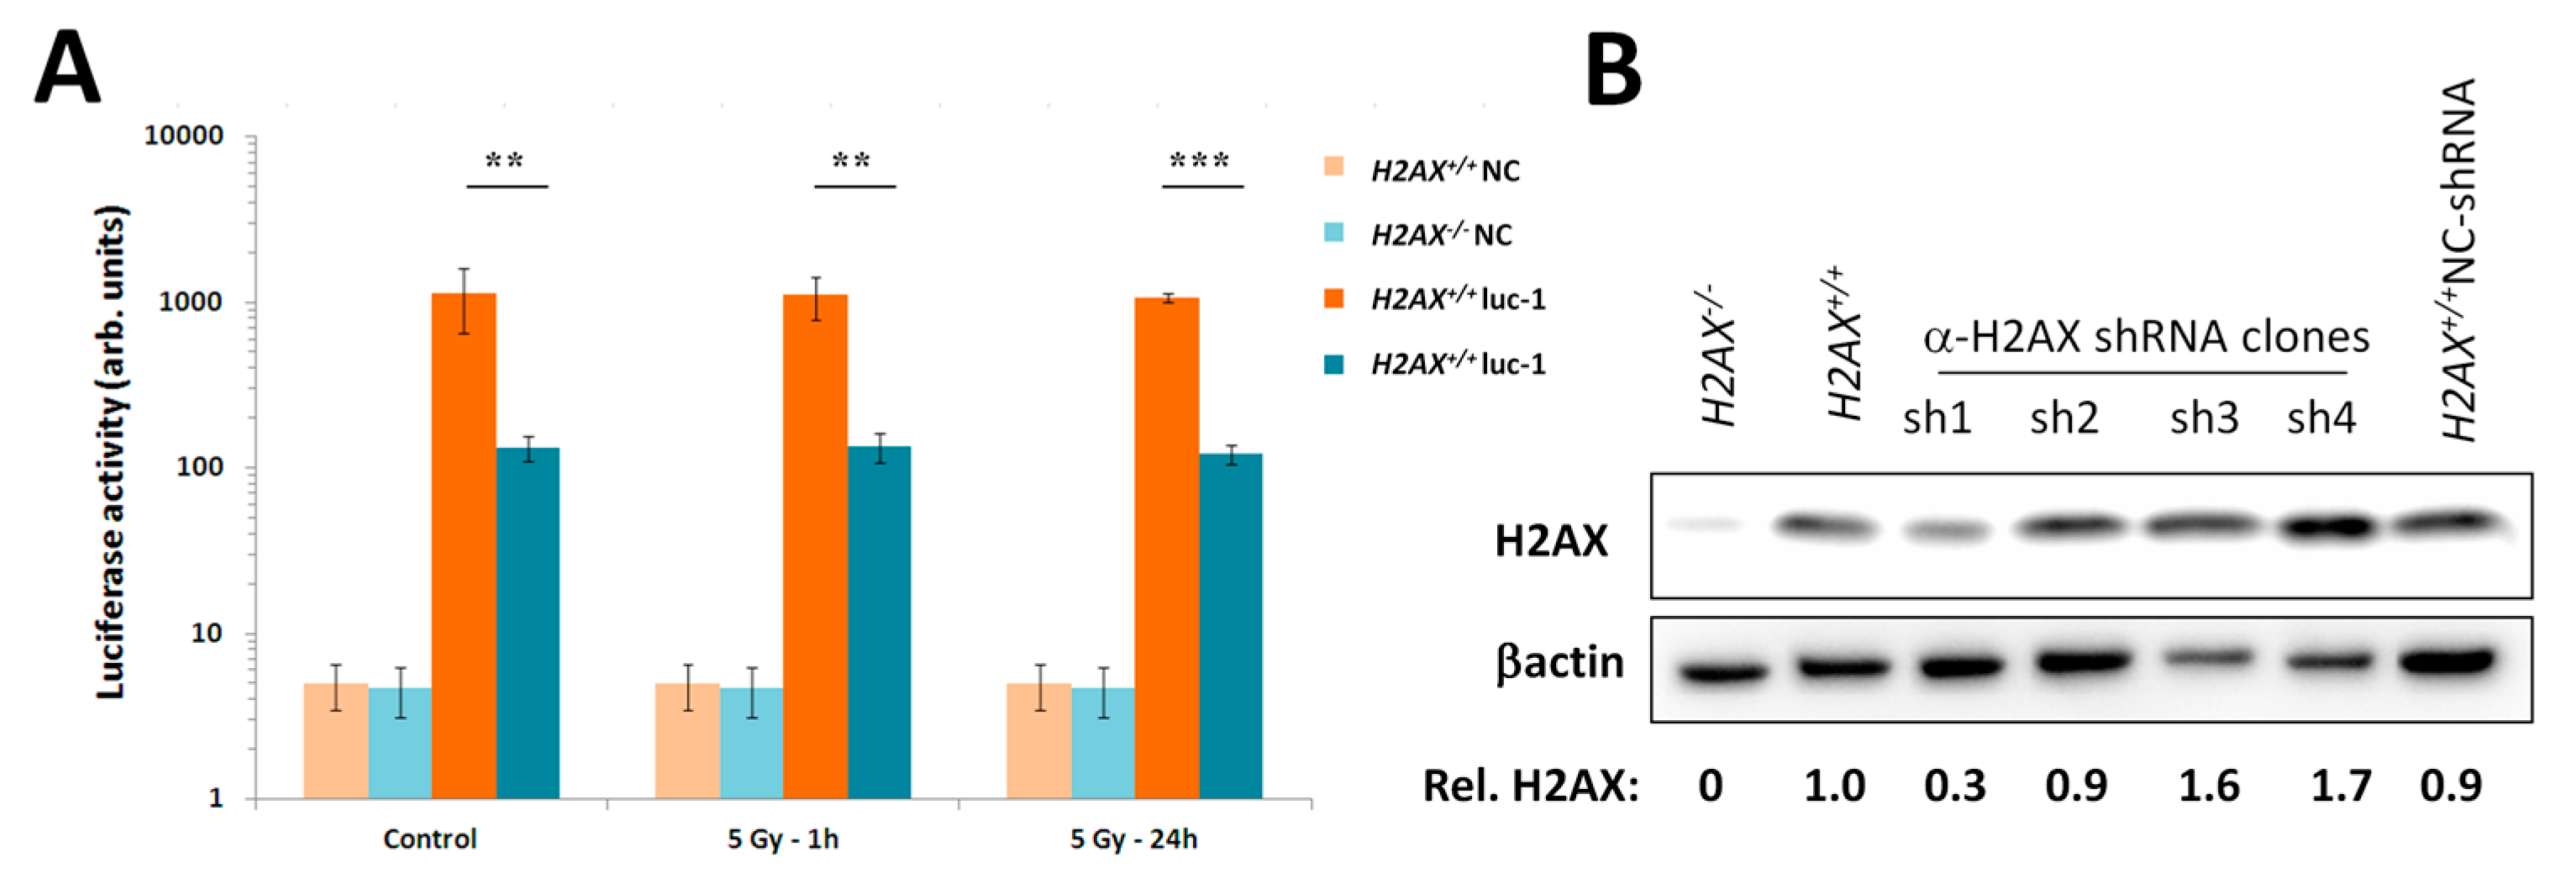
We measured transcriptional activity of FoxO3a directly by using a FoxO3a-driven luciferase reporter gene system and showed that it was lower in the absence of H2AX. In this context, it is important to point out that not all FoxO3a-dependent genes were down-regulated in H2AX knockout cells (down-regulated:
Gadd45α,
Ddb2,
Bcl2l11,
Hspa1b and up-regulated:
Cdkn1a,
Ddit3,
Sod2). While it is unclear how this differential regulation may be executed mechanistically, it is known that FoxO3a can also act as a suppressor of transcription [
36]. Apparently this complex transcription pattern may be chromatin context dependent. One intriguing question is whether it is possible that H2AX is concentrated at the regions of the genes (e.g., those found to be down-regulated in the H2AX deficient cells) so that it directly or indirectly recruits FoxO3a to the genes to initiate transcription. This preferential localization of H2AX does not seem completely unlikely, since transcription start sites were shown to be enriched with H2AX molecules [
37]. This could explain the down-regulation of the expression of genes in cells lacking H2AX. Furthermore, the worms orthologs of
Foxo3,
Daf-16, is able to recruit chromatin remodeling factors to DNA for transcriptional activation [
13], making the proposed sophisticated interaction between FoxO3a and genomic DNA even more feasible.
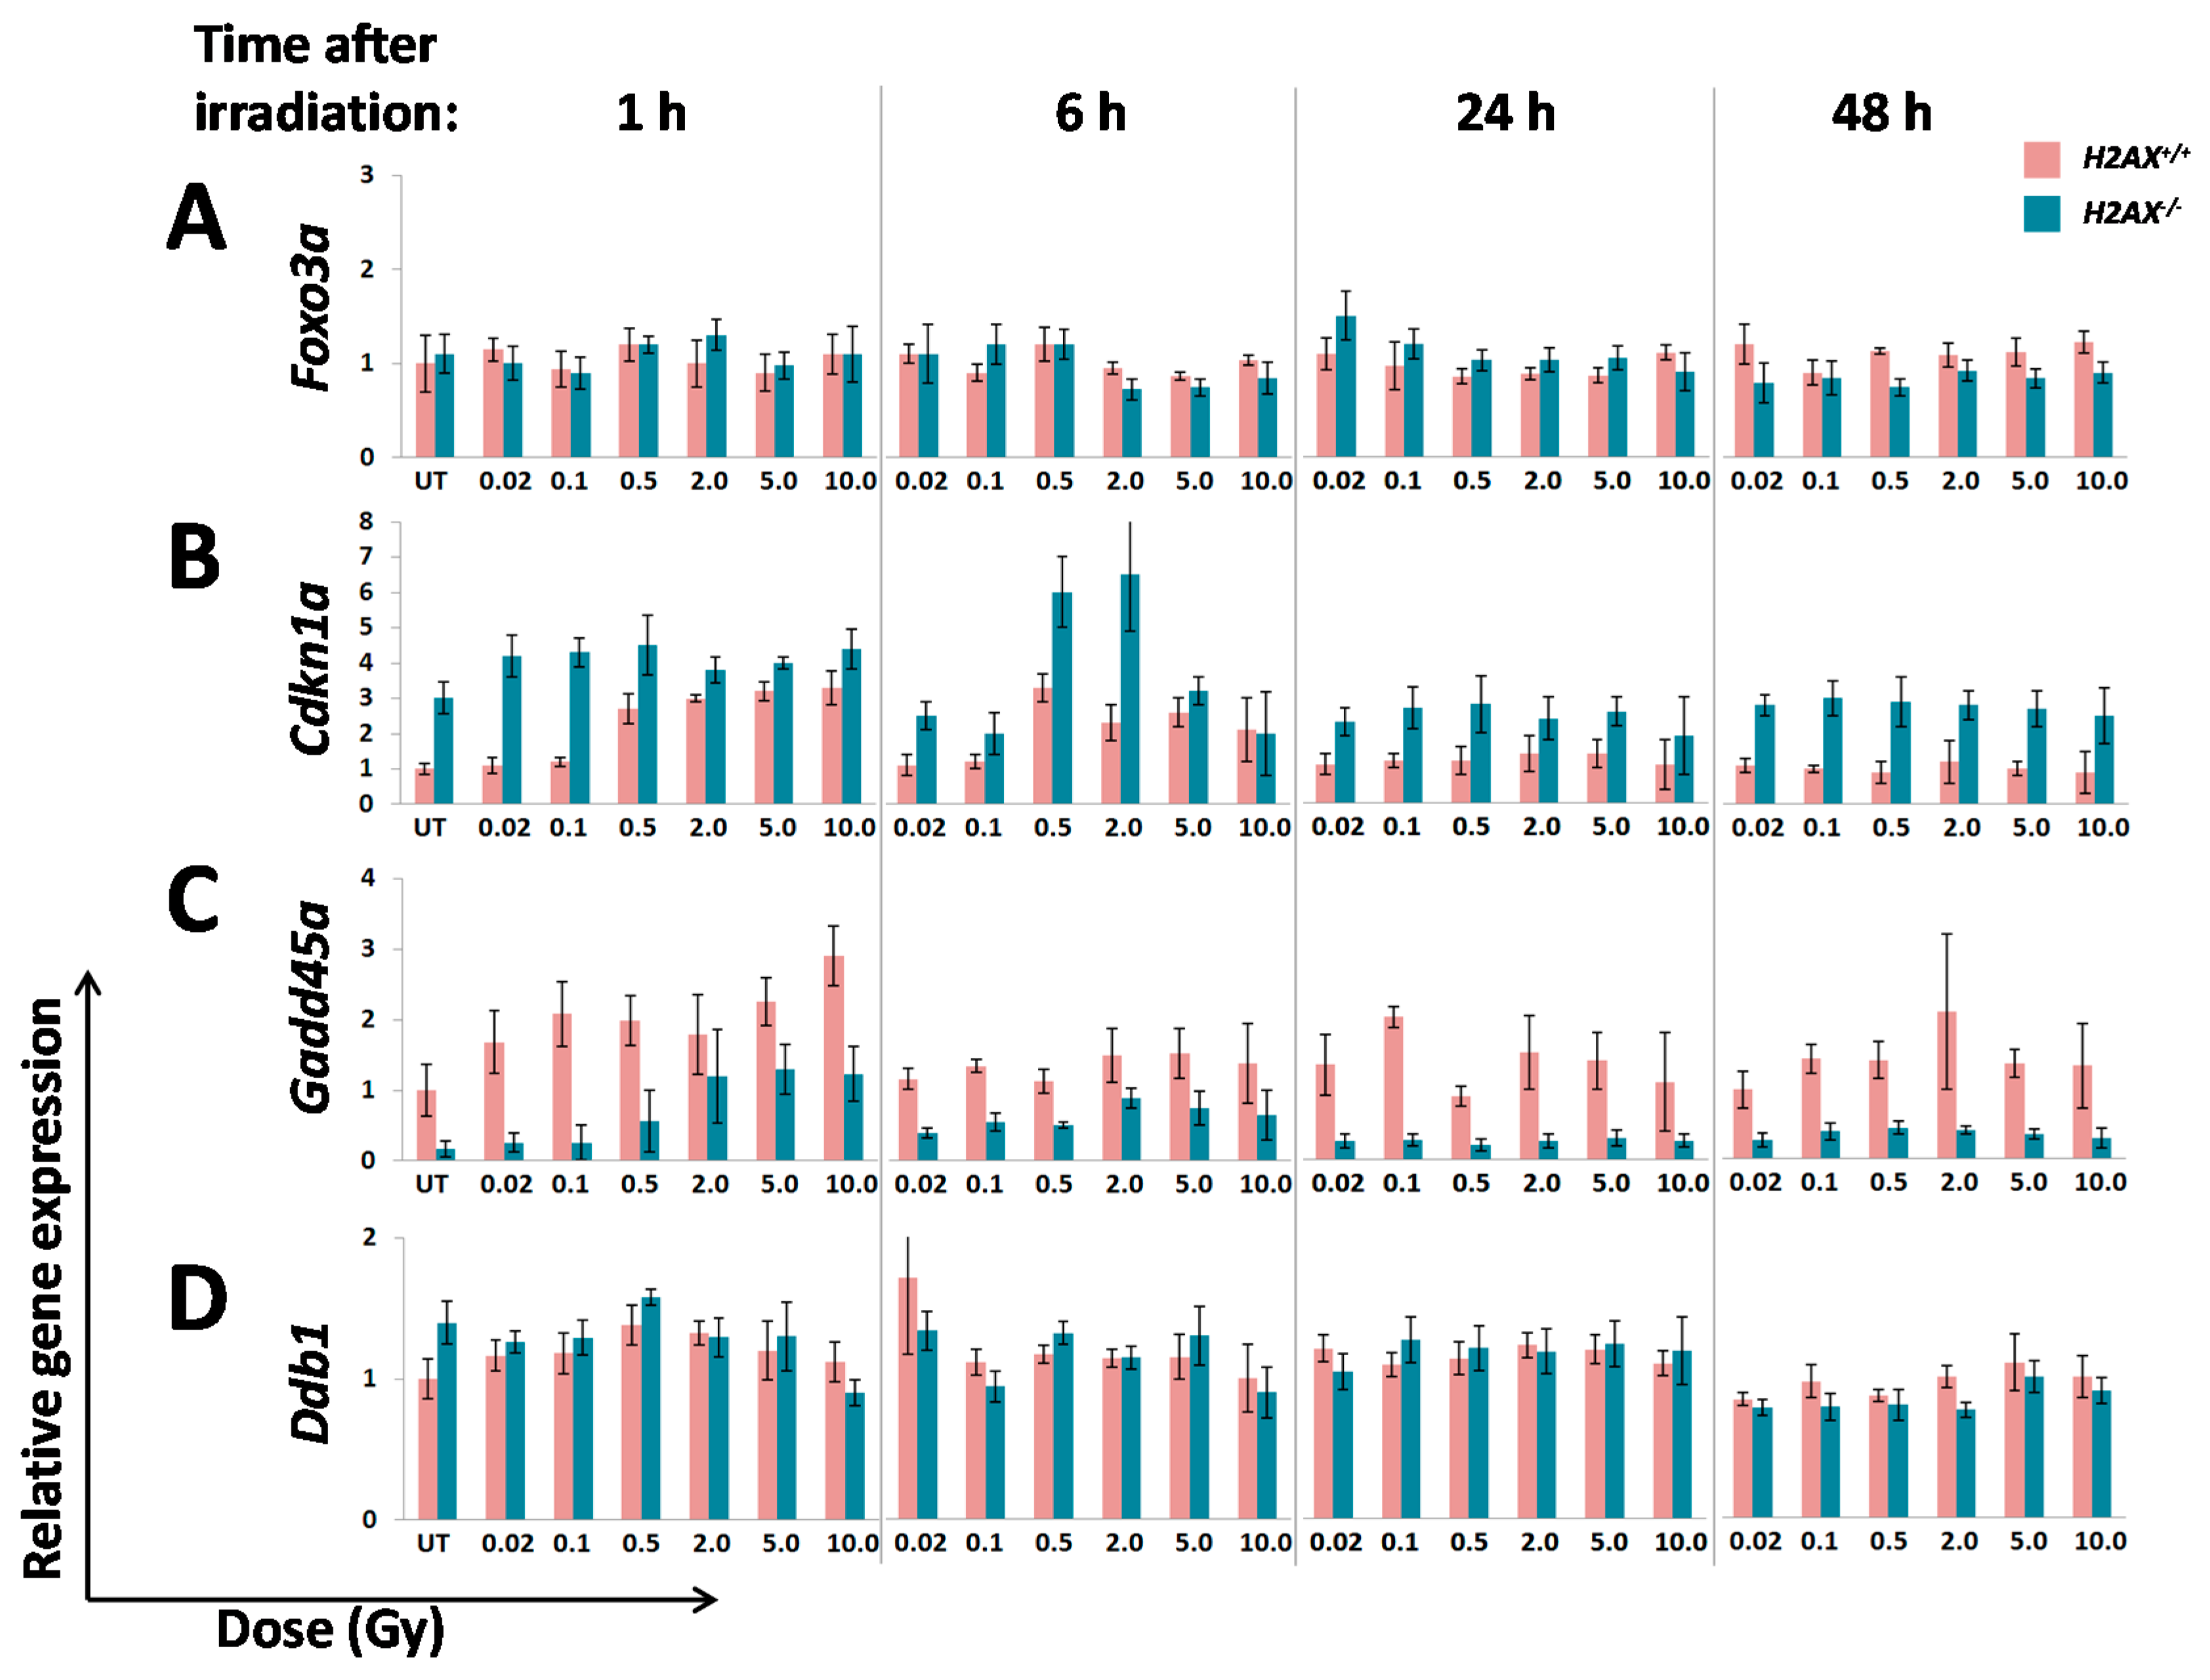
A number of significant differences in transcriptional responses to ionizing radiation that were observed in
H2AX−/− compared to
H2AX+/+ cells can be categorized broadly into the following (
Figure 3):
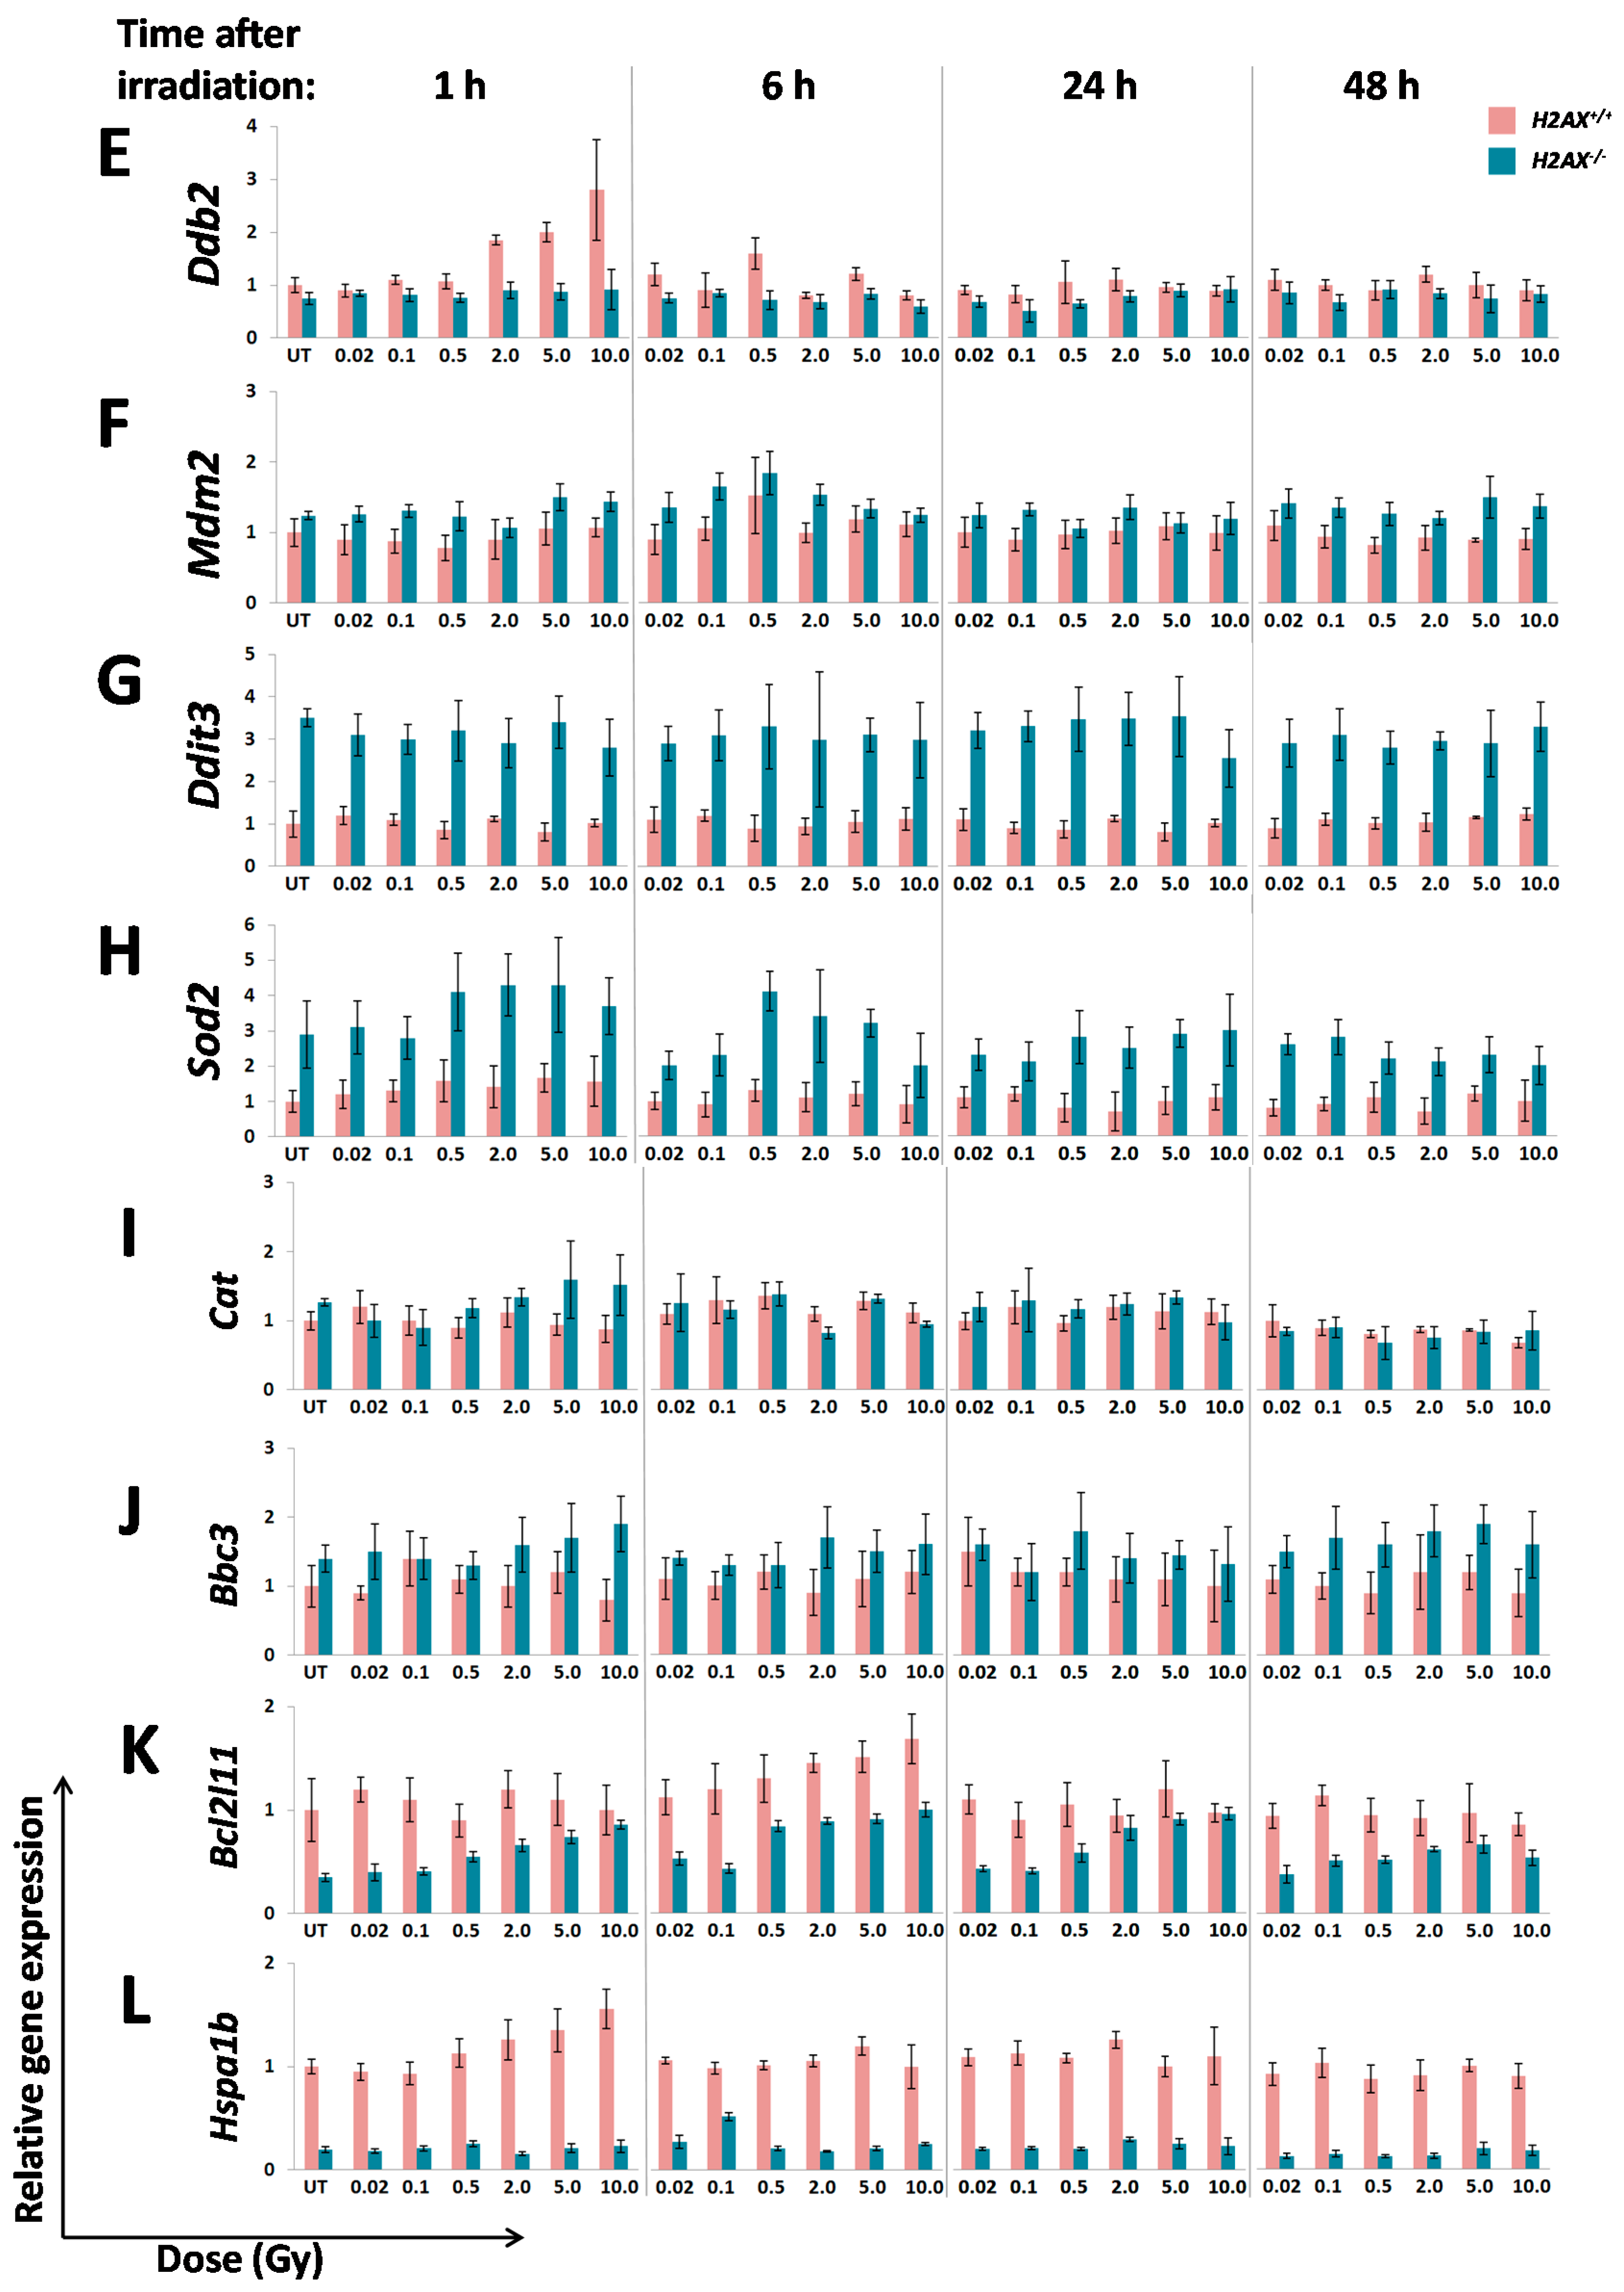
Inability to trigger response (Ddb2, Hspa1b)
Delayed/weaker induction (Cdkn1a)
Prolonged/stronger induction (Gadd45α, Bcl2l11)
In the first category, the
Ddb2 and
Hspa1b genes, represent DNA repair [
38] and protein repair systems [
39]. Lack of the induction of these two genes in response to irradiation and their lower baseline levels, especially for
Hspa1b (that encodes Hsp70 chaperone) that was 5.7-fold lower in H2AX deficiency compared to wild type genotype, may explain genomic instability observed in
H2AX−/− cells, both untreated and irradiated. Indeed, the deficiency in Hsp70 results in genomic instability in mouse embryonic fibroblasts [
40], consistent with our findings.
Interestingly,
Ddb2, in addition to its nucleotide excision repair role, was reported to suppress
Cdkn1a/
p21 expression as a positive feedback in response to stress [
41]. It follows then that lower baseline expression of
Ddb2 in
H2AX−/− cells may lead to the higher than in the wild type control expression of
Cdkn1a (
Figure 2). This may further cause an altered (induction at lower doses due to weaker control) and delayed transcriptional response of
Cdkn1a in H2AX deficiency observed in this study (
Figure 3B).
The two genes in the third category,
Bcl2l11 and
Gadd45α, exert opposing functions in response to stress, with the former being pro-apoptotic, and the latter being a cell cycle regulator and DNA repair facilitator. Thus, stronger induction of both genes in
H2AX−/− compared to
H2AX+/+ cells seems counter-intuitive. It appears then that the levels of
Gadd45α gene induction by irradiation in
H2AX−/− cells may still be not sufficient for it to maintain its protective functions properly; rather lower than normal levels of
Gadd45α may lead to genomic instability [
42]. It is reasonable to assume that a different cellular context in
H2AX−/− cells may define how cells respond to these genes expression levels and changes.
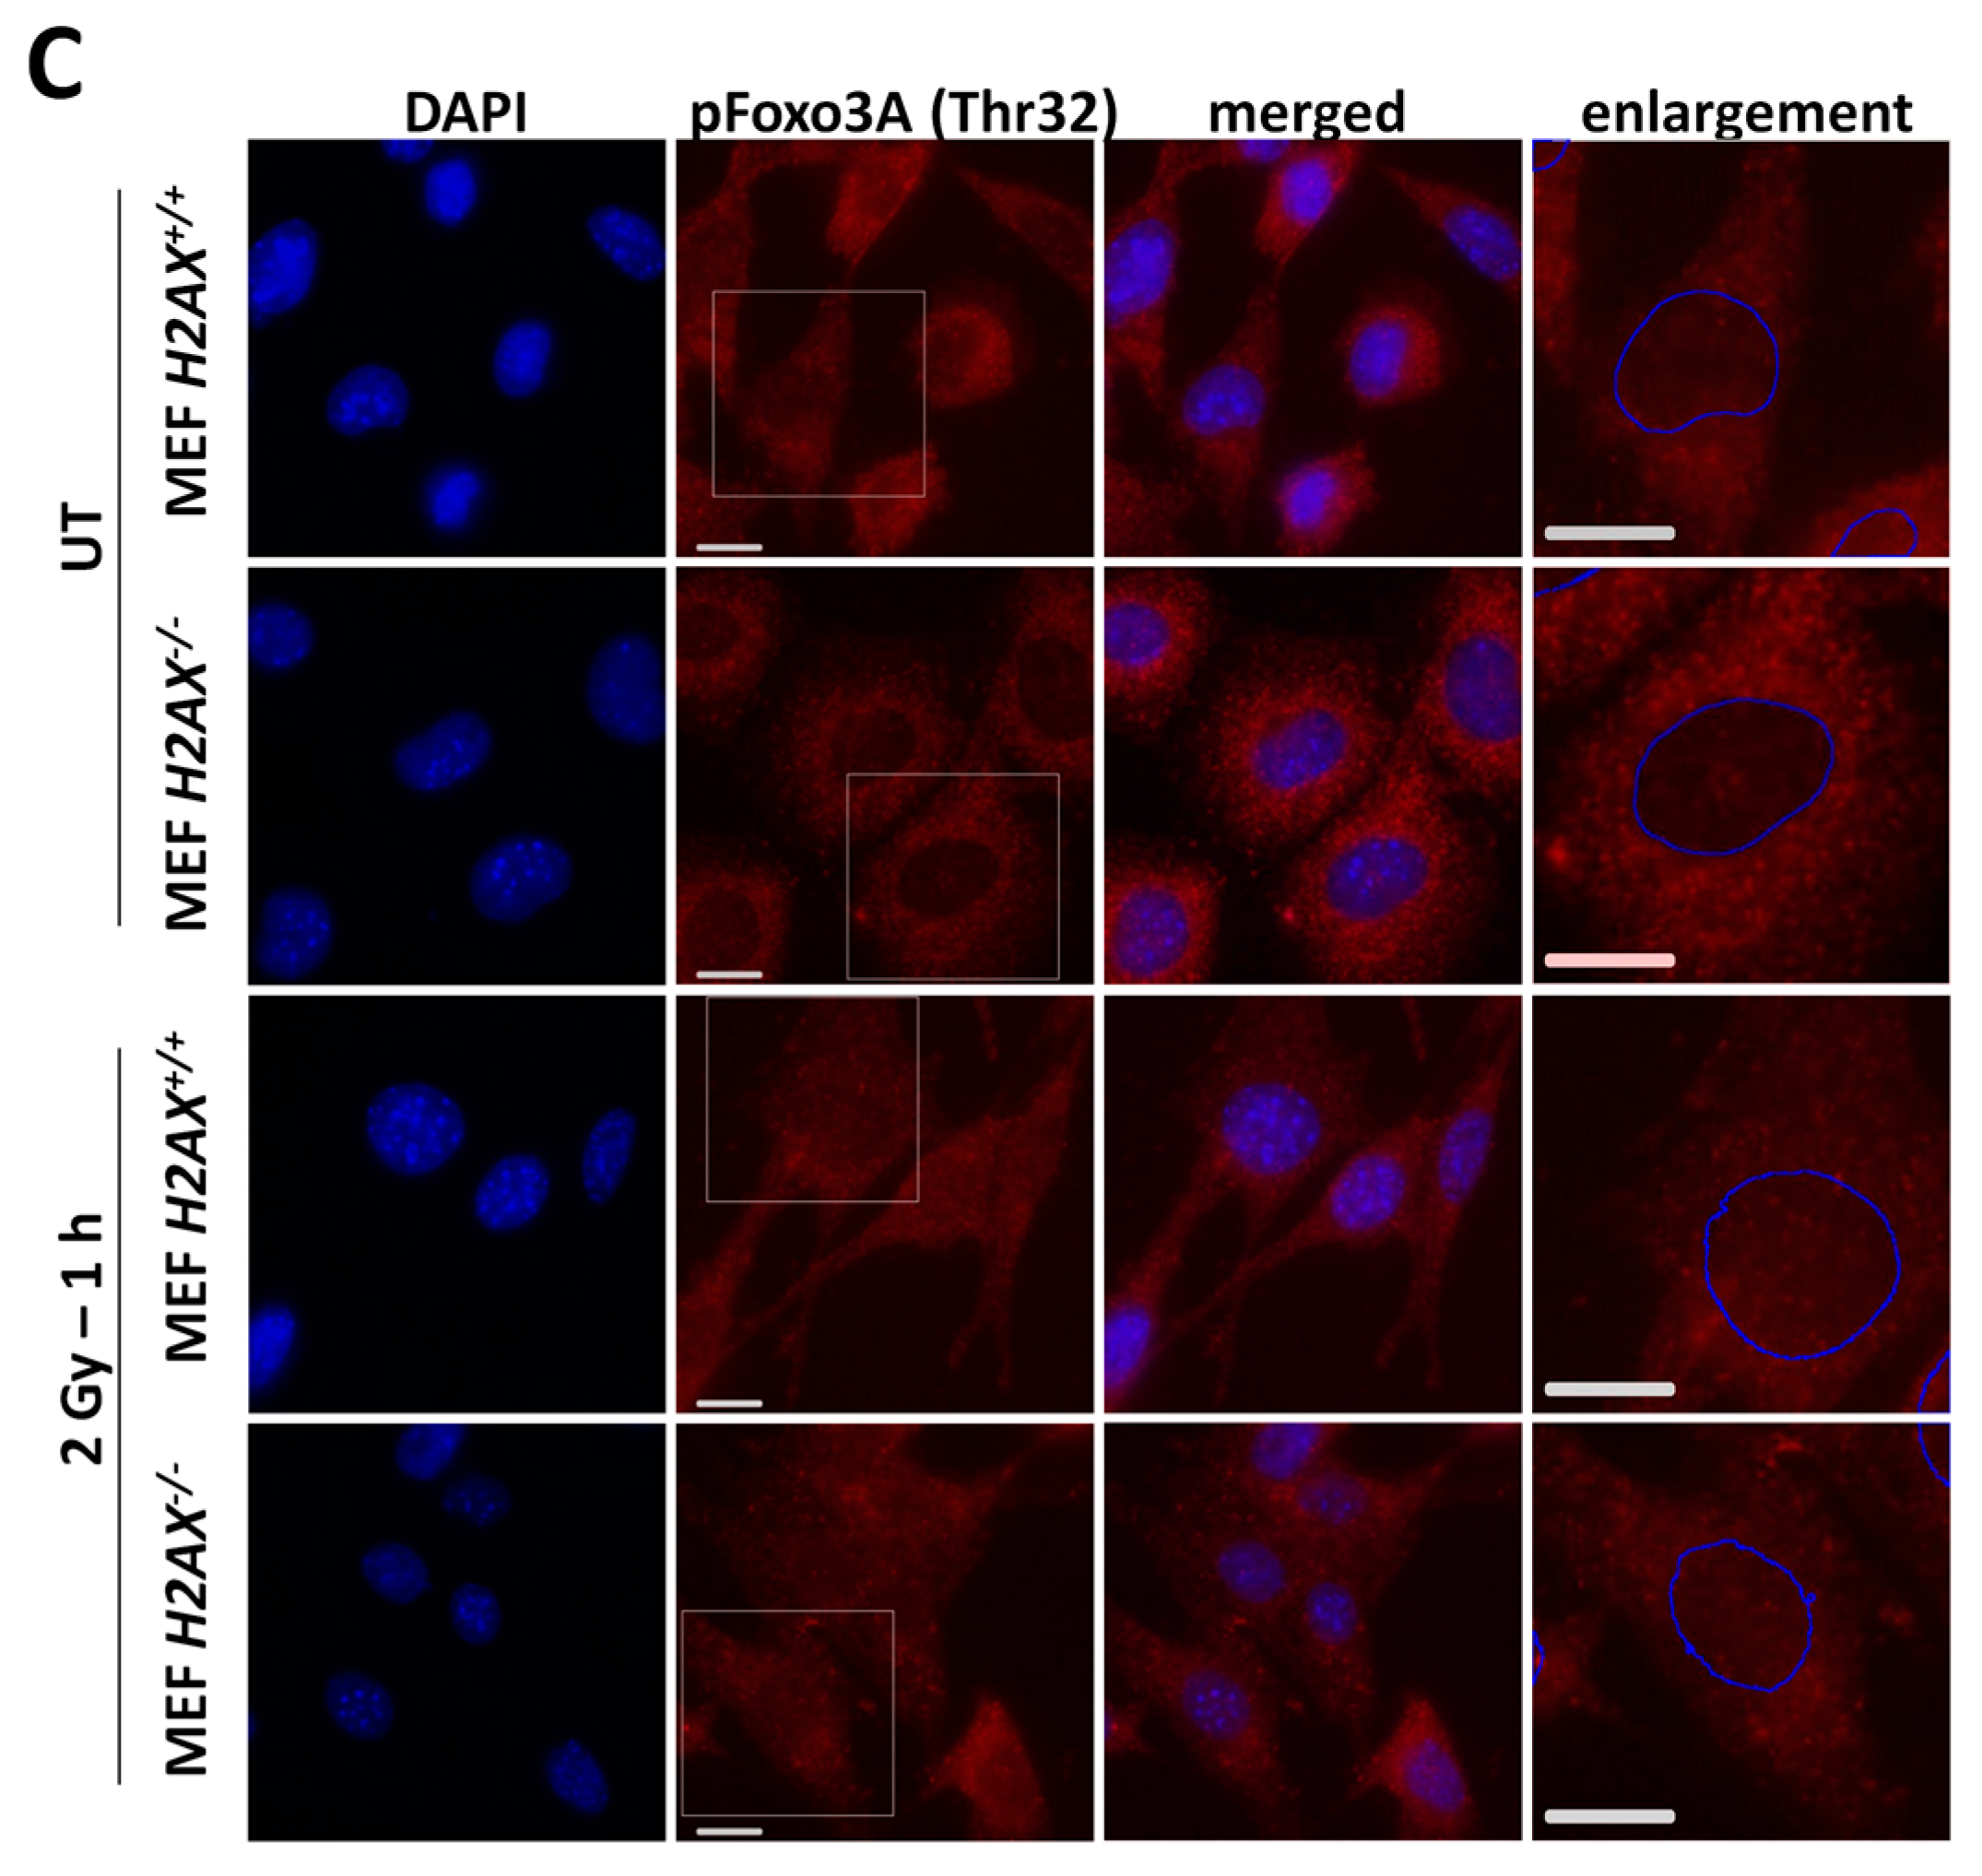
With respect to the question how H2AX deficiency can change FoxO3a transcriptional activity, we demonstrated that phosphorylated form of FoxO3a (Thr32) is at much higher level in the knockout cells. This modification keeps the protein outside of the nucleus [
34] and may prevent excessive apoptotic gene expression driven by FoxO3a [
43]. This may be related to the survival pathway activation in
H2AX−/− cells to counteract increased level of DNA damage and genomic instability. One of the striking differences we found in
H2AX−/− vs. H2AX+/+ cells was that FoxO3a was not able to (a) efficiently translocate into the nucleus of irradiated cells; and (b) form foci that colocalize with pATM foci, pointing to another interesting possibility that transcriptional activity of FoxO3a is related to its interaction with DNA damage response proteins.
Given the increased genomic instability in H2AX−/− cells, their long-term maintenance may have resulted in H2AX-independent changes affecting FoxO3a-dependent pathways. To rule out this possibility, we produced a cell line in which H2AX was knocked down (by 70%) by shRNA technology. Experiments conducted with this cell line within three-weeks of the knockdown (to eliminate selection of H2AX-independent changes) showed that transcriptional pattern of FoxO3a-dependent genes was partially resembling those observed in H2AX−/− cells, suggesting that overall transcriptional changes described in this study are due to the link between H2AX/γH2AX and FoxO3a. Further studies are warranted to gain mechanistic knowledge into the details of how H2AX/γH2AX exerts its effects on FoxO3a-regulated pathways.
4. Experimental Section
4.1. Cell Cultures and Irradiations
Mouse embryonic fibroblasts (MEF) of C57BL background (kindly provided by Nussenzweig, NIH, Bethesda, MD, USA) were maintained by weekly sub-culturing in Dulbecco’s Modified Eagle’s Medium (DMEM) (HyClone, South Logan, UT, USA), supplemented with 10% foetal bovine serum (FBS) (Gibco, Invitrogen, Grand Island, NY, USA), at 37 °C in a 5% CO2—95% air atmosphere. Sub-confluent, exponentially growing MEF cells were used in experiments. One day prior to irradiation, 1–2 × 10⁶ cells were seeded onto 100 cm Petri dishes. The cells were irradiated at room temperature using either a γCell-200 irradiator (Atomic Energy Canada Limited, Chalk River, ON, Canada) equipped with 60Co γ-ray source at a dose rate of 100 mGy/min (for doses of 0.02 and 0.1 Gy) or a γCell-220 irradiator (Atomic Energy Canada Limited) equipped with 60Co γ-ray source at a dose rate of 4.5 Gy/min (for doses of 0.5 Gy and up). Immediately after irradiation the cell cultures were returned to the CO2-incubator and incubated for various times before sampling.
4.2. Cell Growth Assay
To determine cell growth kinetics, cells were seeded onto wells of a black CELLSTAR 96-well plate (Greiner Bio-One, Solingen, Germany) at a density of 1000 cells per well. Three wells per cell line per day of a 6-day experiment were used. Six hours later (sufficient time for cells to attach to surface), cells in the first three wells for day = 0 time-point were fixed in methanol for 60 s and stained with 0.05 μg/mL DAPI in PBS in a biological safety cabinet so that cells in the remaining wells can further be used for subsequent days. The 96-well plate was then removed back to the incubator. On subsequent days, similar procedure was performed for corresponding wells. At the end of the experiment, the plate was imaged using ImageXpress Micro high content analysis system (Molecular Devices, Sunnyvale, CA, USA) at 10× magnification. Cell numbers were determined using the “Count Nuclei” module within the MetaXpress software (Molecular Devices). Cell numbers relative to day = 0 were then determined and plotted as a growth curve.
4.3. Luciferase Reporter Assay
To avoid the negative influence of transduction efficiency on experimental results, stable cell lines expressing luciferase reporter construct were generated using Cignal Reporter Assay System (Qiagen, Valencia, CA, USA). To this end, 50% confluent MEF H2AX+/+ and H2AX−/− cells were transduced with lentiviral particles containing a luciferase gene under the control of a FoxO-responsive promoter at 50 MOI for 24 h in DMEM supplemented with SureENTRY reagent (Qiagen). Twenty four hours later, DMEM with 25 μg/mL puromycin (Sigma, St. Louis, MO, USA) was added to cells and cell lines stably expressing the genetic constructs (both FoxO-luc and negative control) were generated by serial dilution and clonal expansion under puromycin selection. For irradiation experiments, cells were seeded onto wells of a 96-well plate at 5000 cells per well and irradiated a day later. Cells were then lysed in reporter lysis buffer (Promega, Madison, WI, USA) and luciferase activity was determined in triplicate whole cell lysates using the Luciferase Assay System (Promega). Luminescence was measured using Glomax 96-well plate luminescence reader (Promega) and luciferase activity was expressed as arbitrary units (equivalent of relative light units).
4.4. Generation of Stable H2AX Knockdown Cell Lines
Five thousand MEF H2AX+/+ cells were seeded onto wells of a 96-well plate. Next day, lentiviral particles containing a construct that encodes a shRNA hairpin targeting H2AX (Santa Cruz Biotechnology, Santa Cruz, CA, USA, sc-62464-V) were added to 50% confluent cells at 40 MOI (multiplicity of infection), along with the Polybrene supplemented DMEM. Cells were transduced for 24 h, after which puromycin was added at a concentration of 25 μg/mL. In parallel, cells were transduced with negative control lentiviral particles. Stable clones were generated by serial dilution and expansion in puromycin supplemented DMEM. Clones were screened for knockdown efficiency by Western blot.
4.5. RNA Extraction and cDNA Synthesis
RNA was extracted using Aurum Total RNA Mini kit (Bio-Rad, Hercules, CA, USA) as per manufacturer’s recommendations. Extracted RNA was immediately quantified and its quality evaluated using a lab-on-chip capillary automated electrophoresis system Experion (Bio-Rad). Samples with a RQI (RNA Quality Index) of 8 and above were used for further experimentation. To control for possible inhibition of reverse transcription reactions, Solaris RNA Spike Control kit was used (Thermo Scientific, Rockford, IL, USA). Briefly, a synthetic RNA molecule (Solaris™ RNA Spike Control, Rockford, IL, USA) was added to RNA samples and water control, followed by a reverse transcription reaction using iScript Reverse Transcription Supermix (Bio-Rad) as per manufacturer’s instructions. Only fresh unfrozen RNA was used. The Spike cDNA was then quantified using Solaris qPCR RNA Spike Assay (Thermo Scientific) according to the manufacturer’s instructions. The level of reverse transcription inhibition is estimated based on a comparison of Cq values between water and RNA samples using a formula ∆Cq = Cq(RNA sample) − Cq(water sample). Samples with no significant inhibition of reverse transcription (∆Cq < 3) were used for subsequent qPCR to quantify the expression levels of the genes of interest.
4.6. Quantitative Real-Time PCR
Pentaplex qPCR assays were designed using the online RealTimeDesign tool (
www.qPCRdesign.com, BioSearch Technologies, Novato, CA, USA). Three genes of interest and two housekeeping genes were included into each qPCR pentaplex assay. The software conducts a sophisticated analysis of standard primer features and interactions between primers and probes. Dual labeled probes quenched with the Black Hole Quencher™ dye (BHQ, BioSearch Technologies, Novato, CA, USA) were used.
Table S1 shows target genes included into each pentaplex assay, primer and probe sequences, melting temperatures and validation results. The pentaplex assays were experimentally validated by generating standard dilution curves for individual assays that were part of the pentaplex assays and by comparing these curves with the ones generated with the pentaplex assays. Temperature gradient reactions were also run to determine the optimum reaction conditions. All amplification reactions were conducted on a CFX96 PCR Detection System (Bio-Rad) equipped with a 5-channel optical module. The reaction mix contained 10–30 ng cDNA, derived from total RNA, primers (400 nM each), probe (200 nM), and ImmoMix master mix (Bioline Inc., Taunton, MA, USA) in a final volume of 20 μL. The following PCR cycling conditions were used: 95 °C for 10 min, 40 cycles of 95 °C for 10 s, 60 °C (or 55–65 °C gradient) for 10 s, 72 °C for 25 s. As a result of this experimental validation, three out of five pentaplex assays were reduced to quadruplex assays since
Pparg,
Tnfsf10 and
G6pc genes could not be reliably detected within their corresponding pentaplex assays (
Table S1). Each reaction was run in triplicate and mean
Cq values were used for the evaluation of the gene expression levels by comparing the results produced for the irradiated groups with those produced for the untreated control. Relative expression was calculated using ∆
Ct method. Multiplexed qPCR data were normalized to the internal standards
Actinβ and
GAPDH. Data were analyzed using CFX Manager software (Bio-Rad) and Excel (Microsoft Corp., Redmond, WA, USA).
4.7. Immunoblotting
MEFs were collected by trypsinization and subsequent centrifugation followed by the lysis in RIPA buffer (20 mM Tris pH 7.5, 150 mM NaCl, 1 mM EDTA, 1% NP-40, 0.5% sodium deoxycholate, 0.5% Sodium Dodecyl Sulphate containing protease and phosphatase inhibitors (Roche Diagnostics, Mannheim, Germany)). Total protein concentrations in the lysates were determined using the RC DC (reducing agent and detergent compatible) protein assay kit (Bio-Rad) by measuring absorption at 750 nm on the iMark microplate reader (Bio-Rad). For each sample, a total of 30 μg of protein was resolved on 4%–15% gradient mini-Protean precast polyacrylamide gels and transferred to PVDF membranes (Bio-Rad). After blocking with 5% skim milk in TBST (0.2% Tween-20 in TBS) for 1 h, the membranes were incubated overnight at 4 °C with the primary antibodies diluted in TBST with 5% skim milk. The primary antibodies used were monoclonal anti-γH2AX (phospho S139, Abcam, 9F3, 1:500 dilution), monoclonal anti-ATM (phospho S1981, Abcam, 10H11.E12, 1:250 dilution), polyclonal rabbit anti-H2AX (Abcam, ab11175, 1:2000 dilution), polyclonal rabbit anti-FoxO3a (Millipore; #07-702, 1:500), polyclonal rabbit anti-FoxO3a (phospho-Thr32, Cell Signaling; #9464, 1:1000), monoclonal mouse anti-b-actin (Santa Cruz Biotechnology; sc-47778, 1:3000 dilution). The membranes were then rinsed three times in TBST and incubated for 1 h at room temperature with corresponding secondary goat ant-mouse HRP-conjugated antibody (Sigma-Aldrich, St. Louis, MO, USA). Following three rinses in TBS, chemiluminescence was initiated by incubating the membranes with Immun-Star Western C reagent (Bio-Rad). Chemiluminescence reactions on membranes were imaged using Chemidoc XRS imager (Bio-Rad), followed by processing of the chemiluminescence images using ImageLab (Bio-Rad) or Image J (NIH) software applications.
4.8. Immunofluorescence Microscopy
Exponentially growing MEF cells were seeded onto 30 mm diameter Petri dishes containing 22 mm × 22 mm sterile glass coverslips and allowed to attach overnight. The next day, cells were irradiated using the γCell-220 irradiator as described above. One hour after the irradiation the cells were fixed in 2% paraformaldehyde/TBS for 30 min at room temperature. At the time of fixation, cell cultures were 40%–60% confluent. Cells were then rinsed in TBS and −20 °C methanol was added to cells for 1 min, followed by blocking step using TTN buffer (1% BSA, 0.2% Tween-20 in TBS) for 30 min at room temperature. For γH2AX detection, coverslips with cells were incubated with anti-γH2AX mouse antibody (phospho S139, Abcam, 2F3) diluted 1:600 in TTN for 2 h at room temperature. After rinsing with TBS and blocking with TTN for 20 min, cells were stained for 1 h at room temperature with secondary goat anti-mouse Alexa-488 antibody (Invitrogen, Life Technologies, Camarillo, CA, USA) at a 1:600 dilution in TTN. For FoxO3a and pATM detection, cells were incubated with a mixture of rabbit polyclonal anti-FoxO3a antibody (Santa Cruz Biotechnology, sc-11351) and mouse monoclonal anti-pATM antibody (phospho-Ser1981, Millipore, Temecula, CA, USA, 10H11.E12) diluted 1:100 and 1:400 in TTN, respectively. Following 2 h incubation with the primary antibodies, a mixture of goat anti-mouse Alexa-488 and goat anti-rabbit Alexa-594 antibodies (Invitrogen, Life Technologies) both diluted 1:400 in TTN was added to cells for 1 h at room temperature. For pFoxO3a detection, coverslips were incubated with anti-pFoxO3a antibody (phospho-Thr32, Cell Signaling; #9464) diluted 1:100 in TTN for 2 h, followed by a goat anti-rabbit Alexa-594 antibody (Invitrogen, Life Technologies) incubation for 1 h at room temperature. After staining with secondary antibodies, coverslips were rinsed 3 × 10 min, immersed in 0.05 μg/mL DAPI in TBS, mounted on microscope slides using Vectashield mounting medium (Vector Laboratories, Burlingame, CA, USA) and then sealed with nail polish. Slides were analyzed using a Zeiss AxioObserver Z1 fluorescence inverted microscope equipped with AxioCam iCc1 CCD camera (Zeiss, Chester, VA, USA). Five optical Z-sections per nucleus were captured using a Plan-Apochromat 63× objective and AxioVision 4.8.1 software package (Zeiss, Chester, VA, USA), and the images were generated by projection of a maximum intensity algorithm using Image J software. Images of DAPI fluorescence were used to generate the nuclear perimeter outlines by using the threshold tool in Image J. Quantification of cytoplasmic and nuclear localization of pFoxO3a (Thr32), as well as generation of merged images for FoxO3a and pATM colocalization study, was done using Image J. Two hundred cells per group per experiment were used for nuclear:cytoplasmic pFoxO3a quantification. Cells stained with secondary antibody alone were used to control green and red fluorescence signal specificity.
4.9. Evaluation of Genomic Instability
Exponentially growing cells in 100 mm Petri dishes were sham- or γ-irradiated with 5 Gy using the γCell-220 irradiator as described above. Cells were then maintained for 9 days with sub-culturing on days 3 and 7 post-irradiation. Media was changed every two days to avoid cytotoxicity caused by dying cells in irradiated cultures. On day 7, cells were seeded onto 22 mm × 22 mm sterile glass coverslips inside 30 mm Petri dishes and incubated for another two days reaching 40%–60% confluency (number of irradiated cells for plating had to be significantly increased compared to untreated cells due to cell cycle arrest and cell death induced by irradiation). Cells were then fixed in 2% paraformaldehyde/TBS for 30 min at room temperature, rinsed in TBS and −20 °C methanol was added to cells for 1 min. DAPI (0.05 μg/mL in TBS) was added to cells for 5 min at room temperature, followed by a rinse in TBS and mounting on microscope slides using Vectashield mounting medium (Vector Laboratories). Coverslips were sealed with nail polish and analyzed on a Zeiss fluorescence AxioObserver Z1 inverted microscope (Zeiss). Anaphase bridges and micronucleated cells were scored manually in a total of 200 anaphases and 1000 cells, respectively. Representative images of DAPI stained cells were taken using a Plan-Apochromat 63X objective, QImaging Exi Aqua Cooled CCD color camera (Qiaimaging, Surrey, BC, Canada) and Northern Eclipse V8 software package (Empix Imaging, Mississauga, ON, Canada).
4.10. Clonogenic Survival Assay
Exponentially growing MEF cells in 100 mm Petri dishes were detached by treatment with Trypsin-EDTA, counted and re-suspended in DMEM at a concentration of 5000 cells/mL. Several aliquots were made in 15 mL conical tubes that were then irradiated with various doses in the γCell-220 irradiator as described above. Control cells were sham-irradiated. Cells were immediately seeded onto 100 mm diameter Petri dishes at densities to yield approximately 100 colonies per plate (determined empirically in preliminary experiments). After 10 days of incubation under normal conditions, plates were fixed and stained in 50% methanol with crystal violet. Plates were scored manually using Colony Counter SC6 (Bibby Scientific Ltd., Stone, UK) and colonies that contained >100 cells were counted as survivors. The plating efficiency in the control was ~60%, and the numbers of colonies in experimental groups were normalized to the control. Each experiment was performed in triplicate, and the means ± SD of the surviving fraction of cells were determined.
4.11. Statistical Analysis
Experiments were repeated at least three times, with the exception of the clonogenic survival experiment with anti-H2AX-shRNA-sh1 cell line for which the experiment was repeated two times with 3 technical replicates per experiment, and values plotted are means of the biological replicates. Standard deviations were used to evaluate errors. Treatment groups were compared using two-tailed Student’s t-test. A significance threshold was set up to p < 0.05.


 ,
, 


