
Genome-Wide Identification and Analysis of Drought-Responsive Genes and MicroRNAs in Tobacco

Abstract
:
1. Introduction
2. Results
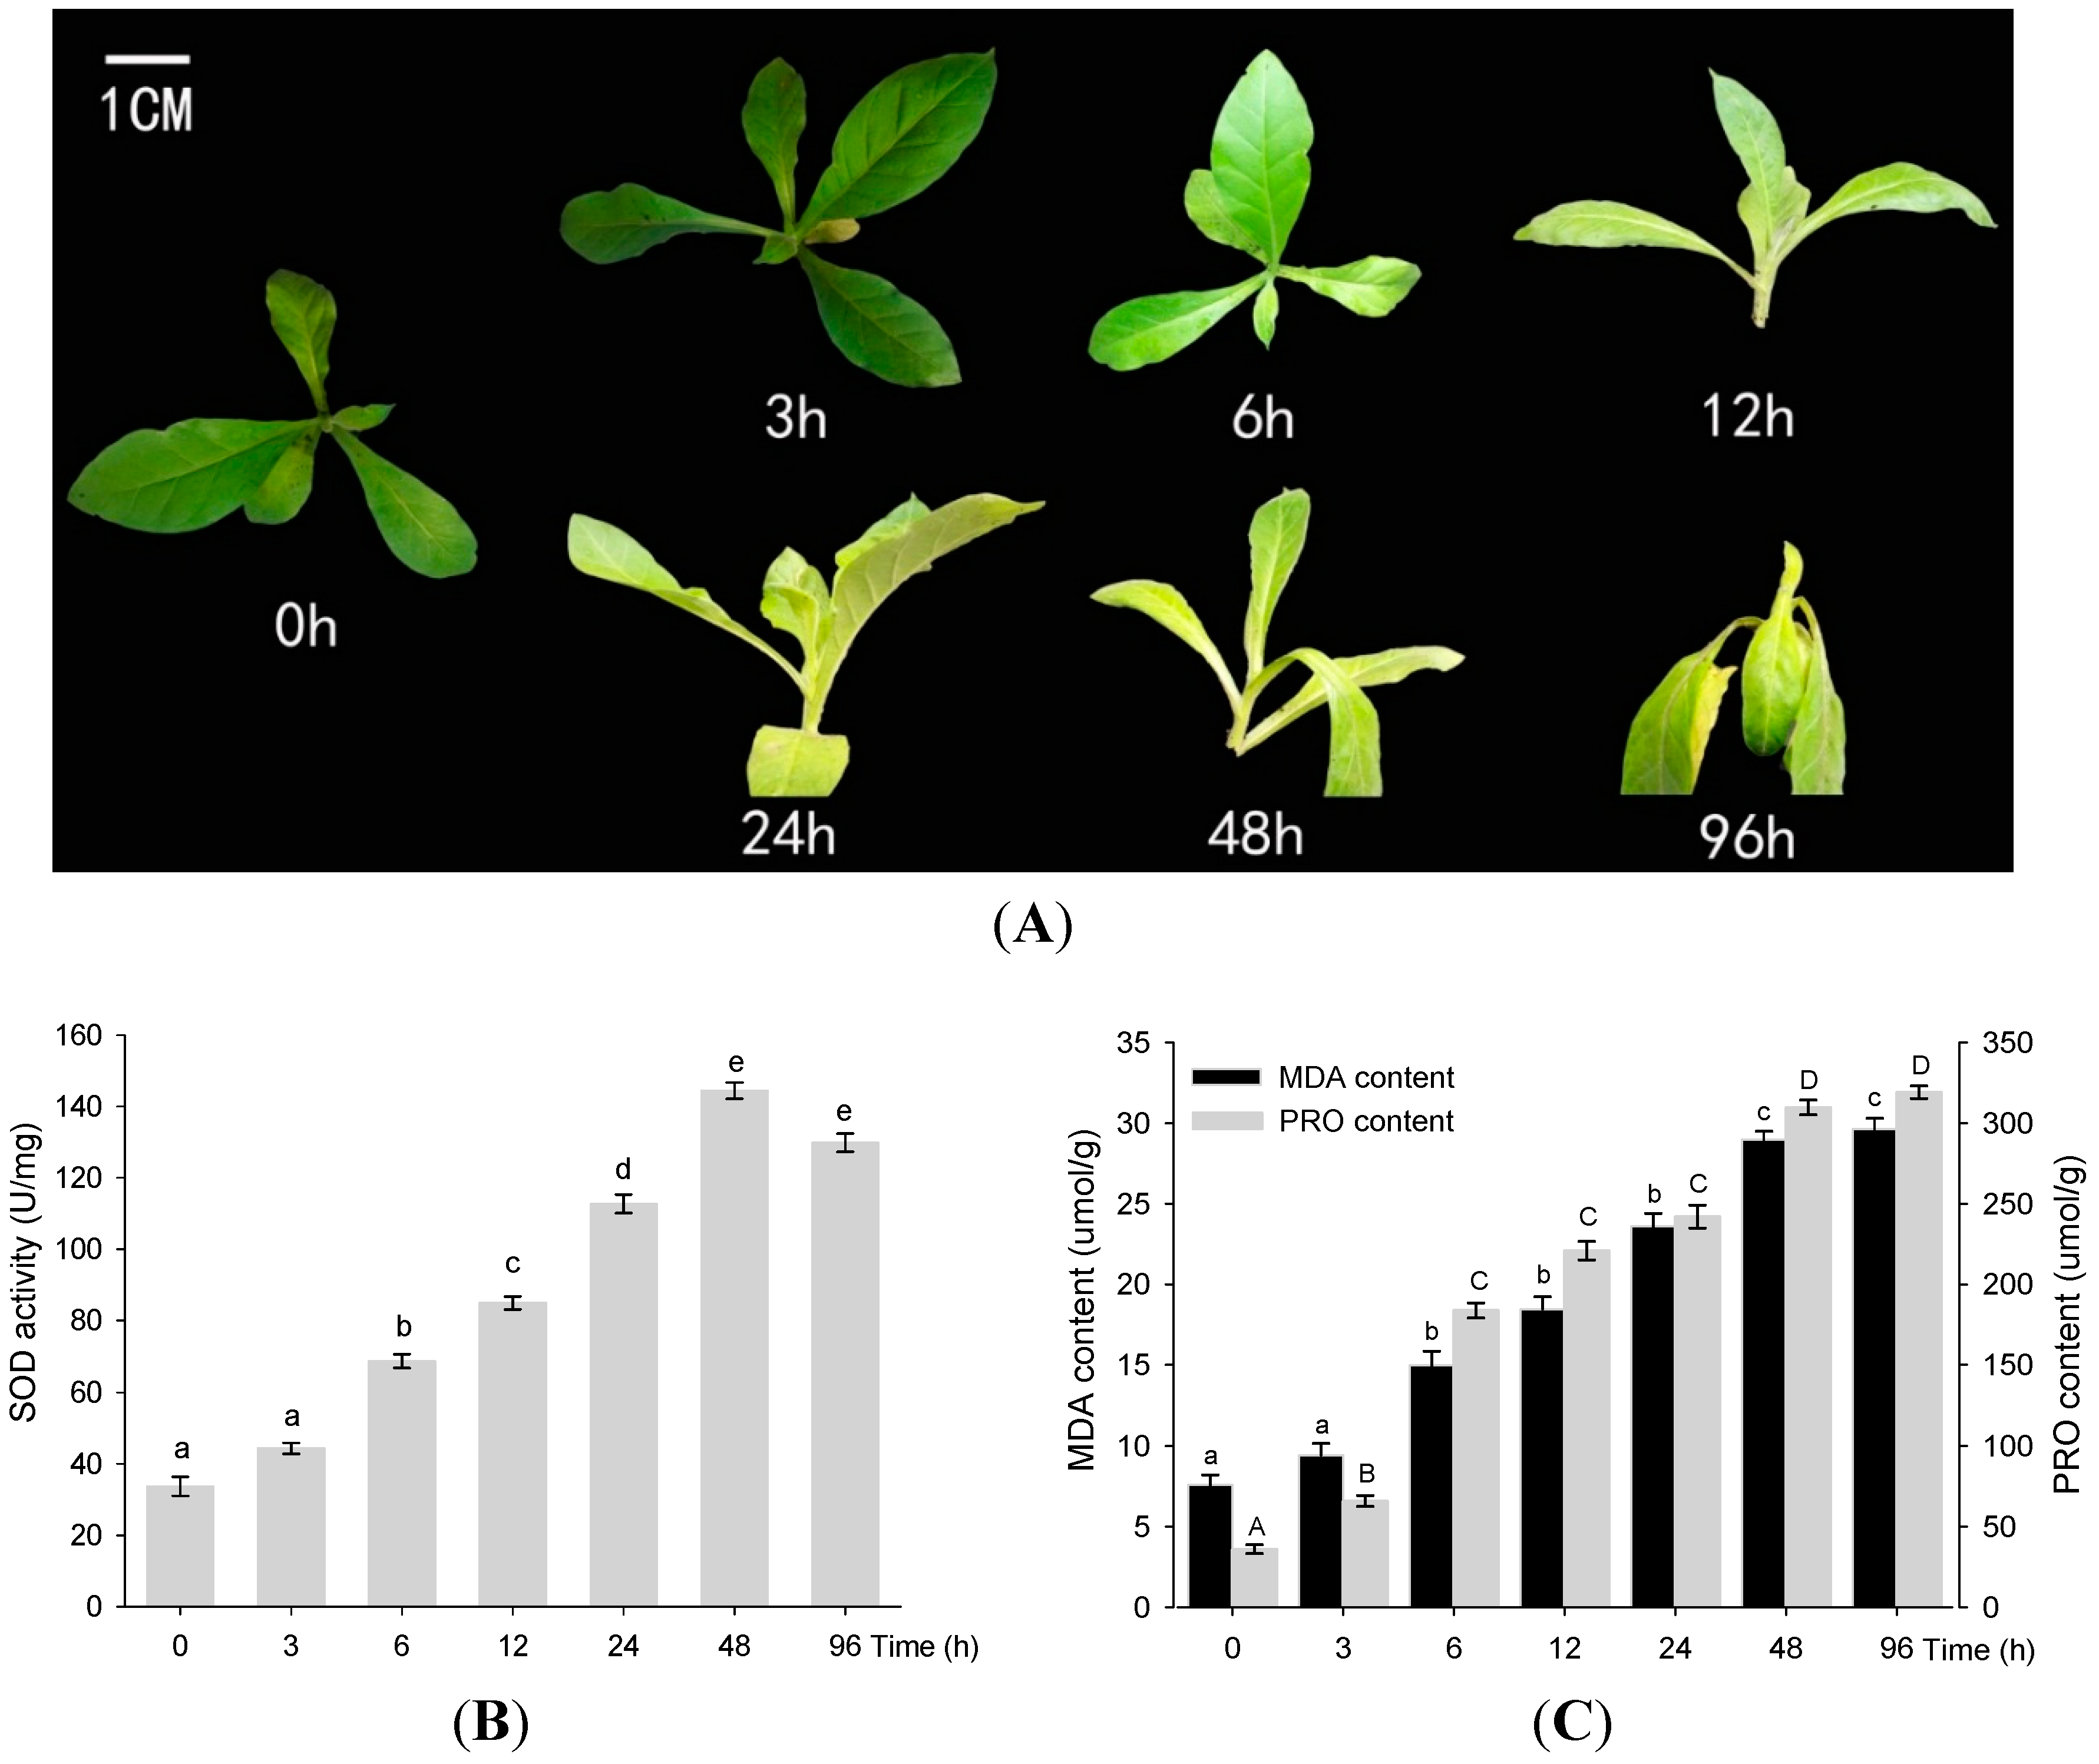
2.1. Physiological Analysis of PRO, SOD, and MDA under Drought Conditions

2.2. Generation and Quality Assessment of the DGE Dataset
2.3. Mapping DGE Tags to the Tobacco Reference Genome Database
2.4. Expression of Tobacco Root Genes under Drought Stress


2.5. Resolving Transcription Factors (TFs) among Differentially Expressed Genes

2.6. Identifying Candidate Drought Responsive Genes (DRGs) in Tobacco Roots

| Gene Name 1 | Function | Homolog_Niben_ID | PlantGDB_or_unigenes_ID | Tranfactor_ID | Family | TPM-NCK | TPM-N6H | TPM-N48H |
|---|---|---|---|---|---|---|---|---|
| GRF6 (14-3-3 protein GF14 lambda) | Drought tolerance | NbS00060175g0001.1 | - | - | - | 161.74 | 80.67 | 123.31 |
| NbS00044217g0013.1 | - | - | - | 5.89 | 8.27 | 18.9 | ||
| NbS00020600g0007.1 | - | - | - | 22.98 | 13 | 33.3 | ||
| NbS00007737g0010.1 | - | - | - | 158.5 | 277.48 | 121.51 | ||
| ABF1 | Drought tolerance | NbS00021408g0025.1 | - | - | - | 0.88 | 18.03 | 0.6 |
| ANAC055 | Drought and salt tolerance | NbS00023955g0006.1 | gnl|UG|Nta#S45443622 | Nta005482 | NAC | 108.71 | 58.51 | 39 |
| NbS00008328g0013.1 | gnl|UG|Nta#S45488905 | Nta010847 | NAC | 35.06 | 60.28 | 73.51 | ||
| ANAC072 | Drought and salt tolerance | NbS00007567g0016.1 | gnl|UG|Nta#S33559198 | Nta013275 | NAC | 5.3 | 3.25 | 13.8 |
| NbC26152828g0003.1 | gnl|UG|Nta#S45463754 | Nta012057 | NAC | 23.57 | 48.76 | 99.01 | ||
| NbS00025931g0004.1 | gnl|UG|Nta#S33566495 | Nta005129 | NAC | 7.95 | 7.68 | 23.4 | ||
| NbS00028594g0003.1 | gnl|UG|Nta#S45443622 | Nta005482 | NAC | 19.15 | 21.87 | 56.7 | ||
| APX2 | Drought resistance | NbS00018810g0008.1 | - | - | - | 0.88 | 2.96 | 6.6 |
| bZIP1 | Drought, salt and disease tolerance | NbS00007503g0111.1 | gnl|UG|Nta#S33578426 | Nta007642 | bZIP | 84.55 | 40.48 | 28.5 |
| CBF4 | Drought and freezing tolerance | NbS00018604g0003.1 | gnl|UG|Nta#S45471037 | Nta012107 | ERF | 10.9 | 0.01 | 0.01 |
| CpMYB10 | Desiccation and salinity tolerance | NbS00016700g0002.1 | gnl|UG|Nta#S45484072 | Nta012264 | MYB | 2.36 | 10.05 | 1.8 |
| NbS00007512g0018.1 | - | - | - | 11.49 | 10.34 | 3.3 | ||
| DREB1B/CBF1 | Increased tolerance to drought, cold and salinity | NbS00009125g0101.1 | gnl|UG|Nta#S33537030 | Nta005632 | ERF | 114.31 | 11.52 | 16.2 |
| DREB2A | Drought resistance | NbS00032542g0006.1 | gnl|UG|Nta#S33577665 | Nta005987 | ERF | 160.56 | 14.78 | 31.5 |
| NbS00025865g0001.1 | gnl|UG|Nta#S33537030 | Nta005632 | ERF | 13.26 | 0.89 | 7.5 | ||
| NbS00002425g0103.1 | gnl|UG|Nta#S33577665 | Nta005987 | ERF | 5.3 | 0.01 | 0.6 | ||
| DREB3 | Drought tolerance | NbS00016353g0001.1 | - | - | - | 20.03 | 3.25 | 2.7 |
| FAD3 | Drought resistance | NbS00037943g0006.1 | - | - | - | 17.97 | 27.48 | 42 |
| NbS00033197g0010.1 | - | - | - | 16.2 | 9.46 | 29.7 | ||
| GmERF3 | Drought tolerance | NbS00020925g0011.1 | gnl|UG|Nta#S33555957 | Nta004926 | ERF | 27.1 | 27.78 | 12.6 |
| HSFA2 | Resistance to environmental stresses | NbS00009669g0213.1 | - | - | - | 0.01 | 2.07 | 17.1 |
| MYB60 | Drought tolerance | NbS00046172g0003.1 | gnl|UG|Nta#S40644996 | Nta005483 | MYB | 1.77 | 1.77 | 12.3 |
| NbS00009475g0003.1 | - | - | - | 5.89 | 3.25 | 0.6 | ||
| NbS00009284g0003.1 | gnl|UG|Nta#S33578151 | Nta004281 | MYB | 65.4 | 108.75 | 28.8 | ||
| NbS00007772g0004.1 | gnl|UG|Nta#S33578094 | Nta008536 | MYB | 1.77 | 0.89 | 10.2 | ||
| NCED1 | Drought and salinity resistance | NbS00014845g0012.1 | - | - | - | 51.26 | 87.17 | 32.7 |
| NtERD10B | Improved drought- and low temperature stress tolerance | NbS00041294g0010.1 | - | - | - | 0.01 | 0.01 | 7.5 |
| NbS00029572g0007.1 | - | - | - | 0.01 | 0.01 | 13.2 | ||
| NbS00019308g0009.1 | - | - | - | 2.36 | 5.61 | 86.41 | ||
| NtERD10C | Improved drought- and low-temperature stress tolerance | NbS00018964g0003.1 | - | - | - | 75.12 | 12.41 | 21.9 |
| SRK2E/OST1/SnRK2.6 | Response to dehydration stress | NbS00019609g0014.1 | - | - | - | 3.83 | 7.98 | 18 |
| NbS00018358g0015.1 | - | - | - | 2.36 | 2.96 | 9.9 | ||
| PP2Ac-1 | Drought resistance; maintain RWC and membrane stability | NbS00043074g0007.1 | - | - | - | 12.67 | 8.57 | 21.9 |
| NbS00020903g0004.1 | - | - | - | 81.02 | 52.01 | 110.41 | ||
| RD22 | Response to drought stress | NbS00017616g0005.1 | - | - | - | 3.54 | 9.16 | 22.8 |
| RD29A and RD29B | low-temperature-responsive and desiccation-responsive | NbS00001669g0005.1 | - | - | - | 9.43 | 3.84 | 1.8 |
| SIPK | osmotic stress/pathogen resistance | NbS00060107g0004.1 | - | - | - | 36.53 | 42.85 | 78.91 |
| WIPK | osmotic stress/pathogen resistance | NbS00041241g0001.1 | gnl|UG|Nta#S37452582 | Nta004233 | ERF | 7.66 | 0.59 | 1.5 |
| NbS00028162g0009.1 | gnl|UG|Nta#S37452581 | Nta012156 | ERF | 40.07 | 6.8 | 9.9 | ||
| NbS00017618g0003.1 | gnl|UG|Nta#S37452582 | Nta004233 | ERF | 58.33 | 5.91 | 2.1 | ||
| ZPT2-1 (renamed from EPF1) | Drought tolerance | NbS00017486g0002.1 | - | - | - | 15.32 | 4.43 | 4.5 |
| NbS00002494g0018.1 | - | - | - | 44.78 | 33.1 | 19.8 |
2.7. Small RNA Sequencing
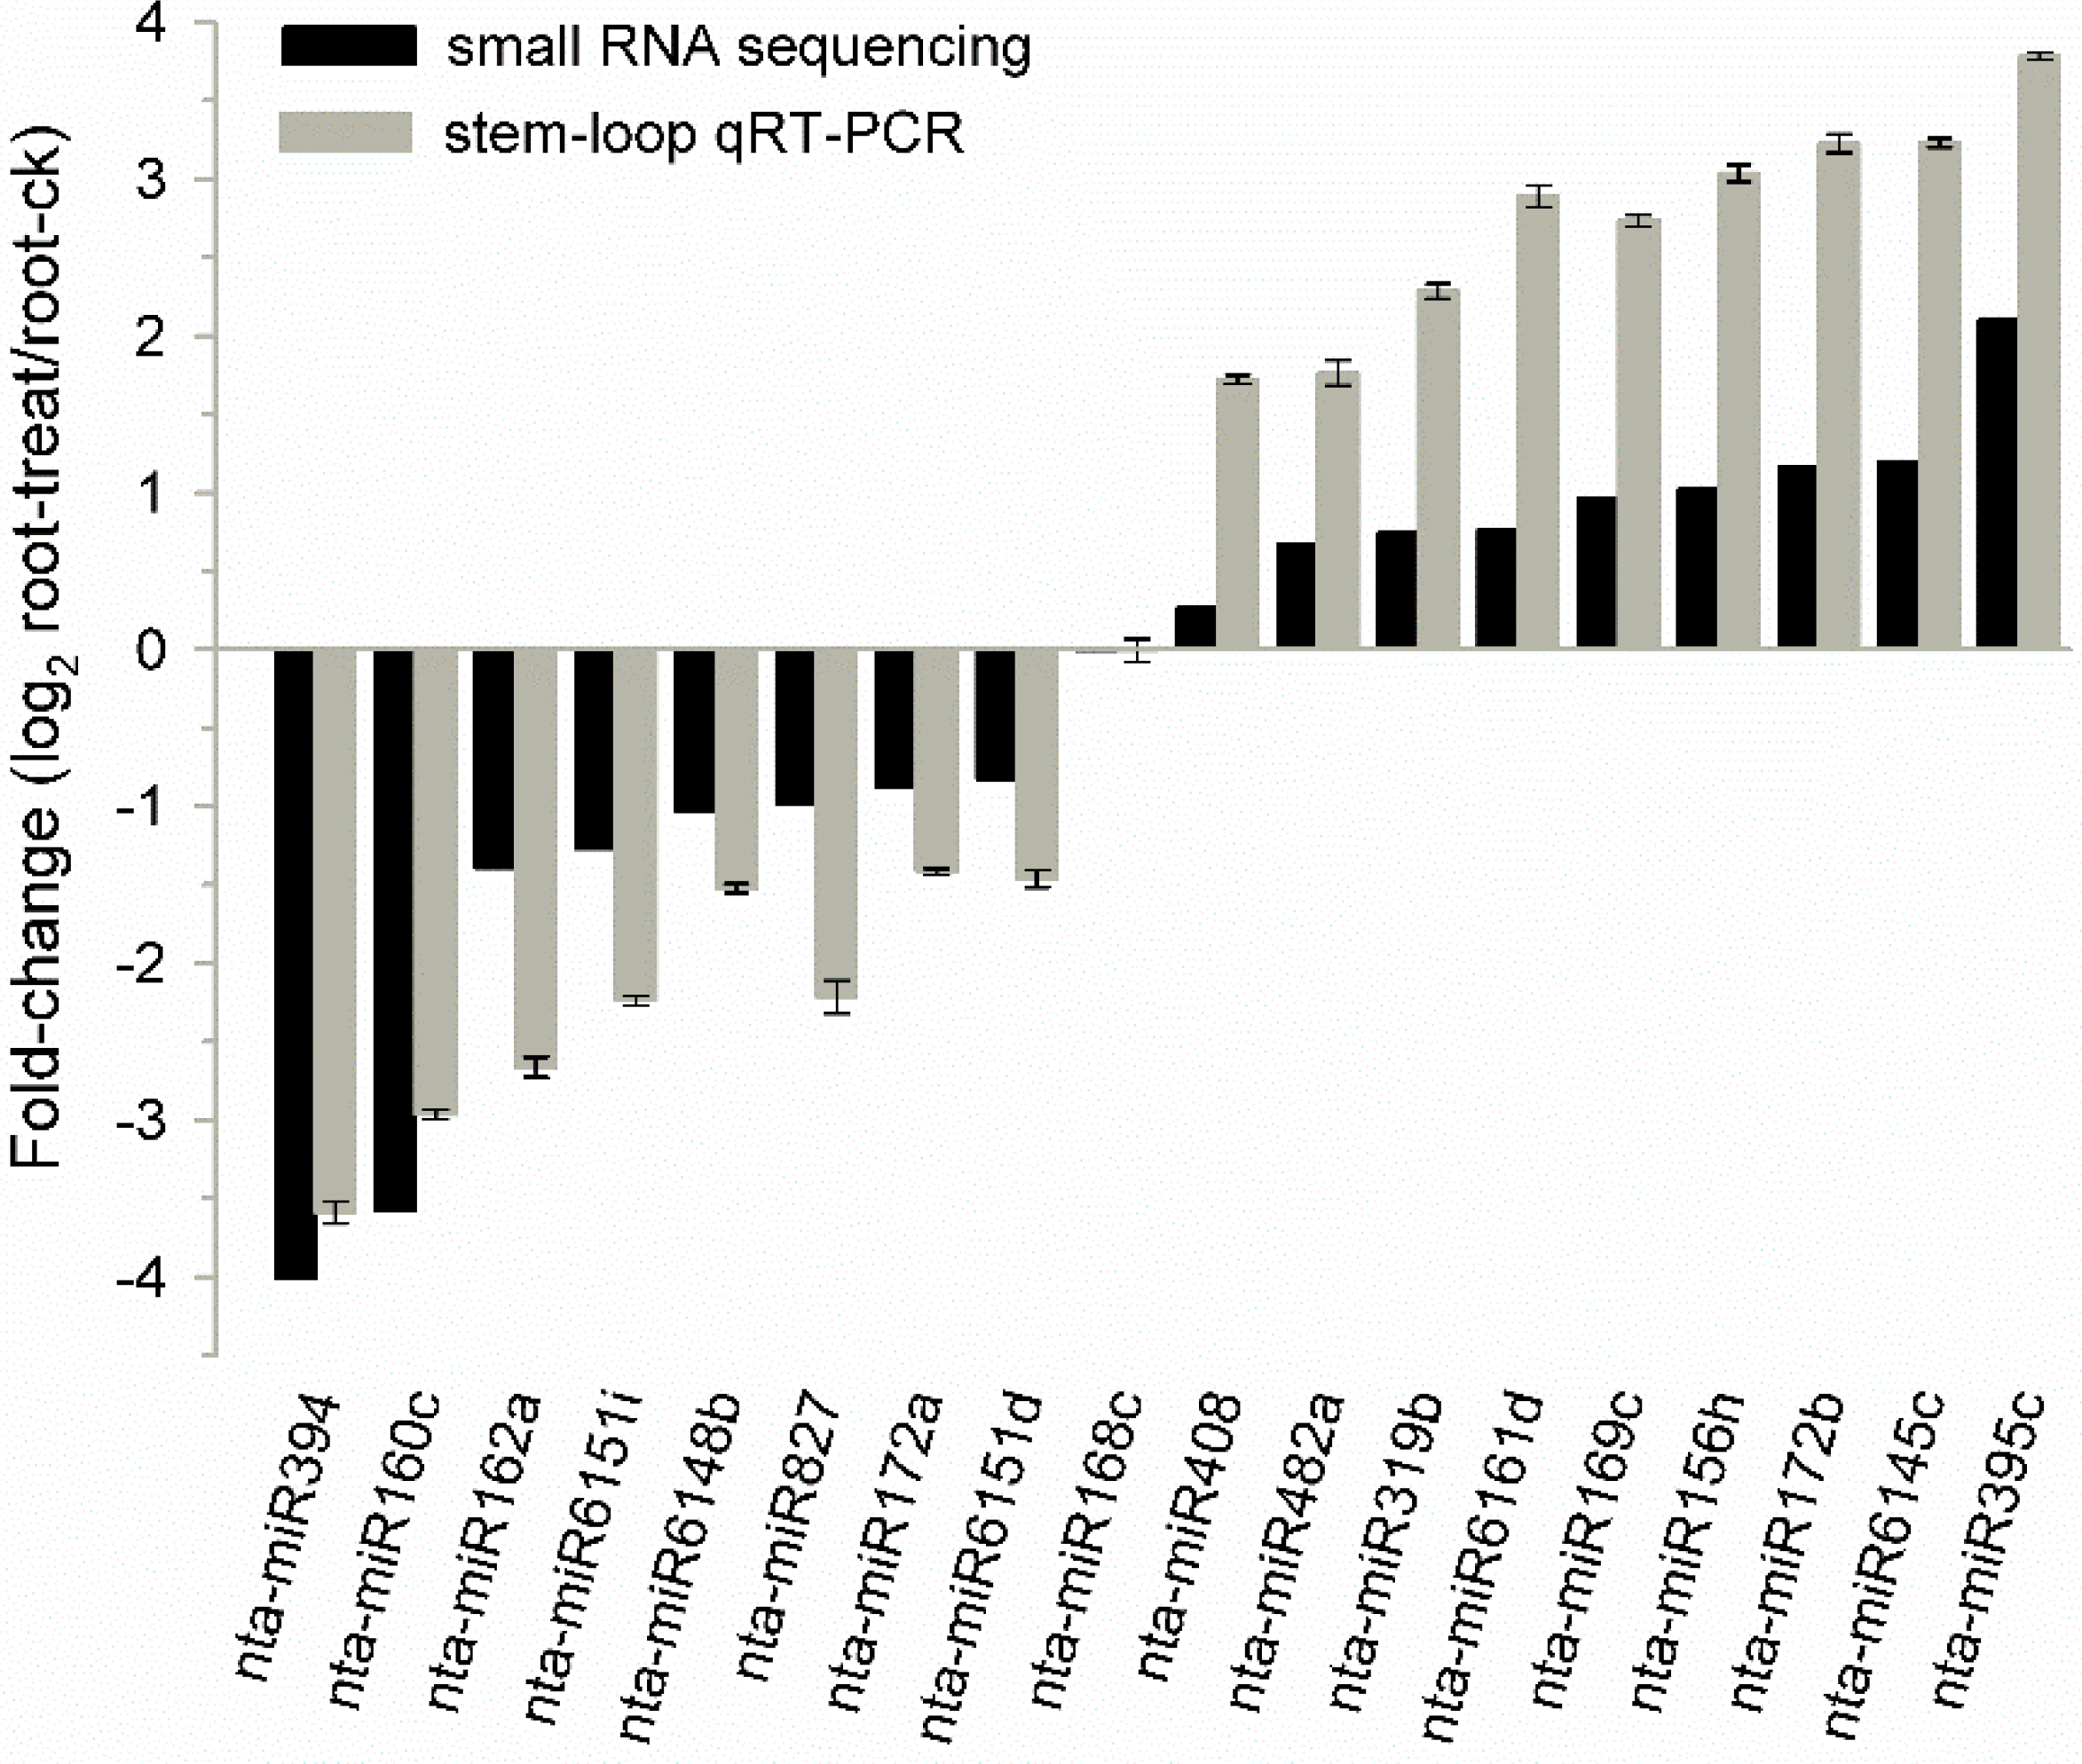
2.8. Known Tobacco miRNAs Expressed in Different Tissues and Drought Responsive miRNAs in Tobacco Roots

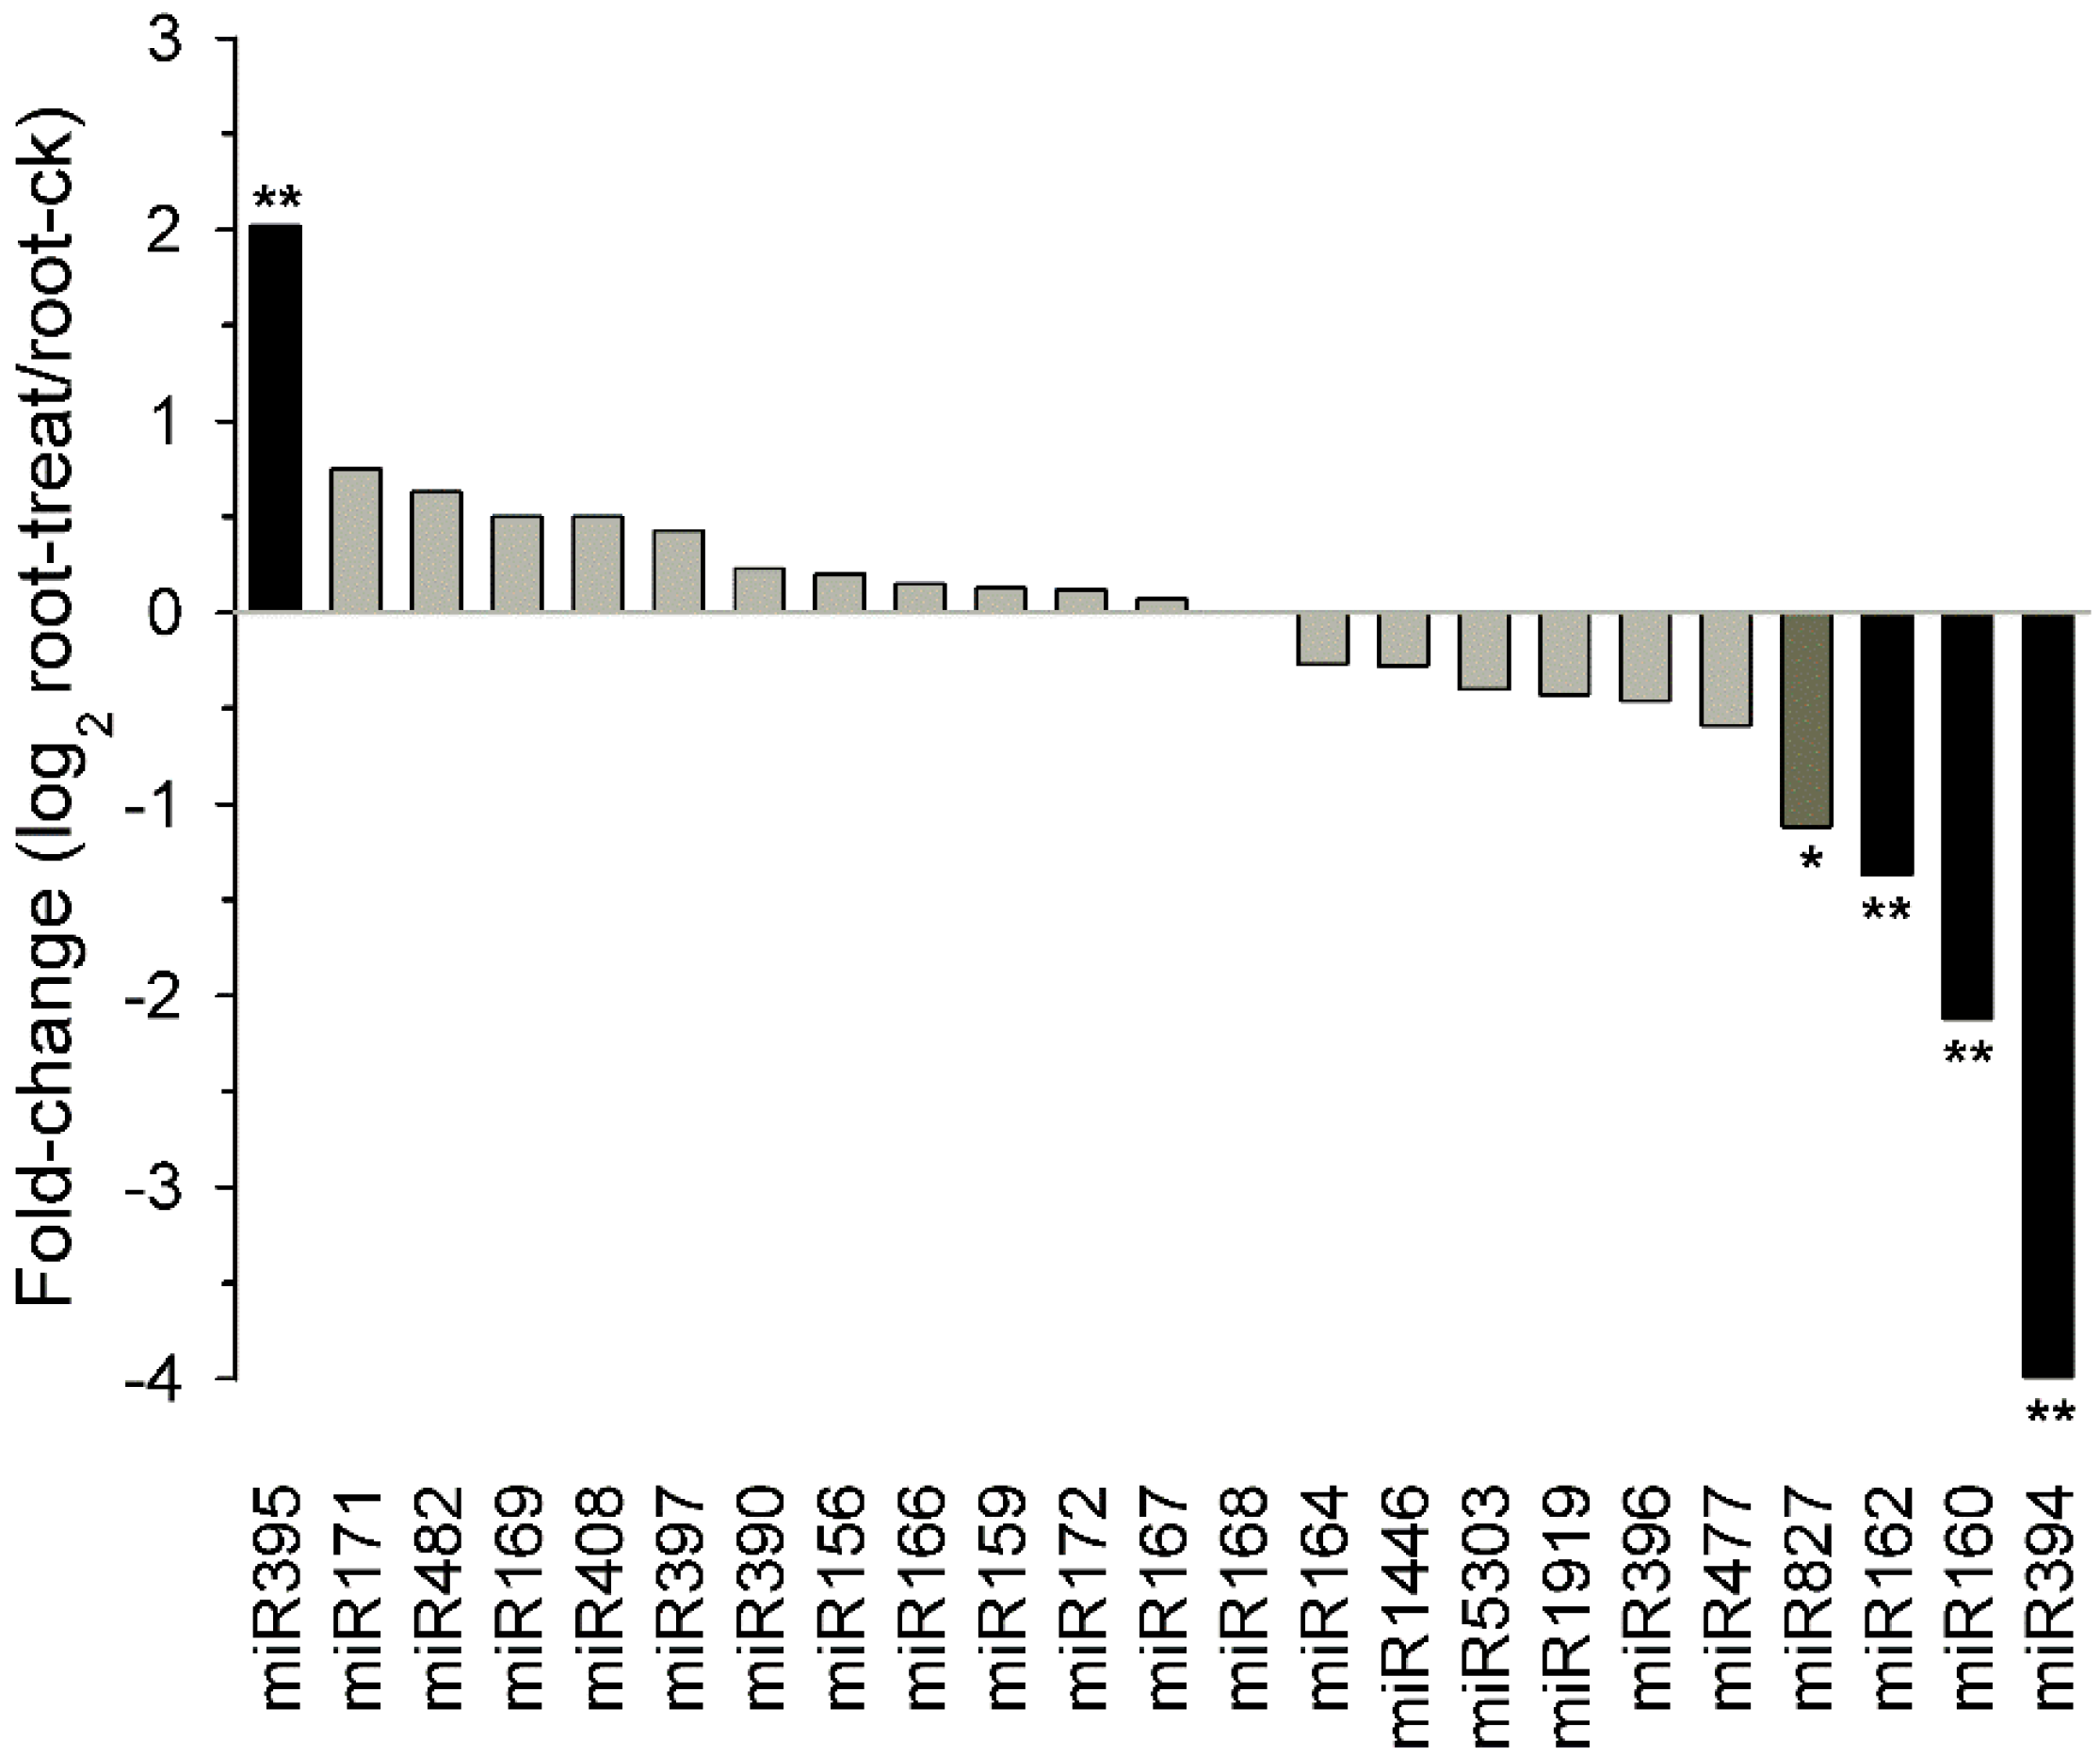
2.9. Potential Targets of Drought Responsive miRNAs
| miRNA_family | Regulated | Target_GSS_ID | Mapped_Niben_ID | NCK_TPM | N6H_TPM | N48H_TPM | Description |
|---|---|---|---|---|---|---|---|
| miR160 | down | ET792241 | NbS00018737g0003.1 | 0.59 | 1.18 | 1.20 | ARF Transcription factor |
| miR160 | down | ET792303 | NbS00005871g0012.1 | 0.01 | 0.01 | 0.60 | ARF Transcription factor |
| miR160 | down | FH226342 | NbS00059497g0003.1 | 4.71 | 3.84 | 4.20 | ARF Transcription factor |
| miR160 | down | FH226342 | NbS00026905g0003.1 | 6.78 | 3.84 | 4.50 | ARF Transcription factor |
| miR160 | down | FH226421 | NbS00028965g0003.1 | 3.54 | 2.66 | 1.20 | ARF Transcription factor |
| miR160 | down | FH226421 | NbS00036438g0004.1 | 0.01 | 0.59 | 0.01 | ARF Transcription factor |
| miR395 | up | ET937275 | NbS00014405g0001.1 | 2.36 | 1.48 | 0.90 | unknown protein |
| miR395 | up | ET937275 | NbS00009197g0109.1 | 12.37 | 3.25 | 2.40 | unknown |
| miR395 | up | ET937275 | NbS00006001g0005.1 | 11.78 | 17.43 | 2.10 | unknown protein |
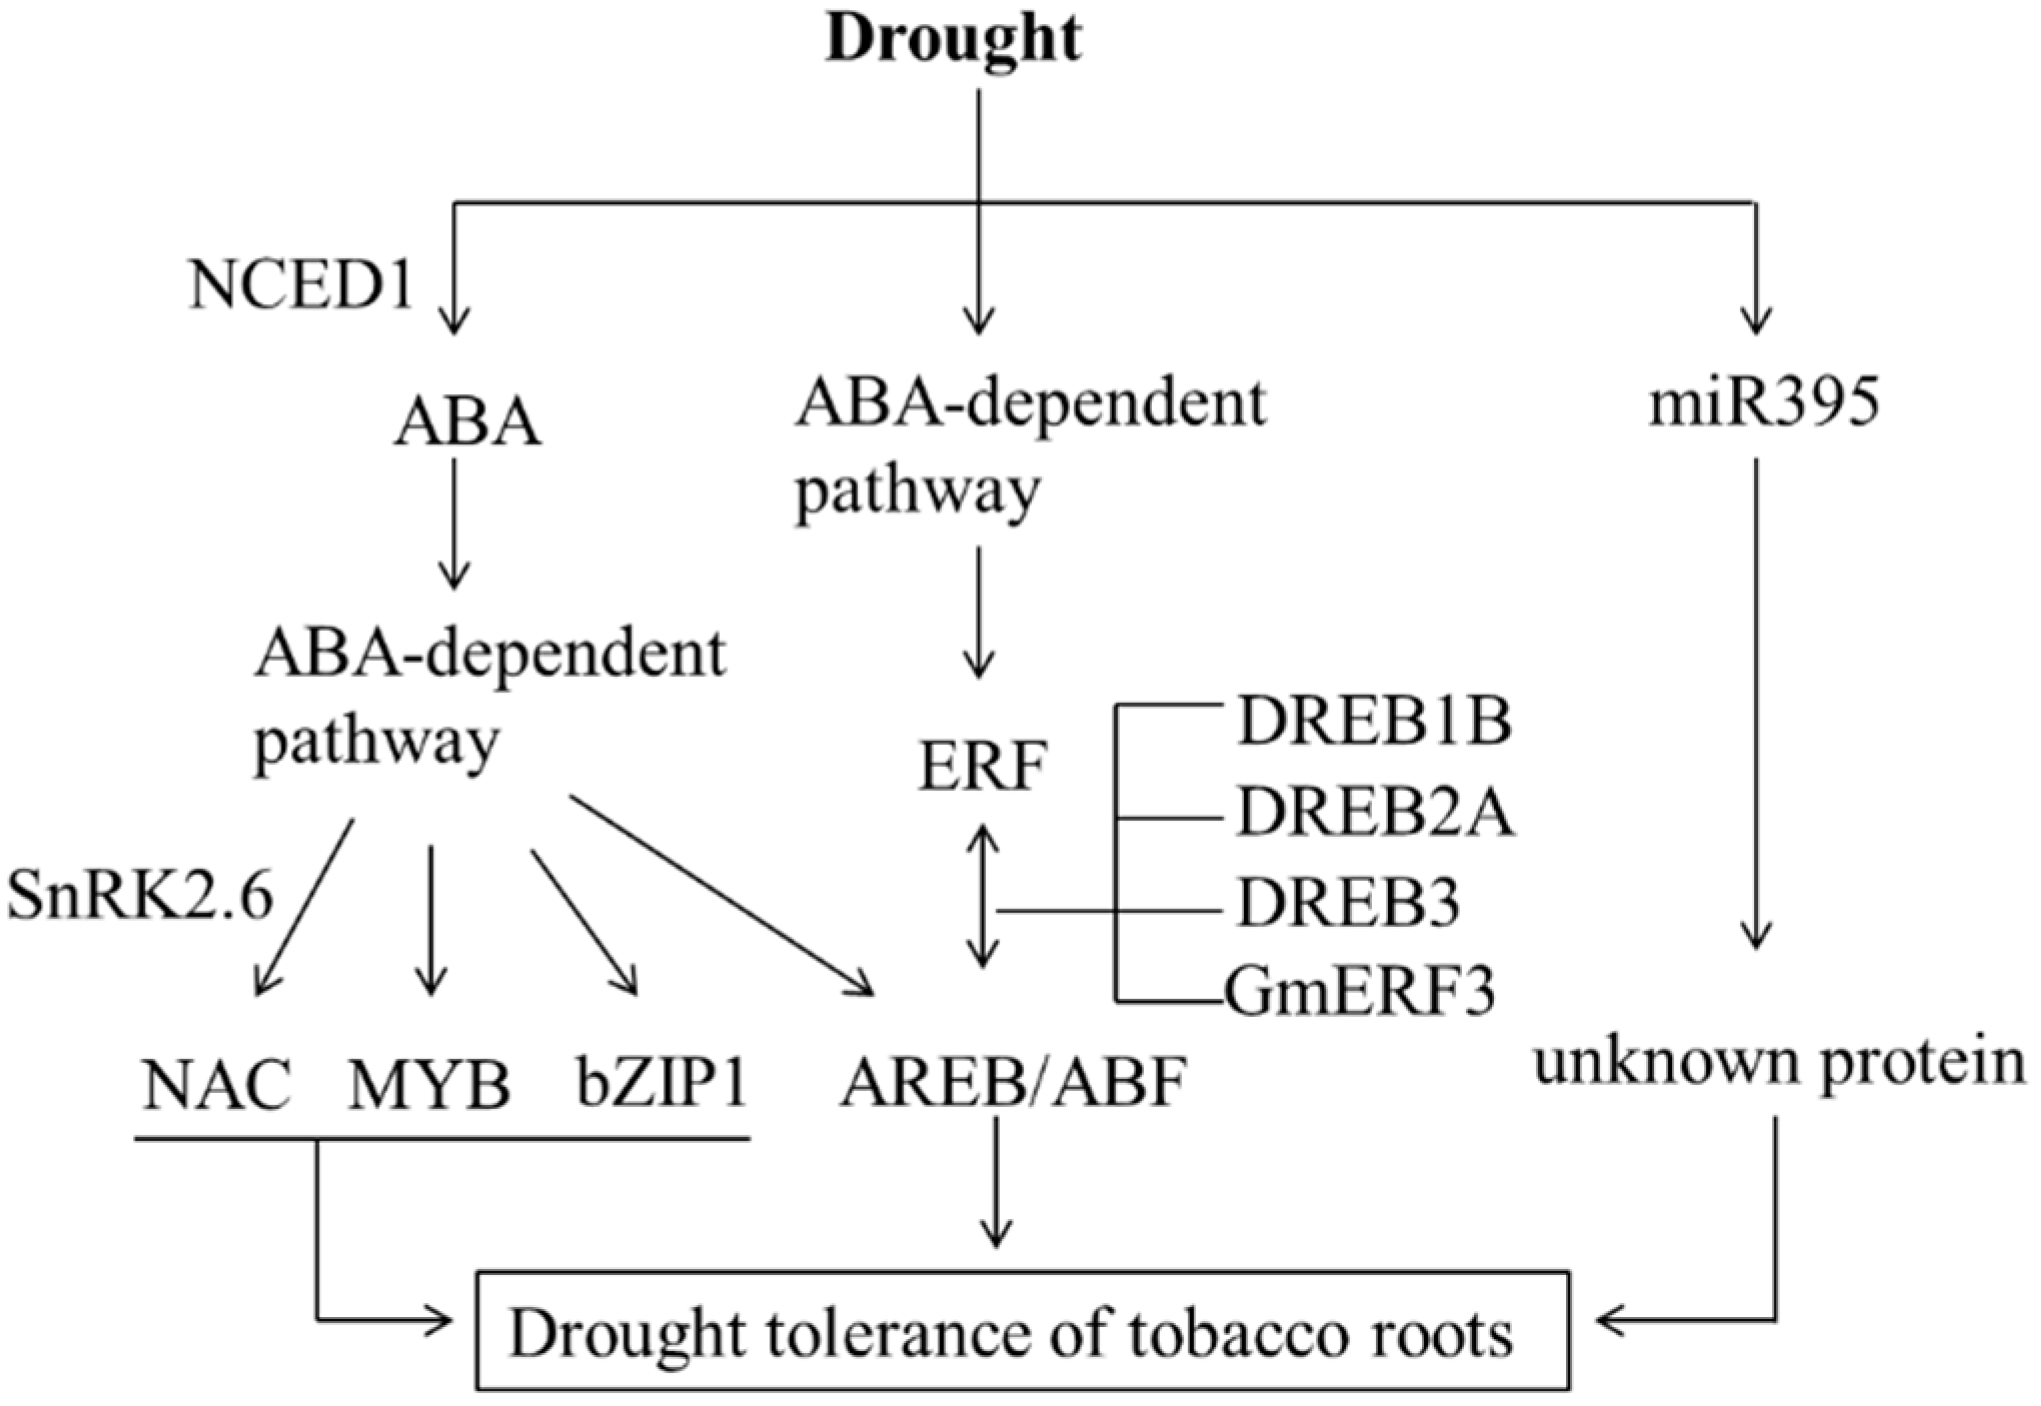
3. Discussion

4. Experimental Section
4.1. Plant Materials, Growth Conditions and Stress Treatments
4.2. Physiological Analyses
4.3. DGE, Small RNA Library Construction, and Solexa Sequencing
4.4. Analysis and Mapping of Digital Gene Expression Tags
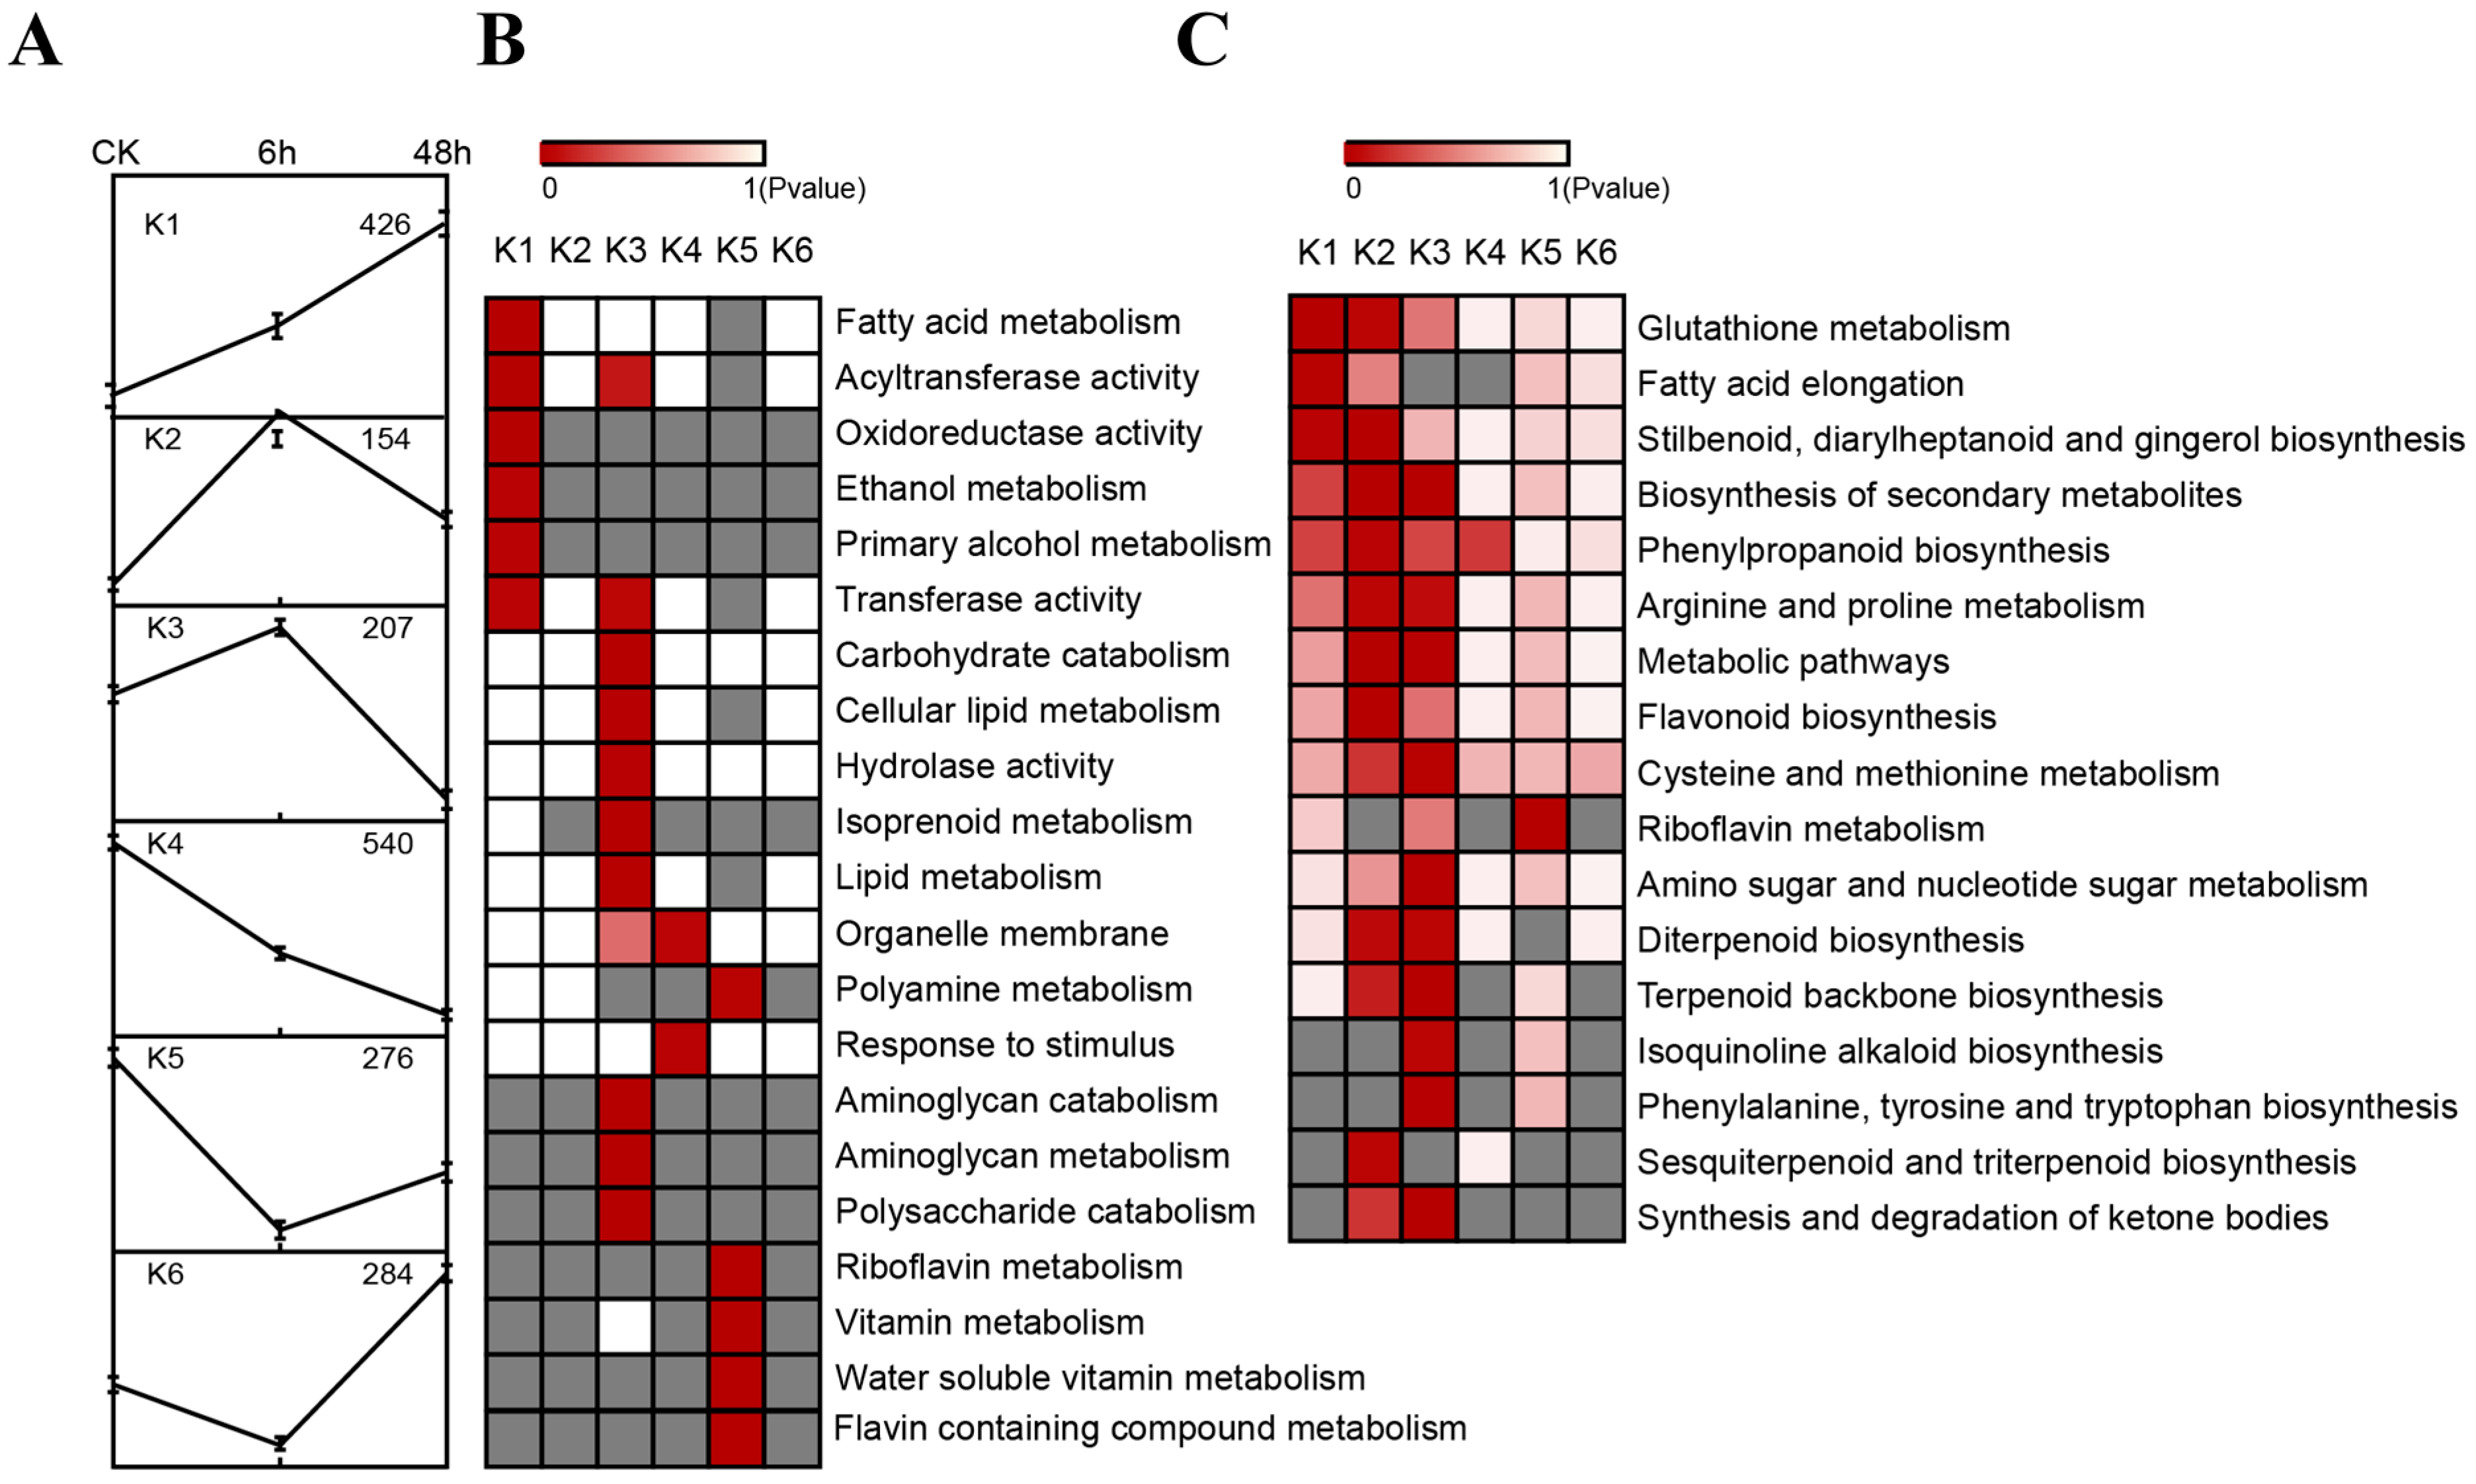
4.5. Identification of Differentially Expressed Genes and Cluster Analysis
4.6. Analysis of Small RNA Sequencing Data and Identification of Drought Responsive miRNAs
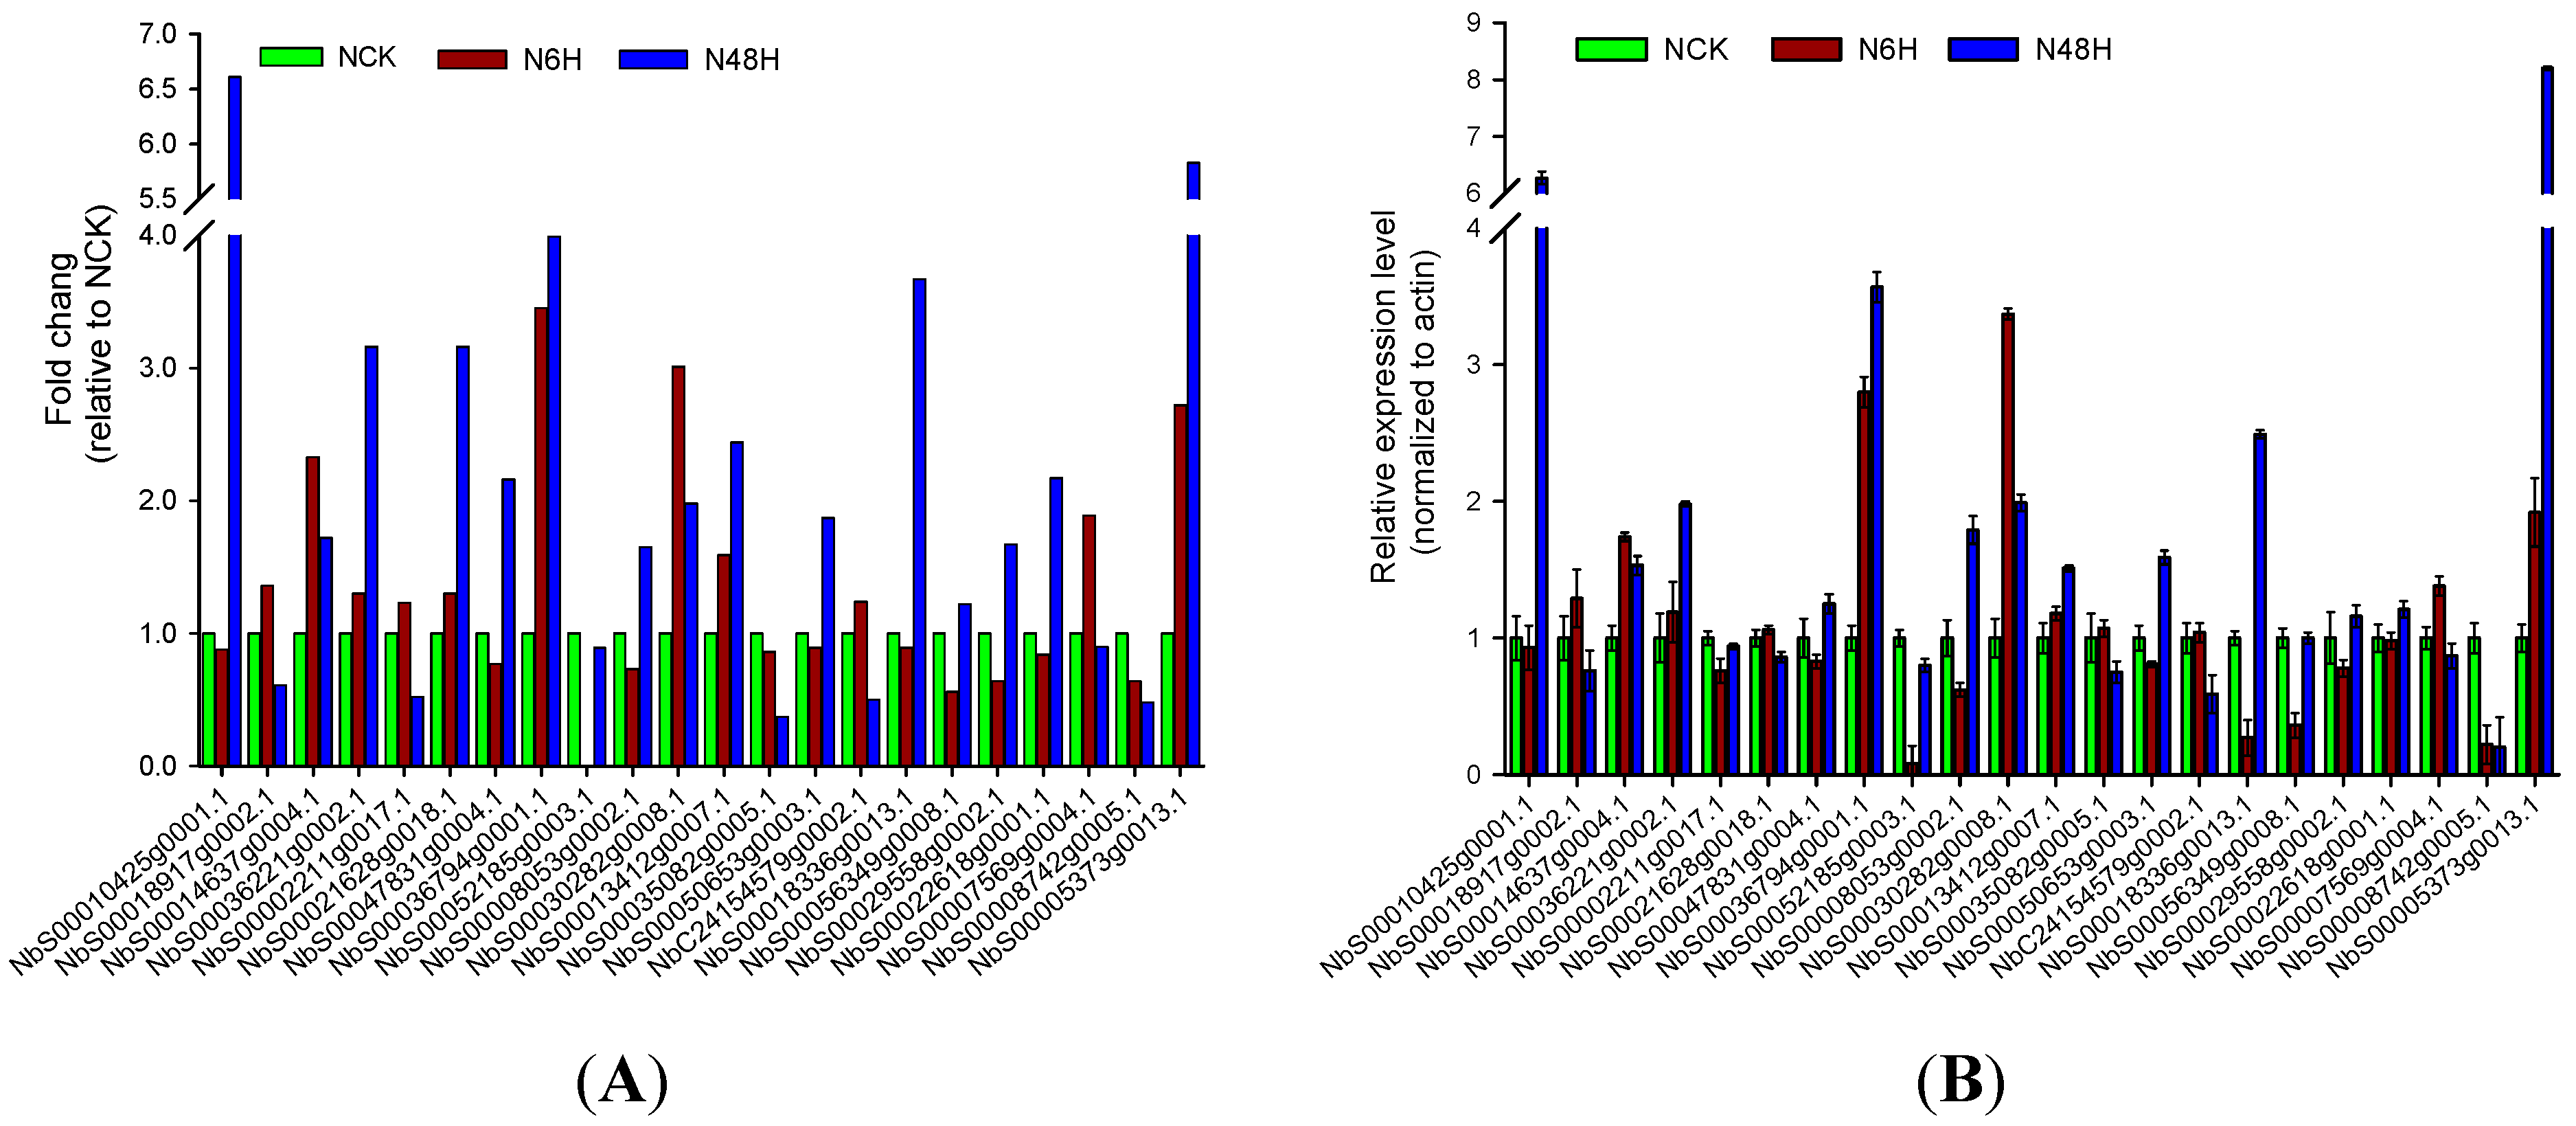
4.7. Quantitative Real-Time PCR (qRT-PCR) Analysis
5. Conclusions
Supplementary Materials
Acknowledgments
Author Contributions
Conflicts of Interest
References
- Hu, T.-W.; Mao, Z. Economic Analysis of Tobacco and Options for Tobacco Control: China Case Study; Center for Tobacco Control Research and Education: UC San Francisco, CA, USA, 2002. [Google Scholar]
- Goodin, M.M.; Zaitlin, D.; Naidu, R.A.; Lommel, S.A. Nicotiana benthamiana: Its history and future as a model for plant-pathogen interactions. Mol. Plant-Microbe Interact. 2008, 21, 1015–1026. [Google Scholar] [CrossRef] [PubMed]
- Bombarely, A.; Rosli, H.G.; Vrebalov, J.; Moffett, P.; Mueller, L.A.; Martin, G.B. A draft genome sequence of nicotiana benthamiana to enhance molecular plant-microbe biology research. Mol. Plant-Microbe Interact. 2012, 25, 1523–1530. [Google Scholar] [CrossRef] [PubMed]
- Glazebrook, J. Genes controlling expression of defense responses in Arabidopsis—2001 status. Curr. Opin. Plant Biol. 2001, 4, 301–308. [Google Scholar] [CrossRef] [PubMed]
- Knight, H.; Knight, M.R. Abiotic stress signalling pathways: Specificity and cross-talk. Trends Plant Sci. 2001, 6, 262–267. [Google Scholar] [CrossRef] [PubMed]
- Shinozaki, K.; Yamaguchi-Shinozaki, K.; Seki, M. Regulatory network of gene expression in the drought and cold stress responses. Curr. Opin. Plant Biol. 2003, 6, 410–417. [Google Scholar] [PubMed]
- Hussain, S.S.; Kayani, M.A.; Amjad, M. Transcription factors as tools to engineer enhanced drought stress tolerance in plants. Biotechnol. Progr. 2011, 27, 297–306. [Google Scholar] [CrossRef]
- Shinozaki, K.; Yamaguchi-Shinozaki, K. Gene networks involved in drought stress response and tolerance. J. Exp. Bot. 2007, 58, 221–227. [Google Scholar] [CrossRef]
- Zhu, J.K. Salt and drought stress signal transduction in plants. Annu. Rev. Plant Biol. 2002, 53, 247–273. [Google Scholar] [CrossRef] [PubMed]
- Choi, H.; Hong, J.; Ha, J.; Kang, J.; Kim, S.Y. ABFs, a family of ABA-responsive element binding factors. J. Biol. Chem. 2000, 275, 1723–1730. [Google Scholar] [CrossRef] [PubMed]
- Uno, Y.; Furihata, T.; Abe, H.; Yoshida, R.; Shinozaki, K.; Yamaguchi-Shinozaki, K. Arabidopsis basic leucine zipper transcription factors involved in an abscisic acid-dependent signal transduction pathway under drought and high-salinity conditions. Proc. Natl. Acad. Sci. USA 2000, 97, 11632–11637. [Google Scholar] [CrossRef] [PubMed]
- Narusaka, Y.; Nakashima, K.; Shinwari, Z.K.; Sakuma, Y.; Furihata, T.; Abe, H.; Narusaka, M.; Shinozaki, K.; Yamaguchi-Shinozaki, K. Interaction between two cis-acting elements, ABRE and DRE, in ABA-dependent expression of Arabidopsis rd29A gene in response to dehydration and high-salinity stresses. Plant J. 2003, 34, 137–148. [Google Scholar] [CrossRef] [PubMed]
- Lee, Y.; Kim, M.; Han, J.; Yeom, K.H.; Lee, S.; Baek, S.H.; Kim, V.N. MicroRNA genes are transcribed by RNA polymerase II. EMBO J. 2004, 23, 4051–4060. [Google Scholar] [CrossRef] [PubMed]
- Voinnet, O. Origin, biogenesis, and activity of plant microRNAs. Cell 2009, 136, 669–687. [Google Scholar] [CrossRef] [PubMed]
- Boualem, A.; Laporte, P.; Jovanovic, M.; Laffont, C.; Plet, J.; Combier, J.P.; Niebel, A.; Crespi, M.; Frugier, F. MicroRNA166 controls root and nodule development in Medicago truncatula. Plant J. 2008, 54, 876–887. [Google Scholar] [CrossRef] [PubMed]
- Wang, H.; Nussbaum-Wagler, T.; Li, B.; Zhao, Q.; Vigouroux, Y.; Faller, M.; Bomblies, K.; Lukens, L.; Doebley, J.F. The origin of the naked grains of maize. Nature 2005, 436, 714–719. [Google Scholar] [CrossRef] [PubMed]
- Golz, J.F. Signalling between the shoot apical meristem and developing lateral organs. Plant Mol. Biol. 2006, 60, 889–903. [Google Scholar] [CrossRef] [PubMed]
- Liu, Q.; Zhang, Y.C.; Wang, C.Y.; Luo, Y.C.; Huang, Q.J.; Chen, S.Y.; Zhou, H.; Qu, L.H.; Chen, Y.Q. Expression analysis of phytohormone-regulated microRNAs in rice, implying their regulation roles in plant hormone signaling. FEBS Lett. 2009, 583, 723–728. [Google Scholar] [CrossRef] [PubMed]
- Ding, D.; Zhang, L.; Wang, H.; Liu, Z.; Zhang, Z.; Zheng, Y. Differential expression of miRNAs in response to salt stress in maize roots. Ann. Bot. 2009, 103, 29–38. [Google Scholar] [CrossRef] [PubMed]
- Lu, S.; Sun, Y.H.; Chiang, V.L. Stress-responsive microRNAs in Populus. Plant J. 2008, 55, 131–151. [Google Scholar] [CrossRef] [PubMed]
- Zhao, B.; Liang, R.; Ge, L.; Li, W.; Xiao, H.; Lin, H.; Ruan, K.; Jin, Y. Identification of drought-induced microRNAs in rice. Biochem. Biophys. Res. Commun. 2007, 354, 585–590. [Google Scholar] [CrossRef] [PubMed]
- Zhou, X.; Wang, G.; Sutoh, K.; Zhu, J.K.; Zhang, W. Identification of cold-inducible microRNAs in plants by transcriptome analysis. Biochim. Biophys. Acta 2008, 1779, 780–788. [Google Scholar] [CrossRef] [PubMed]
- Reyes, J.L.; Chua, N.H. ABA induction of miR159 controls transcript levels of two MYB factors during Arabidopsis seed germination. Plant J. 2007, 49, 592–606. [Google Scholar] [CrossRef] [PubMed]
- Eveland, A.L.; Satoh-Nagasawa, N.; Goldshmidt, A.; Meyer, S.; Beatty, M.; Sakai, H.; Ware, D.; Jackson, D. Digital gene expression signatures for maize development. Plant Physiol. 2010, 154, 1024–1039. [Google Scholar] [CrossRef] [PubMed]
- Tang, S.; Wang, Y.; Li, Z.; Gui, Y.; Xiao, B.; Xie, J.; Zhu, Q.-H.; Fan, L. Identification of wounding and topping responsive small RNAs in tobacco (Nicotiana tabacum). BMC Plant Biol. 2012, 12, 28. [Google Scholar] [CrossRef] [PubMed]
- Li, T.; Li, H.; Zhang, Y.-X.; Liu, J.-Y. Identification and analysis of seven H2O2-responsive miRNAs and 32 new miRNAs in the seedlings of rice (Oryza sativa L. ssp. indica). Nucleic Acids Res. 2011, 39, 2821–2833. [Google Scholar] [CrossRef] [PubMed]
- Rizhsky, L.; Liang, H.; Mittler, R. The combined effect of drought stress and heat shock on gene expression in tobacco. Plant Physiol. 2002, 130, 1143–1151. [Google Scholar] [CrossRef] [PubMed]
- Ma, X.; Wang, Y.; Xie, S.; Wang, C.; Wang, W. Glycinebetaine application ameliorates negative effects of drought stress in tobacco. Russ. J. Plant Physiol. 2007, 54, 472–479. [Google Scholar] [CrossRef]
- Karakas, B.; Ozias-Akins, P.; Stushnoff, C.; Suefferheld, M.; Rieger, M. Salinity and drought tolerance of mannitol-accumulating transgenic tobacco. Plant Cell Environ. 1997, 20, 609–616. [Google Scholar] [CrossRef]
- Cho, E.; Hong, C. Over-expression of tobacco NtHSP70–1 contributes to drought-stress tolerance in plants. Plant Cell Rep. 2006, 25, 349–358. [Google Scholar] [CrossRef] [PubMed]
- Ding, H.; Qin, C.; Luo, X.; Li, L.; Chen, Z.; Liu, H.; Gao, J.; Lin, H.; Shen, Y.; Zhao, M.; et al. Heterosis in early maize ear inflorescence development: A genome-wide transcription analysis for two maize inbred lines and their hybrid. Int. J. Mol. Sci. 2014, 15, 13892–13915. [Google Scholar] [CrossRef] [PubMed]
- Yin, F.; Gao, J.; Liu, M.; Qin, C.; Zhang, W.; Yang, A.; Xia, M.; Zhang, Z.; Shen, Y.; Lin, H.; et al. Genome-wide analysis of water-stress-responsive microRNA expression profile in tobacco roots. Funct. Integr. Genomics 2014, 14, 319–332. [Google Scholar] [CrossRef] [PubMed]
- Li, R.; Yu, C.; Li, Y.; Lam, T.W.; Yiu, S.M.; Kristiansen, K.; Wang, J. SOAP2: An improved ultrafast tool for short read alignment. Bioinformatics 2009, 25, 1966–1967. [Google Scholar] [CrossRef] [PubMed]
- Li, P.; Ponnala, L.; Gandotra, N.; Wang, L.; Si, Y.; Tausta, S.L.; Kebrom, T.H.; Provart, N.; Patel, R.; Myers, C.R.; et al. The developmental dynamics of the maize leaf transcriptome. Nat. Genet. 2010, 42, 1060–1067. [Google Scholar] [CrossRef] [PubMed]
- Vilella, A.J.; Severin, J.; Ureta-Vidal, A.; Heng, L.; Durbin, R.; Birney, E. EnsemblCompara GeneTrees: Complete, duplication-aware phylogenetic trees in vertebrates. Genome Res. 2009, 19, 327–335. [Google Scholar] [CrossRef] [PubMed]
- Riechmann, J.L.; Heard, J.; Martin, G.; Reuber, L.; Jiang, C.Z.; Keddie, J.; Adam, L.; Pineda, O.; Ratcliffe, O.J.; Samaha, R.R.; et al. Arabidopsis transcription factors: Genome-wide comparative analysis among eukaryotes. Science 2000, 290, 2105–2110. [Google Scholar] [CrossRef] [PubMed]
- Cartolano, M.; Castillo, R.; Efremova, N.; Kuckenberg, M.; Zethof, J.; Schwarz-Sommer, Z.; Gerats, T.; Vandenbussche, M. A conserved microRNA module exerts homeotic control over Petunia hybrida and Antirrhinum majus floral organ identity. Nat. Genet. 2007, 39, 901–905. [Google Scholar] [CrossRef] [PubMed]
- Singh, K.B.; Foley, R.C.; Oñate-Sánchez, L. Transcription factors in plant defense and stress responses. Curr. Opin. Plant Biol. 2002, 5, 430–436. [Google Scholar] [CrossRef] [PubMed]
- Jones-Rhoades, M.W.; Bartel, D.P.; Bartel, B. MicroRNAs and their regulatory roles in plants. Annu. Rev. Plant Biol. 2006, 57, 19–53. [Google Scholar] [CrossRef] [PubMed]
- Gao, J.; Yin, F.; Liu, M.; Luo, M.; Qin, C.; Yang, A.; Yang, S.; Zhang, Z.; Shen, Y.; Lin, H.; Pan, G. Identification and characterisation of tobacco microRNA transcriptome using high-throughput sequencing. Plant Biol. 2015. [Google Scholar] [CrossRef]
- Carthew, R.W.; Sontheimer, E.J. Origins and mechanisms of miRNAs and siRNAs. Cell 2009, 136, 642–655. [Google Scholar] [CrossRef] [PubMed]
- Covarrubias, A.A.; Reyes, J.L. Post-transcriptional gene regulation of salinity and drought responses by plant microRNAs. Plant Cell Environ. 2010, 33, 481–489. [Google Scholar] [CrossRef] [PubMed]
- Lu, S.; Sun, Y.H.; Shi, R.; Clark, C.; Li, L.; Chiang, V.L. Novel and mechanical stress-responsive MicroRNAs in Populus trichocarpa that are absent from Arabidopsis. Plant Cell 2005, 17, 2186–2203. [Google Scholar] [CrossRef] [PubMed]
- Addo-Quaye, C.; Eshoo, T.W.; Bartel, D.P.; Axtell, M.J. Endogenous siRNA and miRNA Targets Identified by Sequencing of the Arabidopsis Degradome. Curr. Biol. CB 2008, 18, 758–762. [Google Scholar] [CrossRef]
- Itaya, A.; Bundschuh, R.; Archual, A.J.; Joung, J.-G.; Fei, Z.; Dai, X.; Zhao, P.X.; Tang, Y.; Nelson, R.S.; Ding, B. Small RNAs in tomato fruit and leaf development. Biochim. Biophys. Acta (BBA) 2008, 1779, 99–107. [Google Scholar] [CrossRef]
- Wang, J.-W.; Wang, L.-J.; Mao, Y.-B.; Cai, W.-J.; Xue, H.-W.; Chen, X.-Y. Control of Root Cap Formation by MicroRNA-Targeted Auxin Response Factors in Arabidopsis. Plant Cell Online 2005, 17, 2204–2216. [Google Scholar] [CrossRef]
- Mallory, A.C.; Bartel, D.P.; Bartel, B. MicroRNA-directed regulation of arabidopsis AUXIN RESPONSE FACTOR17 is essential for proper development and modulates expression of early auxin response genes. Plant Cell Online 2005, 17, 1360–1375. [Google Scholar] [CrossRef]
- Potato Genome Sequencing Consortium; Xu, X.; Pan, S.; Cheng, S.; Zhang, B.; Mu, D.; Ni, P.; Zhang, G.; Yang, S.; Li, R.; et al. Genome sequence and analysis of the tuber crop potato. Nature 2011, 475, 189–195. [Google Scholar]
- Dhindsa, R.S. Drought stress, enzymes of glutathione metabolism, oxidation injury, and protein synthesis in tortula ruralis. Plant Physiol. 1991, 95, 648–651. [Google Scholar] [CrossRef] [PubMed]
- May, M.J.; Vernoux, T.; Leaver, C.; Montagu, M.V.; Inzé, D. Glutathione homeostasis in plants: Implications for environmental sensing and plant development. J. Exp. Bot. 1998, 49, 649–667. [Google Scholar]
- Ma, S.; Gong, Q.; Bohnert, H.J. Dissecting salt stress pathways. J. Exp. Bot. 2006, 57, 1097–1107. [Google Scholar] [CrossRef] [PubMed]
- Knipfer, T.; Besse, M.; Verdeil, J.L.; Fricke, W. Aquaporin-facilitated water uptake in barley (Hordeum vulgare L.) roots. J. Exp. Bot. 2011, 62, 4115–4126. [Google Scholar]
- Heinen, R.B.; Ye, Q.; Chaumont, F. Role of aquaporins in leaf physiology. J. Exp. Bot. 2009, 60, 2971–2985. [Google Scholar] [CrossRef] [PubMed]
- Chaumont, F.; Moshelion, M.; Daniels, M.J. Regulation of plant aquaporin activity. Biol. Cell 2005, 97, 749–764. [Google Scholar] [CrossRef] [PubMed]
- Kilili, K.G.; Atanassova, N.; Vardanyan, A.; Clatot, N.; Al-Sabarna, K.; Kanellopoulos, P.N.; Makris, A.M.; Kampranis, S.C. Differential roles of tau class glutathione S-transferases in oxidative stress. J. Biol. Chem. 2004, 279, 24540–24551. [Google Scholar] [CrossRef] [PubMed]
- Lo, K.; Raftery, A.; Dombek, K.; Zhu, J.; Schadt, E.; Bumgarner, R.; Yeung, K. Integrating external biological knowledge in the construction of regulatory networks from time-series expression data. BMC Syst. Biol. 2012, 6, 101. [Google Scholar] [CrossRef] [PubMed]
- Yoshida, R.; Hobo, T.; Ichimura, K.; Mizoguchi, T.; Takahashi, F.; Aronso, J.; Ecker, J.R.; Shinozaki, K. ABA-activated SnRK2 protein kinase is required for dehydration stress signaling in arabidopsis. Plant Cell Physiol. 2002, 43, 1473–1483. [Google Scholar] [CrossRef] [PubMed]
- Mustilli, A.-C.; Merlot, S.; Vavasseur, A.; Fenzi, F.; Giraudat, J. Arabidopsis OST1 protein kinase mediates the regulation of stomatal aperture by abscisic acid and acts upstream of reactive oxygen species production. Plant Cell Online 2002, 14, 3089–3099. [Google Scholar] [CrossRef]
- Shinozaki, K.; Yamaguchi-Shinozaki, K. Molecular responses to dehydration and low temperature: differences and cross-talk between two stress signaling pathways. Curr. Opin. Plant Biol. 2000, 3, 217–223. [Google Scholar] [CrossRef] [PubMed]
- Frazier, T.; Sun, G.; Burklew, C.; Zhang, B. Salt and drought stresses induce the aberrant expression of microRNA genes in tobacco. Mol. Biotechnol. 2011, 49, 159–165. [Google Scholar] [CrossRef] [PubMed]
- Cakmak, I.; Horst, W.J. Effect of aluminium on lipid peroxidation, superoxide dismutase, catalase, and peroxidase activities in root tips of soybean (Glycine max). Physiol. Plantarum 1991, 83, 463–468. [Google Scholar] [CrossRef]
- Zhang, J.; Kirkham, M.B. Drought-stress-induced changes in activities of superoxide dismutase, catalase, and peroxidase in wheat species. Plant Cell Physiol. 1994, 35, 785–791. [Google Scholar]
- Delauney, A.J.; Verma, D.P.S. Proline biosynthesis and osmoregulation in plants. Plant J. 1993, 4, 215–223. [Google Scholar] [CrossRef]
- Shen, Y.; Jiang, Z.; Yao, X.; Zhang, Z.; Lin, H.; Zhao, M.; Liu, H.; Peng, H.; Li, S.; Pan, G. Genome Expression profile analysis of the immature maize embryo during dedifferentiation. PLoS One 2012, 7, e32237. [Google Scholar] [CrossRef] [PubMed]
- AC’t Hoen, P.; Ariyurek, Y.; Thygesen, H.H.; Vreugdenhil, E.; Vossen, R.H.A.M.; de Menezes, R.X.; Boer, J.M.; van Ommen, G.J.B.; den Dunnen, J.T. Deep sequencing-based expression analysis shows major advances in robustness, resolution and inter-lab portability over five microarray platforms. Nucleic Acids Res. 2008, 36, e141. [Google Scholar] [CrossRef] [PubMed]
- Morrissy, A.S.; Morin, R.D.; Delaney, A.; Zeng, T.; McDonald, H.; Jones, S.; Zhao, Y.; Hirst, M.; Marra, M.A. Next-generation tag sequencing for cancer gene expression profiling. Genome Res. 2009, 19, 1825–1835. [Google Scholar] [CrossRef] [PubMed]
- Tatusov, R.L.; Fedorova, N.D.; Jackson, J.D.; Jacobs, A.R.; Kiryutin, B.; Koonin, E.V.; Krylov, D.M.; Mazumder, R.; Mekhedov, S.L.; Nikolskaya, A.N.; et al. The COG database: An updated version includes eukaryotes. BMC Bioinf. 2003, 4, 41. [Google Scholar] [CrossRef]
- Consortium, T.G.O. The gene ontology project in 2008. Nucleic Acids Res. 2008, 36, D440–D444. [Google Scholar] [CrossRef] [PubMed]
- Kanehisa, M. The KEGG Database. In “In Silico” Simulation of Biological Processes; John Wiley & Sons, Ltd: Hoboken, NJ, USA, 2002; pp. 91–103. [Google Scholar]
- Storey, J.D.; Tibshirani, R. Statistical significance for genomewide studies. Proc. Natl. Acad. Sci. USA 2003, 100, 9440–9445. [Google Scholar] [CrossRef] [PubMed]
- Audic, S.; Claverie, J.M. The significance of digital gene expression profiles. Genome Res. 1997, 7, 986–995. [Google Scholar] [PubMed]
- Reiner, A.; Yekutieli, D.; Benjamini, Y. Identifying differentially expressed genes using false discovery rate controlling procedures. Bioinformatics 2003, 19, 368–375. [Google Scholar] [CrossRef] [PubMed]
- Wang, L.; Feng, Z.; Wang, X.; Wang, X.; Zhang, X. DEGseq: An R package for identifying differentially expressed genes from RNA-seq data. Bioinformatics 2010, 26, 136–138. [Google Scholar] [PubMed]
- Benjamini, Y.; Yekutieli, D. The control of the false discovery rate in multiple testing under dependency. Ann. Stat. 2001, 29, 1165–1188. [Google Scholar] [CrossRef]
- Bindea, G.; Mlecnik, B.; Hackl, H.; Charoentong, P.; Tosolini, M.; Kirilovsky, A.; Fridman, W.-H.; Pagès, F.; Trajanoski, Z.; Galon, J. ClueGO: A Cytoscape plug-in to decipher functionally grouped gene ontology and pathway annotation networks. Bioinformatics 2009, 25, 1091–1093. [Google Scholar] [CrossRef]
- Gardner, P.P.; Daub, J.; Tate, J.G.; Nawrocki, E.P.; Kolbe, D.L.; Lindgreen, S.; Wilkinson, A.C.; Finn, R.D.; Griffiths-Jones, S.; Eddy, S.R.; et al. Rfam: Updates to the RNA families database. Nucleic Acids Res. 2009, 37, D136–D140. [Google Scholar] [CrossRef] [PubMed]
- Pignocchi, C.; Fletcher, J.M.; Wilkinson, J.E.; Barnes, J.D.; Foyer, C.H. The function of ascorbate oxidase in tobacco. Plant Physiol. 2003, 132, 1631–1641. [Google Scholar] [CrossRef] [PubMed]
- Livak, K.J.; Schmittgen, T.D. Analysis of relative gene expression data using real-time Quantitative PCR and the 2−ΔΔCt method. Methods 2001, 25, 402–408. [Google Scholar] [CrossRef] [PubMed]
- Chen, C.; Ridzon, D.A.; Broomer, A.J.; Zhou, Z.; Lee, D.H.; Nguyen, J.T.; Barbisin, M.; Xu, N.L.; Mahuvakar, V.R.; Andersen, M.R.; et al. Real-time quantification of microRNAs by stem-loop RT-PCR. Nucleic Acids Res. 2005, 33, e179. [Google Scholar] [CrossRef] [PubMed]
- Varkonyi-Gasic, E.; Wu, R.; Wood, M.; Walton, E.; Hellens, R. Protocol: A highly sensitive RT-PCR method for detection and quantification of microRNAs. Plant Methods 2007, 3, 1–12. [Google Scholar] [CrossRef] [PubMed]
- Lang, Q.; Jin, C.; Lai, L.; Feng, J.; Chen, S.; Chen, J. Tobacco microRNAs prediction and their expression infected with Cucumber mosaic virus and Potato virus X. Mol. Biol. Rep. 2011, 38, 1523–1531. [Google Scholar] [CrossRef] [PubMed]
© 2015 by the authors; licensee MDPI, Basel, Switzerland. This article is an open access article distributed under the terms and conditions of the Creative Commons Attribution license (http://creativecommons.org/licenses/by/4.0/).
Share and Cite
Yin, F.; Qin, C.; Gao, J.; Liu, M.; Luo, X.; Zhang, W.; Liu, H.; Liao, X.; Shen, Y.; Mao, L.; et al. Genome-Wide Identification and Analysis of Drought-Responsive Genes and MicroRNAs in Tobacco. Int. J. Mol. Sci. 2015, 16, 5714-5740. https://0-doi-org.brum.beds.ac.uk/10.3390/ijms16035714
Yin F, Qin C, Gao J, Liu M, Luo X, Zhang W, Liu H, Liao X, Shen Y, Mao L, et al. Genome-Wide Identification and Analysis of Drought-Responsive Genes and MicroRNAs in Tobacco. International Journal of Molecular Sciences. 2015; 16(3):5714-5740. https://0-doi-org.brum.beds.ac.uk/10.3390/ijms16035714
Chicago/Turabian StyleYin, Fuqiang, Cheng Qin, Jian Gao, Ming Liu, Xirong Luo, Wenyou Zhang, Hongjun Liu, Xinhui Liao, Yaou Shen, Likai Mao, and et al. 2015. "Genome-Wide Identification and Analysis of Drought-Responsive Genes and MicroRNAs in Tobacco" International Journal of Molecular Sciences 16, no. 3: 5714-5740. https://0-doi-org.brum.beds.ac.uk/10.3390/ijms16035714