
Application of Single Molecule Fluorescence Microscopy to Characterize the Penetration of a Large Amphiphilic Molecule in the Stratum Corneum of Human Skin

 ,
,  , , and
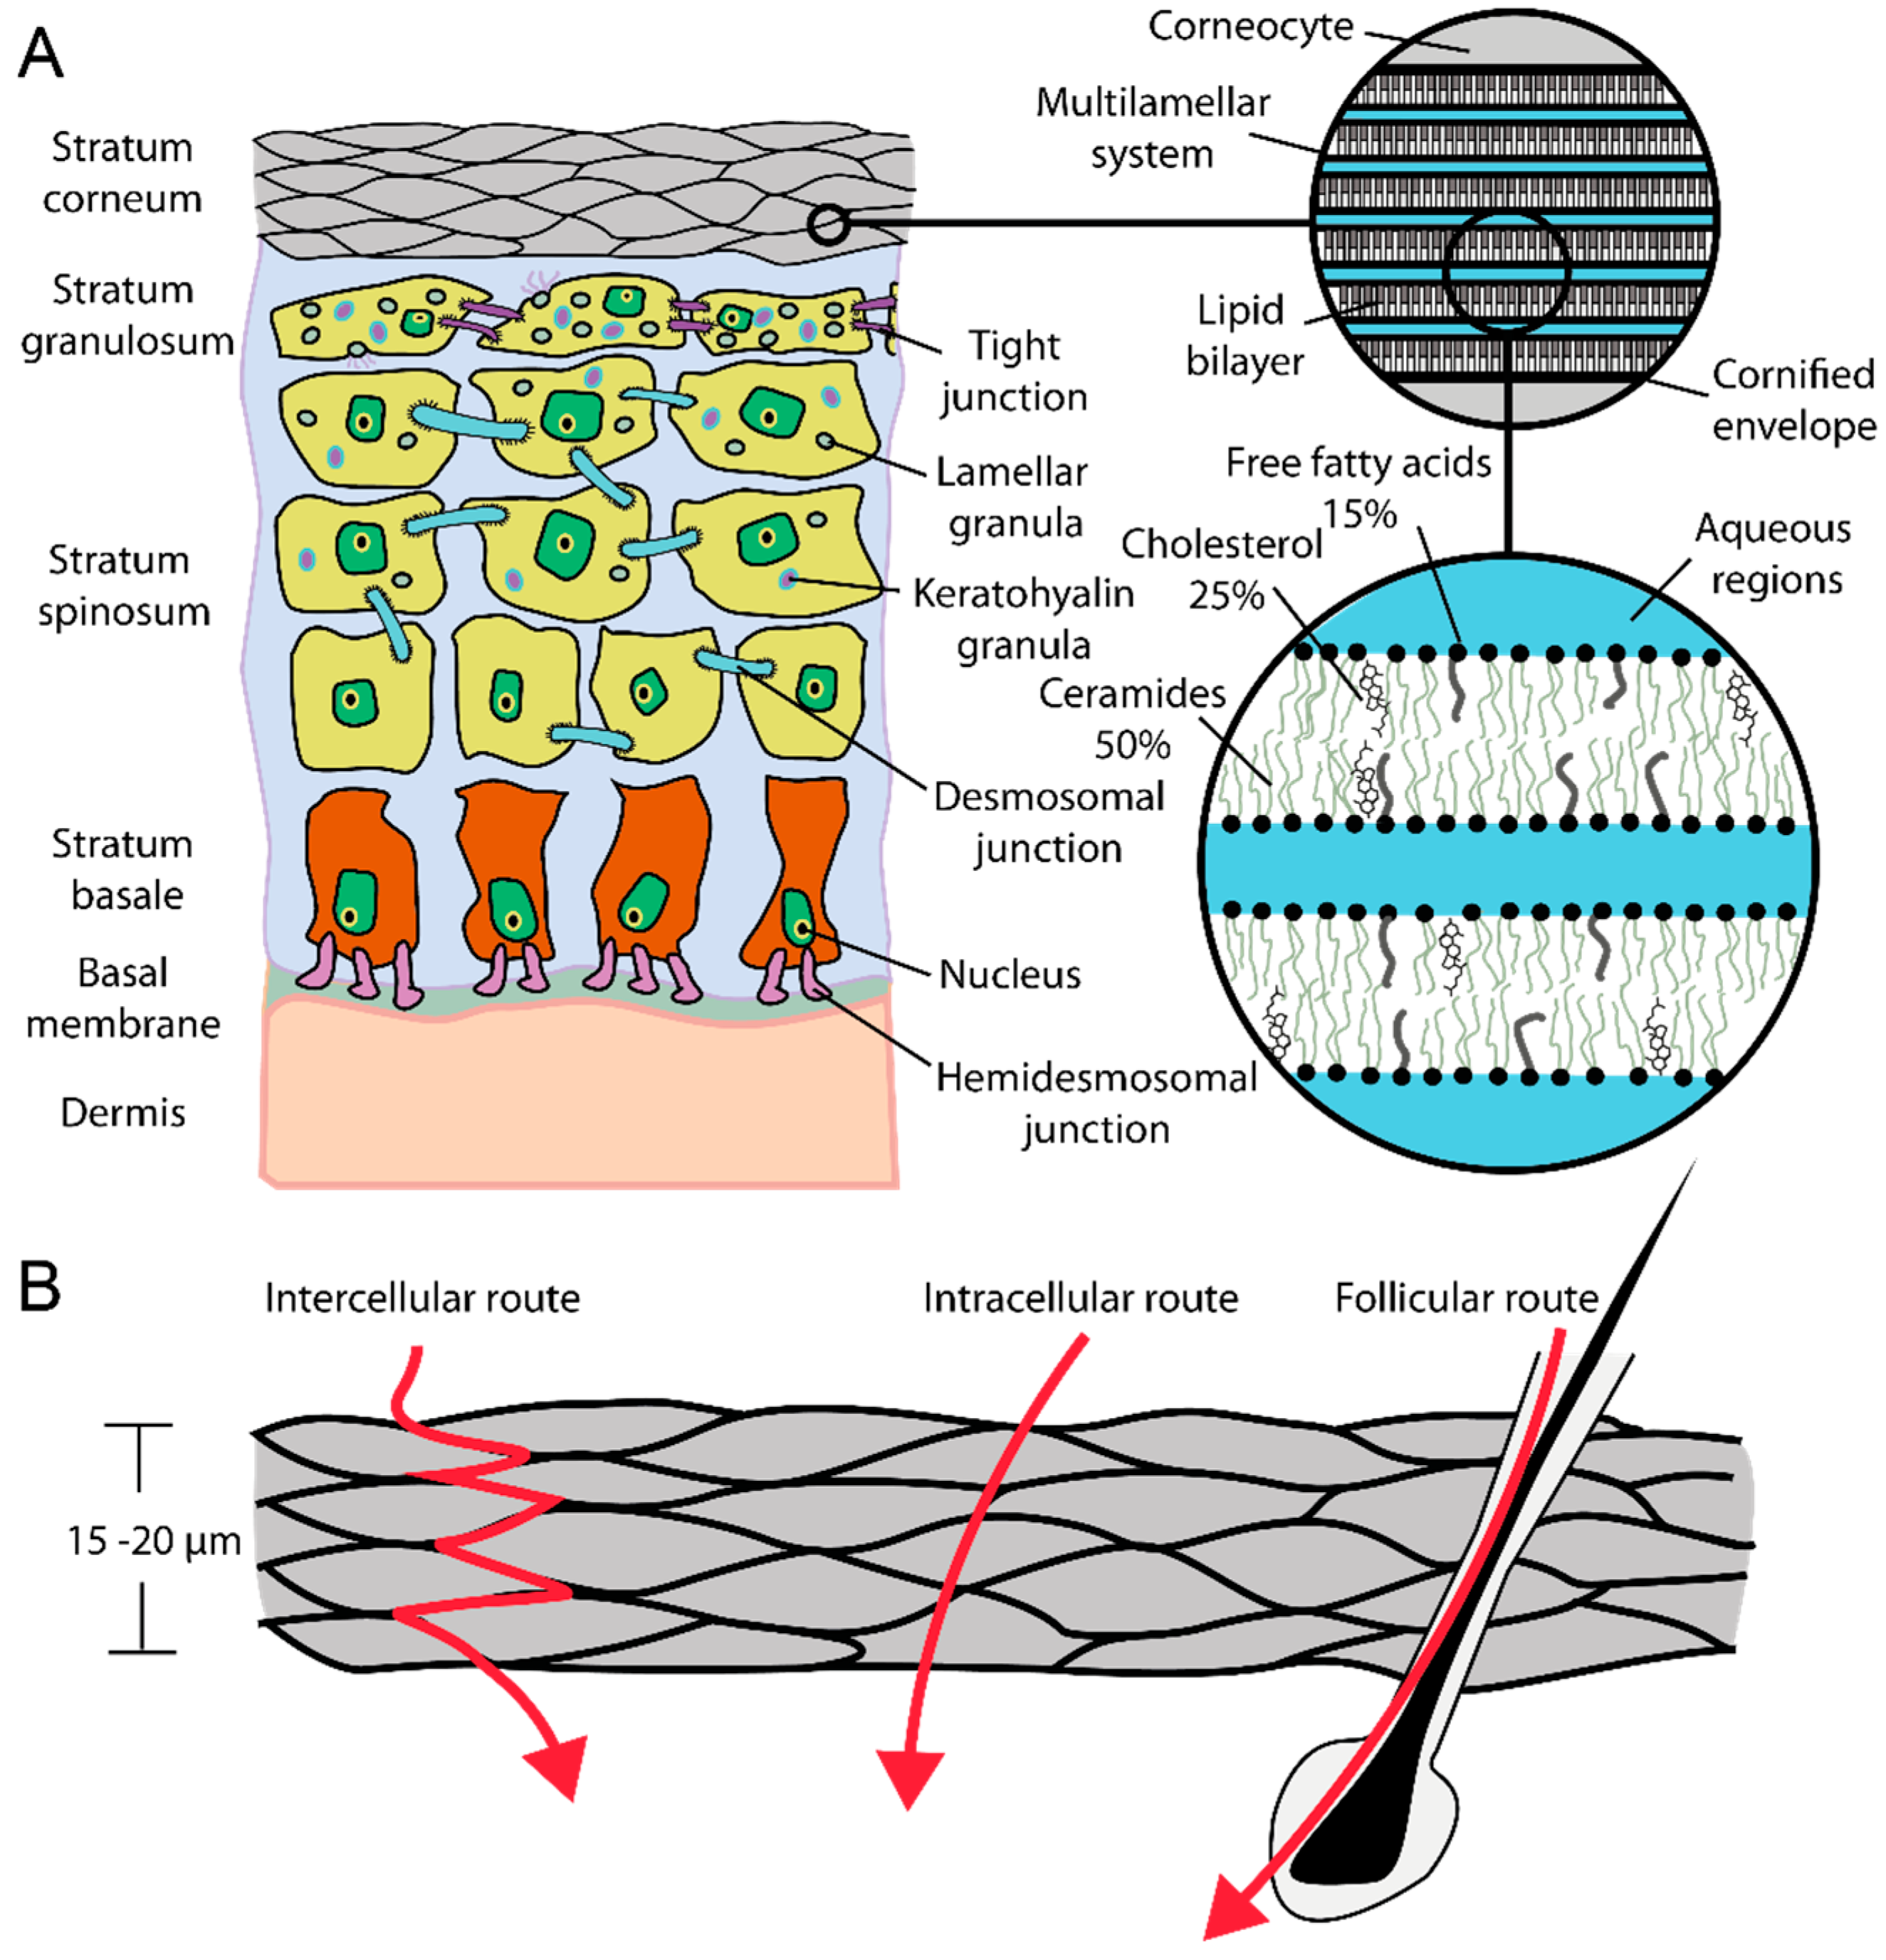
Abstract
:1. Introduction

2. Results and Discussion
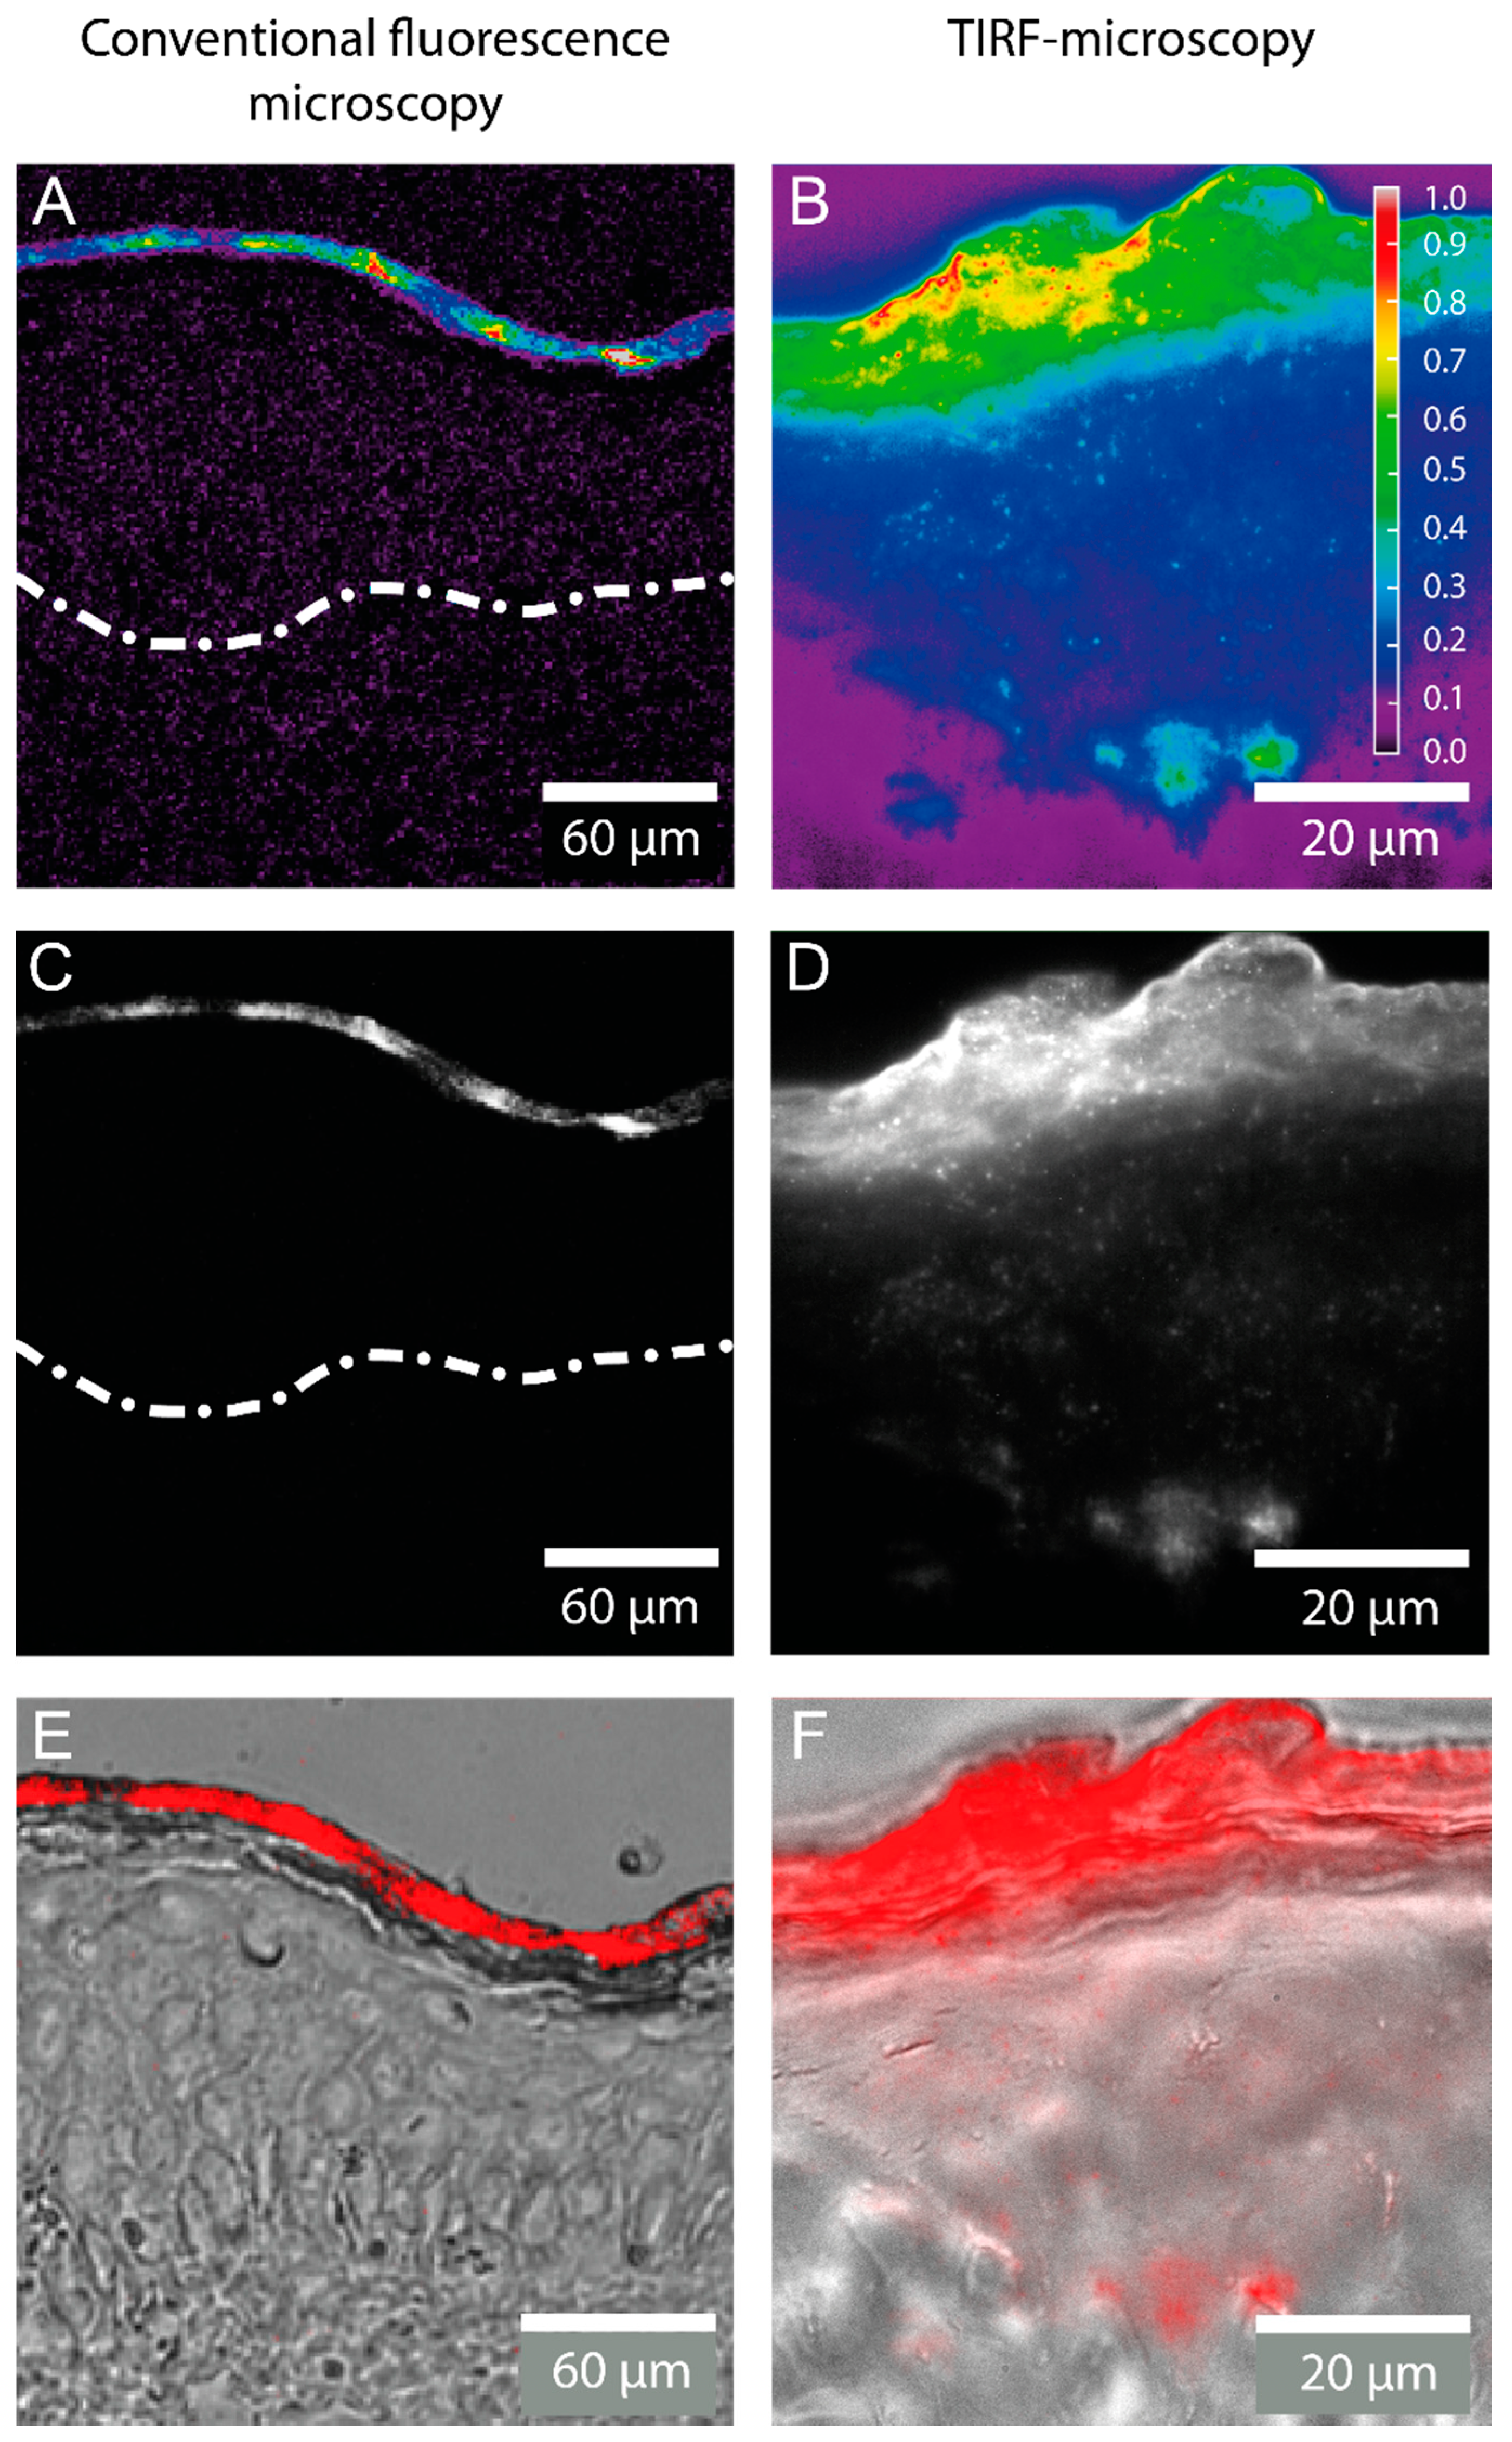
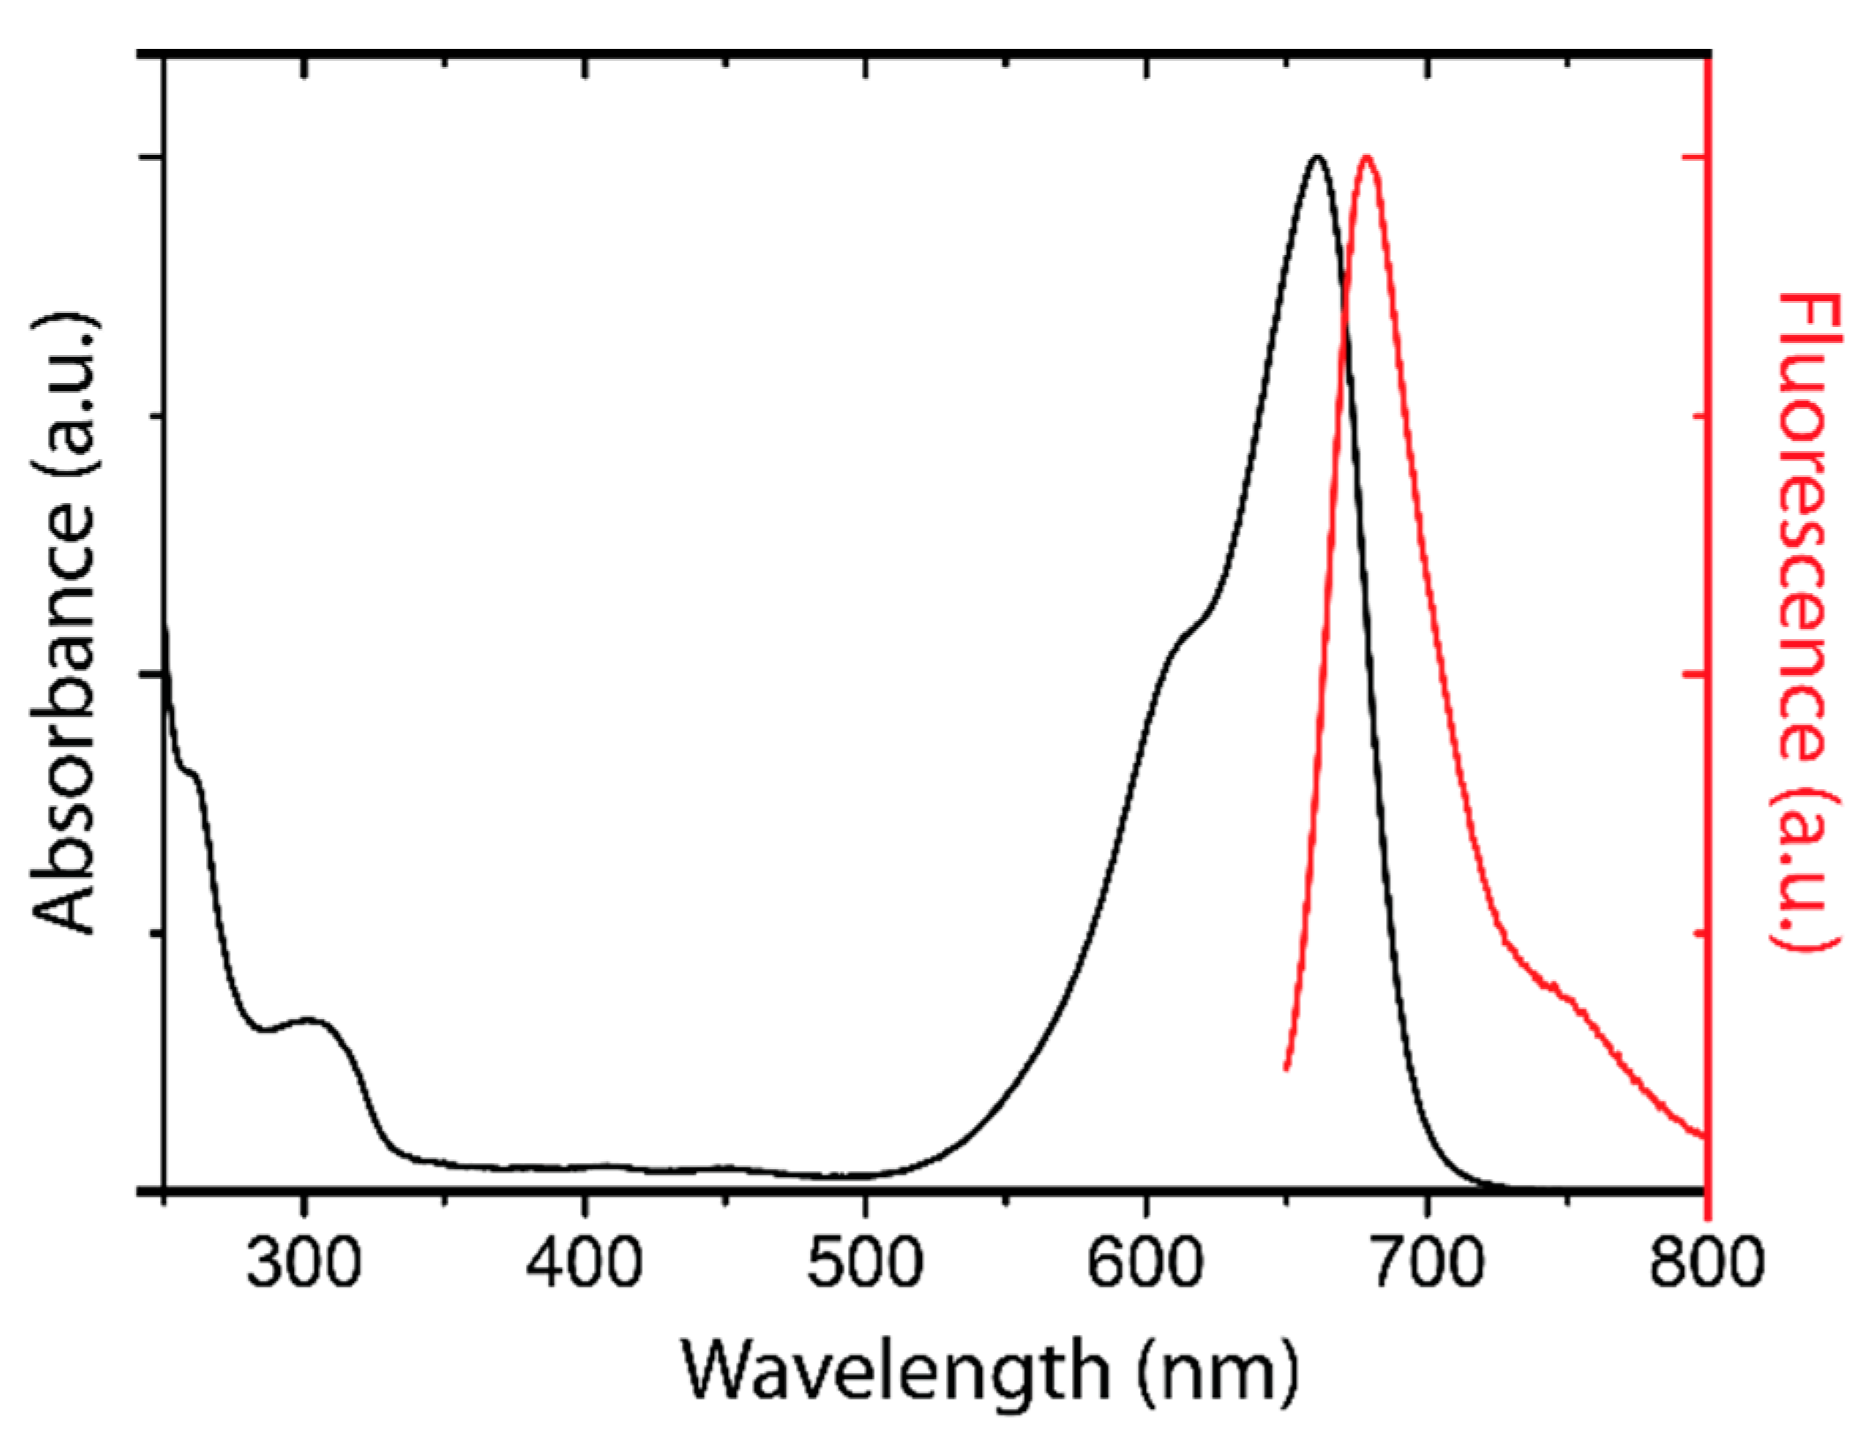
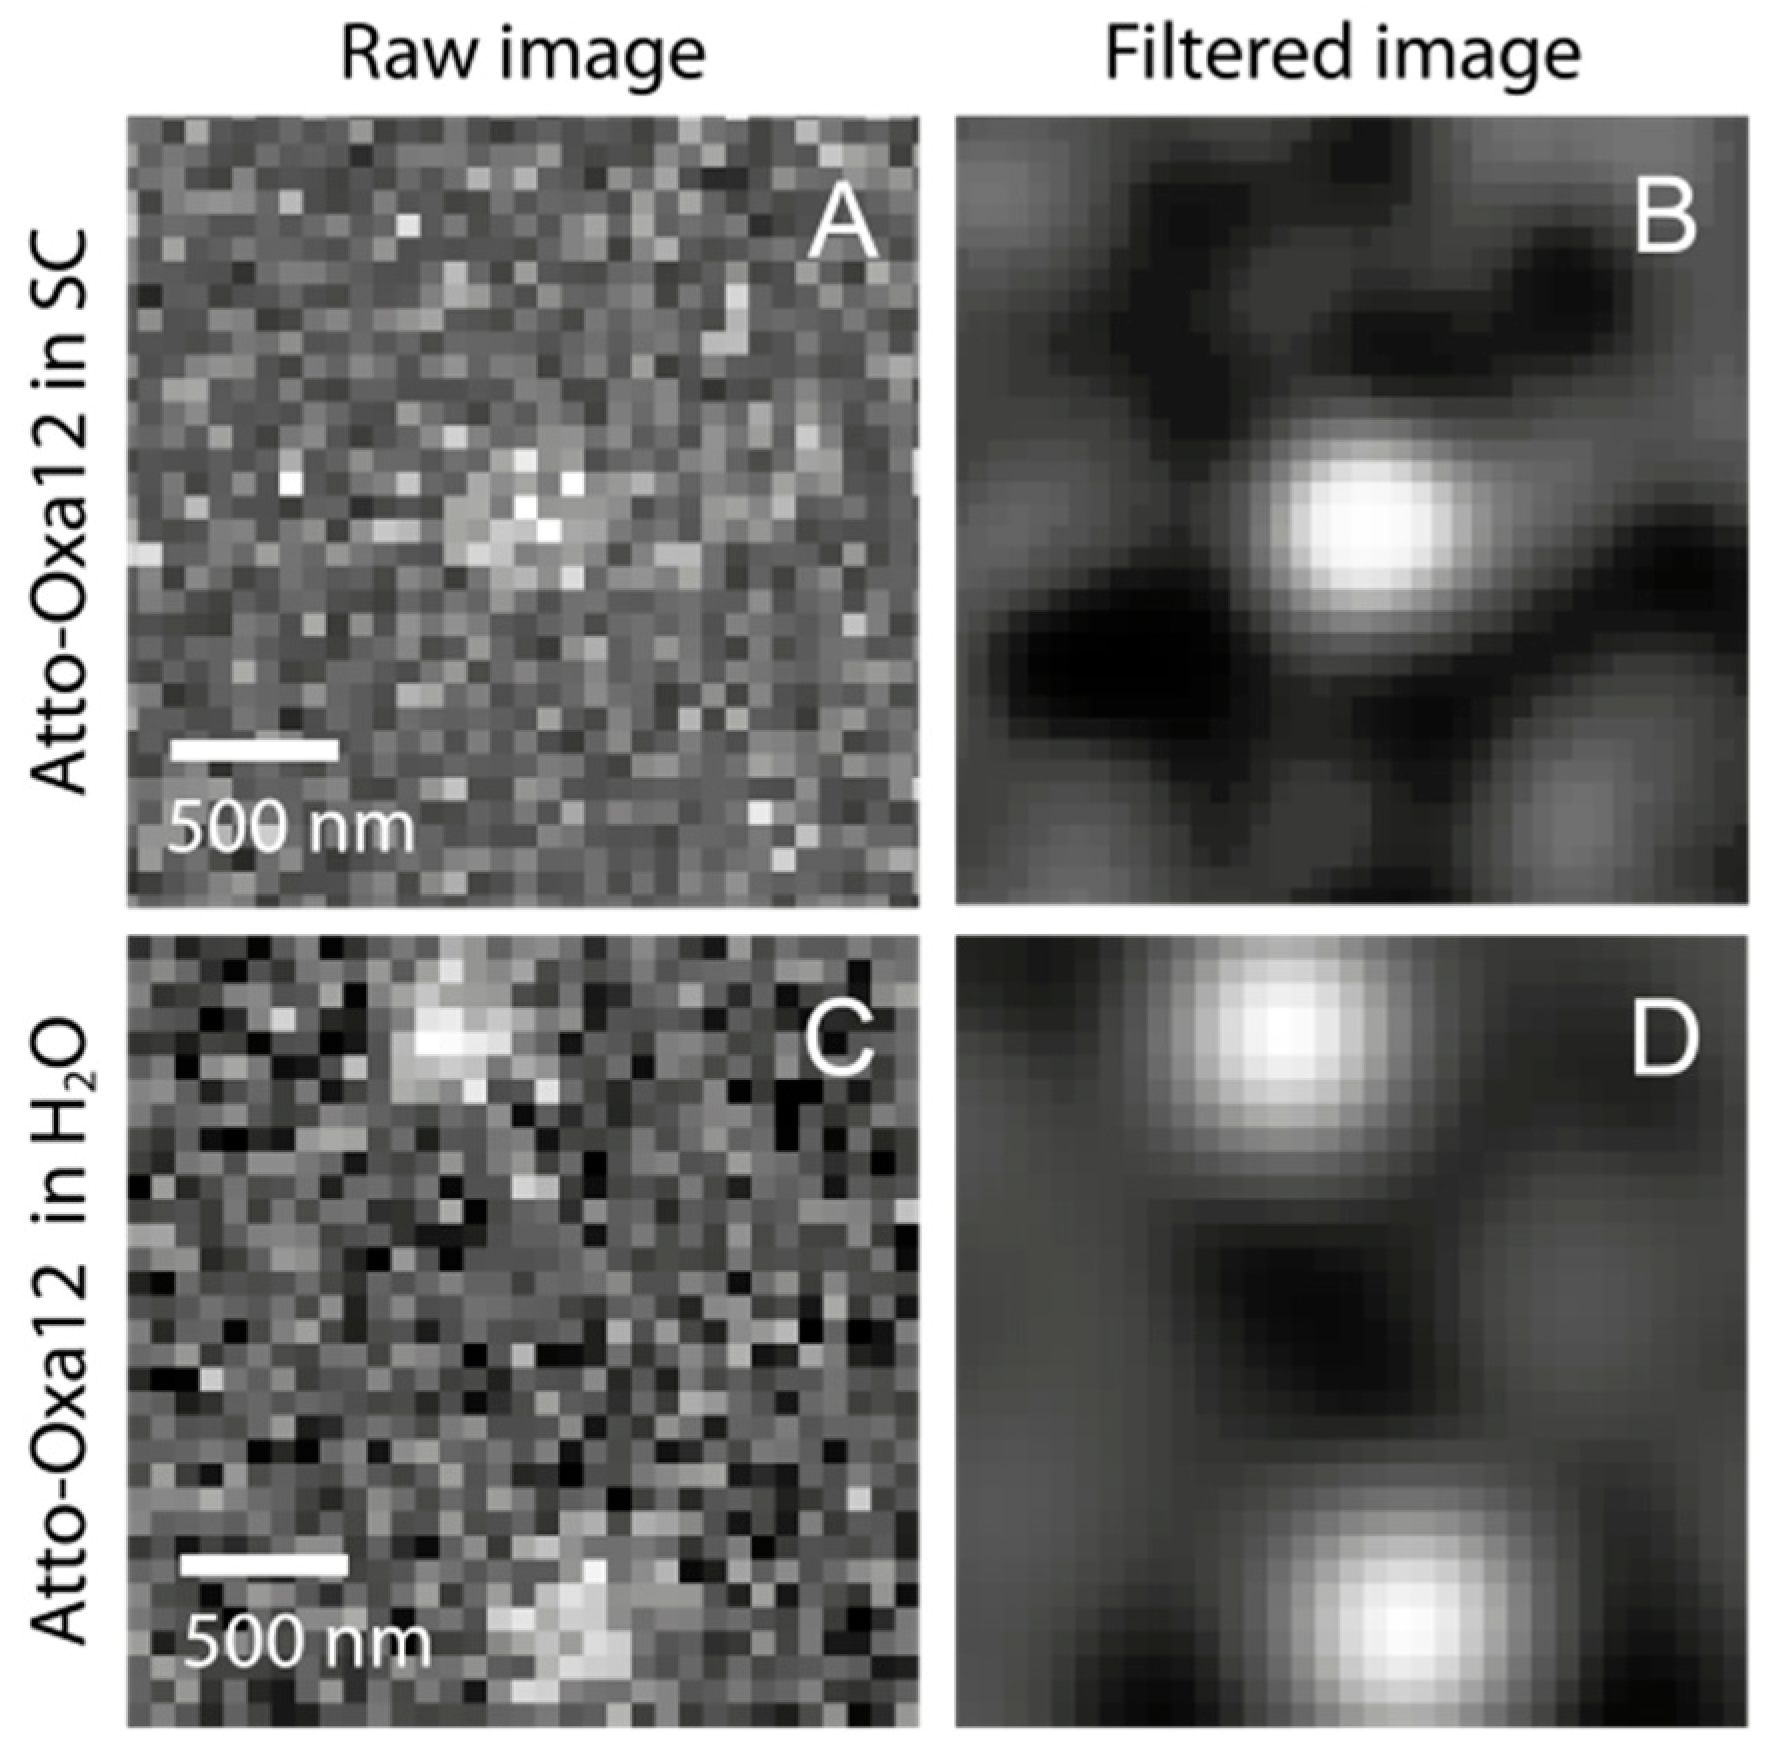
2.1. Detection of the Amphiphilic ATTO-Oxa12 Molecule in Cryosections of Excised Skin

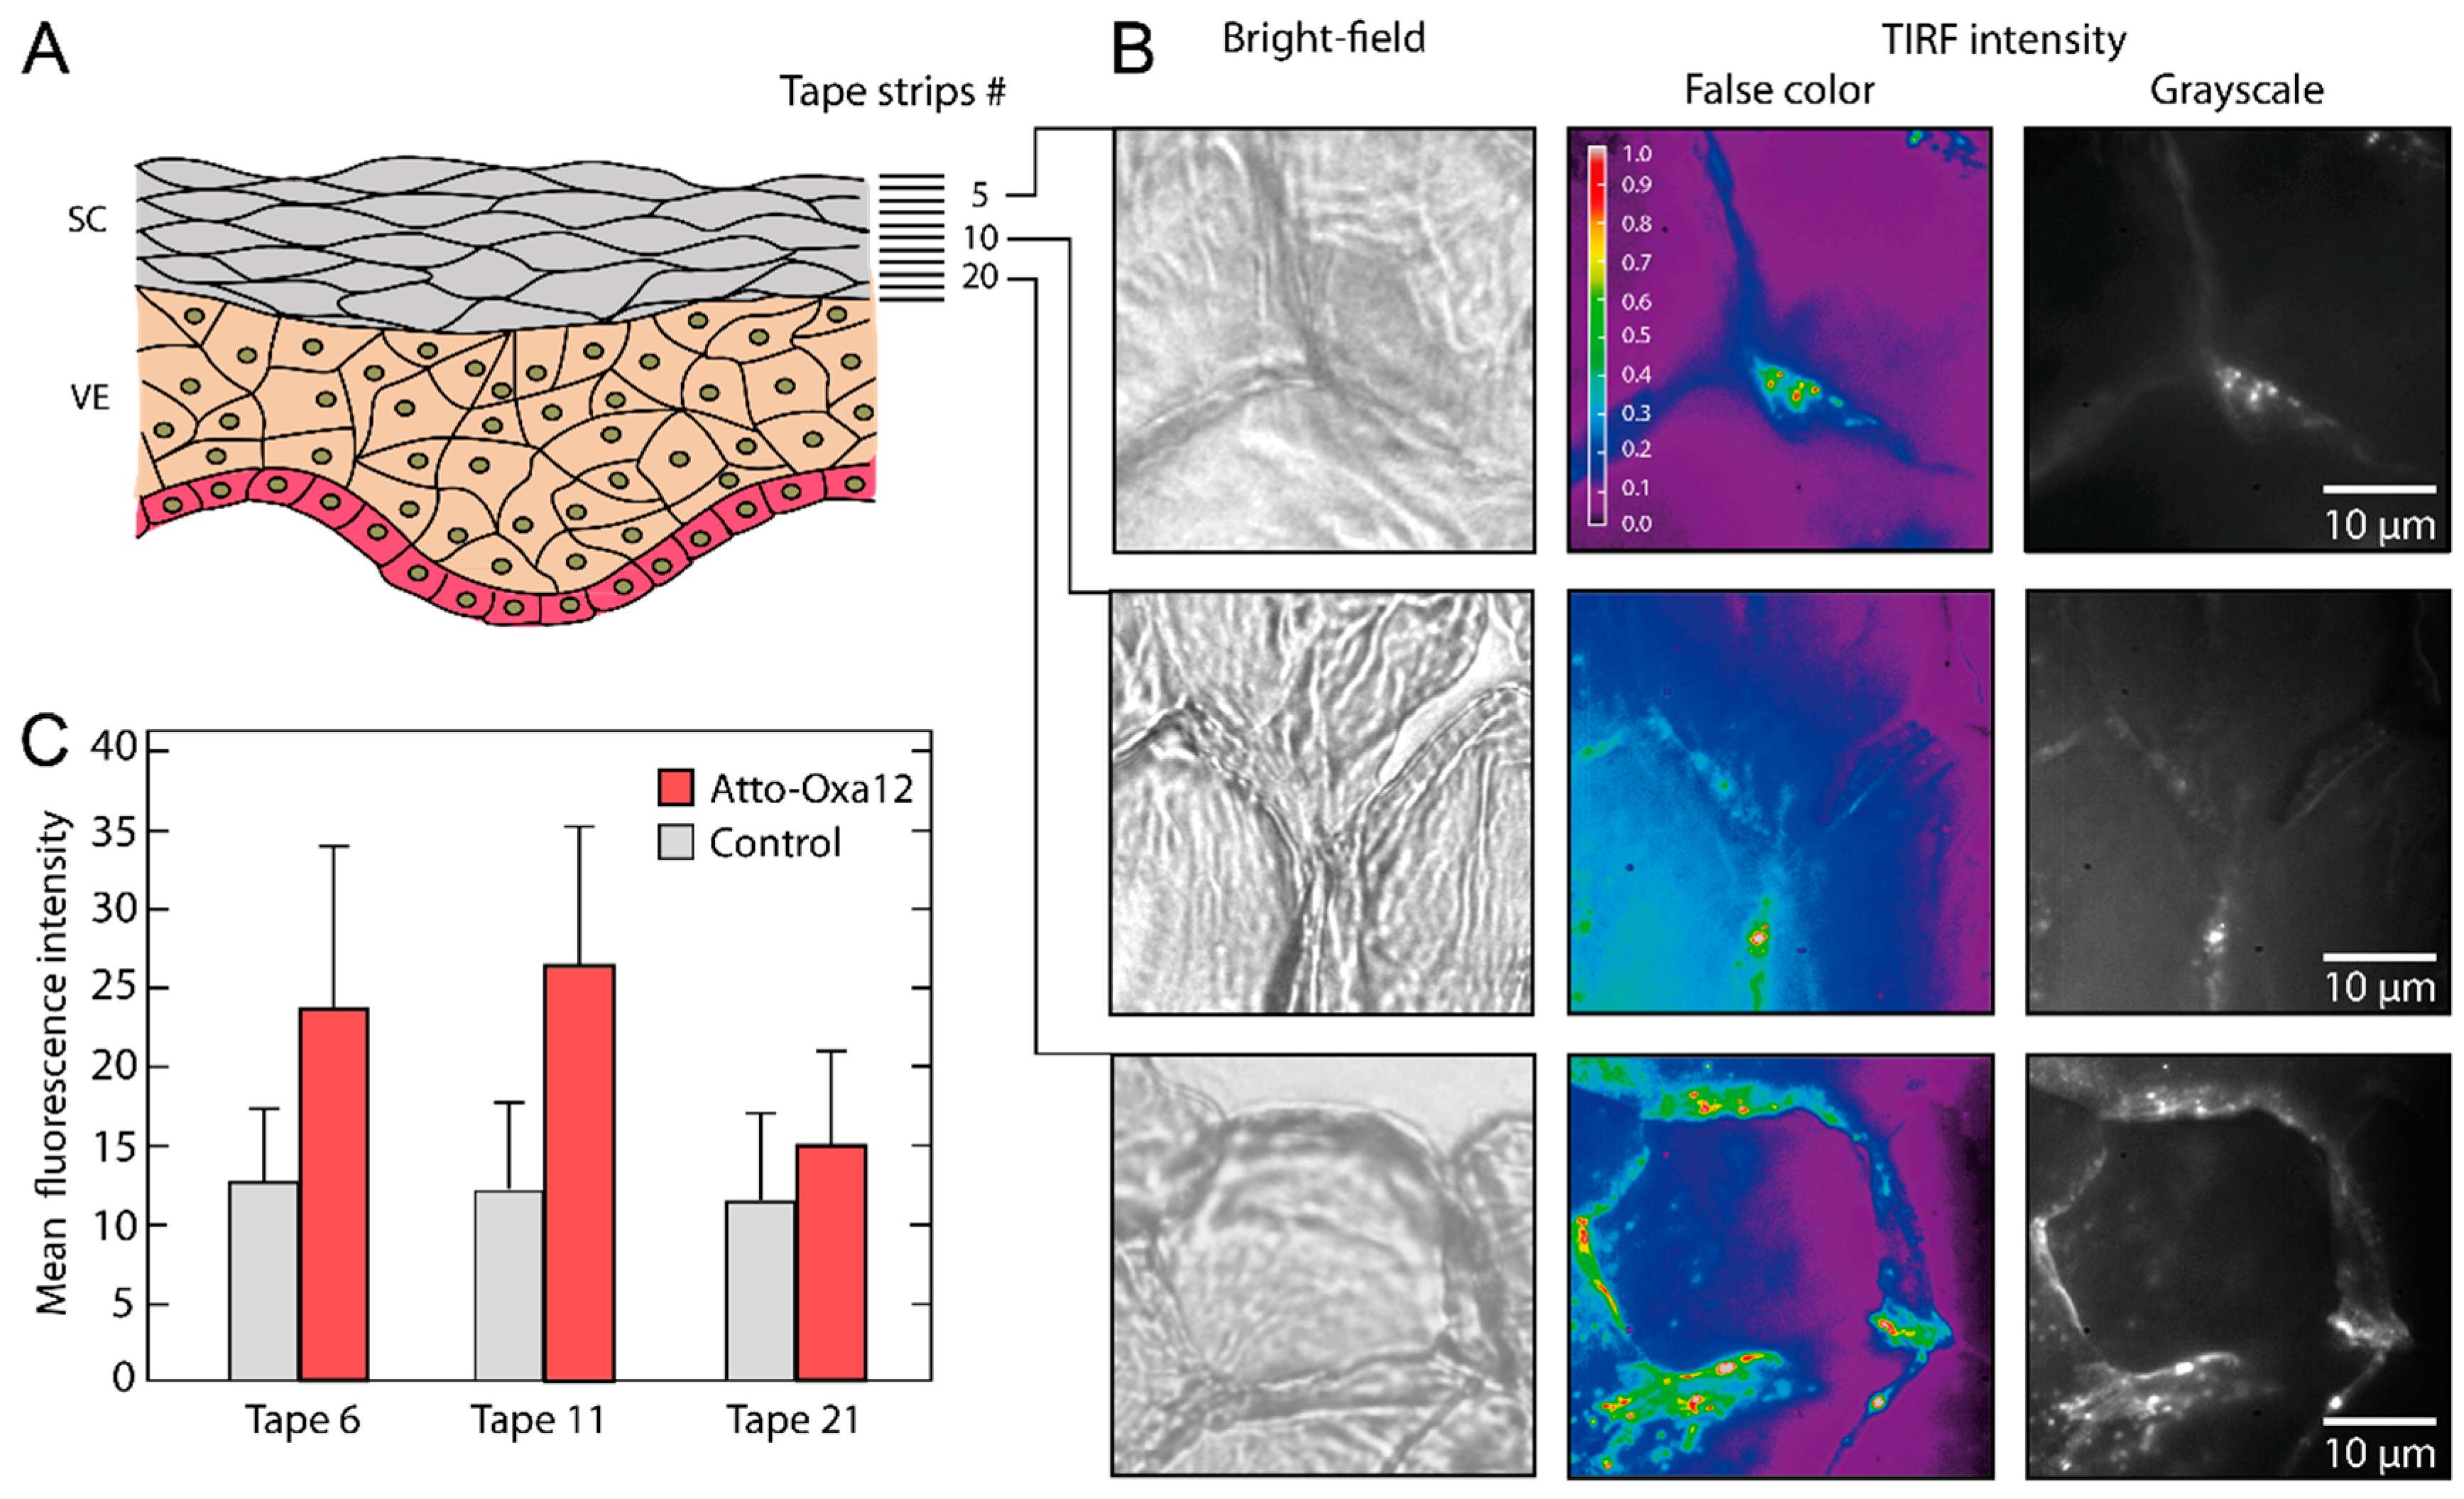
2.2. Stratum Corneum (SC) Profiles from Excised Skin

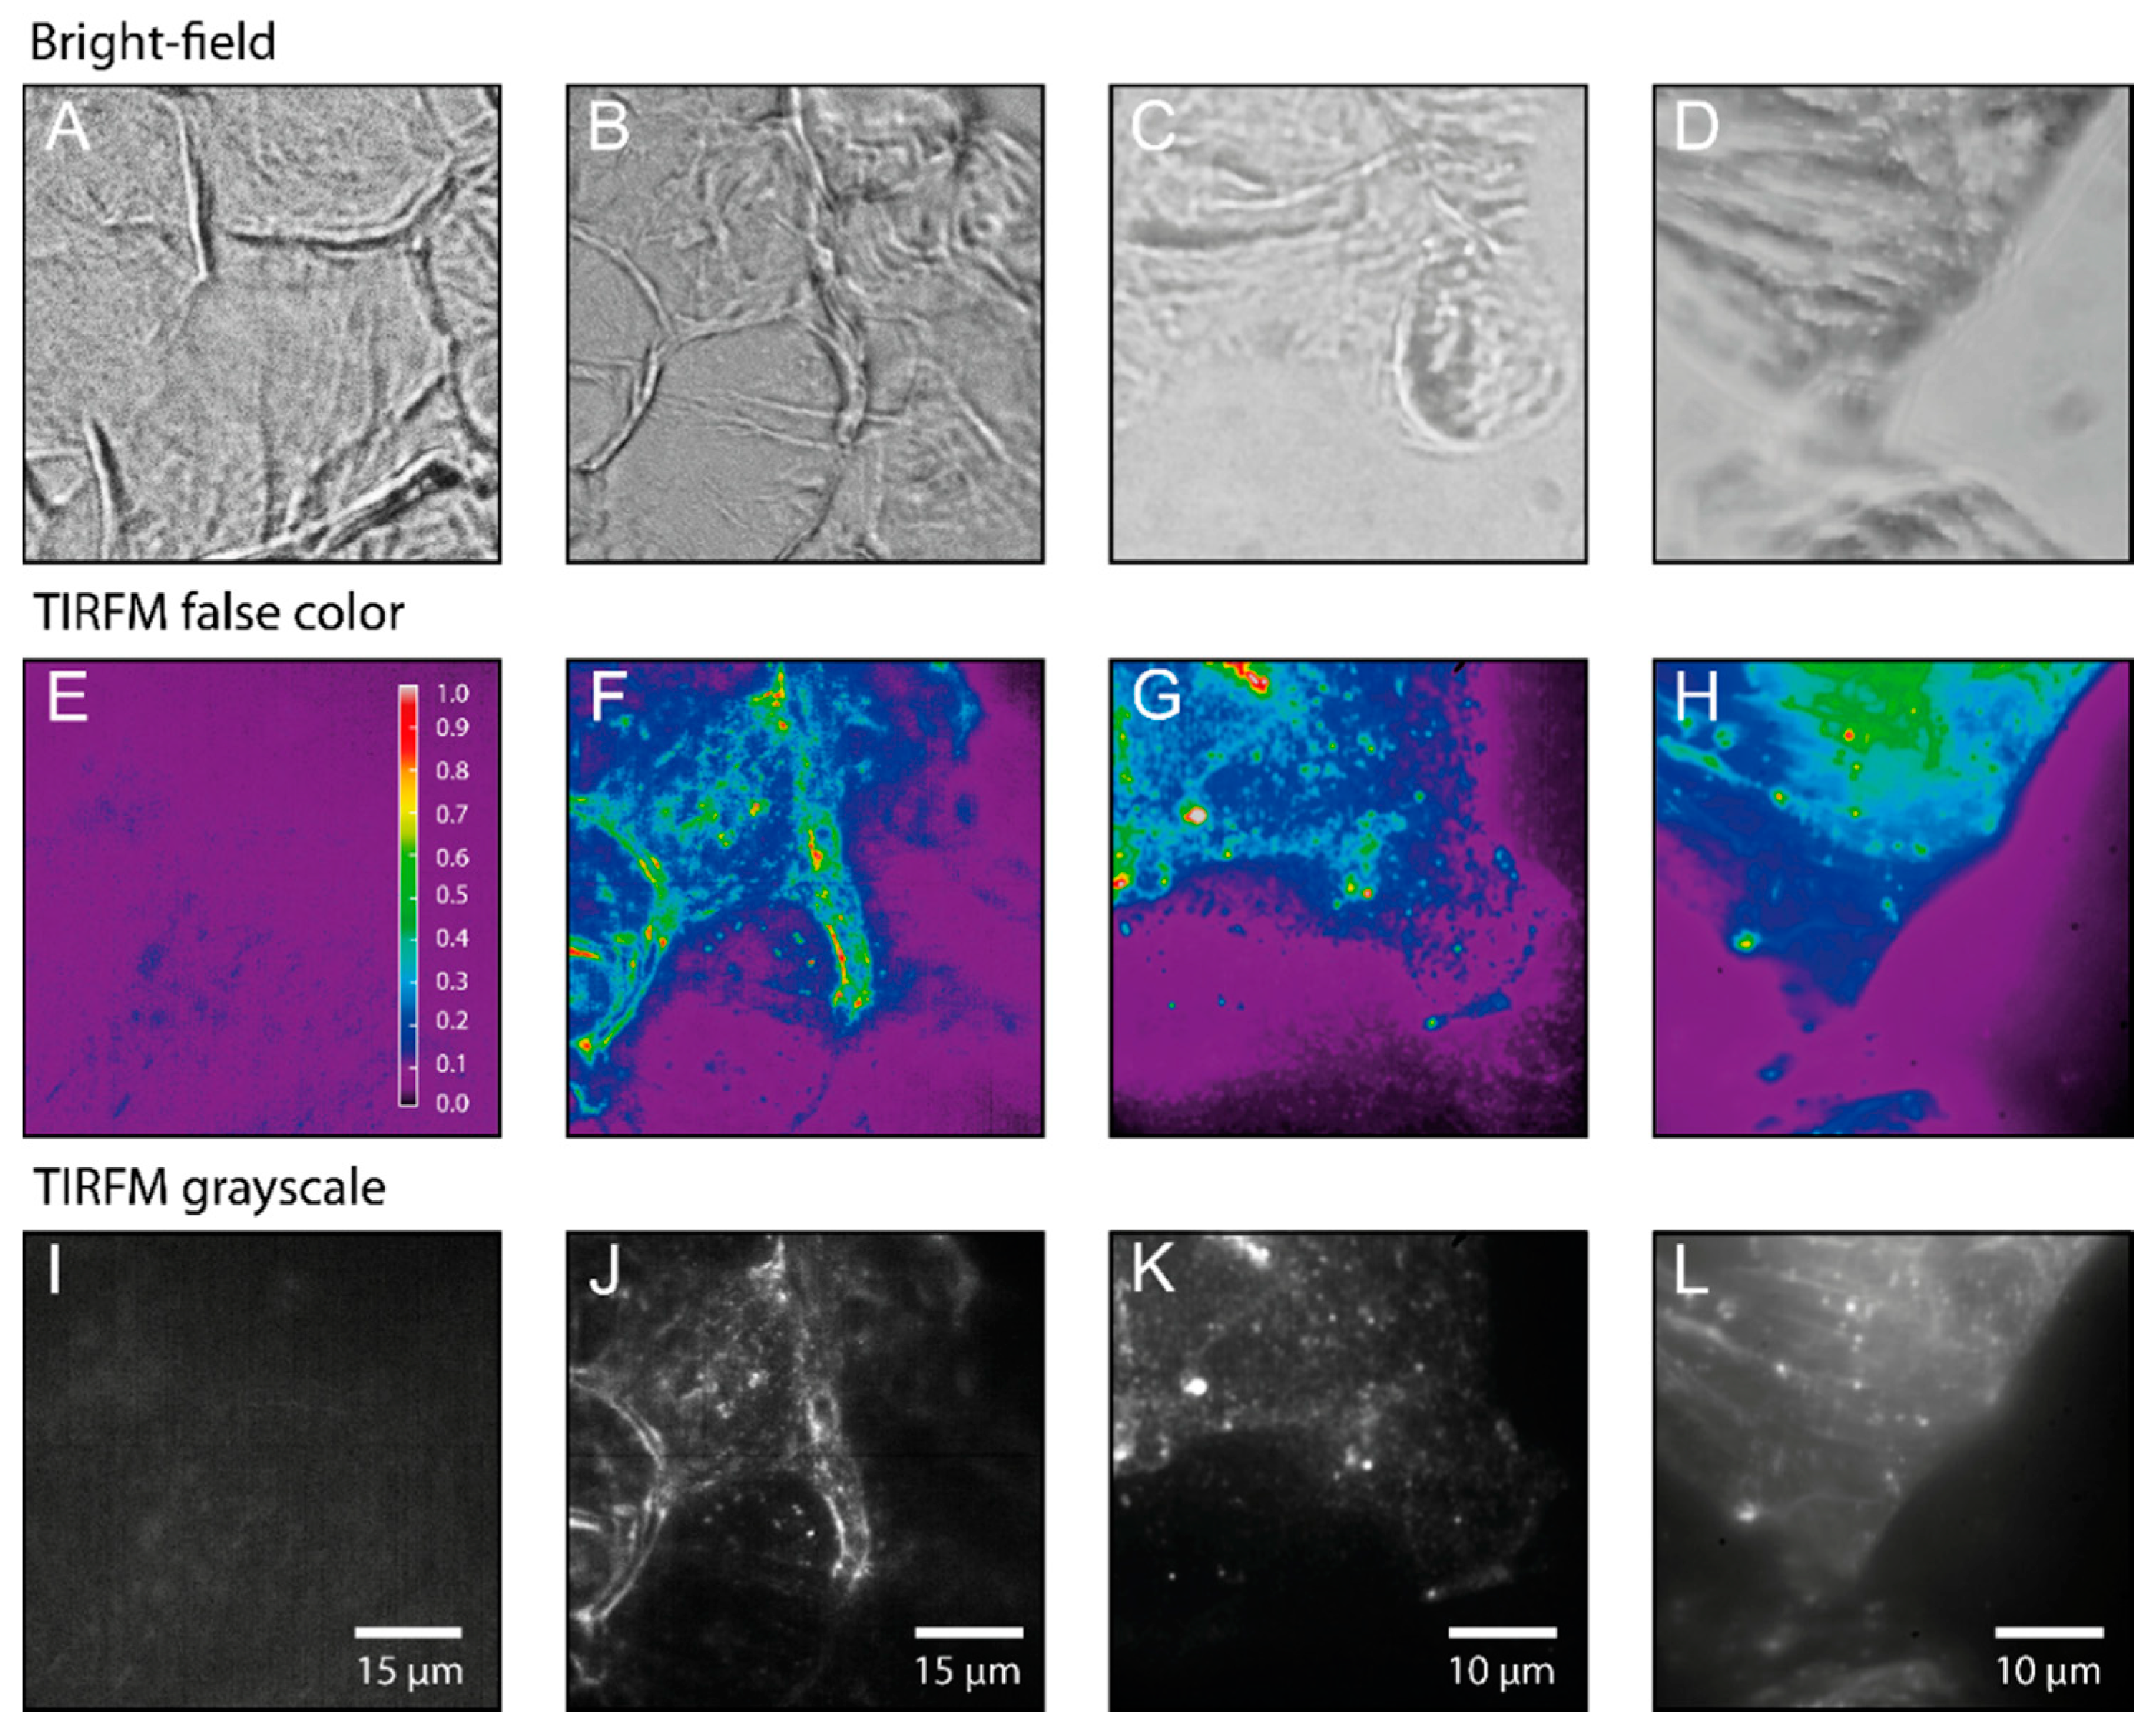
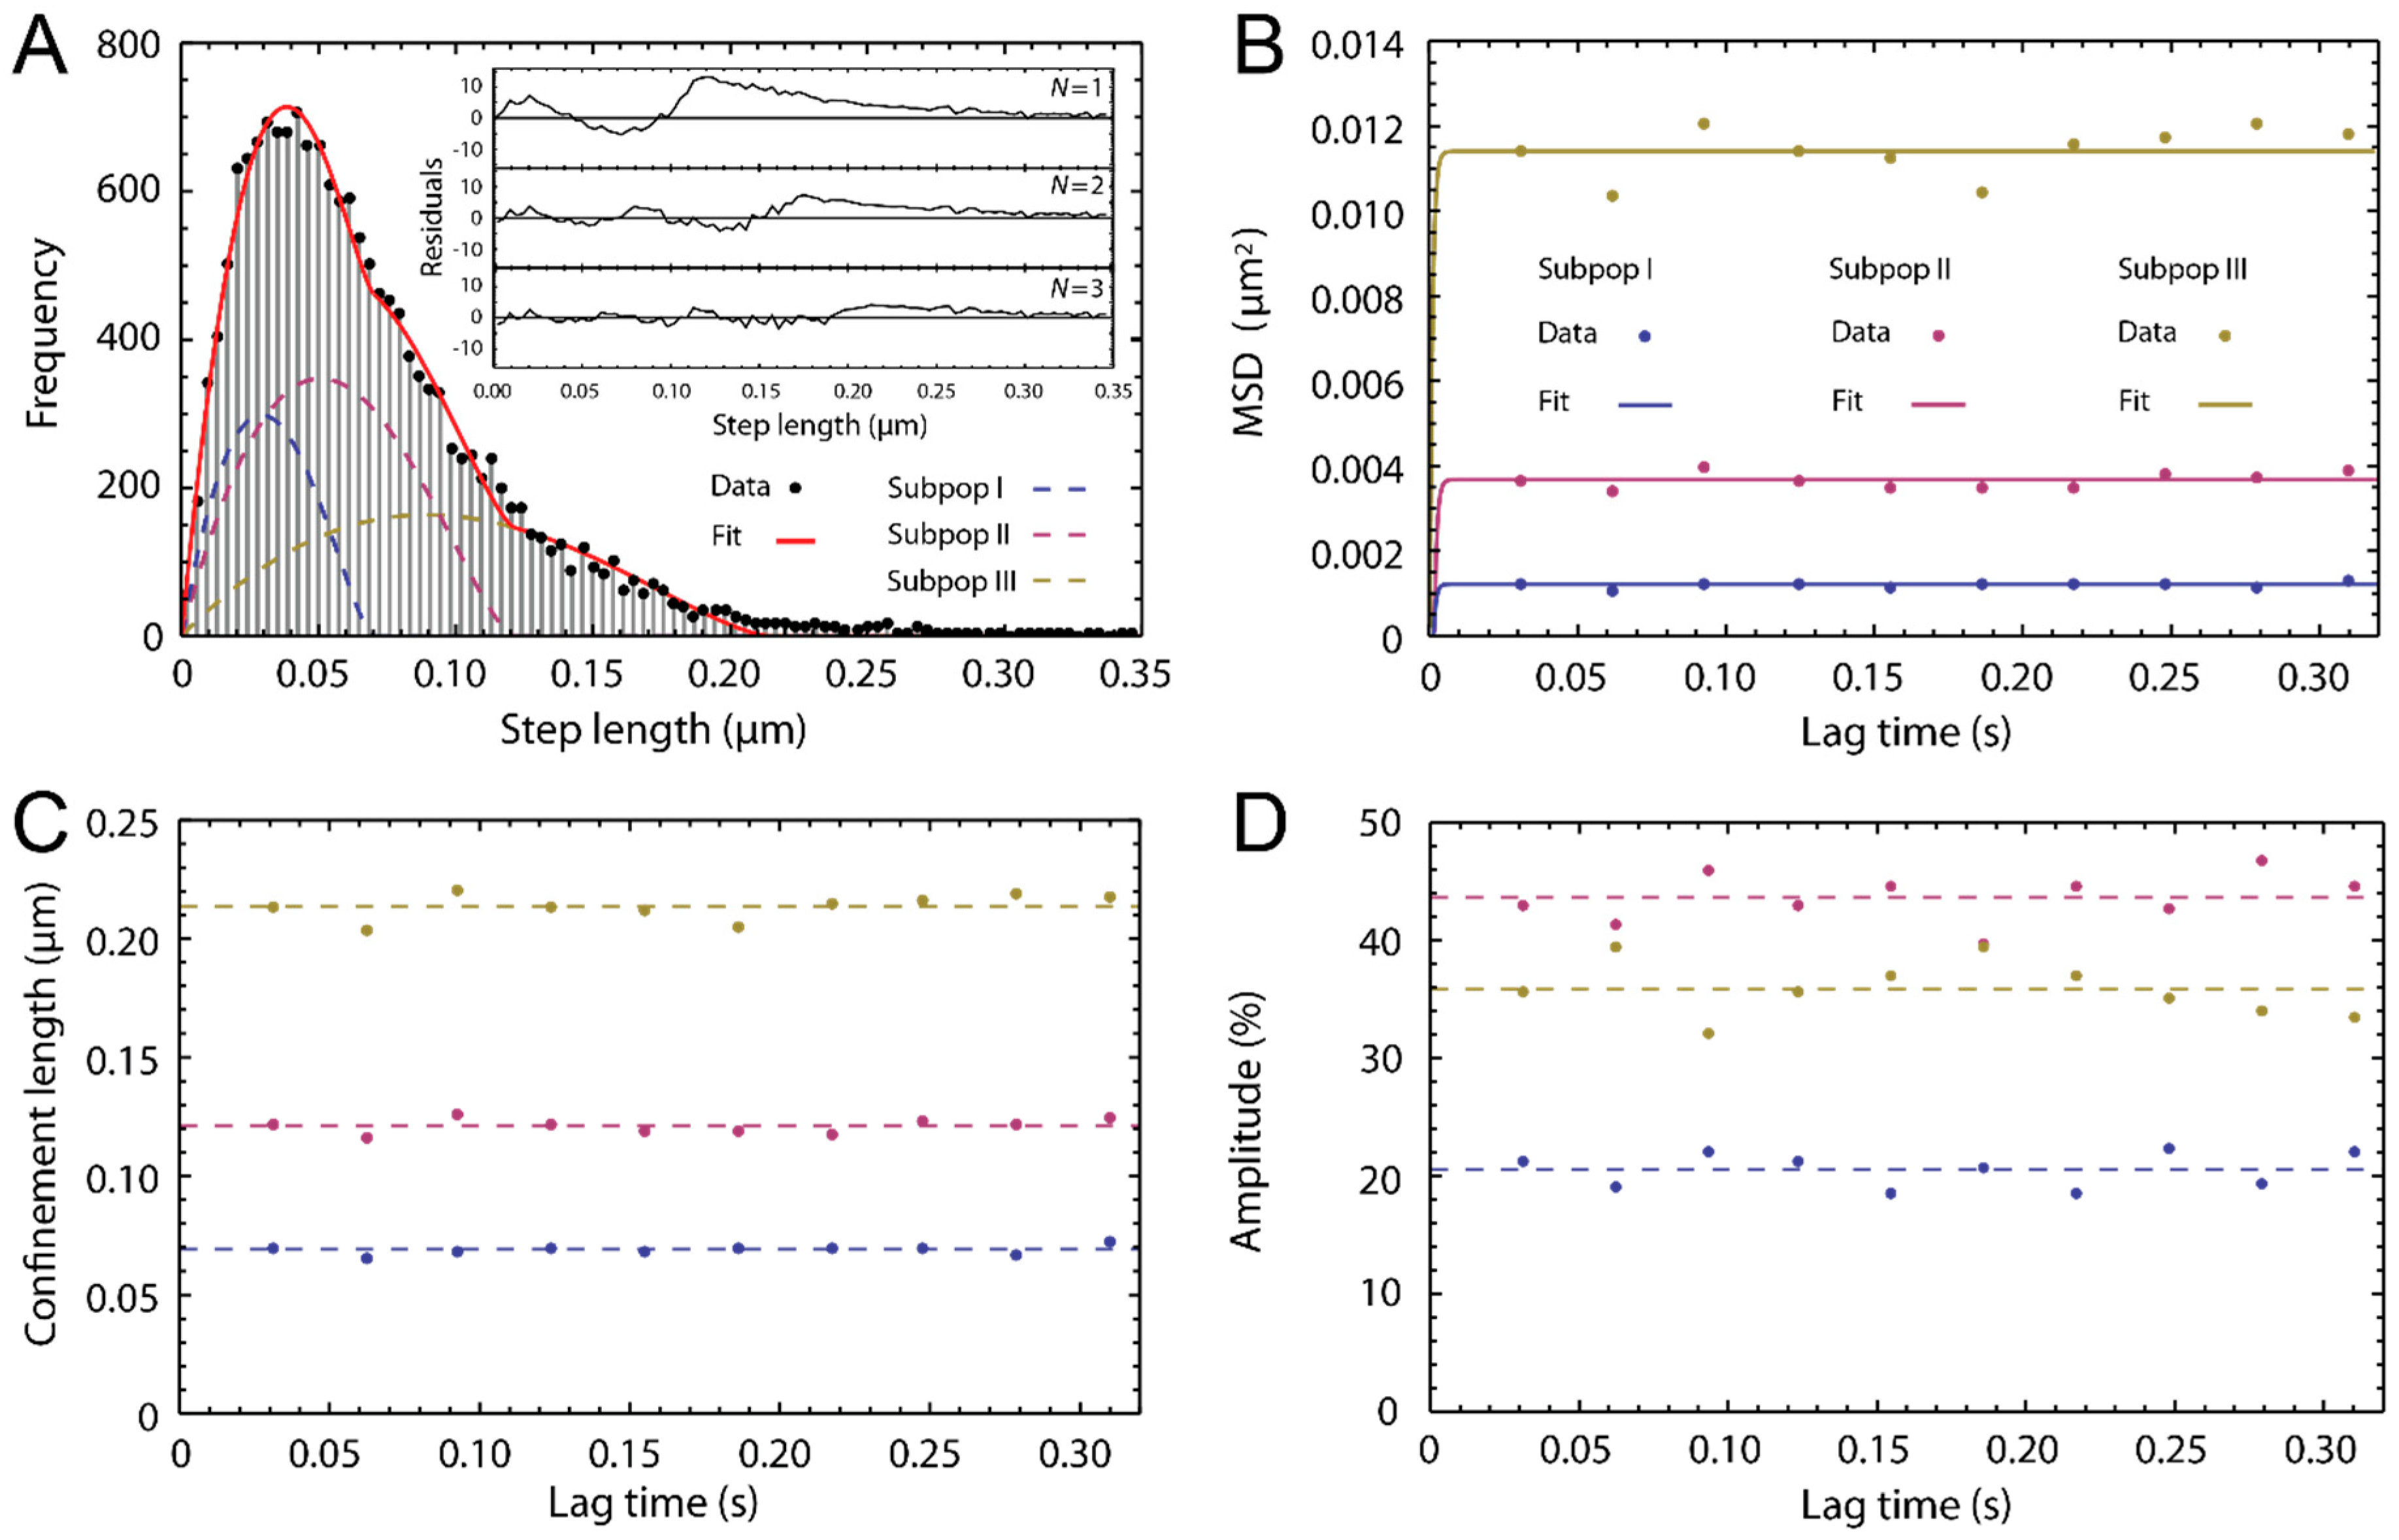
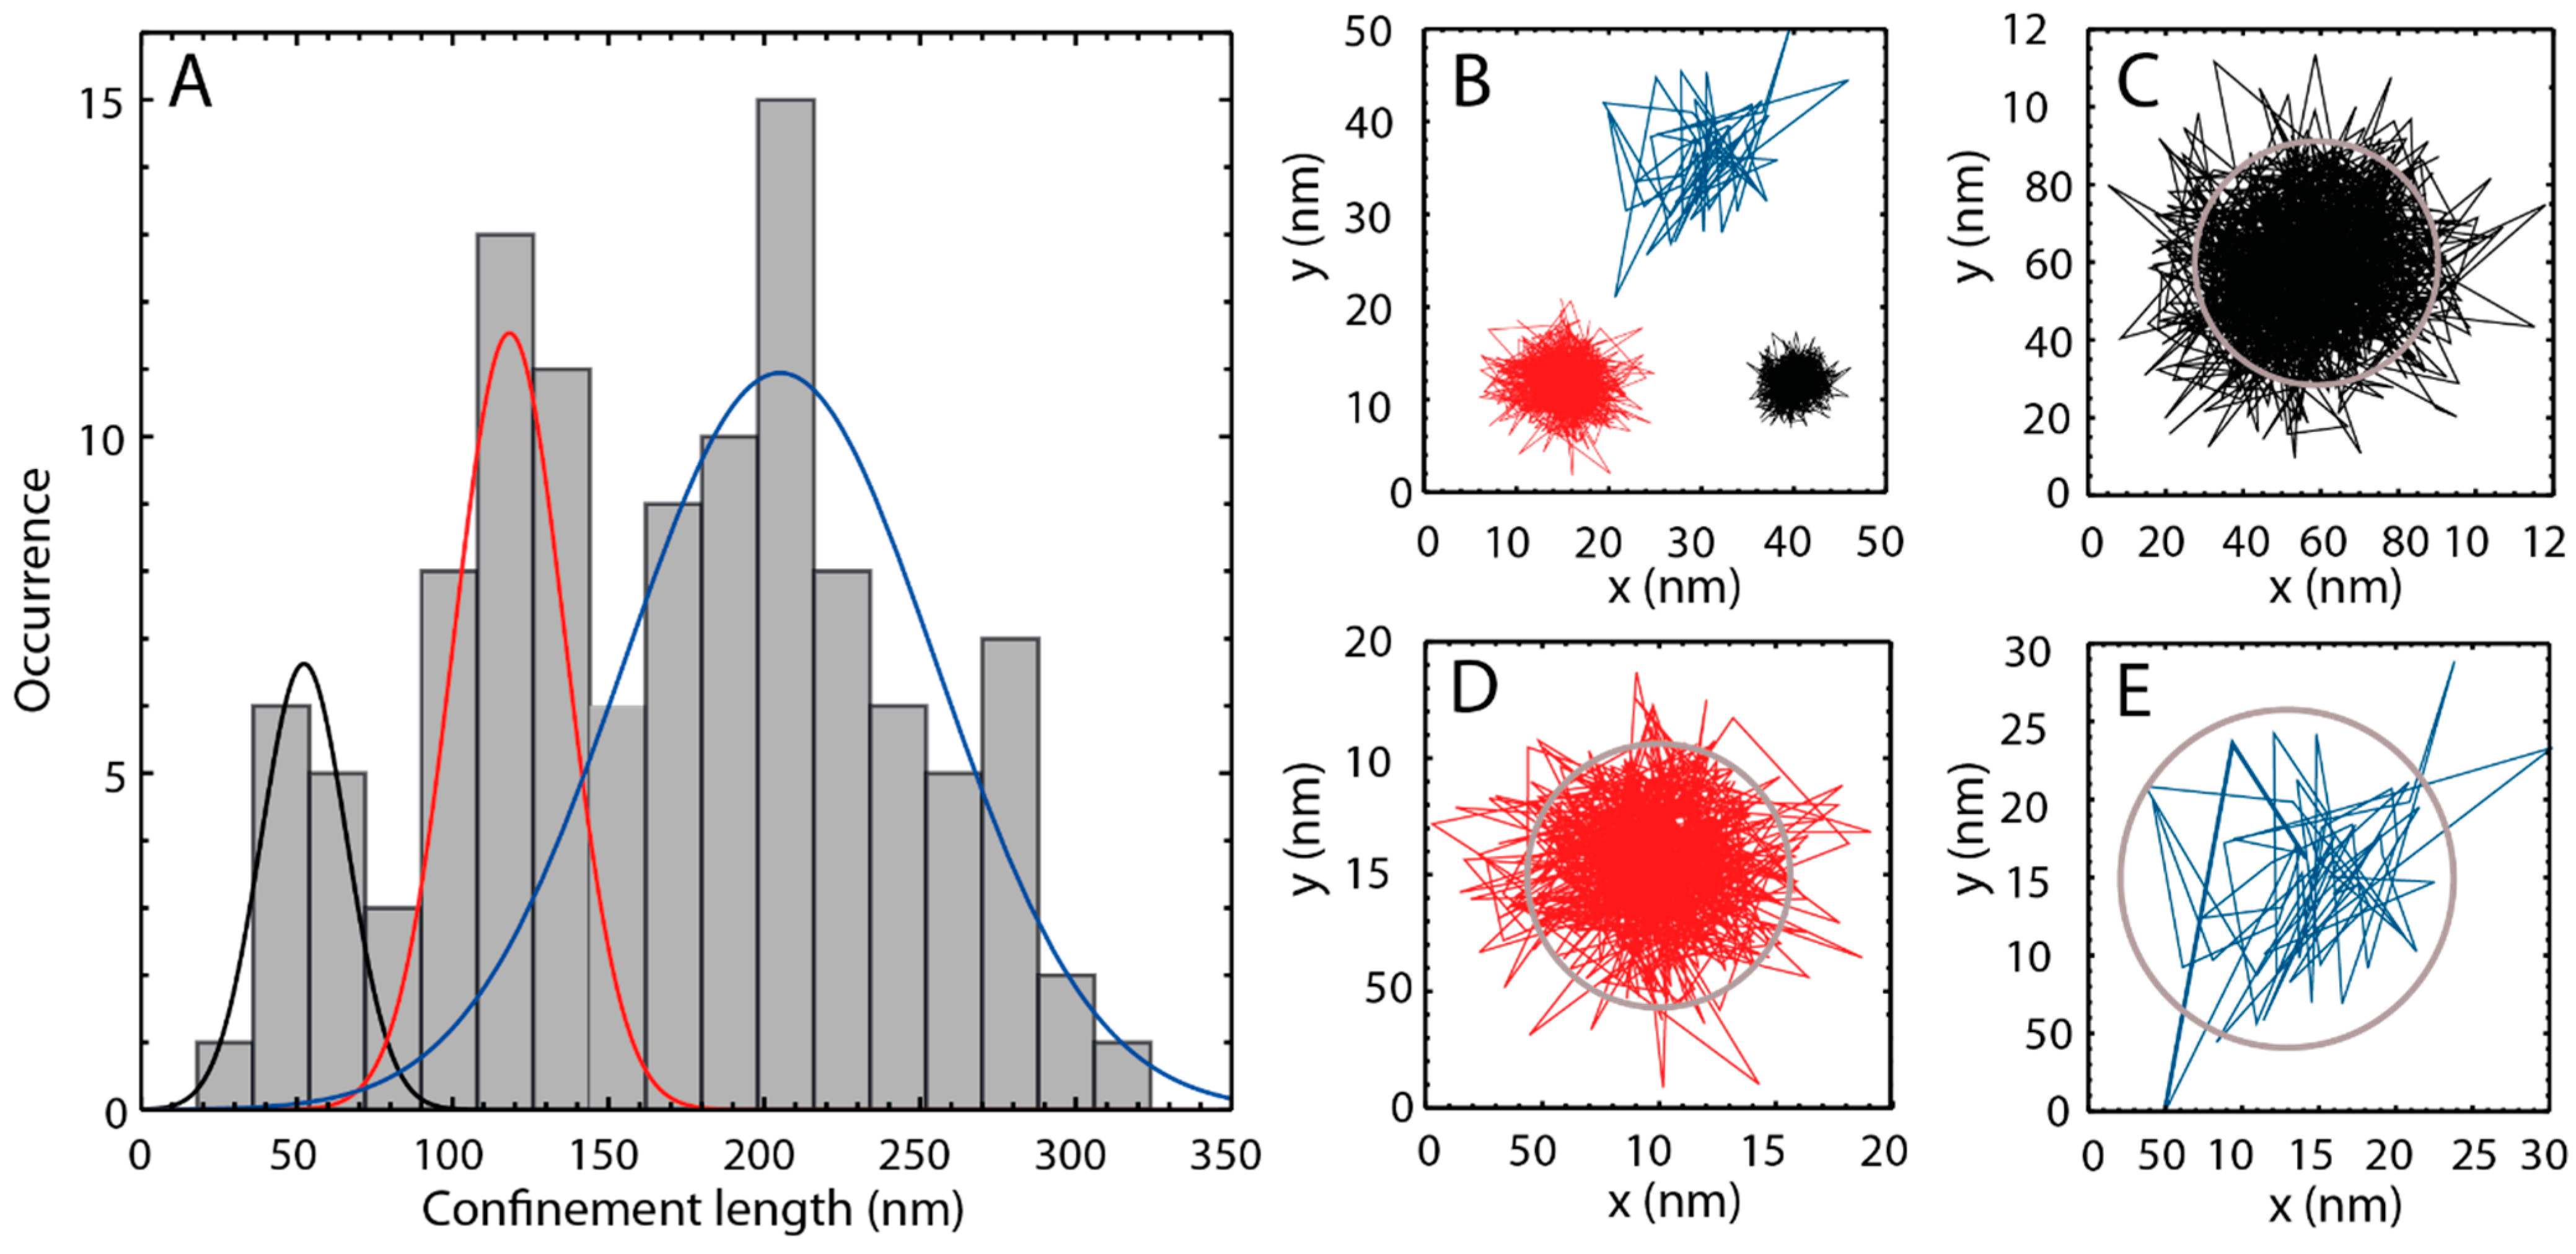
2.3. Single Particle Tracking of ATTO-Oxa12 Molecules in the SC


3. Experimental Section
3.1. Materials
3.1.1. ATTO-Oxa12

3.1.2. Topical Dye Application to Skin Explants
3.1.3. Sample Preparation
3.2. Methods
3.2.1. Fluorescence Microscopy
3.2.2. Single Molecule TIRF Microscopy

3.2.3. Single Molecule Data Analysis

4. Conclusions
Acknowledgments
Author Contributions
Conflicts of Interest
References
- Cevc, G. Lipid vesicles and other colloids as drug carriers on the skin. Adv. Drug Deliv. Rev. 2004, 56, 675–711. [Google Scholar] [CrossRef] [PubMed]
- Bos, J.D.; Meinardi, M.M. The 500 Dalton rule for the skin penetration of chemical compounds and drugs. Exp. Dermatol. 2000, 9, 165–169. [Google Scholar] [CrossRef] [PubMed]
- Osmola-Mankowska, A.; Polanska, A.; Silny, W.; Zaba, R.; Adamski, Z.; Danczak-Pazdrowska, A. Topical tacrolimus vs. medium-dose ultraviolet A1 phototherapy in the treatment of atopic dermatitis—A preliminary study in relation to parameters of the epidermal barrier function and high-frequency ultrasonography. Eur. Rev. Med. Pharmacol. Sci. 2014, 18, 3927–3934. [Google Scholar] [PubMed]
- Yoshida, K.; Yokouchi, M.; Nagao, K.; Ishii, K.; Amagai, M.; Kubo, A. Functional tight junction barrier localizes in the second layer of the stratum granulosum of human epidermis. J. Dermatol. Sci. 2013, 71, 89–99. [Google Scholar] [CrossRef] [PubMed]
- Feingold, K.R. Thematic review series: Skin lipids. The role of epidermal lipids in cutaneous permeability barrier homeostasis. J. Lipid Res. 2007, 48, 2531–2546. [Google Scholar] [CrossRef] [PubMed]
- Menon, G.K.; Elias, P.M. Ultrastructural localization of calcium in psoriatic and normal human-epidermis. Arch. Dermatol. 1991, 127, 57–63. [Google Scholar] [CrossRef] [PubMed]
- Bouwstra, J.A.; Honeywell-Nguyen, P.L.; Gooris, G.S.; Ponec, M. Structure of the skin barrier and its modulation by vesicular formulations. Prog. Lipid Res. 2003, 42, 1–36. [Google Scholar] [CrossRef] [PubMed]
- Sandby-Moller, J.; Poulsen, T.; Wulf, H.C. Epidermal thickness at different body sites: Relationship to age, gender, pigmentation, blood content, skin type and smoking habits. Acta Derm. Venereol. 2003, 83, 410–413. [Google Scholar] [CrossRef] [PubMed]
- Koehler, M.J.; Vogel, T.; Elsner, P.; König, K.; Bückle, R.; Kaatz, M. In vivo measurement of the human epidermal thickness in different localizations by multiphoton laser tomography. Skin Res. Technol. 2010, 16, 259–264. [Google Scholar] [PubMed]
- Baroli, B. Penetration of nanoplarticles and nanomaterials in the skin: Fiction or reality? J. Pharm. Sci. 2010, 99, 21–50. [Google Scholar] [CrossRef] [PubMed]
- Turcan, I.; Jonkman, M.F. Blistering disease: Insight from the hemidesmosome and other components of the dermal-epidermal junction. Cell Tissue Res. 2014. [Google Scholar] [CrossRef]
- Bartosova, L.; Bajgar, J. Transdermal drug delivery in vitro using diffusion cells. Curr. Med. Chem. 2012, 19, 4671–4677. [Google Scholar] [CrossRef] [PubMed]
- Schroter, A.; Kessner, D.; Kiselev, M.A.; Hauss, T.; Dante, S.; Neubert, R.H. Basic nanostructure of stratum corneum lipid matrices based on ceramides (EOS) and (AP): A neutron diffraction study. Biophys. J. 2009, 97, 1104–1114. [Google Scholar] [CrossRef] [PubMed]
- Bouwstra, J.A.; Gooris, G.S. The lipid organisation in human stratum corneum and model systems. TODJ 2010, 4, 10–13. [Google Scholar]
- Bouwstra, J.A.; Gooris, G.S.; van der Spek, J.A.; Bras, W. Structural investigations of human stratum corneum by small-angle X-ray scattering. J. Investig. Dermatol. 1991, 97, 1005–1012. [Google Scholar] [CrossRef] [PubMed]
- Richter, T.; Peuckert, C.; Sattler, M.; Koenig, K.; Riemann, I.; Hintze, U.; Wittern, K.P.; Wiesendanger, R.; Wepf, R. Dead but highly dynamic—The stratum corneum is divided into three hydration zones. Skin Pharmacol. Physiol. 2004, 17, 246–257. [Google Scholar] [CrossRef] [PubMed]
- Bloksgaard, M.; Brewer, J.; Bagatolli, L.A. Structural and dynamical aspects of skin studied by multiphoton excitation fluorescence microscopy-based methods. Eur. J. Pharm. Sci. 2013, 50, 586–594. [Google Scholar] [CrossRef] [PubMed]
- Alnasif, N.; Zoschke, C.; Fleige, E.; Brodwolf, R.; Boreham, A.; Ruhl, E.; Eckl, K.M.; Merk, H.F.; Hennies, H.C.; Alexiev, U.; et al. Penetration of normal, damaged and diseased skin—An in vitro study on dendritic core-multishell nanotransporters. J. Control. Release 2014, 185, 45–50. [Google Scholar] [CrossRef] [PubMed]
- Ostrowski, A.; Nordmeyer, D.; Boreham, A.; Holzhausen, C.; Mundhenk, L.; Graf, C.; Meinke, M.; Vogt, A.; Hadam, S.; Lademann, J.; et al. Overview on the localization of nanoparticles in tissue and cellular context by different imaging techniques. Beilstein J. Nanotechnol. 2015, 6, 263–280. [Google Scholar] [CrossRef] [PubMed]
- Zhu, Y.; Choe, C.S.; Ahlberg, S.; Meinke, M.C.; Alexiev, U.; Lademann, J.; Darvin, M.E. Penetration of silver nanoparticles into porcine skin ex vivo using fluorescence lifetime imaging microscopy, Raman microscopy, and surface-enhanced Raman scattering microscopy. J. Biomed. Opt. 2015, 20, 51006. [Google Scholar] [CrossRef]
- Lindemann, U.; Wilken, K.; Weigmann, H.J.; Schaefer, H.; Sterry, W.; Lademann, J. Quantification of the horny layer using tape stripping and microscopic techniques. J. Biomed. Opt. 2003, 8, 601–607. [Google Scholar] [CrossRef] [PubMed]
- Teichmann, A.; Jacobi, U.; Ossadnik, M.; Richter, H.; Koch, S.; Sterry, W.; Lademann, J. Differential stripping: Determination of the amount of topically applied substances penetrated into the hair follicles. J. Investig. Dermatol. 2005, 125, 264–269. [Google Scholar] [PubMed]
- Lademann, J.; Jacobi, U.; Surber, C.; Weigmann, H.J.; Fluhr, J.W. The tape stripping procedure—Evaluation of some critical parameters. Eur. J. Pharm. Biopharm. 2009, 72, 317–323. [Google Scholar] [CrossRef] [PubMed]
- Lademann, J.; Meinke, M.C.; Schanzer, S.; Richter, H.; Darvin, M.E.; Haag, S.F.; Fluhr, J.W.; Weigmann, H.J.; Sterry, W.; Patzelt, A. In vivo methods for the analysis of the penetration of topically applied substances in and through the skin barrier. Int. J. Cosmet. Sci. 2012, 34, 551–559. [Google Scholar] [CrossRef] [PubMed]
- Alvarez-Roman, R.; Naik, A.; Kalia, Y.N.; Fessi, H.; Guy, R.H. Visualization of skin penetration using confocal laser scanning microscopy. Eur. J. Pharm. Biopharm. 2004, 58, 301–316. [Google Scholar] [CrossRef] [PubMed]
- Brewer, J.; Bloksgaard, M.; Kubiak, J.; Sorensen, J.A.; Bagatolli, L.A. Spatially resolved two-color diffusion measurements in human skin applied to transdermal liposome penetration. J. Investig. Dermatol. 2013, 133, 1260–1268. [Google Scholar] [CrossRef] [PubMed]
- Schaaf, M.J.; Koopmans, W.J.; Meckel, T.; van Noort, J.; Snaar-Jagalska, B.E.; Schmidt, T.S.; Spaink, H.P. Single-molecule microscopy reveals membrane microdomain organization of cells in a living vertebrate. Biophys. J. 2009, 97, 1206–1214. [Google Scholar] [CrossRef] [PubMed]
- Schatzlein, A.; Cevc, G. Non-uniform cellular packing of the stratum corneum and permeability barrier function of intact skin: A high-resolution confocal laser scanning microscopy study using highly deformable vesicles (Transfersomes). Br. J. Dermatol. 1998, 138, 583–592. [Google Scholar] [CrossRef] [PubMed]
- Stracke, F.; Weiss, B.; Lehr, C.M.; Konig, K.; Schaefer, U.F.; Schneider, M. Multiphoton microscopy for the investigation of dermal penetration of nanoparticle-borne drugs. J. Investig. Dermatol. 2006, 126, 2224–2233. [Google Scholar] [CrossRef] [PubMed]
- Lademann, J.; Rudolph, A.; Jacobi, U.; Weigmann, H.J.; Schaefer, H.; Sterry, W.; Meinke, M. Influence of nonhomogeneous distribution of topically applied UV filters on sun protection factors. J. Biomed. Opt. 2004, 9, 1358–1362. [Google Scholar] [CrossRef] [PubMed]
- Product Information: ATTO Oxa12. Available online: http://www.atto-tec.com/fileadmin/user_upload/Katalog_Flyer_Support/ATTO_OXA_12.pdf (accessed on 30 January 2015).
- Anderson, C.M.; Georgiou, G.N.; Morrison, I.E.; Stevenson, G.V.; Cherry, R.J. Tracking of cell surface receptors by fluorescence digital imaging microscopy using a charge-coupled device camera. Low-density lipoprotein and influenza virus receptor mobility at 4 °C. J. Cell Sci. 1992, 101, 415–425. [Google Scholar] [PubMed]
- Johnson, M.E.; Blankschtein, D.; Langer, R. Evaluation of solute permeation through the stratum corneum: Lateral bilayer diffusion as the primary transport mechanism. J. Pharm. Sci. 1997, 86, 1162–1172. [Google Scholar] [CrossRef] [PubMed]
- Talreja, P.; Kleene, N.K.; Pickens, W.L.; Wang, T.F.; Kasting, G.B. Visualization of the lipid barrier and measurement of lipid pathlength in human stratum corneum. AAPS Pharmsci. 2001, 3, 48–56. [Google Scholar] [CrossRef]
- Rancan, F.; Papakostas, D.; Hadam, S.; Hackbarth, S.; Delair, T.; Primard, C.; Verrier, B.; Sterry, W.; Blume-Peytavi, U.; Vogt, A. Investigation of polylactic acid (PLA) nanoparticles as drug delivery systems for local dermatotherapy. Pharm. Res. 2009, 26, 2027–2036. [Google Scholar] [CrossRef] [PubMed]
- Kim, T.Y.; Uji-i, H.; Moller, M.; Muls, B.; Hofkens, J.; Alexiev, U. Monitoring the interaction of a single G-protein key binding site with rhodopsin disk membranes upon light activation. Biochemistry 2009, 48, 3801–3803. [Google Scholar] [CrossRef] [PubMed]
- Kirchberg, K.; Kim, T.Y.; Haase, S.; Alexiev, U. Functional interaction structures of the photochromic retinal protein rhodopsin. Photochem. Photobiol. Sci. 2010, 9, 226–233. [Google Scholar] [CrossRef] [PubMed]
- Kim, T.Y.; Schlieter, T.; Haase, S.; Alexiev, U. Activation and molecular recognition of the GPCR rhodopsin—Insights from time-resolved fluorescence depolarisation and single molecule experiments. Eur. J. Cell Biol. 2012, 91, 300–310. [Google Scholar] [CrossRef] [PubMed]
- Alexiev, U.; Farrens, D.L. Fluorescence spectroscopy of rhodopsins: Insights and approaches. Biochim. Biophys. Acta 2014, 1837, 694–709. [Google Scholar] [CrossRef] [PubMed]
- Dedecker, P.; Duwe, S.; Neely, R.K.; Zhang, J. Localizer: Fast, accurate, open-source, and modular software package for superresolution microscopy. J. Biomed. Opt. 2012, 17, 126008. [Google Scholar] [CrossRef] [PubMed]
- Kues, T.; Dickmanns, A.; Luhrmann, R.; Peters, R.; Kubitscheck, U. High intranuclear mobility and dynamic clustering of the splicing factor U1 snRNP observed by single particle tracking. Proc. Natl. Acad. Sci. USA 2001, 98, 12021–12026. [Google Scholar] [CrossRef] [PubMed]
- Solomon, H. Random chords in the circle and the sphere. In Geometric Probability; Society for Industrial and Applied Mathematics: Philadelphia, PA, USA, 1978; pp. 127–172. [Google Scholar]
- Saxton, M.J. Lateral diffusion in an archipelago. Single-particle diffusion. Biophys. J. 1993, 64, 1766–1780. [Google Scholar] [CrossRef] [PubMed]
© 2015 by the authors; licensee MDPI, Basel, Switzerland. This article is an open access article distributed under the terms and conditions of the Creative Commons Attribution license (http://creativecommons.org/licenses/by/4.0/).
Share and Cite
Volz, P.; Boreham, A.; Wolf, A.; Kim, T.-Y.; Balke, J.; Frombach, J.; Hadam, S.; Afraz, Z.; Rancan, F.; Blume-Peytavi, U.; et al. Application of Single Molecule Fluorescence Microscopy to Characterize the Penetration of a Large Amphiphilic Molecule in the Stratum Corneum of Human Skin. Int. J. Mol. Sci. 2015, 16, 6960-6977. https://0-doi-org.brum.beds.ac.uk/10.3390/ijms16046960
Volz P, Boreham A, Wolf A, Kim T-Y, Balke J, Frombach J, Hadam S, Afraz Z, Rancan F, Blume-Peytavi U, et al. Application of Single Molecule Fluorescence Microscopy to Characterize the Penetration of a Large Amphiphilic Molecule in the Stratum Corneum of Human Skin. International Journal of Molecular Sciences. 2015; 16(4):6960-6977. https://0-doi-org.brum.beds.ac.uk/10.3390/ijms16046960
Chicago/Turabian StyleVolz, Pierre, Alexander Boreham, Alexander Wolf, Tai-Yang Kim, Jens Balke, Janna Frombach, Sabrina Hadam, Zahra Afraz, Fiorenza Rancan, Ulrike Blume-Peytavi, and et al. 2015. "Application of Single Molecule Fluorescence Microscopy to Characterize the Penetration of a Large Amphiphilic Molecule in the Stratum Corneum of Human Skin" International Journal of Molecular Sciences 16, no. 4: 6960-6977. https://0-doi-org.brum.beds.ac.uk/10.3390/ijms16046960