
Effect of the Characters of Chitosans Used and Regeneration Conditions on the Yield and Physicochemical Characteristics of Regenerated Products

Abstract
:1. Introduction
2. Results and Discussion
2.1. The Yield
2.2. The Ash Content and Bulk Density

| Sample | Characteristics | ||||||
|---|---|---|---|---|---|---|---|
| DD (%) | Acetic Acid (M) | Product * | Yield (%) | Ash (%) | Bulk Density (g/cm3) | Mw (kDa) | PDI |
| 61.7 | - | O-1 | - | 1.94 ± 0.15 a | 0.55 ± 0.01 a | 176 ± 3.3 a | 2.07 ± 0.03 a |
| 0.1 | R-1 | 53.54 ± 0.31 a | 0.35 ± 0.03 b | 0.49 ± 0.01 b | 155 ± 3.5 b | 1.72 ± 0.02 b | |
| 1.0 | R-2 | 54.73 ± 0.42 b | 0.33 ± 0.03 b | 0.48 ± 0.01 b | 150 ± 1.4 c | 1.73 ± 0.03 b | |
| 94.9 | - | O-2 | - | 1.75 ± 0.13 x | 0.55 ± 0.01 x | 97 ± 1.7 x | 2.09 ± 0.03 x |
| 0.1 | R-3 | 54.63 ± 0.33 x | 0.29 ± 0.04 y | 0.49 ± 0.01 y | 89 ± 1.0 y | 1.73 ± 0.02 y | |
| 1.0 | R-4 | 58.69 ± 0.25 y | 0.27 ± 0.03 y | 0.49 ± 0.01 y | 88 ± 1.1 y | 1.78 ± 0.03 y | |
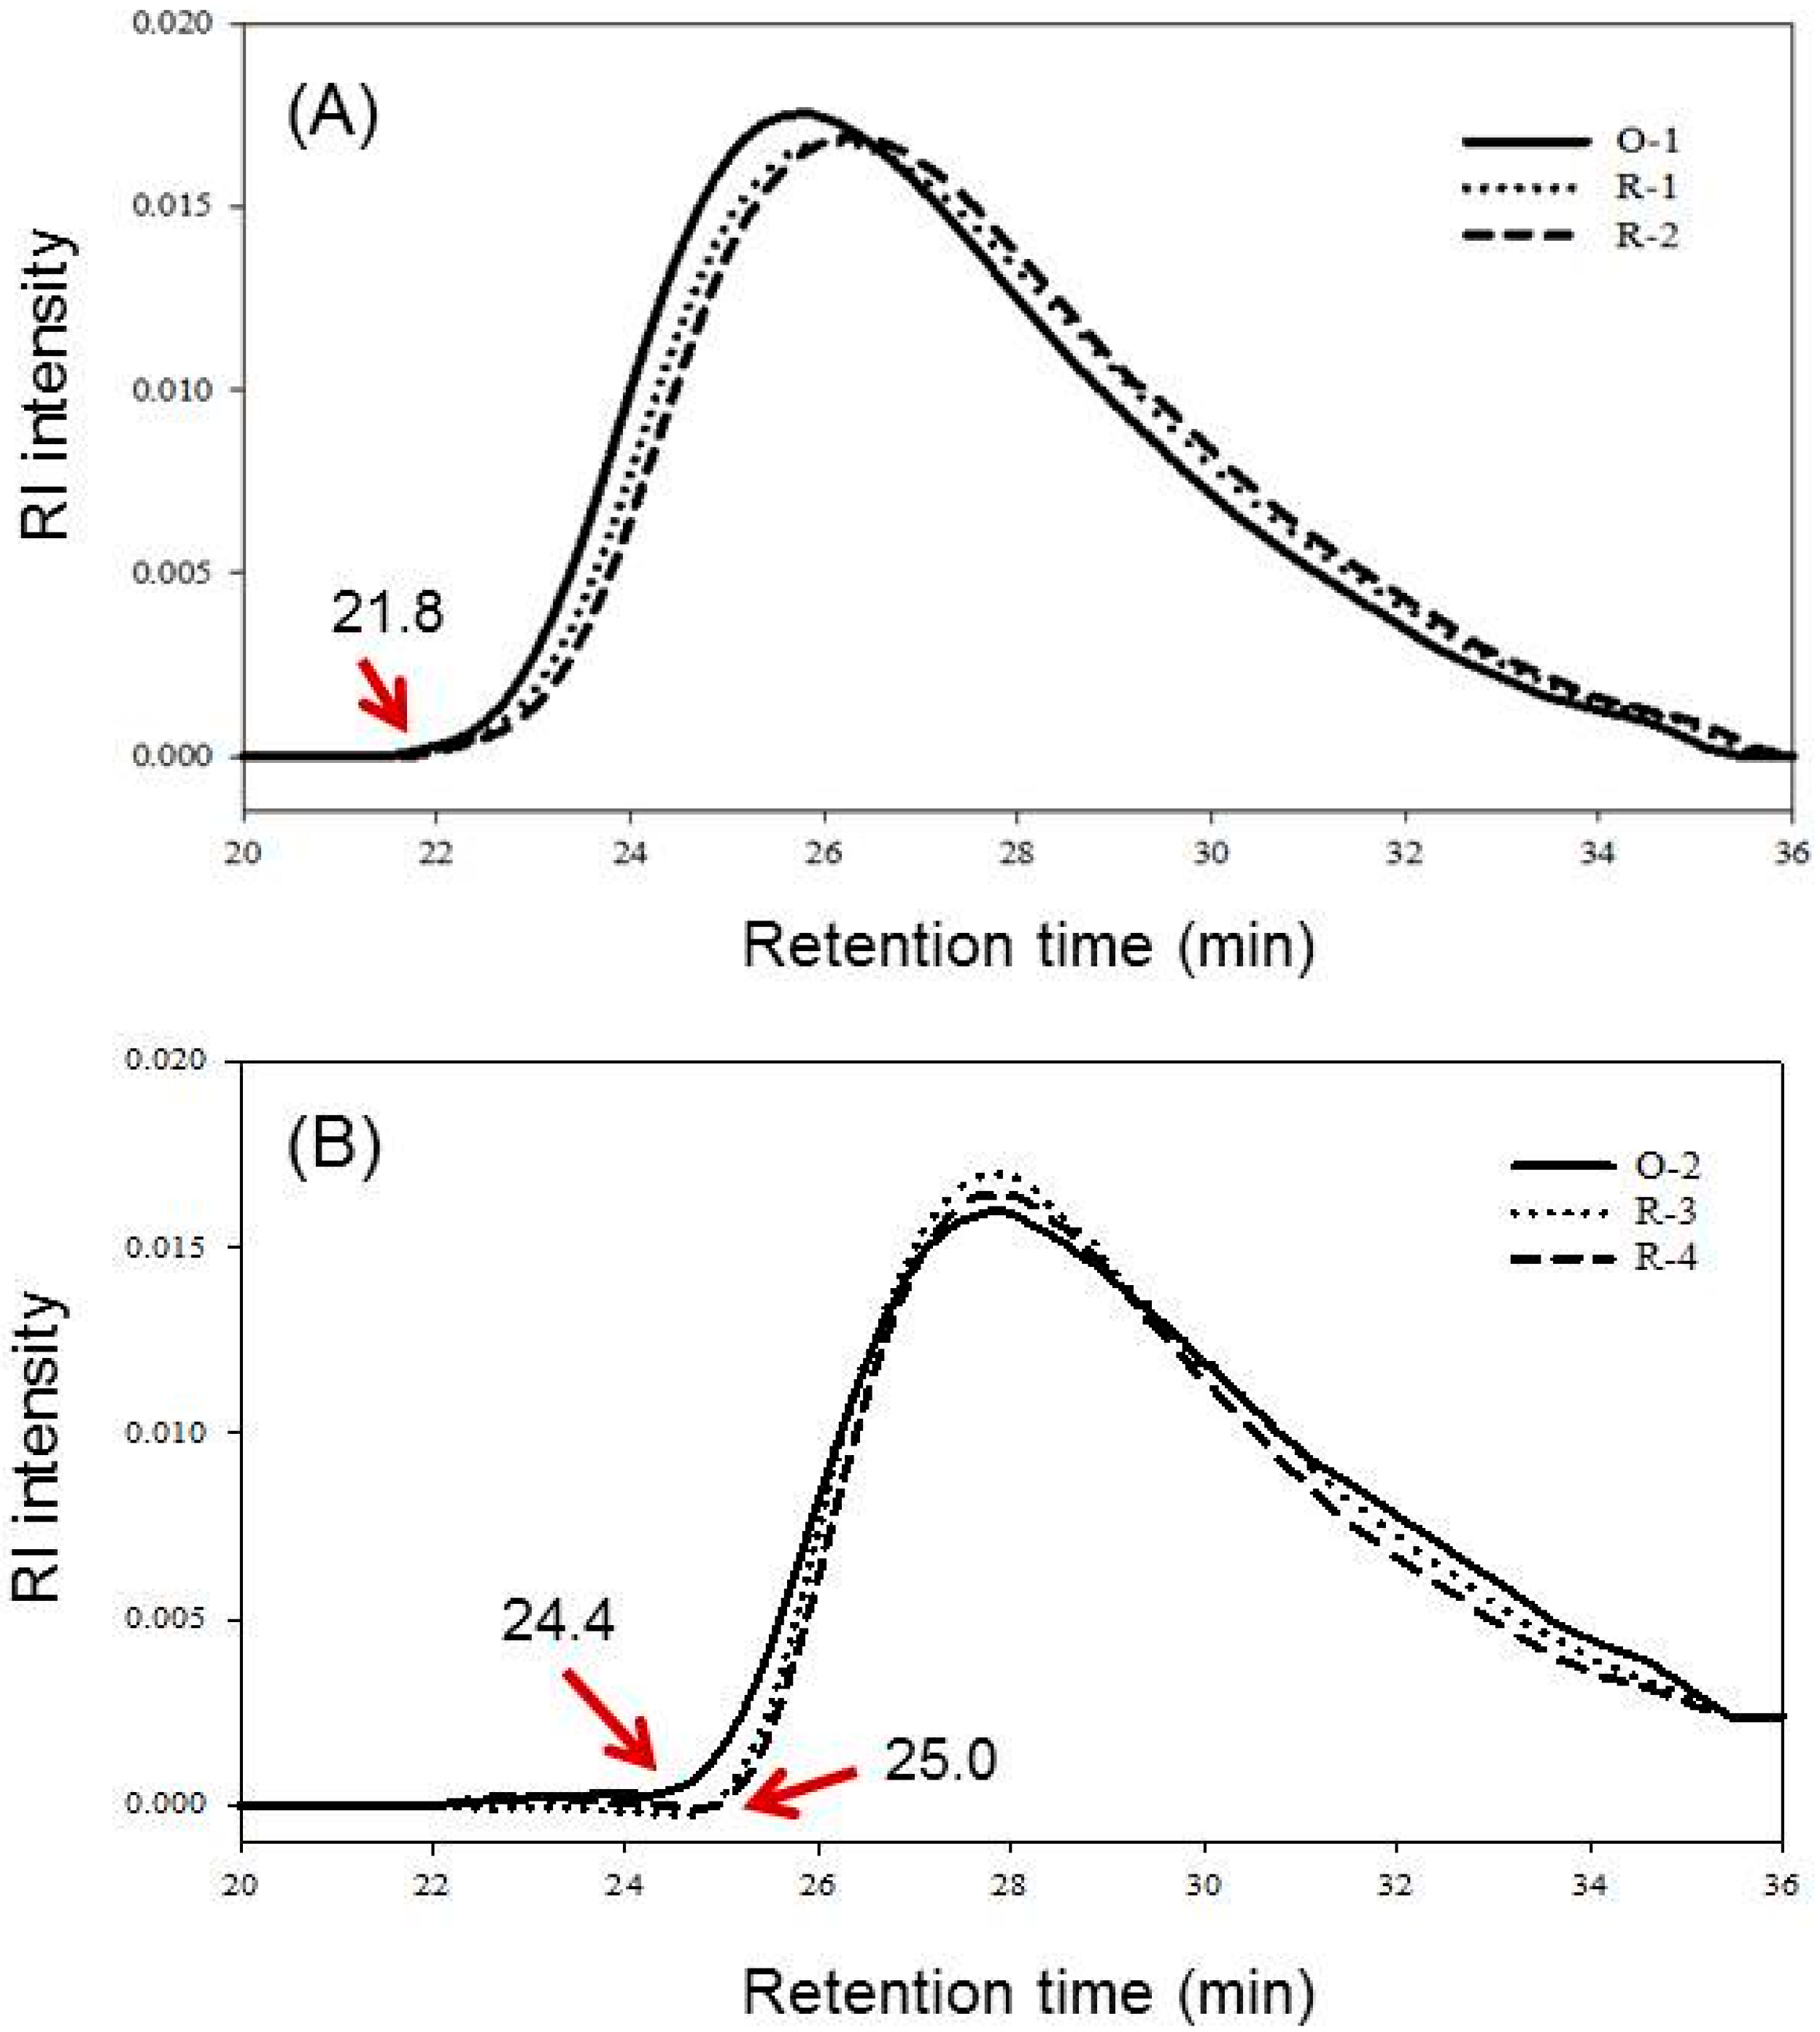
2.3. The Mw and PDI

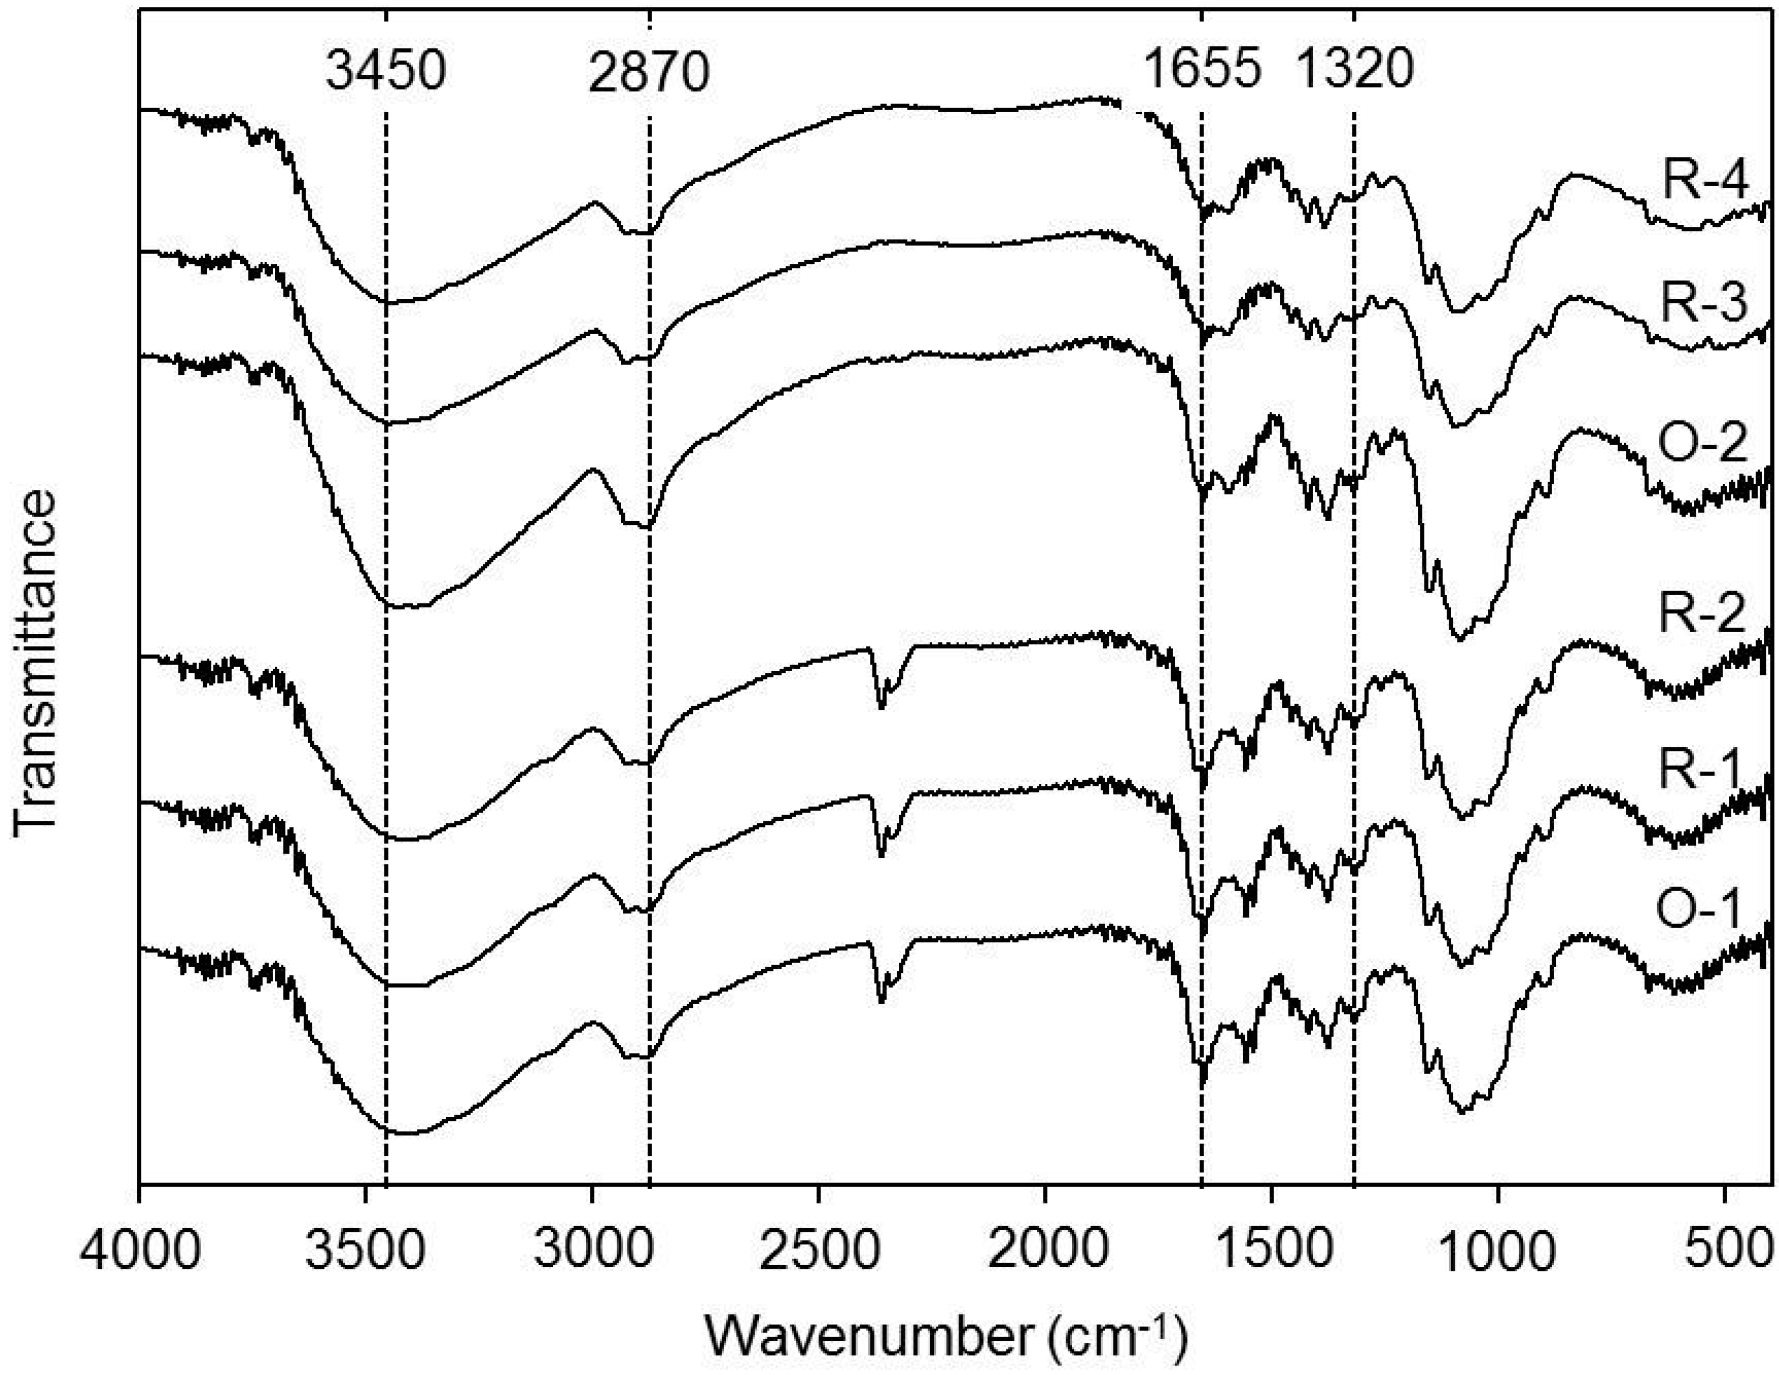
2.4. FTIR Spectrum

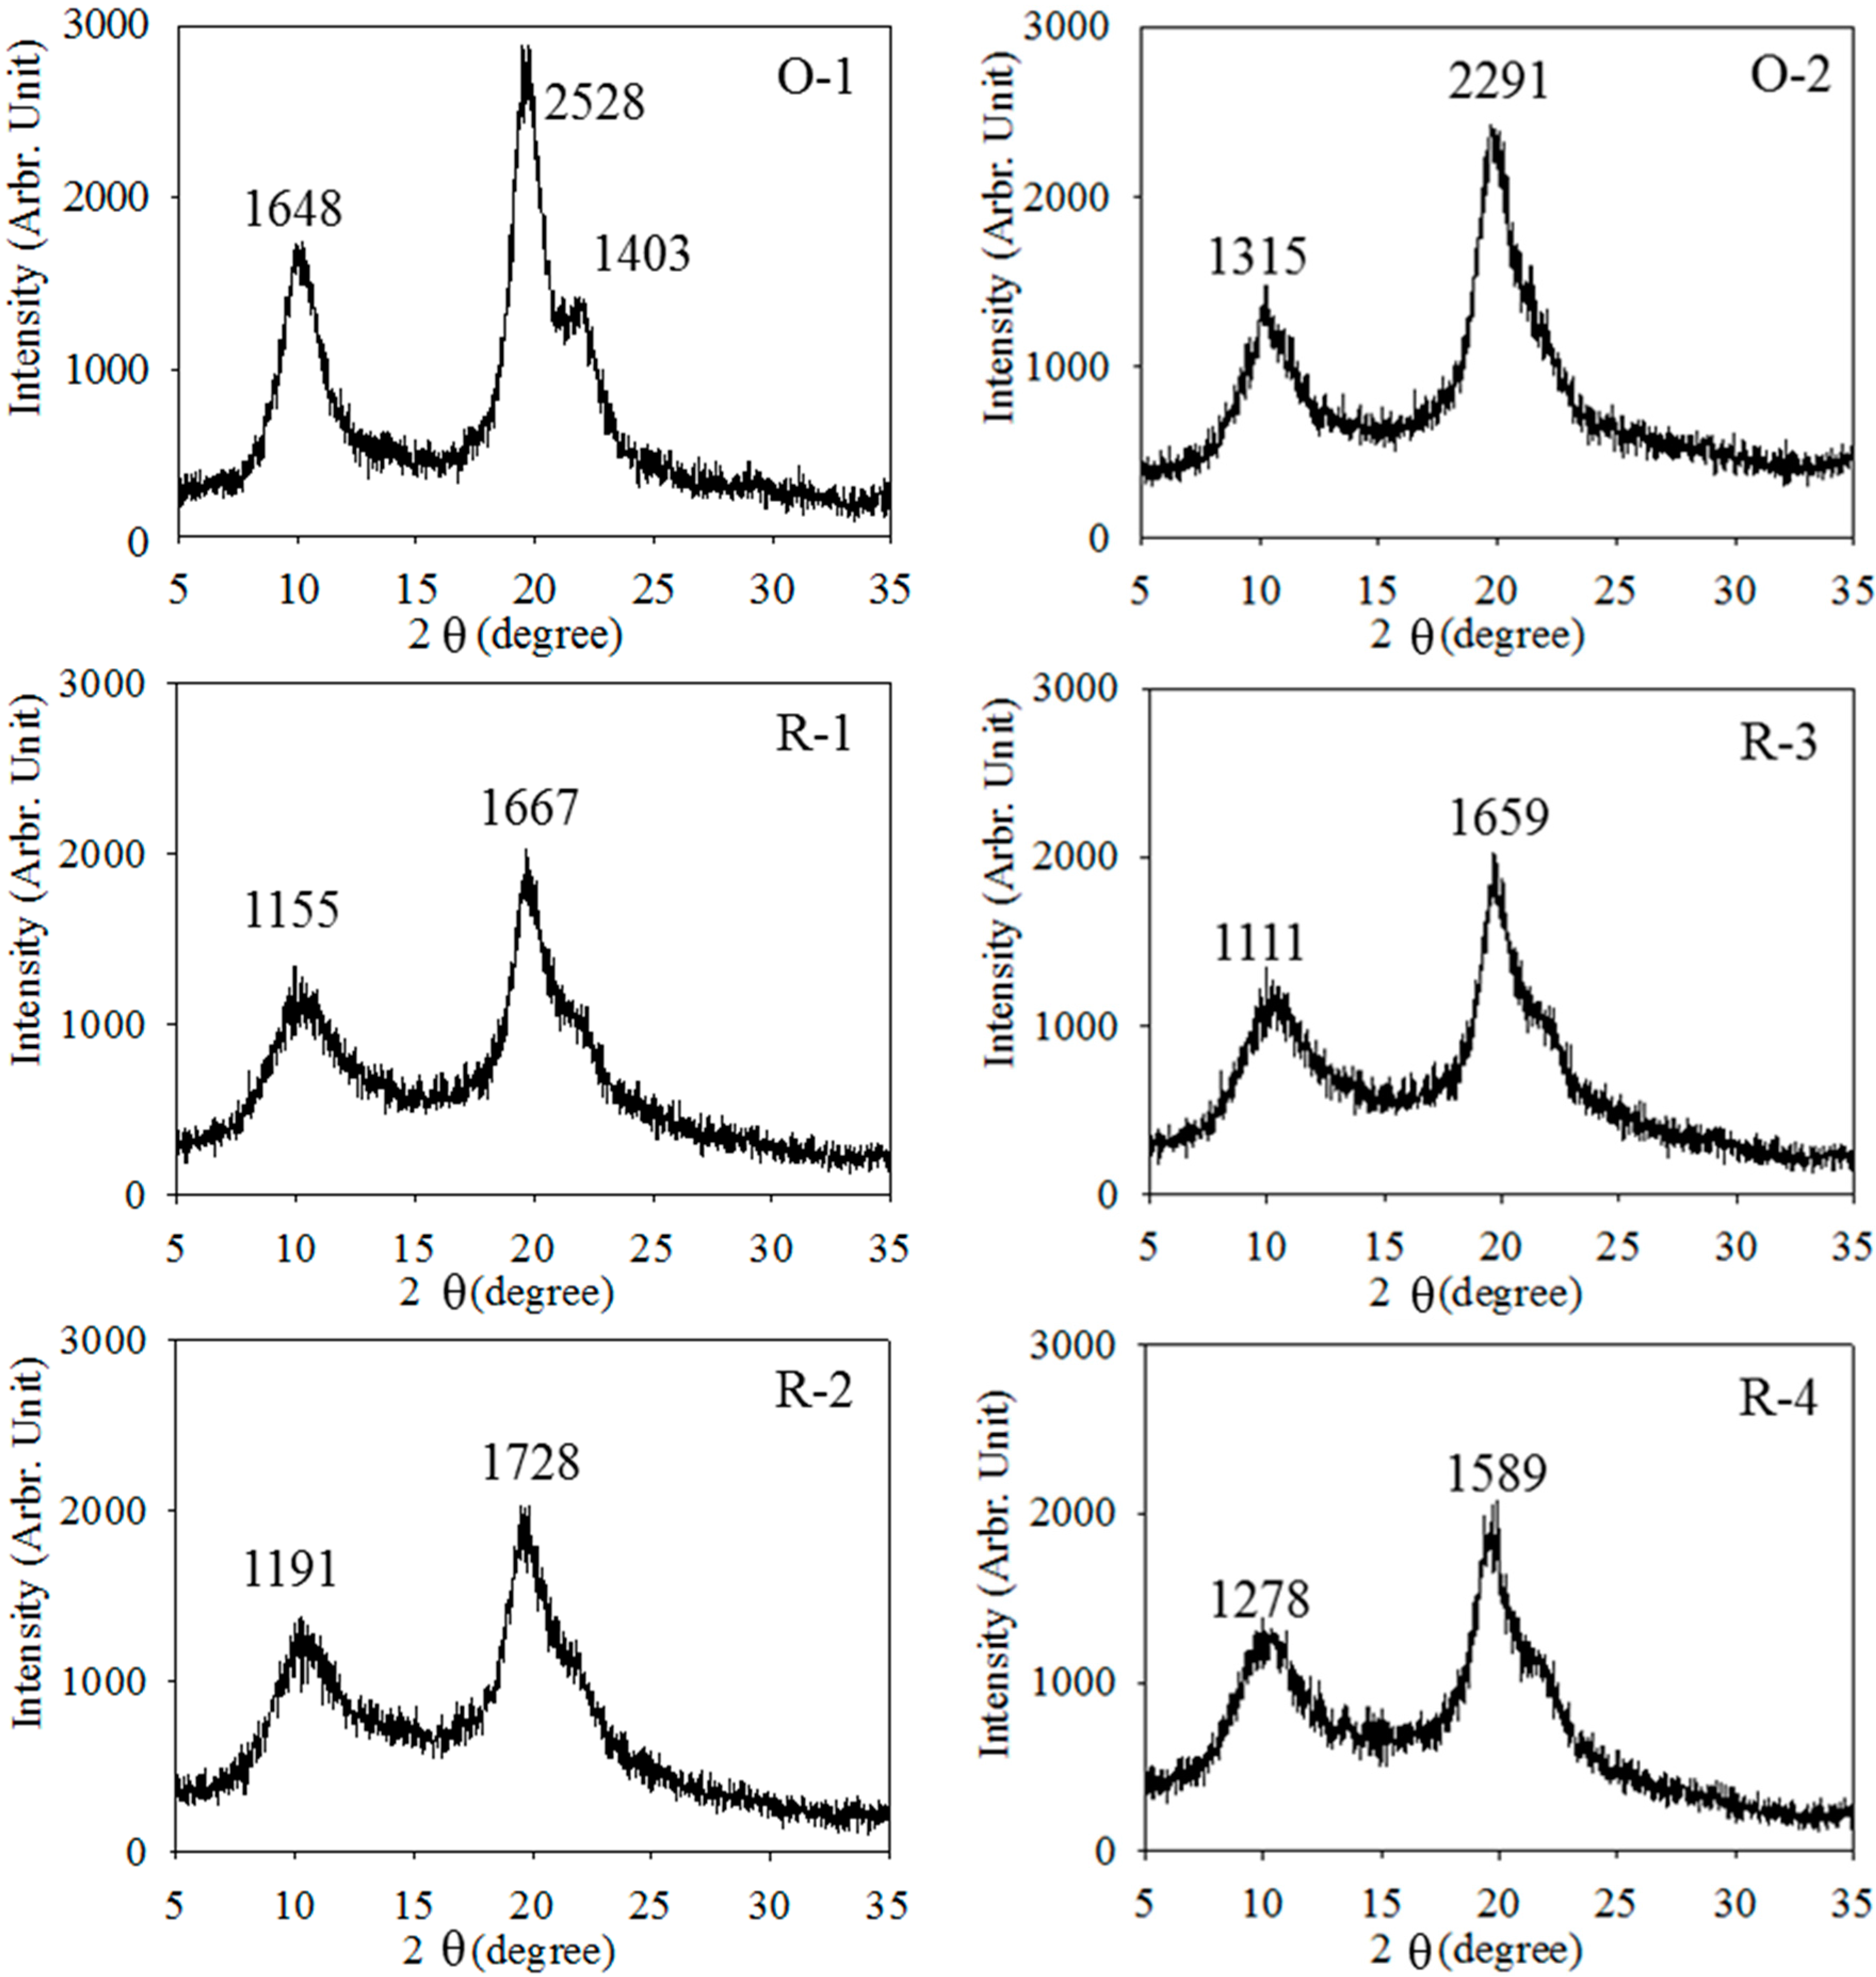
2.5. The Crystallinity

| Product | 2θ (degree) | CrI110 (%) | ||
|---|---|---|---|---|
| O-1 | 10.00 | 19.94 | 22.02 | 81.0 ± 0.6 a |
| R-1 | 10.06 | 19.96 | - | 66.4 ± 0.7 b |
| R-2 | 10.02 | 19.94 | - | 62.3 ± 1.2 c |
| O-2 | 10.08 | 20.24 | - | 72.5 ± 0.6 x |
| R-3 | 10.12 | 20.20 | - | 65.7 ± 1.1 y |
| R-4 | 10.10 | 20.20 | - | 59.1 ± 0.2 z |
3. Experimental Section
3.1. Materials
3.2. Preparation of Chitosan
3.3. Preparation of Regenerated Chitosan
3.4. Determination of DD
3.5. Determination of Molecular Weight and PDI
3.6. Determination of Bulk Density
3.7. Determination of Crystallinity
3.8. Determination of Ash
3.9. Statistical Analysis
4. Conclusions
Acknowledgments
Author Contributions
Conflicts of Interest
References
- Alishahi, A.; Aïder, M. Applications of chitosan in the seafood industry and aquaculture: A review. Food Bioprocess Technol. 2012, 5, 817–830. [Google Scholar] [CrossRef]
- Harish Prashanth, K.V.; Tharanathan, R.N. Chitin/chitosan: modifications and their unlimited application potential: An overview. Trends Food Sci. 2007, 18, 117–131. [Google Scholar]
- Honarkar, H.; Barikani, M. Applications of biopolymers I: Chitosan. Monatsh. Chem. 2009, 140, 1403–1420. [Google Scholar] [CrossRef]
- Rinaudo, M. Chitin and chitosan: Properties and applications. Prog. Polym. Sci. 2006, 31, 603–632. [Google Scholar] [CrossRef]
- Chang, J.S.; Chang, K.L.B.; Tsai, M.L. Liquid-crystalline behavior of chitosan in malic acid. J. Appl. Polym. Sci. 2007, 105, 2670–2675. [Google Scholar] [CrossRef]
- Chang, H.W.; Lin, Y.S.; Tsai, Y.D.; Tsai, M.L. Effects of chitosan characteristics on the physicochemical properties, antibacterial activity, and cytotoxicity of chitosan/2-glycerophosphate/nanosilver hydrogels. J. Appl. Polym. Sci. 2013, 127, 169–176. [Google Scholar] [CrossRef]
- Chang, Y.L.; Liu, T.C.; Tsai, M.L. Selective isolation of trypsin inhibitor and lectin from soybean whey by chitosan/tripolyphosphate/genipin co-crosslinked beads. Int. J. Mol. Sci. 2014, 15, 9979–9990. [Google Scholar] [CrossRef] [PubMed]
- Tsai, M.L.; Bai, S.W.; Chen, R.H. Cavitation effects versus stretch effects resulted in different size and polydispersity of ionotropic gelation chitosan-sodium tripolyphosohate nanoparticle. Carbohydr. Polym. 2008, 71, 448–457. [Google Scholar] [CrossRef]
- Chen, R.H.; Liu, C.S. Effect of recovery methods and conditions on the yield, solubility, molecular weight, and creep compliance of regenerated chitosan. J. Appl. Polym. Sci. 2002, 84, 193–202. [Google Scholar] [CrossRef]
- Hirano, S. Production and application of chitin and chitosan in Japan. In Chitin and Chitosan Sources, Chemistry, Biochemistry, Physical Properties and Application; Skjåk-Bræk, G., Anthonsen, T., Sandford, P., Eds.; Elsevier Applied Science: London, UK, 1989; pp. 34–43. [Google Scholar]
- Hattori, H.; Ishihara, M. Changes in blood aggregation with differences in molecular weight and degree of deacetylation of chitosan. Biomed. Mater. 2015, 10. [Google Scholar] [CrossRef] [PubMed]
- Scherliess, R.; Buske, S.; Young, K.; Weber, B.; Rades, T.; Hook, S. In vivo evaluation of chitosan as an adjuvant in subcutaneous vaccine formulations. Vaccine 2013, 31, 4812–4819. [Google Scholar] [CrossRef] [PubMed]
- De Moura, C.M.; de Moura, J.M.; Soares, N.M.; de Almeida Pinto, L.A. Evaluation of molar weight and deacetylation degree of chitosan during chitin deacetylation reaction: Used to produce biofilm. Chem. Eng. Process. 2011, 50, 351–355. [Google Scholar] [CrossRef]
- Lee, W.K.; Tsai, M.L.; Shieh, Y.T. Fractionation of chitosan by supercritical carbon dioxide/acetic acid aqueous solution. J. Supercrit. Fluids 2012, 71, 86–91. [Google Scholar] [CrossRef]
- Tsaih, M.L.; Tseng, L.Z.; Chen, R.H. Effects of removing small fragment with ultrafiltration treatment and ultrasonic conditions on degradation kinetics of chitosan. Polym. Degrad. Stab. 2004, 86, 25–32. [Google Scholar] [CrossRef]
- Balassa, L.L.; Prudden, J.F. Application of chitin and chitosan in wound-healing acceleration. In Proceedings of The First International Conference on Chitin/Chitosan; Muzzarelli, R.A.A., Pariser, E.R., Eds.; MIT Sea Grant Information Center: Cambridge, MA, USA, 1978; pp. 296–304. [Google Scholar]
- Kifune, K. Biocompatibility of regenerated chitin, porous material. In Chitin Derivatives in Life Science; Tokura, S., Azuma, I., Eds.; Japanese Society for Chitin/Chitosan: Sapporo, Japan, 1992; pp. 40–44. [Google Scholar]
- Seo, H.; Kinemura, Y. Preparation and some properties of chitosan porous beads. In Chitin and Chitosan Sources, Chemistry, Biochemistry, Physical Properties and Application; Skjåk-Bræk, G., Anthonsen, T., Sandford, P., Eds.; Elsevier Applied Science: London, UK, 1989; pp. 585–588. [Google Scholar]
- Seo, H.; Itoyama, K.; Fukasawa, M.; Tokura, S. Application of regenerated chitosan as biomedical materials. In Chitin Derivatives in Life Science; Tokura, S., Azuma, I., Eds.; Japanese Society for Chitin/Chitosan: Sapporo, Japan, 1992; pp. 32–39. [Google Scholar]
- Seo, H.; Mitsuhshi, K.; Tanibe, H. Antibacterial and antifungal fiber blended by chitosan. In Advances in Chitin and Chitosan; Brine, C.J., Sandford, P.A., Zikakis, J.P., Eds.; Elsevier Applied Science: London, UK, 1992; pp. 34–40. [Google Scholar]
- Trung, T.S. Value Adding Physico-chemical Modifications of Shrimp Chitosan. Ph.D. Thesis, Asian Institute of Technology, Pathumthani, Thailand, 2003. [Google Scholar]
- Sannan, T.; Kurita, K.; Iwakura, Y. Studies on chitin.1. Solubility change by alkaline treatment and film casting. Makromol. Chem. 1975, 176, 1191–1195. [Google Scholar]
- Sannan, T.; Kurita, K.; Iwakura, Y. Studies on chitin.2. Effect of deacetylation on solubility. Makromol. Chem. 1976, 177, 3589–3600. [Google Scholar] [CrossRef]
- Shirai, A.; Takahashi, K.; Rujiravanit, R.; Nishi, N.; Tokura, S. Regeneration of chitin using new solvent system. In Chitin and Chitosan: The Versatile Environmentally Friendly Modern Materials; Zakaria, M.B., Muda, W.M.W., Abdullah, M.P., Eds.; Universiti Kebangsaan Malaysia: Bangi, Malaysia, 1995; pp. 53–60. [Google Scholar]
- Tokura, S.; Nishi, N. Specification and characterization of chitin and chitosan. In Chitin and Chitosan: The Versatile Environmentally Friendly Modern Materials; Zakaria, M.B., Muda, W.M.W., Abdullah, M.P., Eds.; Universiti Kebangsaan Malaysia: Bangi, Malaysia, 1995; pp. 68–86. [Google Scholar]
- Dutkiewicz, J.; Jukiewicz, L.; Papiewski, A.; Kucharska, M.; Ciszewski, R. Some used of kill chitosan as biomaterial. In Chitin and Chitosan Sources, Chemistry, Biochemistry, Physical Properties and Application; Skjåk-Bræk, G., Anthonsen, T., Sandford, P., Eds.; Elsevier Applied Science: London, UK, 1989; pp. 719–730. [Google Scholar]
- Trung, T.S.; Ng, C.H.; Stevens, W.F. Characterization of decrystallized chitosan and its application in biosorption of textile dyes. Biotechnol. Lett. 2003, 25, 1185–1190. [Google Scholar] [CrossRef] [PubMed]
- Trung, T.S.; Thein-Han, W.W.; Qui, N.T.; Ng, C.H.; Stevens, W.F. Functional characteristics of shrimp chitosan and its membranes as affected by the degree of deacetylation. Bioresour. Technol. 2006, 97, 659–663. [Google Scholar] [CrossRef] [PubMed]
- Rinaudo, M.; Pavlo, G.; Desbrieres, J. Influence of acetic acid concentration on the solubilization of chitosan. Polymer 1999, 40, 7029–32. [Google Scholar] [CrossRef]
- Chen, R.H.; Chen, W.Y.; Wang, S.T.; Hsu, C.H.; Tsai, M.L. Changes in the Mark-Houwink hydrodynamic volume of chitosan molecules in solutions of different organic acids, at different temperatures and ionic strengths. Carbohydr. Polym. 2009, 78, 902–907. [Google Scholar] [CrossRef]
- Chen, R.H.; Chang, J.R.; Shyur, J.S. Effects of ultrasonic conditions and storage in acidic solutions on changes in molecular weight and polydispersity of treated chitosan. Carbohydr. Res. 1997, 299, 287–294. [Google Scholar] [CrossRef]
- Domszy, J.G.; Roberts, G.A.F. Evaluation of infrared spectroscopic techniques for analysing chitosan. Makromol. Chem. 1985, 186, 1671–1677. [Google Scholar] [CrossRef]
- Dong, Y.; Xu, C.; Wang, J.; Wu, Y.; Wang, M.; Ruan, Y. Influence of degree of deacetylation on critical concentration of chitosan/dichloroacetic acid liquid crystalline solution. J. Appl. Polym. Sci. 2002, 83, 1204–1208. [Google Scholar] [CrossRef]
- Qin, C.; Li, H.; Xiao, Q.; Liu, Y.; Zhu, J.; Du, Y. Water solubility of chitosan and its antimicrobial activity. Carbohydr. Polym. 2006, 63, 367–374. [Google Scholar] [CrossRef]
- Webster, A.; Osifo, P.O.; Neomagus, H.W.J.P.; Grant, D.M. A comparison of glycans and polyglycans using solid-state NMR and X-ray powder diffraction. Solid State Nucl. Magn. Reson. 2006, 30, 150–161. [Google Scholar] [CrossRef] [PubMed]
- Ogawa, K. Effect of heating an aqueous suspension of chitosan on crystalline, and polymorphism. Agric. Biol. Chem. 1991, 55, 2375–2379. [Google Scholar] [CrossRef]
- Zhang, Y.; Xue, C.; Xue, Y.; Gao, R.; Zhang, X. Determination of the degree of deacetylation of chitin and chitosan by X-ray powder diffraction. Carbohydr. Res. 2005, 340, 1914–1917. [Google Scholar] [CrossRef] [PubMed]
- Baxter, A.; Dillon, M.; Taylor, K.D.A.; Roberts, G.A.F. Improved method for i.r. determination of the degree of N-acetylation of chitosan. Int. J. Biol. Macromol. 1992, 14, 166–169. [Google Scholar]
- Cho, Y.I.; No, H.K.; Meyers, S.P. Physico-chemical characteristics and functional properties of various commercial chitin and chitosan products. J. Agric. Food Chem. 1998, 46, 3839–3843. [Google Scholar] [CrossRef]
- AOAC. Official Methods of Analysis, 15th ed.; Association of Official Analytical Chemists: Arlington, VA, USA, 1990; p. 777. [Google Scholar]
© 2015 by the authors; licensee MDPI, Basel, Switzerland. This article is an open access article distributed under the terms and conditions of the Creative Commons Attribution license (http://creativecommons.org/licenses/by/4.0/).
Share and Cite
Hsu, C.H.; Chen, S.K.; Chen, W.Y.; Tsai, M.L.; Chen, R.H. Effect of the Characters of Chitosans Used and Regeneration Conditions on the Yield and Physicochemical Characteristics of Regenerated Products. Int. J. Mol. Sci. 2015, 16, 8621-8634. https://0-doi-org.brum.beds.ac.uk/10.3390/ijms16048621
Hsu CH, Chen SK, Chen WY, Tsai ML, Chen RH. Effect of the Characters of Chitosans Used and Regeneration Conditions on the Yield and Physicochemical Characteristics of Regenerated Products. International Journal of Molecular Sciences. 2015; 16(4):8621-8634. https://0-doi-org.brum.beds.ac.uk/10.3390/ijms16048621
Chicago/Turabian StyleHsu, Chu Hsi, Szu Kai Chen, Wei Yu Chen, Min Lang Tsai, and Rong Huei Chen. 2015. "Effect of the Characters of Chitosans Used and Regeneration Conditions on the Yield and Physicochemical Characteristics of Regenerated Products" International Journal of Molecular Sciences 16, no. 4: 8621-8634. https://0-doi-org.brum.beds.ac.uk/10.3390/ijms16048621