
Microfluidic Impedance Flow Cytometry Enabling High-Throughput Single-Cell Electrical Property Characterization


Abstract
:1. Introduction

| Techniques | Quantified Parameters | Classified Objects and Key Observations | References |
|---|---|---|---|
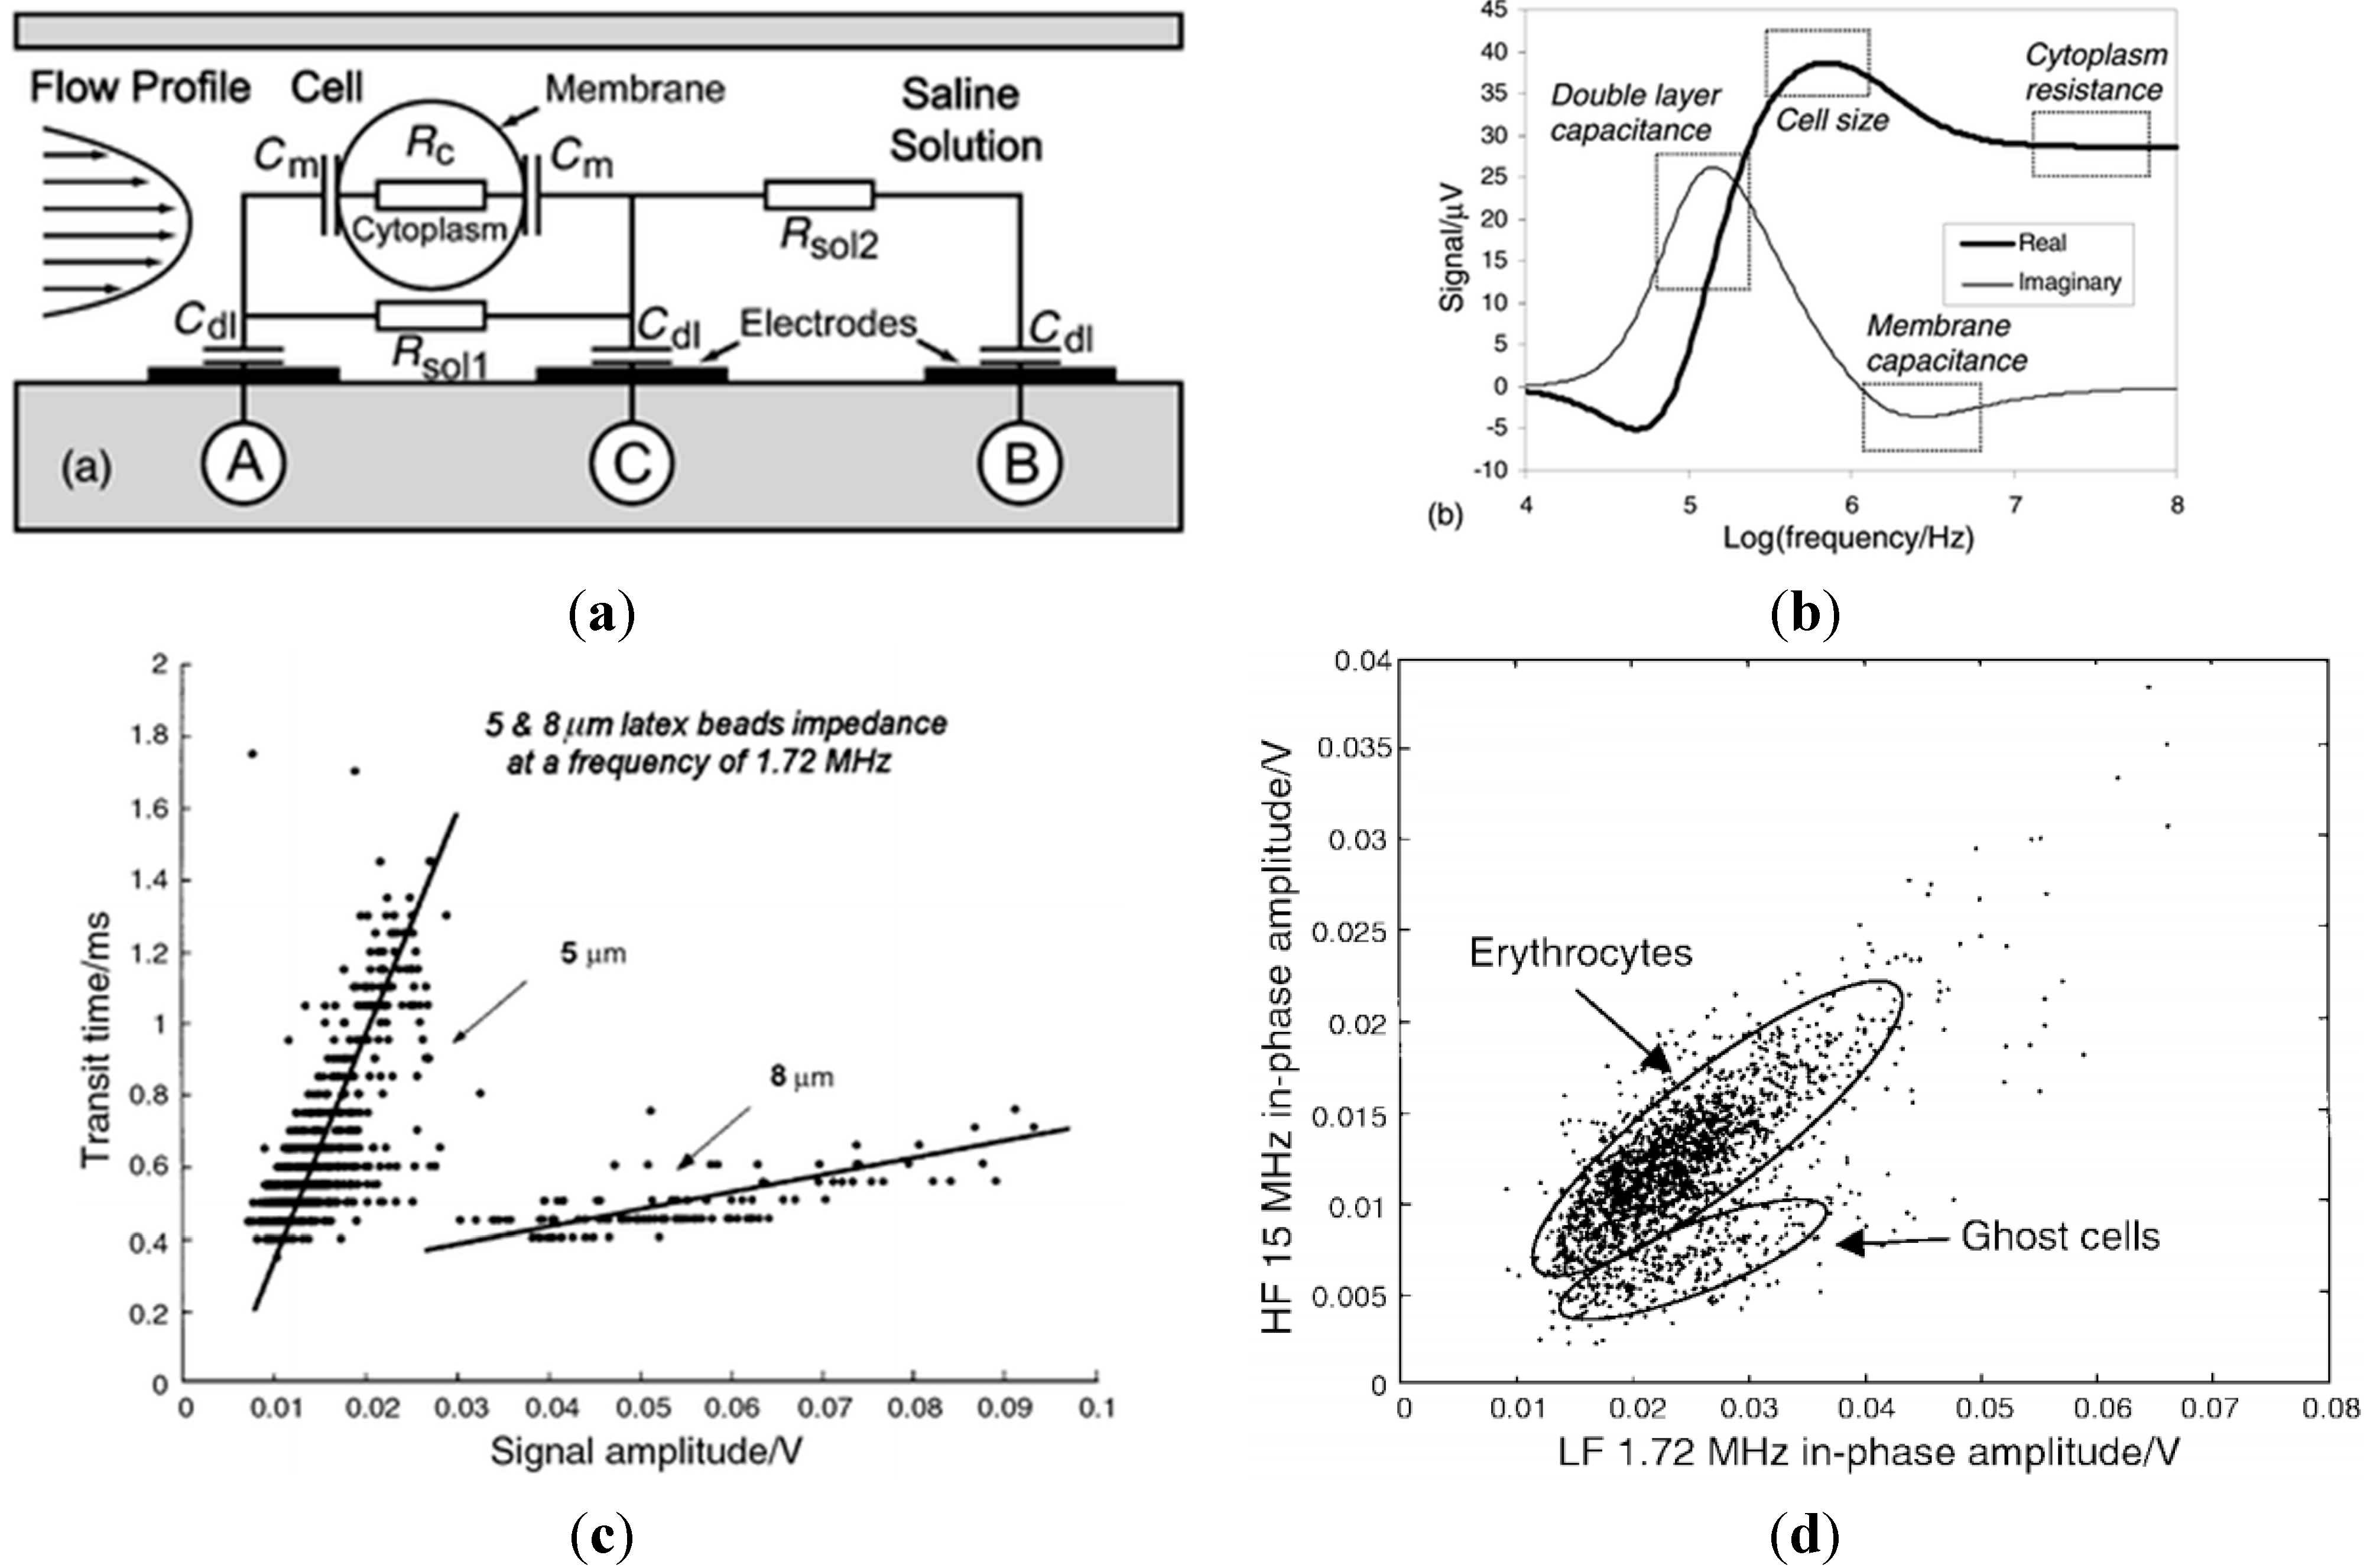
| Coplanar microelectrodes | Two-frequency impedance data (1.7 and 15.0 MHz) | Polymer beads of 5 and 8 μm, normal erythrocytes and their ghost counterparts | [ 77] |
| Coplanar microelectrodes | One-frequency impedance data (100 kHz) | Liver tumor cells at normal, apoptotic and necrotic status, leukemia cells | [ 78] |
| Coplanar microelectrodes | One-frequency impedance data (2.0 MHz) | Different stages of P. falciparum infected red blood cells and uninfected red blood cells | [ 9] |
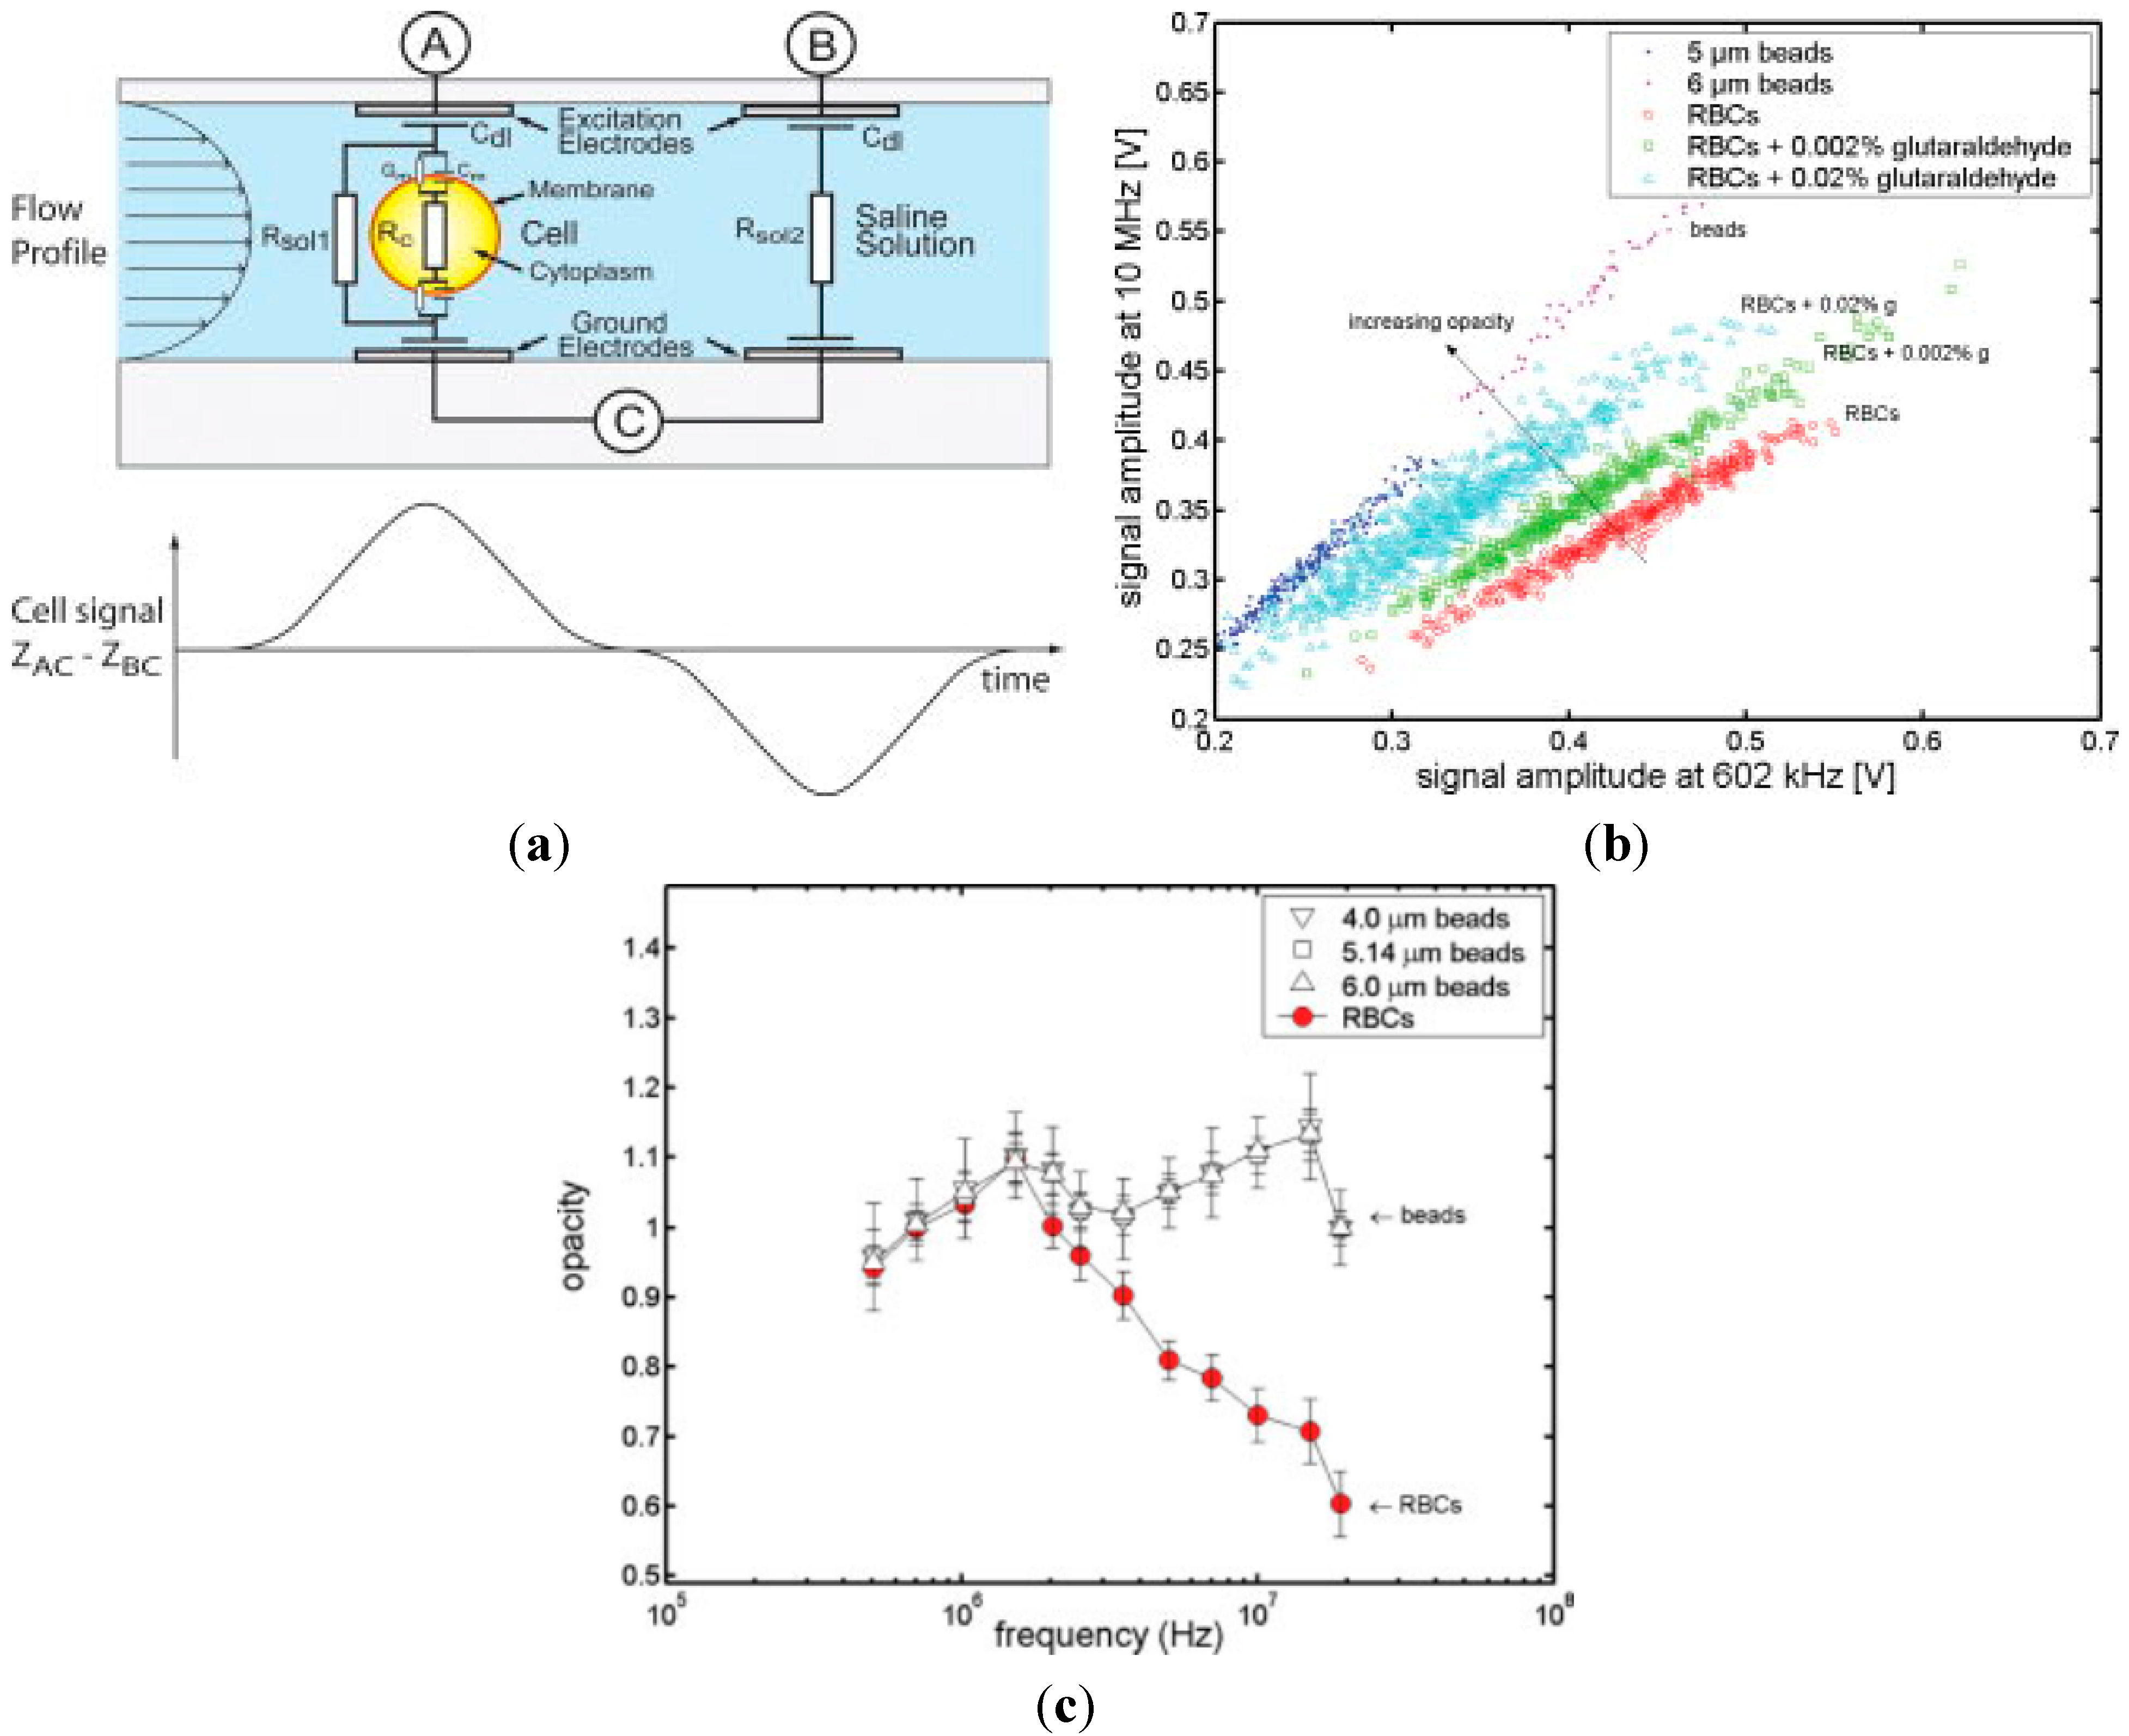
| Parallel microelectrodes | Two-frequency impedance opacity |Zhigh|/|Zref| (fref = 602 kHz, fhigh = 350 kHz–20.0 MHz ) | Polymer beads of 5, 6 μm, red blood cells and their fixed counterparts | [ 79] |
| Parallel microelectrodes | Two-frequency impedance opacity |Zhigh|/|Zref| (fref = 500 kHz, fhigh = 0.5–250.0 MHz) | Wild-type yeasts and a mutant with different sizes and distribution of vacuoles in the intracellular fluid | [ 80] |
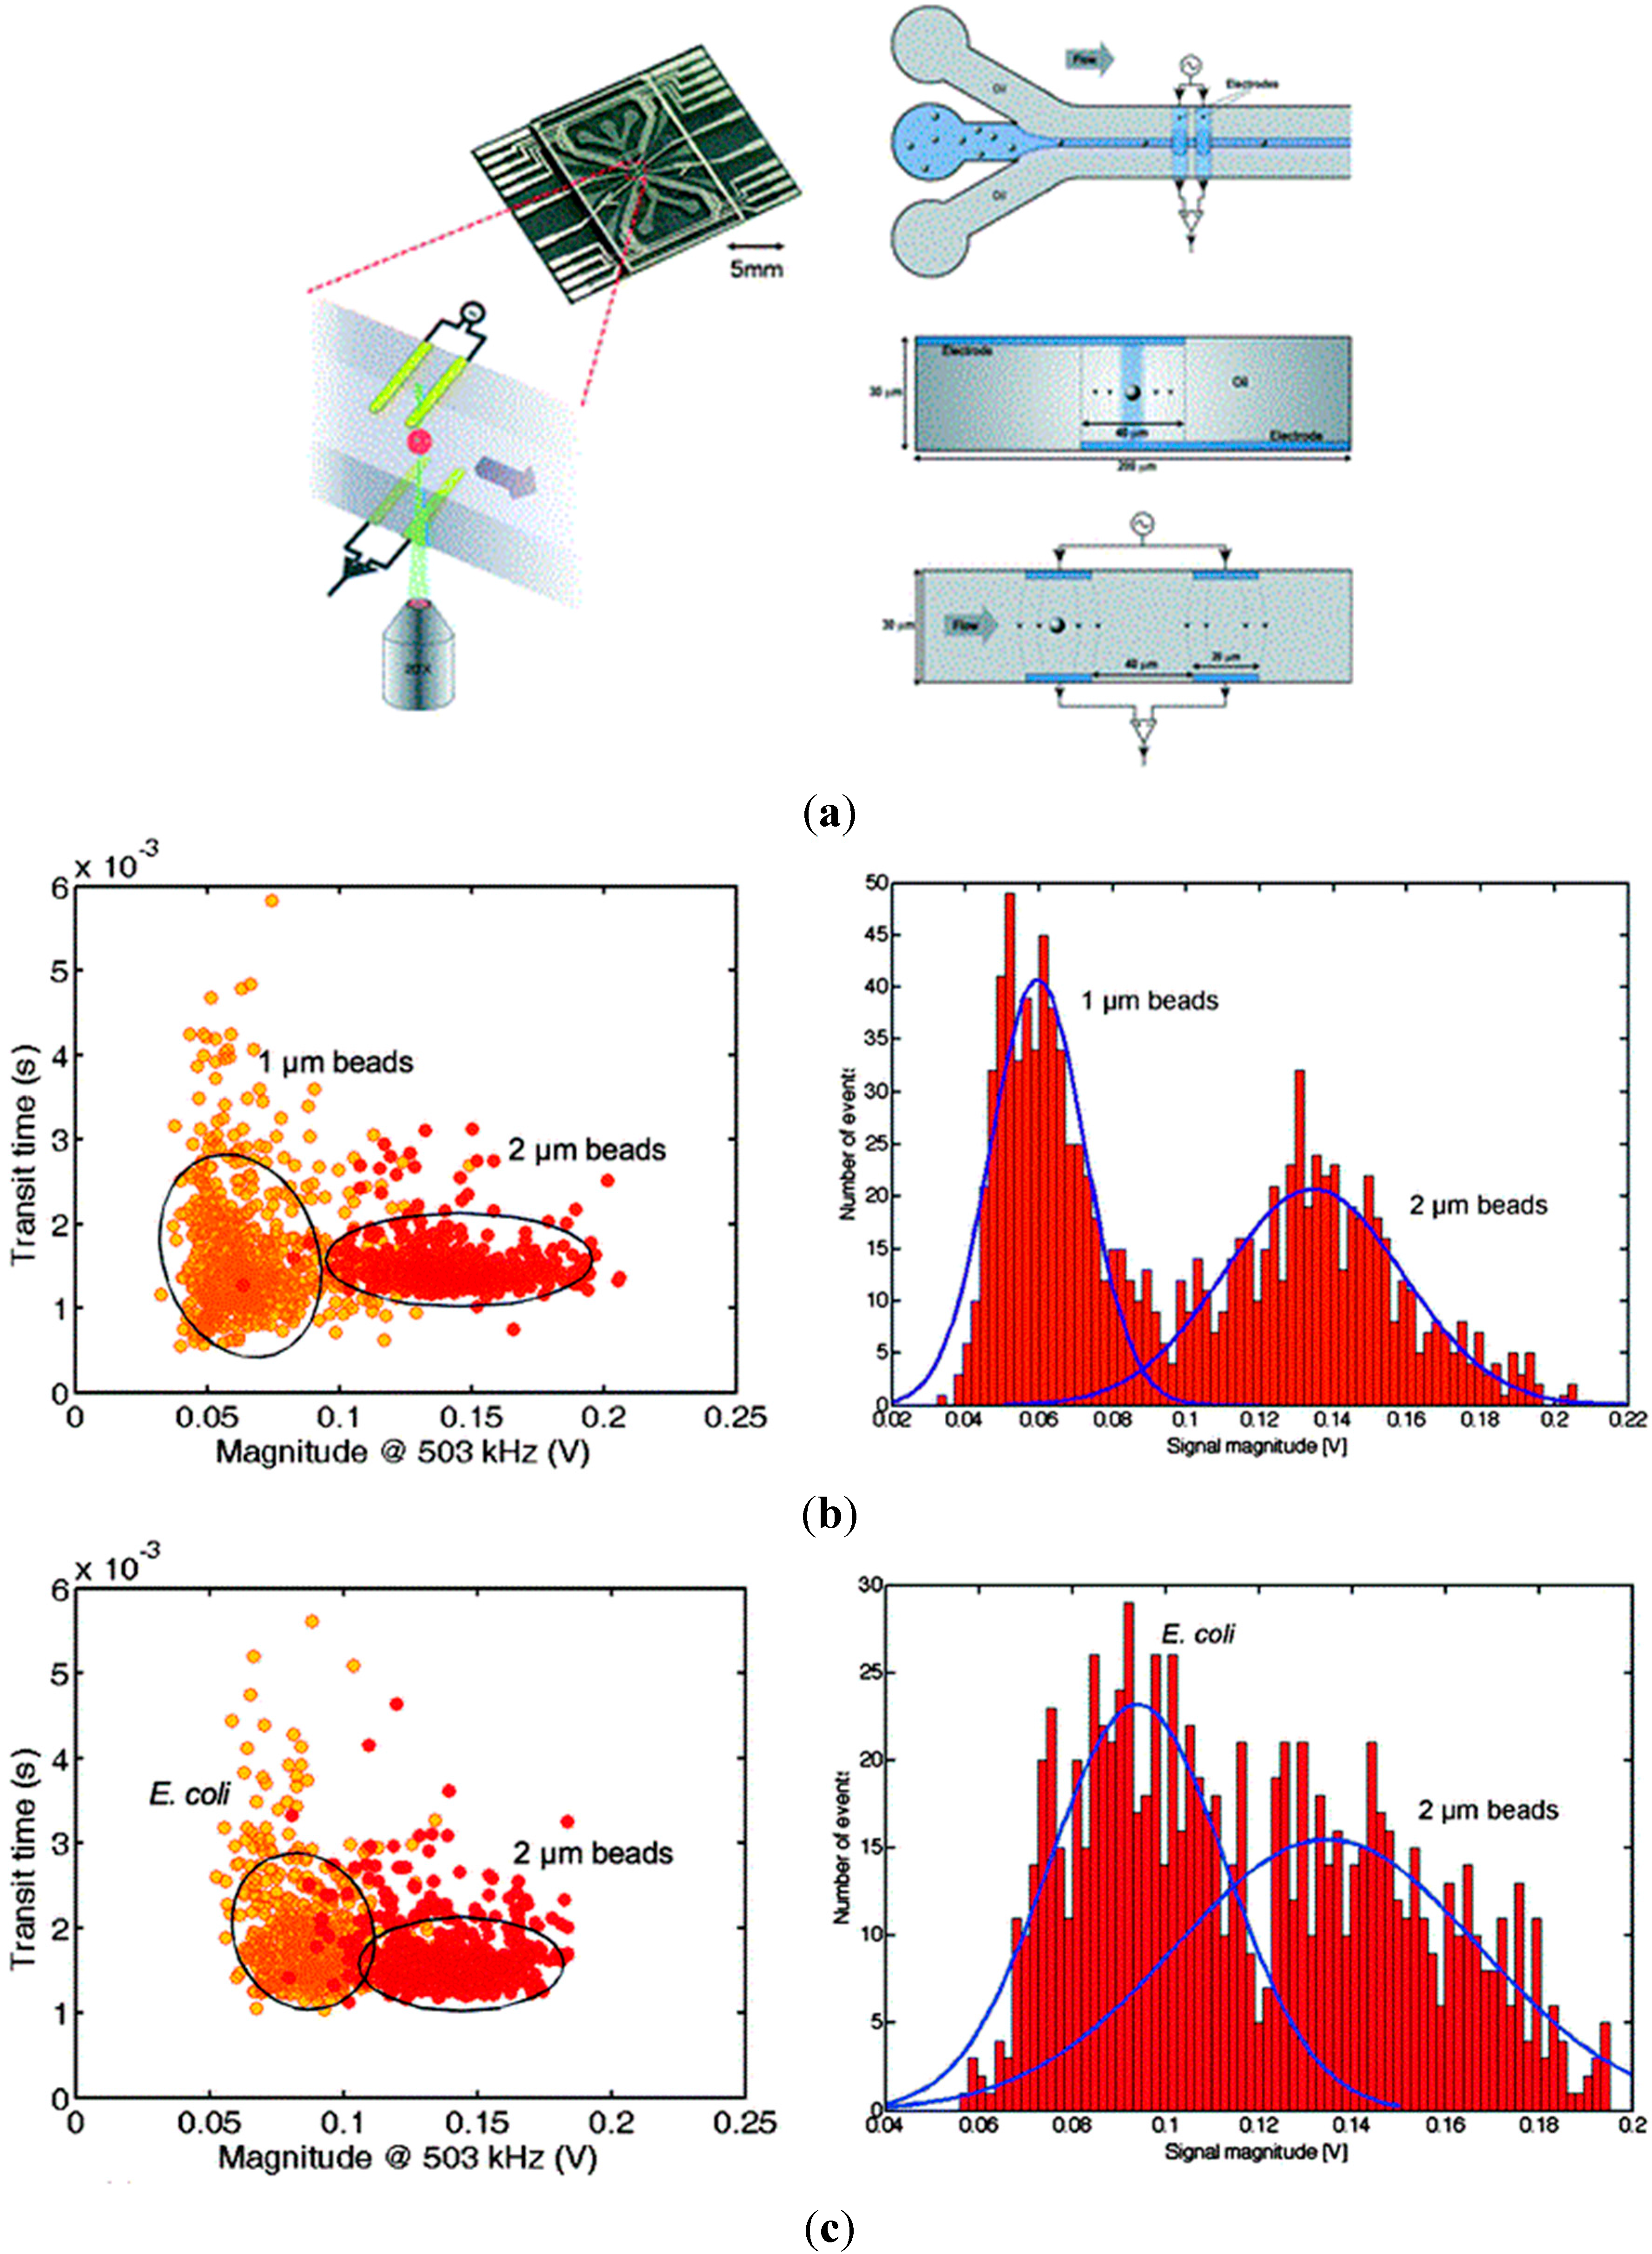
| Parallel microelectrodes + insulating fluid focusing | One-frequency impedance data (503 kHz) | Polymer beads of 1, 2 μm, and E coli | [ 81] |
| Parallel microelectrodes + resonance | Two-frequency impedance data (87.2 and 89.2 MHz) | E. coli, B. subtilis and polymer beads of 2 μm | [ 82] |
| Constriction channel | One-frequency impedance data (100 kHz) | Size-comparable tumor cells and their more malignant counterparts | [ 83] |
| Constriction channel | One-frequency impedance data (100 kHz) | Adult red blood cells and neonatal red blood cells | [ 84] |
| Constriction channel | Four-frequency impedance data (50 kHz, 250 kHz, 500 kHz and 1.0 MHz) | Polymer beads of 20 μm, undifferentiated stem cells and differentiated stem cells | [ 6] |
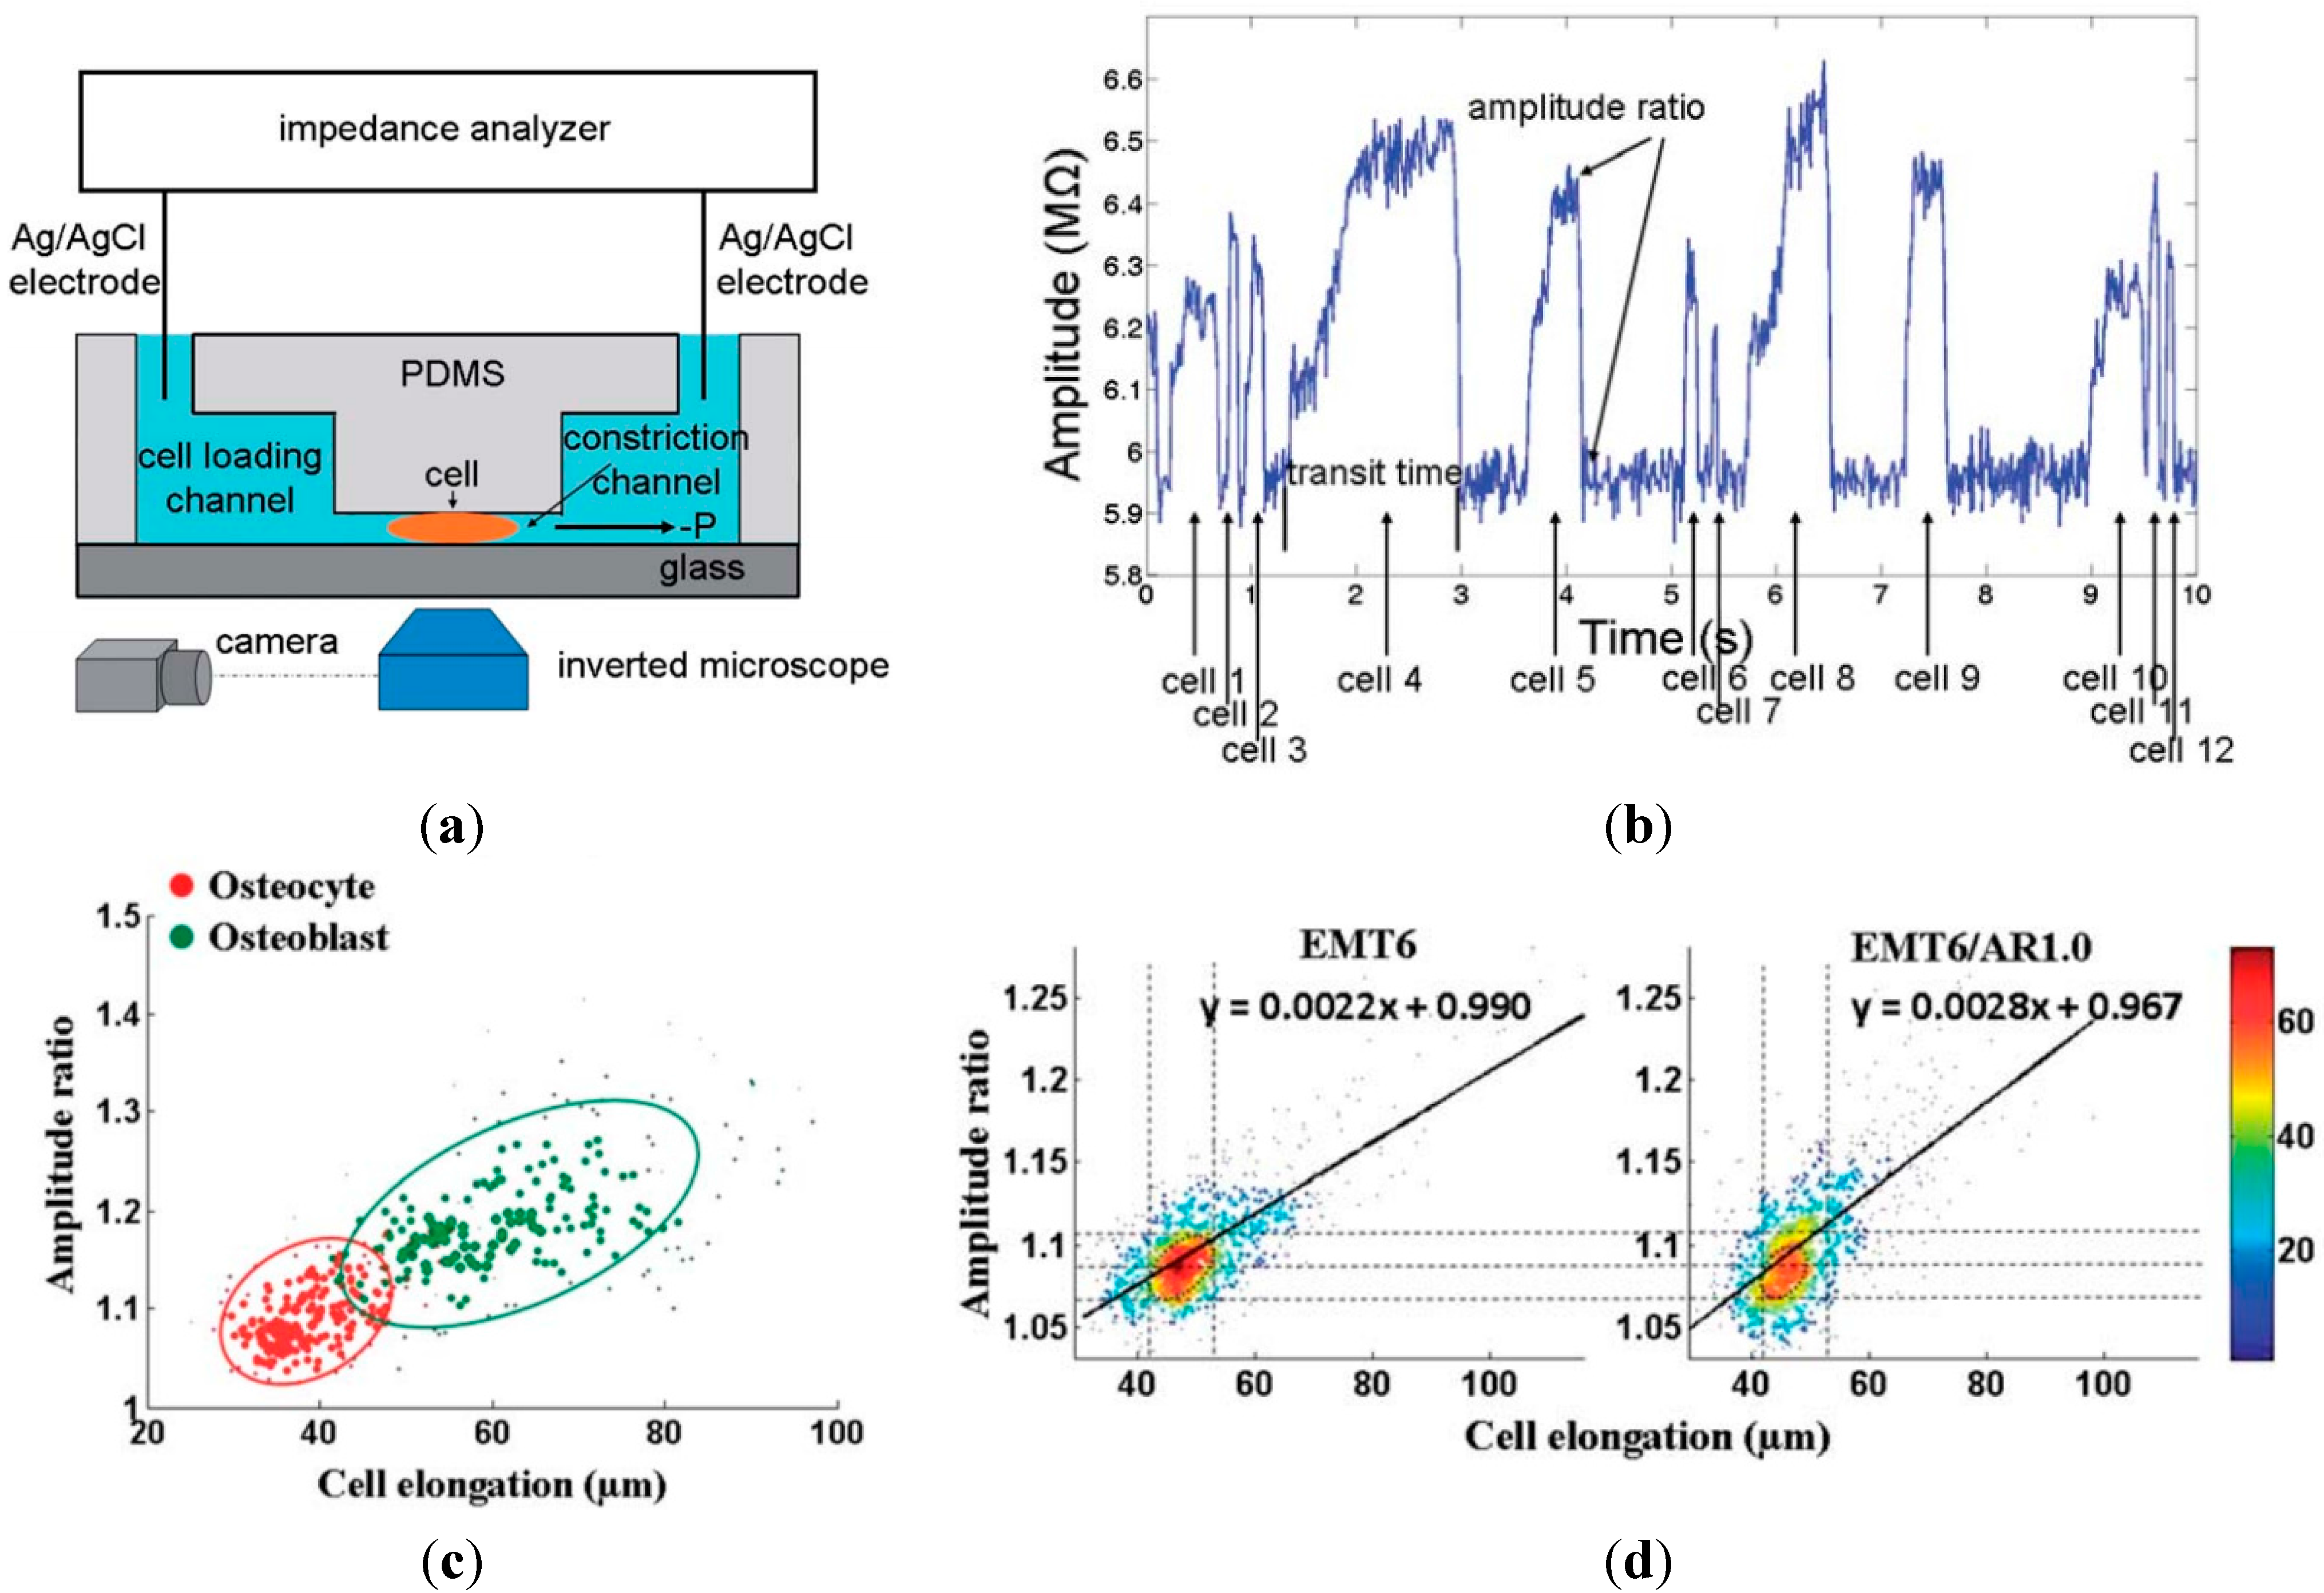
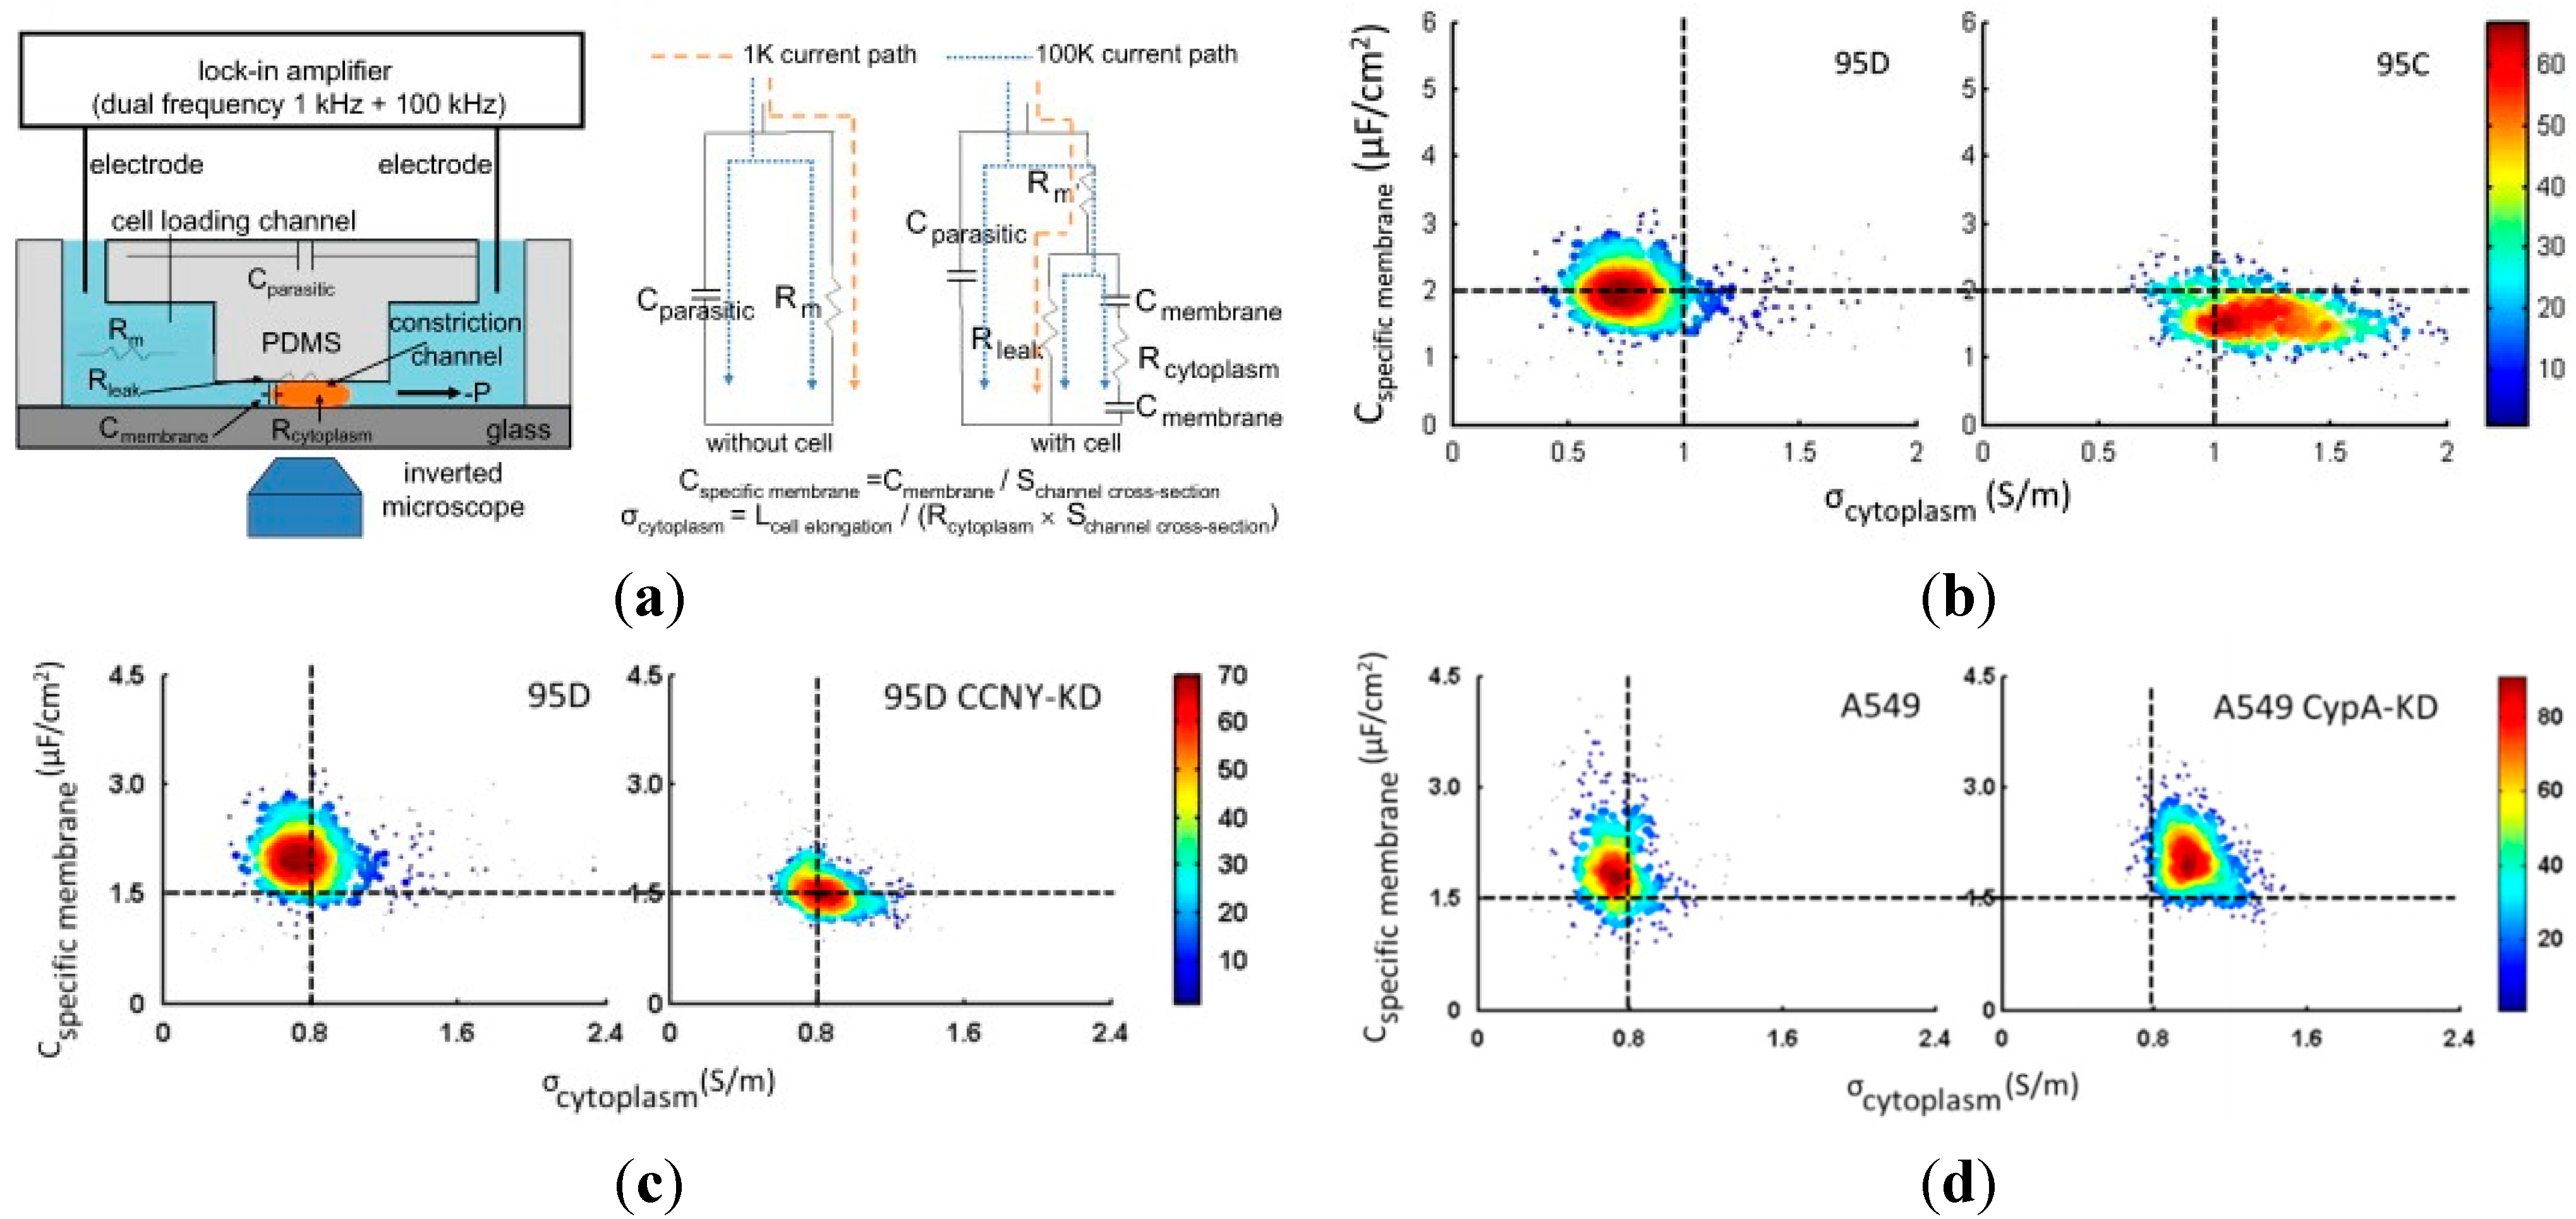
| Constriction channel + equivalent circuit model | Specific membrane capacitance and cytoplasm conductivity | Characterization of size-independent intrinsic cellular electrical properties from hundreds of single cells | [ 85] |
| Constriction channel + equivalent circuit model | Specific membrane capacitance and cytoplasm conductivity | Paired high- and low-metastatic cancer cells, and tumor cells with single oncogenes under regulation | [ 5] |
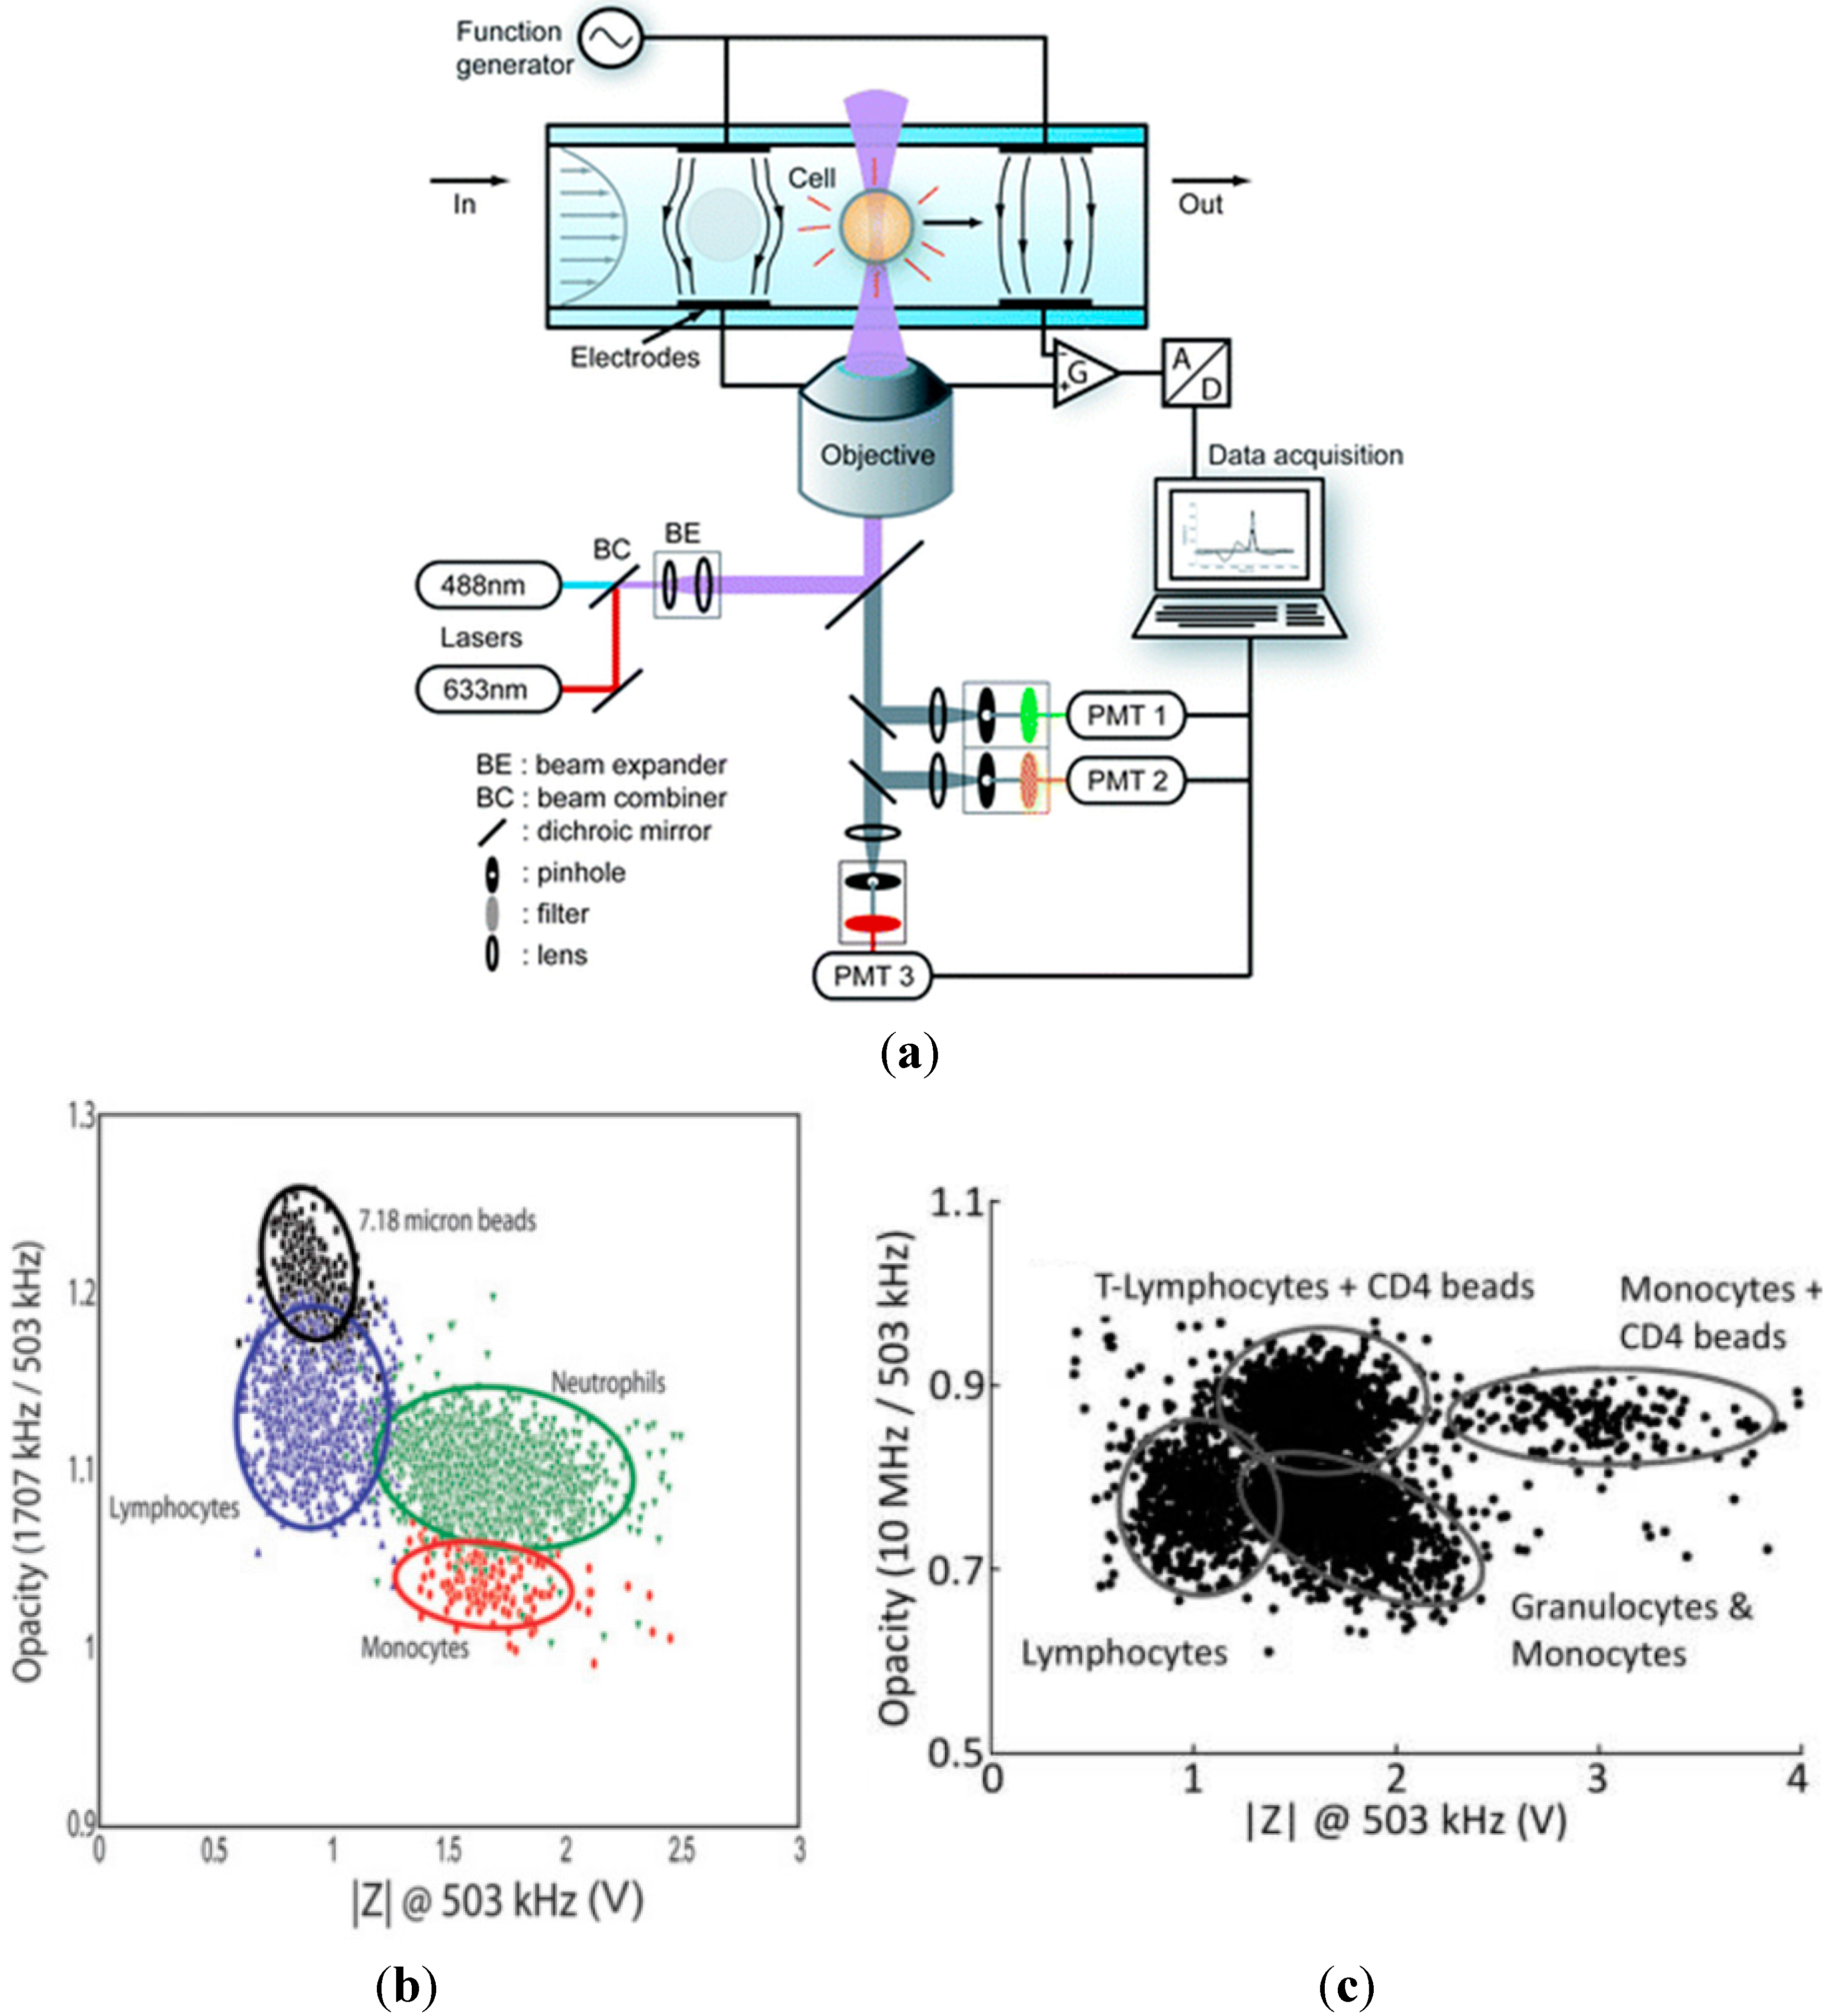
| Parallel microelectrodes + optical lens | Two-frequency impedance data (503 kHz and 1.7 MHz) and fluorescent signals | lymphocytes, monocytes and neutrophils | [ 10] |
| Parallel microelectrodes + optical lens | Two-frequency impedance data (503 kHz and 10.0 MHz) and fluorescent signals | Lymphocytes, lymphocytes + CD4 beads, granulocytes, monocytes and monocytes + CD4 | [ 11] |
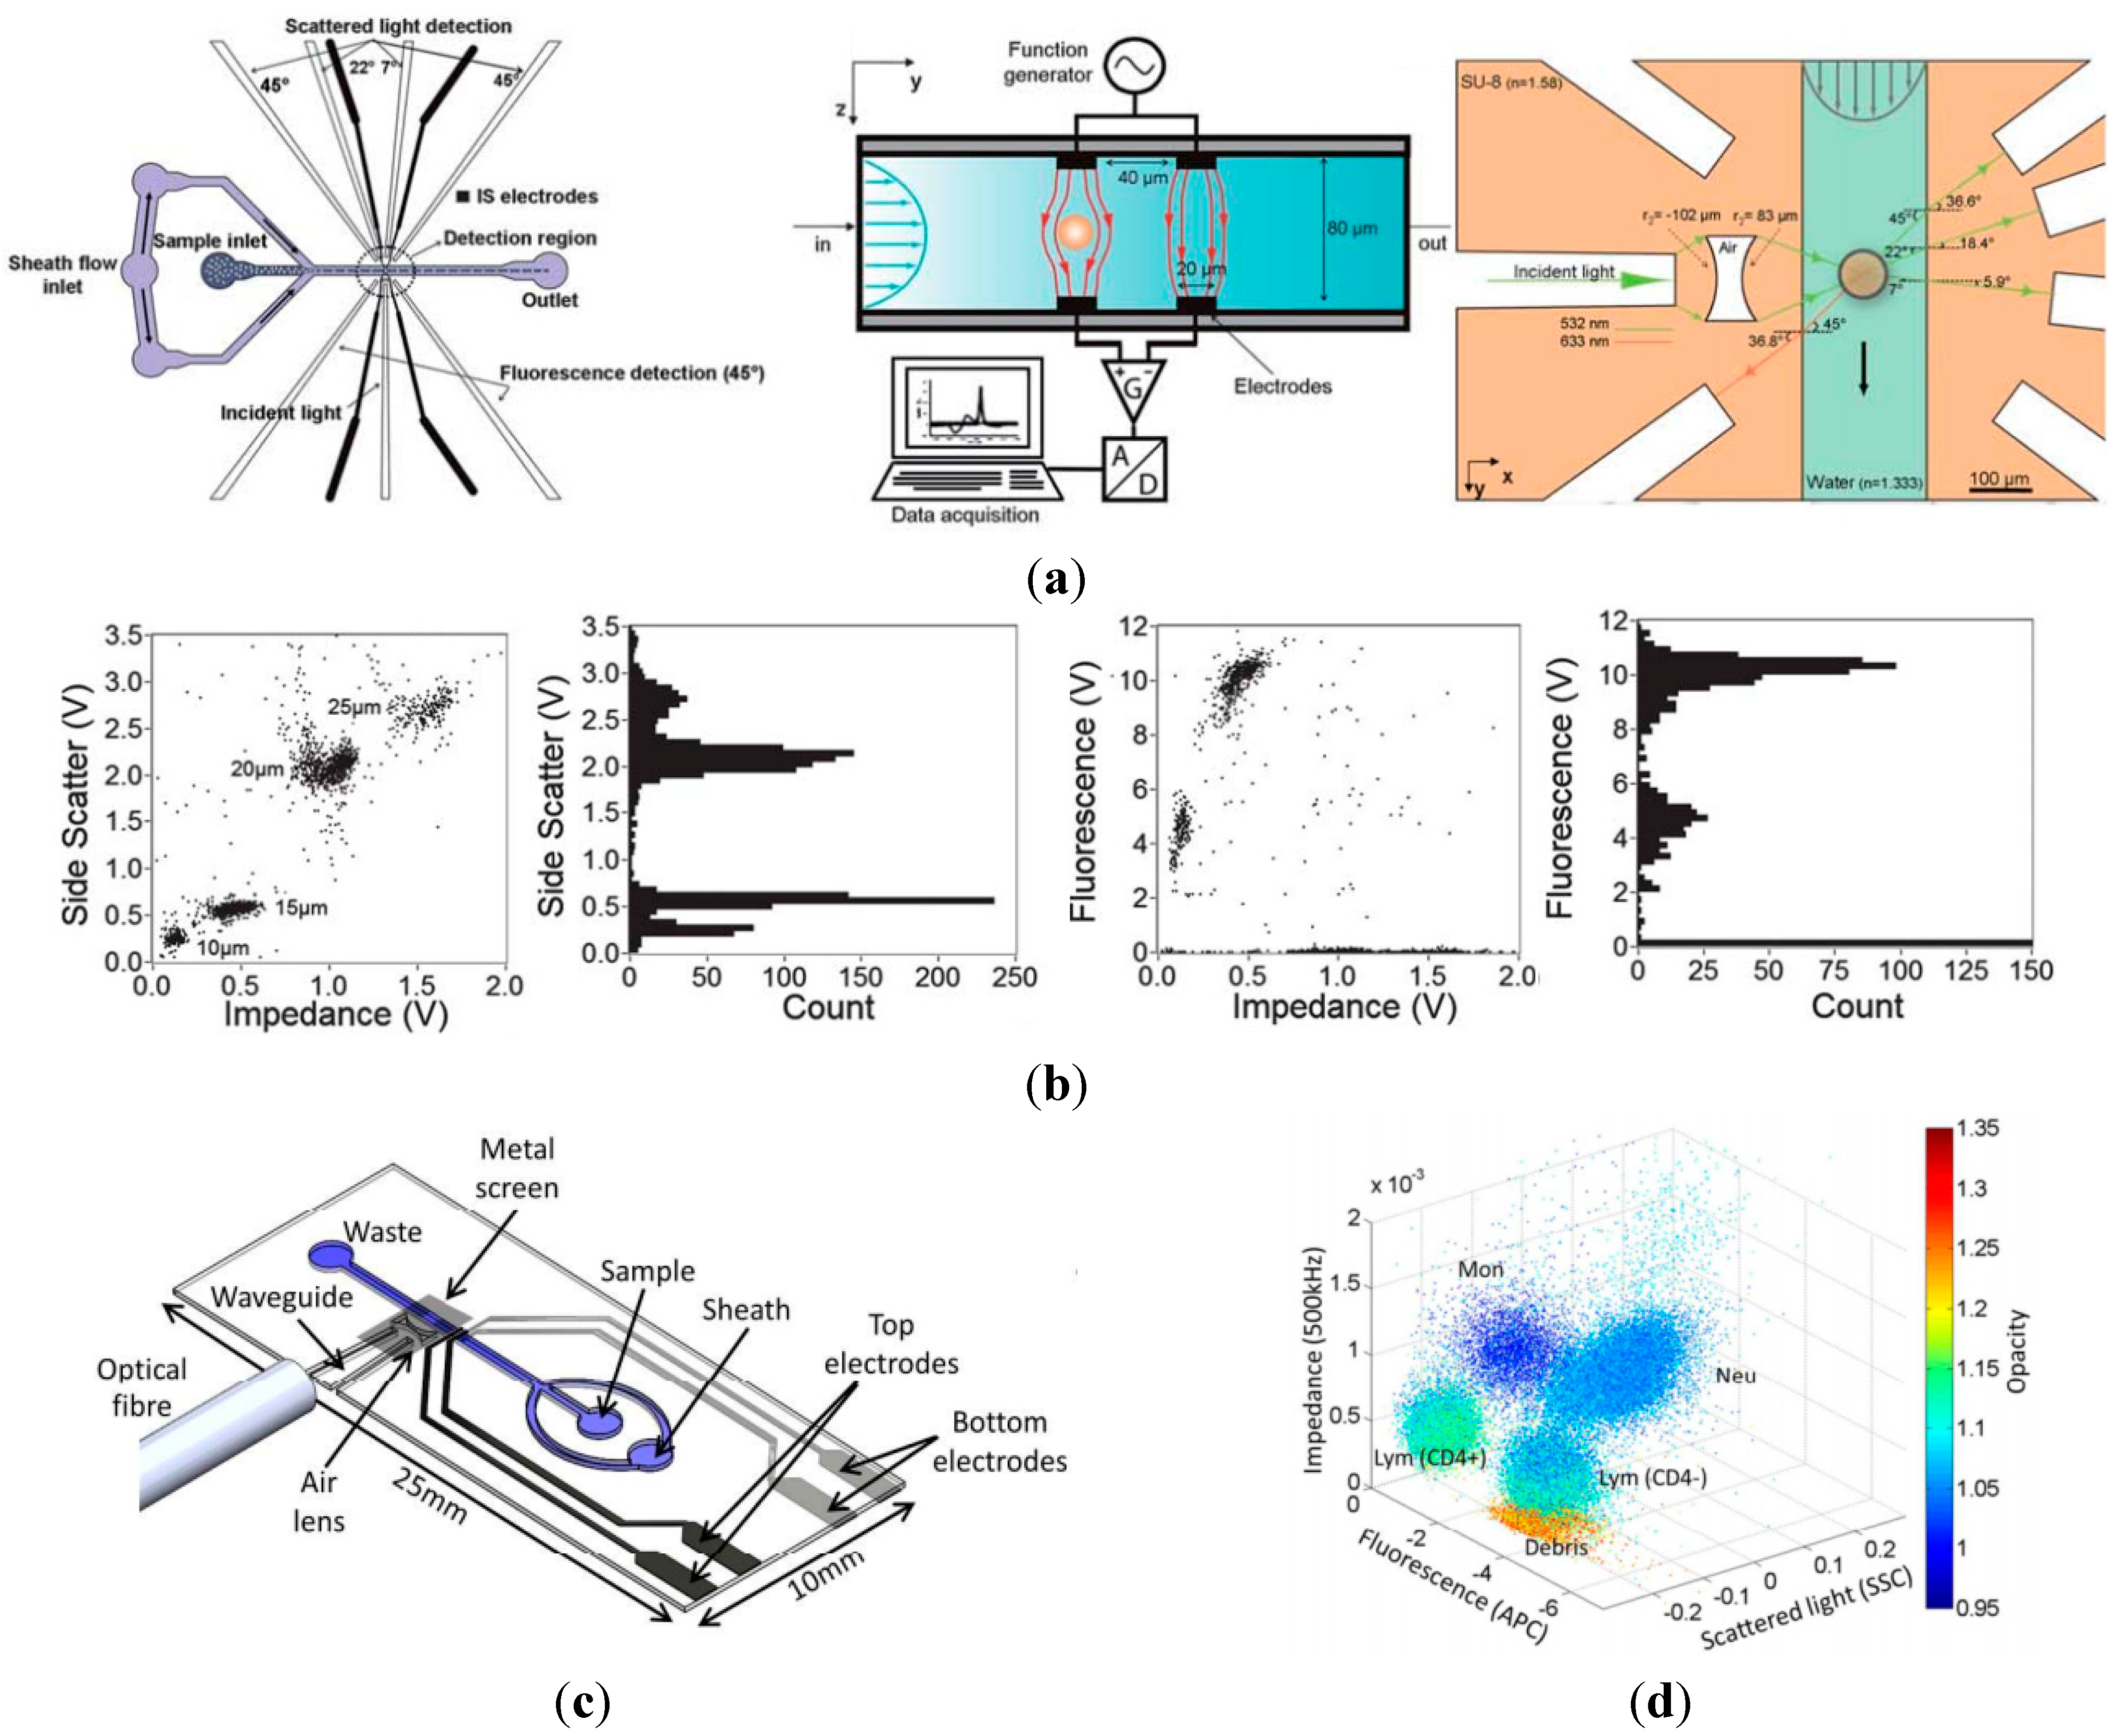
| Parallel microelectrodes + on-chip optical fibers | One-frequency impedance data (1.0 MHz), fluorescent signals, and side scattered light | Microbeads (10 and 15 μm diameter fluorescent, 20 and 25 μm diameter plain) | [ 86] |
| Parallel microelectrodes + on-chip waveguides | Two-frequency impedance data (500 kHz and 2.0 MHz), fluorescent signals, and side scattered light | Lymphocytes, granulocytes, monocytes, neutrophils and CD4 labelled white blood cells | [ 87] |
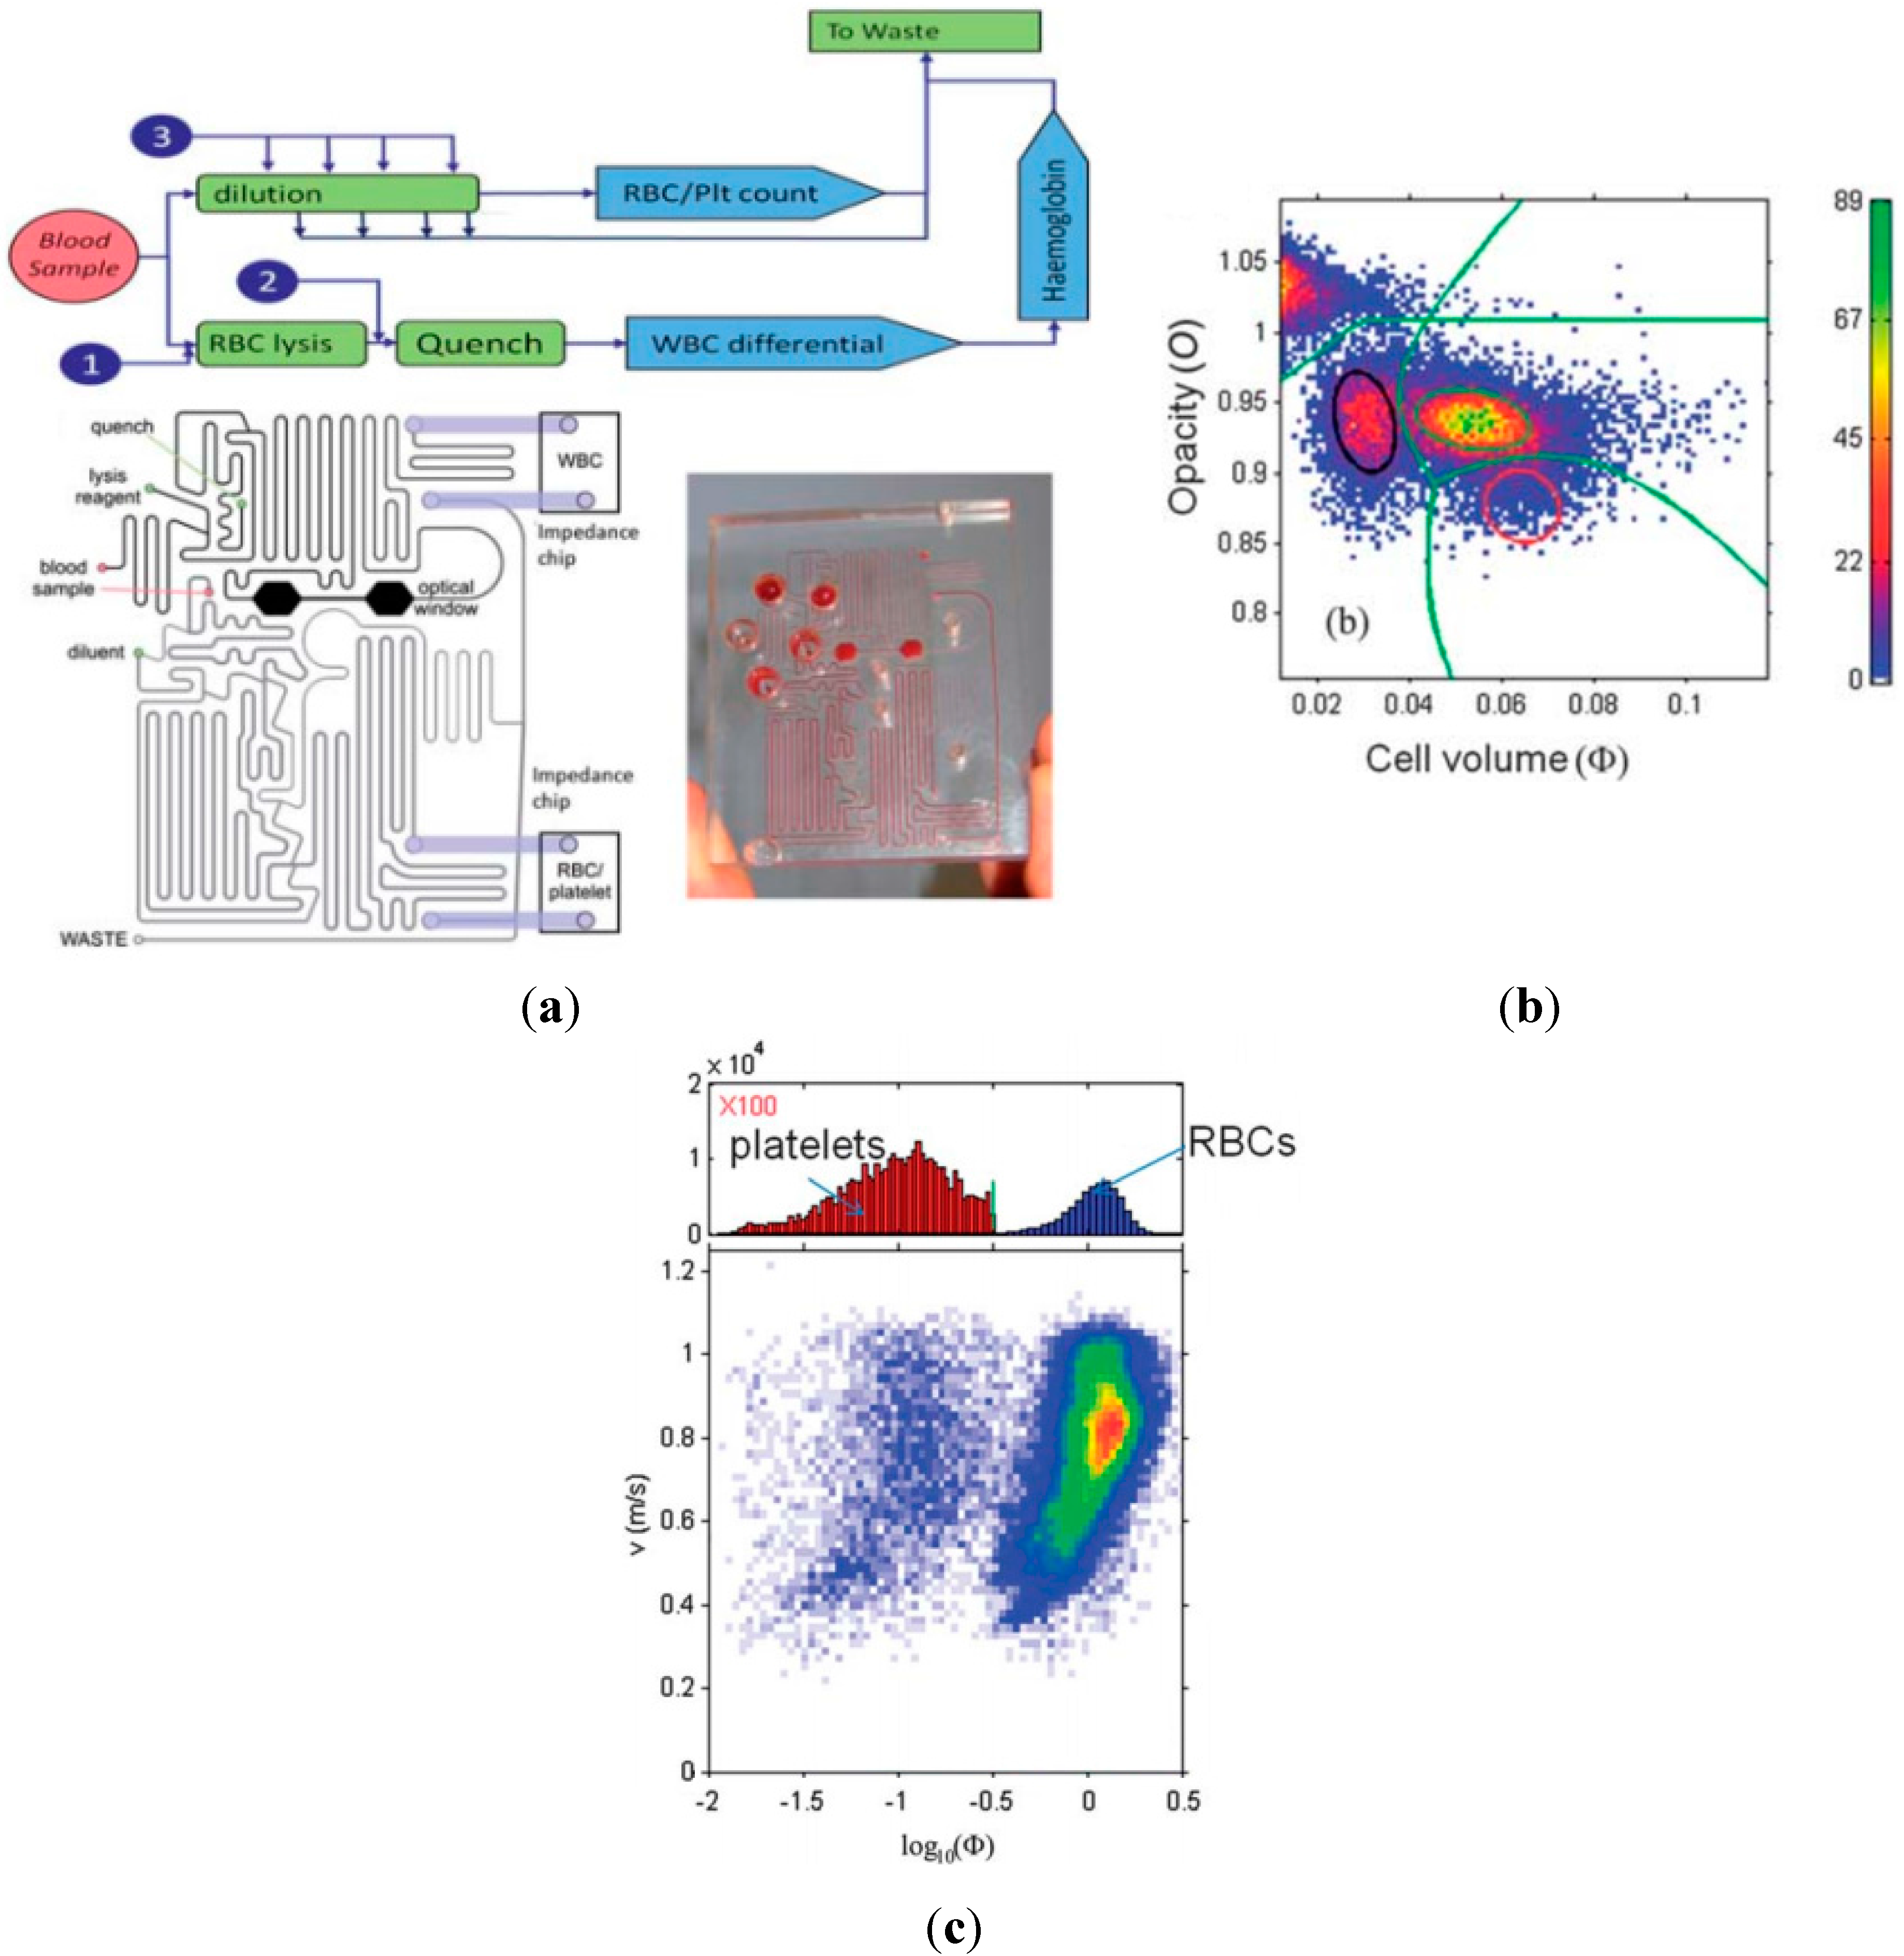
| Parallel microelectrodes + sample pretreatment module | Two-frequency impedance data (500 kHz and 1.7 MHz) | Lymphocytes, monocytes, neutrophils, red blood cells and platelets | [ 88] |
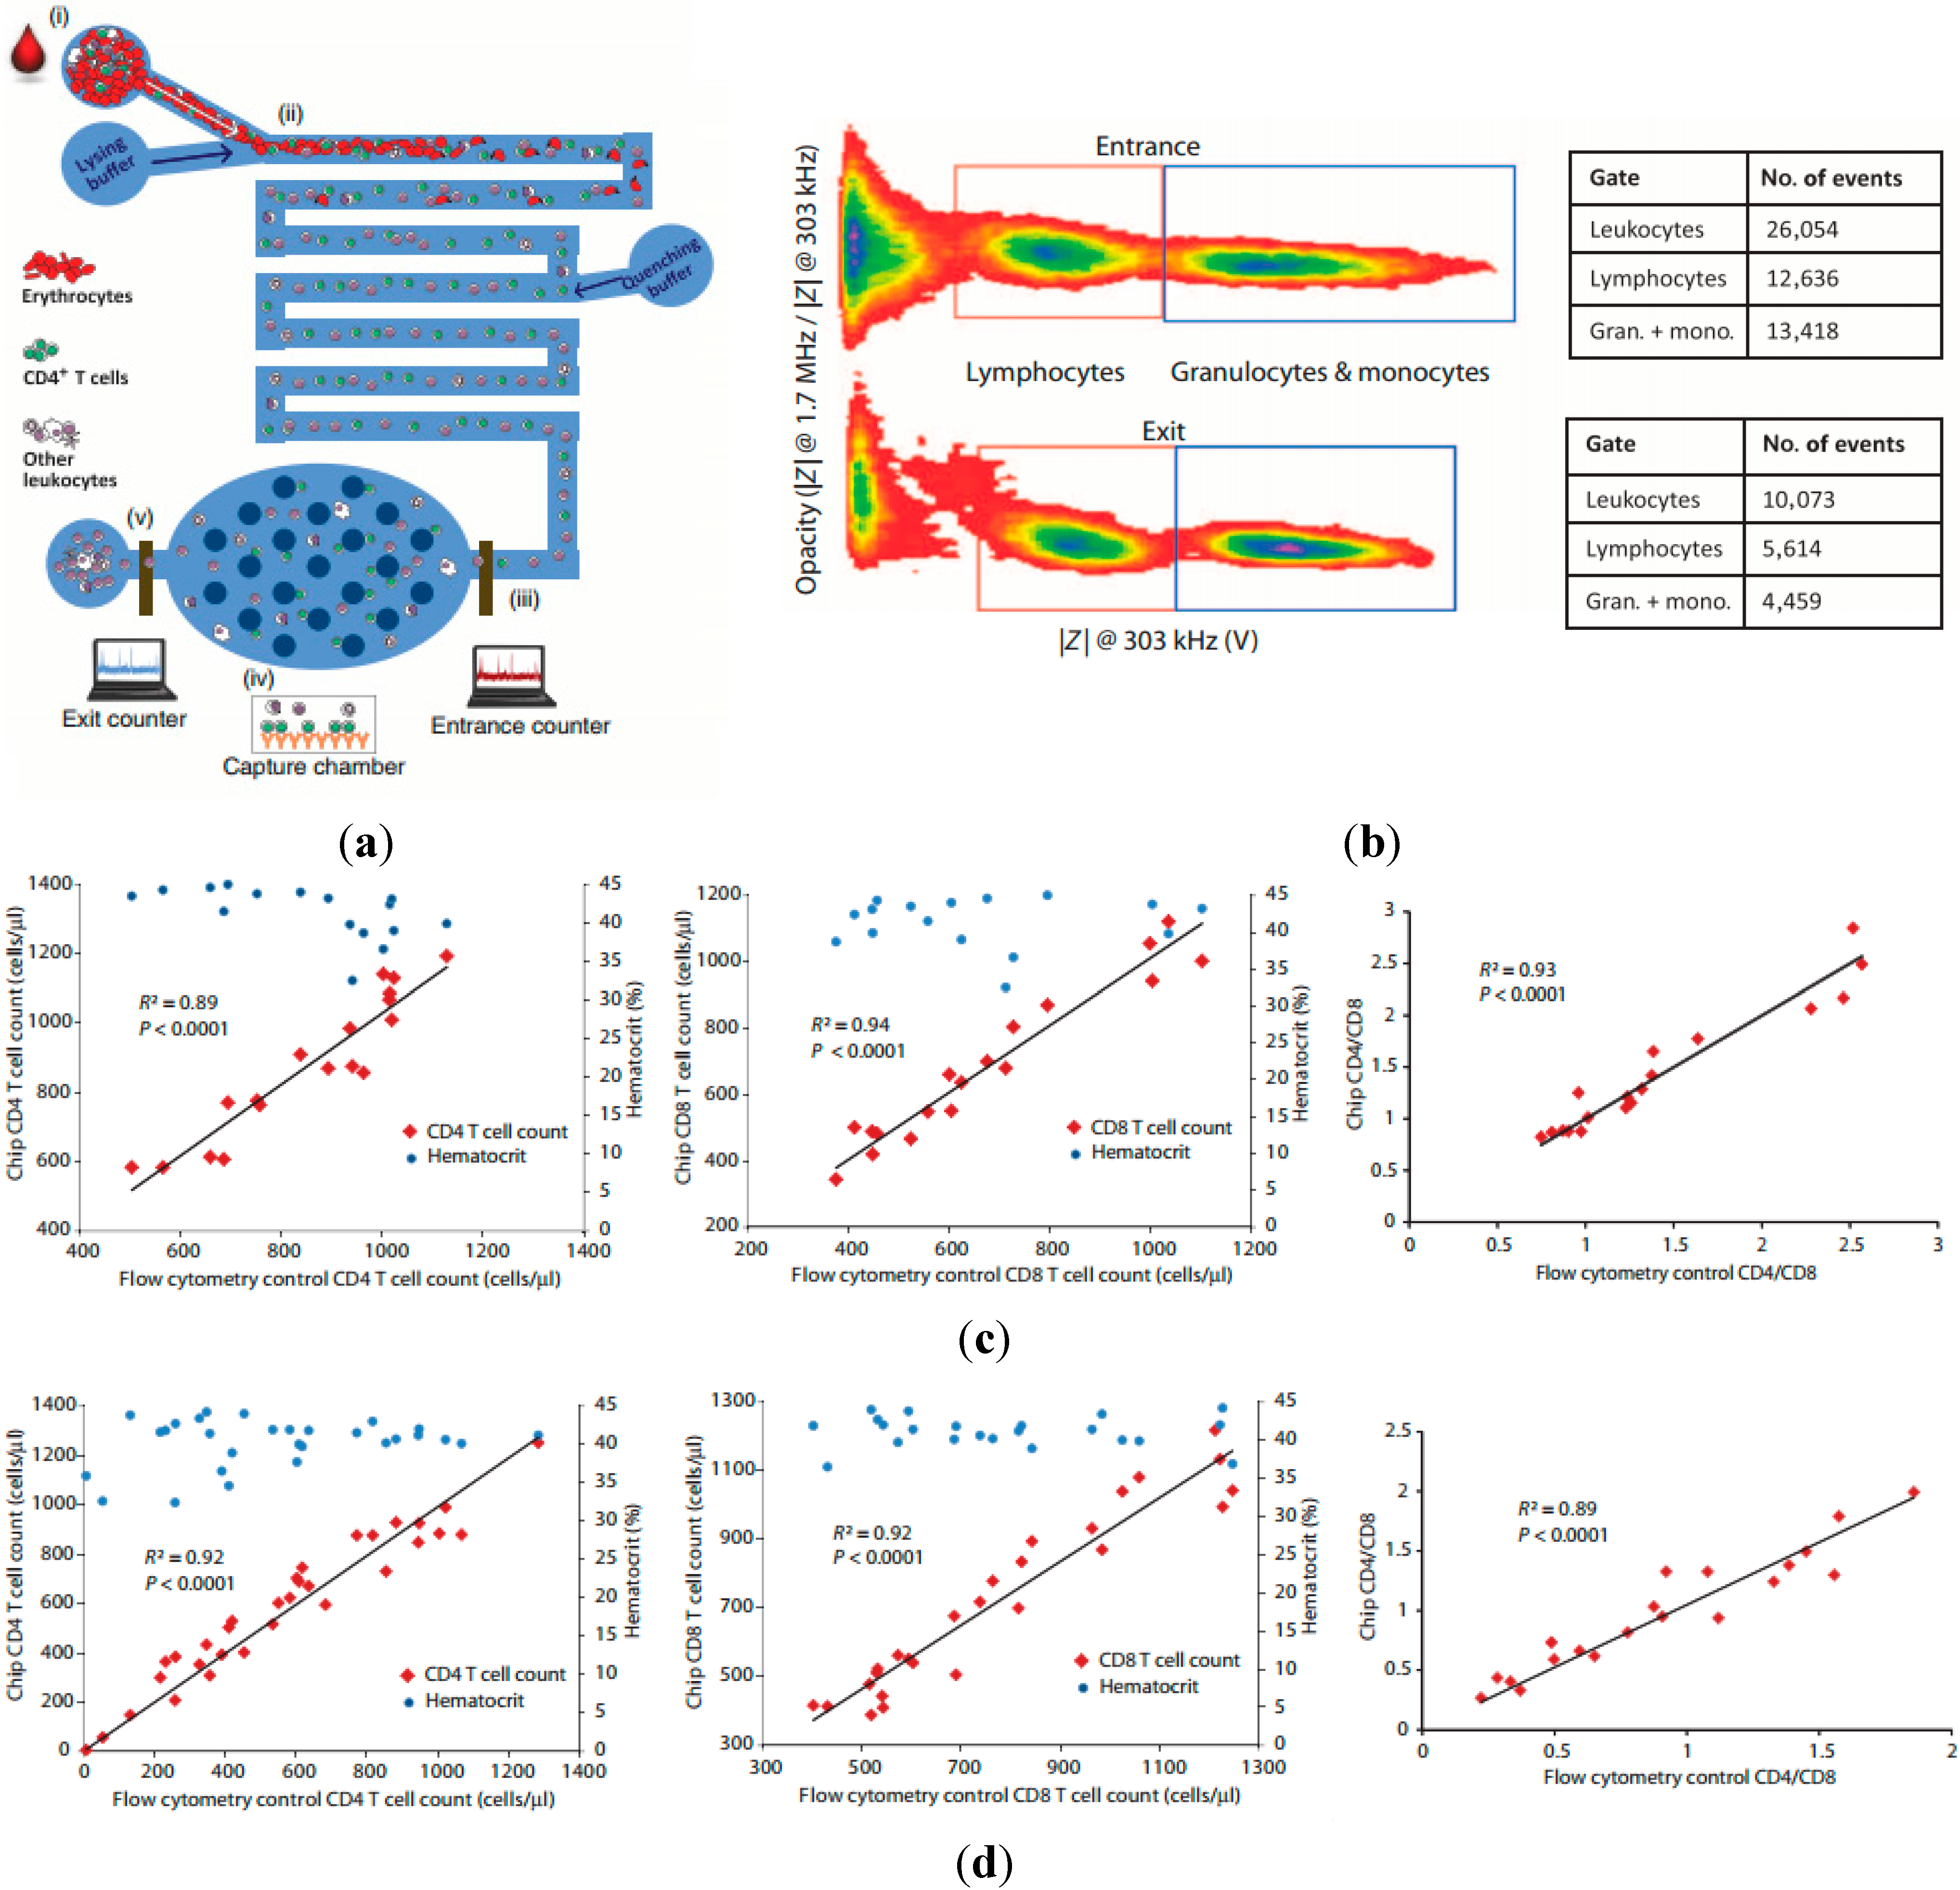
| Parallel microelectrodes + sample pretreatment module | Two-frequency impedance data (303 kHz and 1.7 MHz) | CD4+ and CD8+ lymphocytes | [7] |
2. Early Development of Microfluidic Flow Cytometry for Single-Cell Electrical Property Characterization


3. Microfluidic Impedance Flow Cytometry with Enhanced Sensitivity


4. Microfluidic Impedance and Fluorescent Flow Cytometry for Single-Cell Analysis


5. Integrated Point of Care System Based on Microfluidic Impedance Flow Cytometry


6. Conclusions and Outlook
Acknowledgments
Author Contributions
Conflicts of Interest
References
- Morgan, H.; Sun, T.; Holmes, D.; Gawad, S.; Green, N.G. Single cell dielectric spectroscopy. J. Phys. D-Appl. Phys. 2007, 40, 61–70. [Google Scholar] [CrossRef]
- Valero, A.; Braschler, T.; Renaud, P. A unified approach to dielectric single cell analysis: Impedance and dielectrophoretic force spectroscopy. Lab Chip 2010, 10, 2216–2225. [Google Scholar] [CrossRef] [PubMed]
- Liang, X.; Graham, K.A.; Johannessen, A.C.; Costea, D.E.; Labeed, F.H. Human oral cancer cells with increasing tumorigenic abilities exhibit higher effective membrane capacitance. Integr. Biol. 2014, 6, 545–554. [Google Scholar] [CrossRef]
- Coley, H.M.; Labeed, F.H.; Thomas, H.; Hughes, M.P. Biophysical characterization of mdr breast cancer cell lines reveals the cytoplasm is critical in determining drug sensitivity. Biochim. Biophys. Acta 2007, 1770, 601–608. [Google Scholar] [CrossRef] [PubMed]
- Zhao, Y.; Zhao, X.T.; Chen, D.Y.; Luo, Y.N.; Jiang, M.; Wei, C.; Long, R.; Yue, W.T.; Wang, J.B.; Chen, J. Tumor cell characterization and classification based on cellular specific membrane capacitance and cytoplasm conductivity. Biosens. Bioelectron. 2014, 57, 245–253. [Google Scholar] [CrossRef] [PubMed]
- Song, H.; Wang, Y.; Rosano, J.M.; Prabhakarpandian, B.; Garson, C.; Pant, K.; Lai, E. A microfluidic impedance flow cytometer for identification of differentiation state of stem cells. Lab Chip 2013, 13, 2300–2310. [Google Scholar] [CrossRef] [PubMed]
- Watkins, N.N.; Hassan, U.; Damhorst, G.; Ni, H.; Vaid, A.; Rodriguez, W.; Bashir, R. Microfluidic CD4+ and CD8+ t lymphocyte counters for point-of-care hiv diagnostics using whole blood. Sci. Trans. Med. 2013, 5, 214ra170. [Google Scholar] [CrossRef]
- Han, X.; van Berkel, C.; Gwyer, J.; Capretto, L.; Morgan, H. Microfluidic lysis of human blood for leukocyte analysis using single cell impedance cytometry. Anal. Chem. 2012, 84, 1070–1075. [Google Scholar] [CrossRef] [PubMed]
- Du, E.; Ha, S.; Diez-Silva, M.; Dao, M.; Suresh, S.; Chandrakasan, A.P. Electric impedance microflow cytometry for characterization of cell disease states. Lab Chip 2013, 13, 3903–3909. [Google Scholar] [CrossRef] [PubMed]
- Holmes, D.; Pettigrew, D.; Reccius, C.H.; Gwyer, J.D.; van Berkel, C.; Holloway, J.; Davies, D.E.; Morgan, H. Leukocyte analysis and differentiation using high speed microfluidic single cell impedance cytometry. Lab Chip 2009, 9, 2881–2889. [Google Scholar] [CrossRef] [PubMed]
- Holmes, D.; Morgan, H. Single cell impedance cytometry for identification and counting of CD4 t-cells in human blood using impedance labels. Anal. Chem. 2010, 82, 1455–1461. [Google Scholar] [CrossRef] [PubMed]
- Zheng, Y.; Nguyen, J.; Wei, Y.; Sun, Y. Recent advances in microfluidic techniques for single-cell biophysical characterization. Lab Chip 2013, 13, 2464–2483. [Google Scholar] [CrossRef] [PubMed]
- Labeed, F.H.; Coley, H.M.; Thomas, H.; Hughes, M.P. Assessment of multidrug resistance reversal using dielectrophoresis and flow cytometry. Biophys. J. 2003, 85, 2028–2034. [Google Scholar] [CrossRef] [PubMed]
- Broche, L.M.; Labeed, F.H.; Hughes, M.P. Extraction of dielectric properties of multiple populations from dielectrophoretic collection spectrum data. Phys. Med. Biol. 2005, 50, 2267–2274. [Google Scholar] [CrossRef] [PubMed]
- Duncan, L.; Shelmerdine, H.; Hughes, M.P.; Coley, H.M.; Hubner, Y.; Labeed, F.H. Dielectrophoretic analysis of changes in cytoplasmic ion levels due to ion channel blocker action reveals underlying differences between drug-sensitive and multidrug-resistant leukaemic cells. Phys. Med. Biol. 2008, 53, N1–N7. [Google Scholar] [CrossRef] [PubMed]
- Vykoukal, D.M.; Gascoyne, P.R.; Vykoukal, J. Dielectric characterization of complete mononuclear and polymorphonuclear blood cell subpopulations for label-free discrimination. Integr. Biol. 2009, 1, 477–484. [Google Scholar] [CrossRef]
- Wu, L.; Lanry Yung, L.Y.; Lim, K.M. Dielectrophoretic capture voltage spectrum for measurement of dielectric properties and separation of cancer cells. Biomicrofluidics 2012, 6, 14113. [Google Scholar] [CrossRef] [PubMed]
- Bebarova, M. Advances in patch clamp technique: Towards higher quality and quantity. Gen. Physiol. Biophys. 2012, 31, 131–140. [Google Scholar] [CrossRef] [PubMed]
- Kornreich, B.G. The patch clamp technique: Principles and technical considerations. J. Vet. Cardiol. 2007, 9, 25–37. [Google Scholar] [CrossRef] [PubMed]
- Dale, T.J.; Townsend, C.; Hollands, E.C.; Trezise, D.J. Population patch clamp electrophysiology: A breakthrough technology for ion channel screening. Mol. Biosyst. 2007, 3, 714–722. [Google Scholar] [CrossRef] [PubMed]
- Liem, L.K.; Simard, J.M.; Song, Y.; Tewari, K. The patch clamp technique. Neurosurgery 1995, 36, 382–392. [Google Scholar] [CrossRef] [PubMed]
- Cahalan, M.; Neher, E. Patch clamp techniques: An overview. Methods Enzymol. 1992, 207, 3–14. [Google Scholar] [PubMed]
- Sakmann, B.; Neher, E. Patch clamp techniques for studying ionic channels in excitable membranes. Annu. Rev. Physiol. 1984, 46, 455–472. [Google Scholar] [CrossRef] [PubMed]
- Auerbach, A.; Sachs, F. Patch clamp studies of single ionic channels. Annu. Rev. Biophys. Bioeng. 1984, 13, 269–302. [Google Scholar] [CrossRef] [PubMed]
- Rohani, A.; Varhue, W.; Su, Y.H.; Swami, N.S. Electrical tweezer for highly parallelized electrorotation measurements over a wide frequency bandwidth. Electrophoresis 2014, 35, 1795–1802. [Google Scholar] [CrossRef] [PubMed]
- Lei, U.; Sun, P.H.; Pethig, R. Refinement of the theory for extracting cell dielectric properties from dielectrophoresis and electrorotation experiments. Biomicrofluidics 2011, 5, 044109. [Google Scholar] [CrossRef]
- Voyer, D.; Frenea-Robin, M.; Buret, F.; Nicolas, L. Improvements in the extraction of cell electric properties from their electrorotation spectrum. Bioelectrochemistry 2010, 79, 25–30. [Google Scholar] [CrossRef] [PubMed]
- Jones, T.B. Basic theory of dielectrophoresis and electrorotation. IEEE Eng. Med. Biol. Mag. 2003, 22, 33–42. [Google Scholar] [CrossRef] [PubMed]
- Goater, A.D.; Pethig, R. Electrorotation and dielectrophoresis. Parasitology 1998, 117 (Suppl.), S177–S189. [Google Scholar] [CrossRef] [PubMed]
- Fuhr, G.; Glaser, R.; Hagedorn, R. Rotation of dielectrics in a rotating electric high-frequency field-model experiments and theoretical explanation of the rotation effect of living cells. Biophys. J. 1986, 49, 395–402. [Google Scholar] [CrossRef] [PubMed]
- Egger, M.; Donath, E.; Ziemer, S.; Glaser, R. Electrorotation--a new method for investigating membrane events during thrombocyte activation. Influence of drugs and osmotic pressure. Biochim. Biophys. Acta 1986, 861, 122–130. [Google Scholar] [CrossRef] [PubMed]
- Fuhr, G.; Hagedorn, R.; Goring, H. Separation of different cell-types by rotating electric-fields. Plant Cell Physiol. 1985, 26, 1527–1531. [Google Scholar]
- Yobas, L. Microsystems for cell-based electrophysiology. J. Micromech. Microeng. 2013, 23, 083002. [Google Scholar] [CrossRef]
- Sabuncu, A.C.; Zhuang, J.; Kolb, J.F.; Beskok, A. Microfluidic impedance spectroscopy as a tool for quantitative biology and biotechnology. Biomicrofluidics 2012, 6, 34103. [Google Scholar] [CrossRef] [PubMed]
- Sun, T.; Morgan, H. Single-cell microfluidic impedance cytometry: A review. Microfluid. Nanofluid. 2010, 8, 423–443. [Google Scholar] [CrossRef]
- Cheung, K.C.; di Berardino, M.; Schade-Kampmann, G.; Hebeisen, M.; Pierzchalski, A.; Bocsi, J.; Mittag, A.; Tarnok, A. Microfluidic impedance-based flow cytometry. Cytom. A 2010, 77, 648–666. [Google Scholar] [CrossRef]
- Wootton, R.C.; Demello, A.J. Microfluidics: Exploiting elephants in the room. Nature 2010, 464, 839–840. [Google Scholar] [CrossRef] [PubMed]
- Whitesides, G.M. The origins and the future of microfluidics. Nature 2006, 442, 368–373. [Google Scholar] [CrossRef] [PubMed]
- Squires, T.M.; Quake, S.R. Microfluidics: Fluid physics at the nanoliter scale. Rev. Mod. Phys. 2005, 77, 977. [Google Scholar] [CrossRef]
- Sackmann, E.K.; Fulton, A.L.; Beebe, D.J. The present and future role of microfluidics in biomedical research. Nature 2014, 507, 181–189. [Google Scholar] [CrossRef] [PubMed]
- El-Ali, J.; Sorger, P.K.; Jensen, K.F. Cells on chips. Nature 2006, 442, 403–411. [Google Scholar] [CrossRef] [PubMed]
- Meyvantsson, I.; Beebe, D.J. Cell culture models in microfluidic systems. Annu. Rev. Anal. Chem. 2008, 1, 423–449. [Google Scholar] [CrossRef]
- Paguirigan, A.L.; Beebe, D.J. Microfluidics meet cell biology: Bridging the gap by validation and application of microscale techniques for cell biological assays. BioEssays News Rev. Mol. Cell. Dev. Biol. 2008, 30, 811–821. [Google Scholar] [CrossRef]
- Velve-Casquillas, G.; Le Berre, M.; Piel, M.; Tran, P.T. Microfluidic tools for cell biological research. Nano Today 2010, 5, 28–47. [Google Scholar] [CrossRef] [PubMed]
- Thompson, A.M.; Paguirigan, A.L.; Kreutz, J.E.; Radich, J.P.; Chiu, D.T. Microfluidics for single-cell genetic analysis. Lab Chip 2014, 14, 3135–3142. [Google Scholar] [CrossRef] [PubMed]
- Yin, H.; Marshall, D. Microfluidics for single cell analysis. Curr. Opin. Biotechnol. 2012, 23, 110–119. [Google Scholar] [CrossRef] [PubMed]
- Lecault, V.; White, A.K.; Singhal, A.; Hansen, C.L. Microfluidic single cell analysis: From promise to practice. Curr. Opin. Chem. Biol. 2012, 16, 381–390. [Google Scholar] [CrossRef] [PubMed]
- Ryan, D.; Ren, K.; Wu, H. Single-cell assays. Biomicrofluidics 2011, 5, 21501. [Google Scholar] [CrossRef] [PubMed]
- Zare, R.N.; Kim, S. Microfluidic platforms for single-cell analysis. Annu. Rev. Biomed. Eng. 2010, 12, 187–201. [Google Scholar] [CrossRef] [PubMed]
- Sims, C.E.; Allbritton, N.L. Analysis of single mammalian cells on-chip. Lab Chip 2007, 7, 423–440. [Google Scholar] [CrossRef] [PubMed]
- Di Carlo, D.; Lee, L.P. Dynamic single-cell analysis for quantitative biology. Anal. Chem. 2006, 78, 7918–7925. [Google Scholar]
- Cho, Y.H.; Yamamoto, T.; Sakai, Y.; Fujii, T.; Kim, B. Development of microfluidic device for electrical/physical characterization of single cell. J. Microelectromech. Syst. 2006, 15, 287–295. [Google Scholar] [CrossRef]
- Jang, L.S.; Wang, M.H. Microfluidic device for cell capture and impedance measurement. Biomed. Microdevices 2007, 9, 737–743. [Google Scholar] [CrossRef] [PubMed]
- Senez, V.; Lennon, E.; Ostrovidov, S.; Yamamoto, T.; Fujita, H.; Sakai, Y.; Fujii, T. Integrated 3-d silicon electrodes for electrochemical sensing in microfluidic environments: Application to single-cell characterization. IEEE Sens. J. 2008, 8, 548–557. [Google Scholar] [CrossRef]
- Hua, S.Z.; Pennell, T. A microfluidic chip for real-time studies of the volume of single cells. Lab Chip 2009, 9, 251–256. [Google Scholar] [CrossRef] [PubMed]
- Wang, M.H.; Jang, L.S. A systematic investigation into the electrical properties of single hela cells via impedance measurements and comsol simulations. Biosens. Bioelectron. 2009, 24, 2830–2835. [Google Scholar] [CrossRef] [PubMed]
- Jang, L.S.; Li, H.H.; Jao, J.Y.; Chen, M.K.; Liu, C.F. Design and fabrication of microfluidic devices integrated with an open-ended mems probe for single-cell impedance measurement. Microfluid. Nanofluid. 2010, 8, 509–519. [Google Scholar] [CrossRef]
- Malleo, D.; Nevill, J.T.; Lee, L.P.; Morgan, H. Continuous differential impedance spectroscopy of single cells. Microfluid. Nanofluid. 2010, 9, 191–198. [Google Scholar] [CrossRef] [PubMed]
- Han, K.H.; Han, A.; Frazier, A.B. Microsystems for isolation and electrophysiological analysis of breast cancer cells from blood. Biosens. Bioelectron. 2006, 21, 1907–1914. [Google Scholar] [CrossRef] [PubMed]
- Cho, S.B.; Thielecke, H. Micro hole-based cell chip with impedance spectroscopy. Biosens. Bioelectron. 2007, 22, 1764–1768. [Google Scholar] [CrossRef] [PubMed]
- James, C.D.; Reuel, N.; Lee, E.S.; Davalos, R.V.; Mani, S.S.; Carroll-Portillo, A.; Rebeil, R.; Martino, A.; Apblett, C.A. Impedimetric and optical interrogation of single cells in a microfluidic device for real-time viability and chemical response assessment. Biosens. Bioelectron. 2008, 23, 845–851. [Google Scholar] [CrossRef] [PubMed]
- Cho, Y.; Kim, H.S.; Frazier, A.B.; Chen, Z.G.; Shin, D.M.; Han, A. Whole-cell impedance analysis for highly and poorly metastatic cancer cells. J. Microelectromech. Syst. 2009, 18, 808–817. [Google Scholar] [CrossRef]
- Chen, J.; Zheng, Y.; Tan, Q.; Zhang, Y.L.; Li, J.; Geddie, W.R.; Jewett, M.A.; Sun, Y. A microfluidic device for simultaneous electrical and mechanical measurements on single cells. Biomicrofluidics 2011, 5, 14113. [Google Scholar] [CrossRef] [PubMed]
- Kang, G.; Kim, Y.-J.; Moon, H.-S.; Lee, J.-W.; Yoo, T.-K.; Park, K.; Lee, J.-H. Discrimination between the human prostate normal cell and cancer cell by using a novel electrical impedance spectroscopy controlling the cross-sectional area of a microfluidic channel. Biomicrofluidics 2013, 7, 044126. [Google Scholar] [CrossRef]
- Tan, Q.; Ferrier, G.A.; Chen, B.K.; Wang, C.; Sun, Y. Quantification of the specific membrane capacitance of single cells using a microfluidic device and impedance spectroscopy measurement. Biomicrofluidics 2012, 6, 034112. [Google Scholar] [CrossRef]
- Jang, L.S.; Huang, P.H.; Lan, K.C. Single-cell trapping utilizing negative dielectrophoretic quadrupole and microwell electrodes. Biosens. Bioelectron. 2009, 24, 3637–3644. [Google Scholar] [CrossRef] [PubMed]
- Lan, K.C.; Jang, L.S. Integration of single-cell trapping and impedance measurement utilizing microwell electrodes. Biosens. Bioelectron. 2011, 26, 2025–2031. [Google Scholar] [CrossRef] [PubMed]
- Hong, J.-L.; Lan, K.-C.; Jang, L.-S. Electrical characteristics analysis of various cancer cells using a microfluidic device based on single-cell impedance measurement. Sens. Actuators B Chem. 2012, 173, 927–934. [Google Scholar] [CrossRef]
- Chen, N.-C.; Chen, C.-H.; Chen, M.-K.; Jang, L.-S.; Wang, M.-H. Single-cell trapping and impedance measurement utilizing dielectrophoresis in a parallel-plate microfluidic device. Sens. Actuators B Chem. 2014, 190, 570–577. [Google Scholar] [CrossRef]
- Thein, M.; Asphahani, F.; Cheng, A.; Buckmaster, R.; Zhang, M.Q.; Xu, J. Response characteristics of single-cell impedance sensors employed with surface-modified microelectrodes. Biosens. Bioelectron. 2010, 25, 1963–1969. [Google Scholar] [CrossRef] [PubMed]
- Asphahani, F.; Wang, K.; Thein, M.; Veiseh, O.; Yung, S.; Xu, J.A.; Zhang, M.Q. Single-cell bioelectrical impedance platform for monitoring cellular response to drug treatment. Phys. Biol. 2011, 8, 015006. [Google Scholar] [CrossRef] [PubMed]
- Asphahani, F.; Zheng, X.H.; Veiseh, O.; Thein, M.; Xu, J.; Ohuchi, F.; Zhang, M.Q. Effects of electrode surface modification with chlorotoxin on patterning single glioma cells. Phys. Chem. Chem. Phys. 2011, 13, 8953–8960. [Google Scholar] [CrossRef] [PubMed]
- Wu, Y.; Han, X.; Benson, J.D.; Almasri, M. Micromachined coulter counter for dynamic impedance study of time sensitive cells. Biomed. Microdevices 2012, 14, 739–750. [Google Scholar] [CrossRef] [PubMed]
- Wu, Y.; Benson, J.D.; Critser, J.K.; Almasri, M. Note: Microelectromechanical systems coulter counter for cell monitoring and counting. Rev. Sci. Instrum. 2010, 81, 076103. [Google Scholar] [CrossRef] [PubMed]
- Swanton, E.M.; Curby, W.A.; Lind, H.E. Experiences with the coulter counter in bacteriology. Appl. Microbiol. 1962, 10, 480–485. [Google Scholar] [PubMed]
- Bryan, A.K.; Engler, A.; Gulati, A.; Manalis, S.R. Continuous and long-term volume measurements with a commercial coulter counter. PLoS ONE 2012, 7, e29866. [Google Scholar] [CrossRef] [PubMed] [Green Version]
- Gawad, S.; Schild, L.; Renaud, P. Micromachined impedance spectroscopy flow cytometer for cell analysis and particle sizing. Lab Chip 2001, 1, 76–82. [Google Scholar] [CrossRef] [PubMed]
- Gou, H.-L.; Zhang, X.-B.; Bao, N.; Xu, J.-J.; Xia, X.-H.; Chen, H.-Y. Label-free electrical discrimination of cells at normal, apoptotic and necrotic status with a microfluidic device. J. Chromatogr. A 2011, 1218, 5725–5729. [Google Scholar] [CrossRef] [PubMed]
- Cheung, K.; Gawad, S.; Renaud, P. Impedance spectroscopy flow cytometry: On-chip label-free cell differentiation. Cytom. Part A 2005, 65, 124–132. [Google Scholar] [CrossRef]
- Haandbaek, N.; Burgel, S.C.; Heer, F.; Hierlemann, A. Characterization of subcellular morphology of single yeast cells using high frequency microfluidic impedance cytometer. Lab Chip 2014, 14, 369–377. [Google Scholar] [CrossRef] [PubMed]
- Bernabini, C.; Holmes, D.; Morgan, H. Micro-impedance cytometry for detection and analysis of micron-sized particles and bacteria. Lab Chip 2011, 11, 407–412. [Google Scholar] [CrossRef] [PubMed]
- Haandbaek, N.; With, O.; Burgel, S.C.; Heer, F.; Hierlemann, A. Resonance-enhanced microfluidic impedance cytometer for detection of single bacteria. Lab Chip 2014, 14, 3313–3324. [Google Scholar] [CrossRef] [PubMed]
- Chen, J.; Zheng, Y.; Tan, Q.; Shojaei-Baghini, E.; Zhang, Y.L.; Li, J.; Prasad, P.; You, L.; Wu, X.Y.; Sun, Y. Classification of cell types using a microfluidic device for mechanical and electrical measurement on single cells. Lab Chip 2011, 11, 3174–3181. [Google Scholar] [CrossRef] [PubMed]
- Zheng, Y.; Shojaei-Baghini, E.; Azad, A.; Wang, C.; Sun, Y. High-throughput biophysical measurement of human red blood cells. Lab Chip 2012, 12, 2560–2567. [Google Scholar] [CrossRef] [PubMed]
- Zhao, Y.; Chen, D.; Li, H.; Luo, Y.; Deng, B.; Huang, S.B.; Chiu, T.K.; Wu, M.H.; Long, R.; Hu, H.; et al. A microfluidic system enabling continuous characterization of specific membrane capacitance and cytoplasm conductivity of single cells in suspension. Biosens. Bioelectron. 2013, 43C, 304–307. [Google Scholar] [CrossRef] [PubMed]
- Barat, D.; Spencer, D.; Benazzi, G.; Mowlem, M.C.; Morgan, H. Simultaneous high speed optical and impedance analysis of single particles with a microfluidic cytometer. Lab Chip 2012, 12, 118–126. [Google Scholar] [CrossRef] [PubMed]
- Spencer, D.C.; Elliott, G.; Morgan, H. A sheath-less combined optical and impedance micro-cytometer. Lab Chip 2014, 14, 3064–3073. [Google Scholar] [CrossRef] [PubMed]
- Van Berkel, C.; Gwyer, J.D.; Deane, S.; Green, N.G.; Holloway, J.; Hollis, V.; Morgan, H. Integrated systems for rapid point of care (poc) blood cell analysis. Lab Chip 2011, 11, 1249–1255. [Google Scholar] [CrossRef] [PubMed]
- Gawad, S.; Cheung, K.; Seger, U.; Bertsch, A.; Renaud, P. Dielectric spectroscopy in a micromachined flow cytometer: Theoretical and practical considerations. Lab Chip 2004, 4, 241–251. [Google Scholar] [CrossRef] [PubMed]
- Mernier, G.; Piacentini, N.; Tornay, R.; Buffi, N.; Renaud, P. Cell viability assessment by flow cytometry using yeast as cell model. Sens. Actuators B Chem. 2011, 154, 160–163. [Google Scholar] [CrossRef]
- Meissner, R.; Joris, P.; Eker, B.; Bertsch, A.; Renaud, P. A microfluidic-based frequency-multiplexing impedance sensor (fmis). Lab Chip 2012, 12, 2712–2718. [Google Scholar] [CrossRef] [PubMed]
- Mernier, G.; Hasenkamp, W.; Piacentini, N.; Renaud, P. Multiple-frequency impedance measurements in continuous flow for automated evaluation of yeast cell lysis. Sens. Actuators B Chem. 2012, 170, 2–6. [Google Scholar] [CrossRef]
- Shaker, M.; Colella, L.; Caselli, F.; Bisegna, P.; Renaud, P. An impedance-based flow microcytometer for single cell morphology discrimination. Lab Chip 2014, 2014, 2548–2555. [Google Scholar] [CrossRef] [Green Version]
- Choi, H.; Jeon, C.S.; Hwang, I.; Ko, J.; Lee, S.; Choo, J.; Boo, J.-H.; Kim, H.C.; Chung, T.D. A flow cytometry-based submicron-sized bacterial detection system using a movable virtual wall. Lab Chip 2014, 14, 2327–2333. [Google Scholar] [CrossRef] [PubMed]
- Spencer, D.; Morgan, H. Positional dependence of particles in microfludic impedance cytometry. Lab Chip 2011, 11, 1234–1239. [Google Scholar] [CrossRef] [PubMed]
- Shelby, J.P.; White, J.; Ganesan, K.; Rathod, P.K.; Chiu, D.T. A microfluidic model for single-cell capillary obstruction by plasmodium falciparum infected erythrocytes. Proc. Natl. Acad. Sci. USA 2003, 100, 14618–14622. [Google Scholar] [CrossRef] [PubMed]
- Guo, Q.; Reiling, S.J.; Rohrbach, P.; Ma, H. Microfluidic biomechanical assay for red blood cells parasitized by plasmodium falciparum. Lab Chip 2012, 12, 1143–1150. [Google Scholar] [CrossRef] [PubMed]
- Kwan, J.M.; Guo, Q.; Kyluik-Price, D.L.; Ma, H.; Scott, M.D. Microfluidic analysis of cellular deformability of normal and oxidatively damaged red blood cells. Am. J. Hematol. 2013, 88, 682–689. [Google Scholar] [CrossRef] [PubMed]
- Rosenbluth, M.J.; Lam, W.A.; Fletcher, D.A. Analyzing cell mechanics in hematologic diseases with microfluidic biophysical flow cytometry. Lab Chip 2008, 8, 1062–1070. [Google Scholar] [CrossRef] [PubMed]
- Hou, H.W.; Li, Q.S.; Lee, G.Y.H.; Kumar, A.P.; Ong, C.N.; Lim, C.T. Deformability study of breast cancer cells using microfluidics. Biomed. Microdevices 2009, 11, 557–564. [Google Scholar] [CrossRef] [PubMed]
- Byun, S.; Son, S.; Amodei, D.; Cermak, N.; Shaw, J.; Kang, J.H.; Hecht, V.C.; Winslow, M.M.; Jacks, T.; Mallick, P.; et al. Characterizing deformability and surface friction of cancer cells. Proc. Natl. Acad. Sci. USA 2013, 110, 7580–7585. [Google Scholar] [CrossRef] [PubMed]
- Luo, Y.N.; Chen, D.Y.; Zhao, Y.; Wei, C.; Zhao, X.T.; Yue, W.T.; Long, R.; Wang, J.B.; Chen, J. A constriction channel based microfluidic system enabling continuous characterization of cellular instantaneous young’s modulus. Sens. Actuators B Chem. 2014, 202, 1183–1189. [Google Scholar] [CrossRef]
- Zhao, Y.; Chen, D.; Luo, Y.; Li, H.; Deng, B.; Huang, S.-B.; Chiu, T.-K.; Wu, M.-H.; Long, R.; Hu, H.; et al. A microfluidic system for cell type classification based on cellular size-independent electrical properties. Lab Chip 2013, 13, 2272–2277. [Google Scholar] [CrossRef] [PubMed]
- Huang, S.B.; Zhao, Z.; Chen, D.Y.; Lee, H.C.; Luo, Y.N.; Chiu, T.K.; Wang, J.B.; Chen, J.; Wu, M.H. A clogging-free microfluidic platform with an incorporated pneumatically-driven membrane-based active valve enabling specific membrane capacitance and cytoplasm conductivity characterization of single cells. Sens. Actuators B Chem. 2014, 190, 928–936. [Google Scholar] [CrossRef]
- Morgan, H.; Holmes, D.; Green, N.G. High speed simultaneous single particle impedance and fluorescence analysis on a chip. Curr. Appl. Phys. 2006, 6, 367–370. [Google Scholar] [CrossRef]
- Benazzi, G.; Holmes, D.; Sun, T.; Mowlem, M.C.; Morgan, H. Discrimination and analysis of phytoplankton using a microfluidic cytometer. Iet Nanobiotechnol. 2007, 1, 94–101. [Google Scholar] [CrossRef] [PubMed]
- Gawad, S.; Sun, T.; Green, N.G.; Morgan, H. Impedance spectroscopy using maximum length sequences: Application to single cell analysis. Rev. Sci. Instrum. 2007, 78, 054301. [Google Scholar] [CrossRef] [PubMed]
- Holmes, D.; She, J.K.; Roach, P.L.; Morgan, H. Bead-based immunoassays using a micro-chip flow cytometer. Lab Chip 2007, 7, 1048–1056. [Google Scholar] [CrossRef] [PubMed]
- Sun, T.; Gawad, S.; Bernabini, C.; Green, N.G.; Morgan, H. Broadband single cell impedance spectroscopy using maximum length sequences: Theoretical analysis and practical considerations. Meas. Sci. Technol. 2007, 18, 2859–2868. [Google Scholar] [CrossRef]
- Sun, T.; Green, N.G.; Gawad, S.; Morgan, H. Analytical electric field and sensitivity analysis for two microfluidic impedance cytometer designs. Iet Nanobiotechnol. 2007, 1, 69–79. [Google Scholar] [CrossRef] [PubMed]
- Sun, T.; Holmes, D.; Gawad, S.; Green, N.G.; Morgan, H. High speed multi-frequency impedance analysis of single particles in a microfluidic cytometer using maximum length sequences. Lab Chip 2007, 7, 1034–1040. [Google Scholar] [CrossRef] [PubMed]
- Sun, T.; van Berkel, C.; Green, N.G.; Morgan, H. Digital signal processing methods for impedance microfluidic cytometry. Microfluid. Nanofluid. 2009, 6, 179–187. [Google Scholar] [CrossRef]
- Barat, D.; Benazzi, G.; Mowlem, M.C.; Ruano, J.M.; Morgan, H. Design, simulation and characterisation of integrated optics for a microfabricated flow cytometer. Opt. Commun. 2010, 283, 1987–1992. [Google Scholar] [CrossRef]
- Gawad, S.; Holmes, D.; Benazzi, G.; Renaud, P.; Morgan, H. Impedance spectroscopy and optical analysis of single biological cells and organisms in microsystems. Methods Mol. Biol. 2010, 583, 149–182. [Google Scholar] [PubMed]
- Sun, T.; Bernabini, C.; Morgan, H. Single-colloidal particle impedance spectroscopy: Complete equivalent circuit analysis of polyelectrolyte microcapsules. Langmuir 2010, 26, 3821–3828. [Google Scholar] [CrossRef] [PubMed]
- Sun, T.; Swindle, E.J.; Collins, J.E.; Holloway, J.A.; Davies, D.E.; Morgan, H. On-chip epithelial barrier function assays using electrical impedance spectroscopy. Lab Chip 2010, 10, 1611–1617. [Google Scholar] [CrossRef] [PubMed]
- Sun, T.; Tsuda, S.; Zauner, K.P.; Morgan, H. On-chip electrical impedance tomography for imaging biological cells. Biosens. Bioelectron. 2010, 25, 1109–1115. [Google Scholar] [CrossRef] [PubMed]
- Kumar, S.; Kumar, S.; Ali, M.A.; Anand, P.; Agrawal, V.V.; John, R.; Maji, S.; Malhotra, B.D. Microfluidic-integrated biosensors: Prospects for point-of-care diagnostics. Biotechnol. J. 2013, 8, 1267–1279. [Google Scholar] [CrossRef] [PubMed]
- Chin, C.D.; Linder, V.; Sia, S.K. Commercialization of microfluidic point-of-care diagnostic devices. Lab Chip 2012, 12, 2118–2134. [Google Scholar] [CrossRef] [PubMed]
- Kiechle, F.L.; Holland, C.A. Point-of-care testing and molecular diagnostics: Miniaturization required. Clin. Lab. Med. 2009, 29, 555–560. [Google Scholar] [CrossRef] [PubMed]
- Sorger, P.K. Microfluidics closes in on point-of-care assays. Nat. Biotechnol. 2008, 26, 1345–1346. [Google Scholar] [CrossRef] [PubMed]
- Sia, S.K.; Kricka, L.J. Microfluidics and point-of-care testing. Lab Chip 2008, 8, 1982–1983. [Google Scholar] [CrossRef] [PubMed]
- Linder, V. Microfluidics at the crossroad with point-of-care diagnostics. Analyst 2007, 132, 1186–1192. [Google Scholar] [CrossRef] [PubMed]
- Yu, Z.T.; Aw Yong, K.M.; Fu, J. Microfluidic blood cell sorting: Now and beyond. Small 2014, 10, 1687–1703. [Google Scholar] [CrossRef] [PubMed]
- van der Meer, A.D.; Poot, A.A.; Duits, M.H.; Feijen, J.; Vermes, I. Microfluidic technology in vascular research. J. Biomed. Biotechnol. 2009, 2009, 823148. [Google Scholar] [CrossRef] [PubMed]
- Toner, M.; Irimia, D. Blood-on-a-chip. Annu. Rev. Biomed. Eng. 2005, 7, 77–103. [Google Scholar] [CrossRef] [PubMed]
- Hassan, U.; Bashir, R. Electrical cell counting process characterization in a microfluidic impedance cytometer. Biomed. Microdevices 2014, 16, 697–704. [Google Scholar] [CrossRef] [PubMed]
- Hassan, U.; Watkins, N.N.; Edwards, C.; Bashir, R. Flow metering characterization within an electrical cell counting microfluidic device. Lab Chip 2014, 14, 1469–1476. [Google Scholar] [CrossRef] [PubMed]
© 2015 by the authors; licensee MDPI, Basel, Switzerland. This article is an open access article distributed under the terms and conditions of the Creative Commons Attribution license (http://creativecommons.org/licenses/by/4.0/).
Share and Cite
Chen, J.; Xue, C.; Zhao, Y.; Chen, D.; Wu, M.-H.; Wang, J. Microfluidic Impedance Flow Cytometry Enabling High-Throughput Single-Cell Electrical Property Characterization. Int. J. Mol. Sci. 2015, 16, 9804-9830. https://0-doi-org.brum.beds.ac.uk/10.3390/ijms16059804
Chen J, Xue C, Zhao Y, Chen D, Wu M-H, Wang J. Microfluidic Impedance Flow Cytometry Enabling High-Throughput Single-Cell Electrical Property Characterization. International Journal of Molecular Sciences. 2015; 16(5):9804-9830. https://0-doi-org.brum.beds.ac.uk/10.3390/ijms16059804
Chicago/Turabian StyleChen, Jian, Chengcheng Xue, Yang Zhao, Deyong Chen, Min-Hsien Wu, and Junbo Wang. 2015. "Microfluidic Impedance Flow Cytometry Enabling High-Throughput Single-Cell Electrical Property Characterization" International Journal of Molecular Sciences 16, no. 5: 9804-9830. https://0-doi-org.brum.beds.ac.uk/10.3390/ijms16059804