
The CYP51F1 Gene of Leptographium qinlingensis: Sequence Characteristic, Phylogeny and Transcript Levels

Abstract
:
1. Introduction
2. Results
2.1. Identification of the Cytochrome P450 Gene
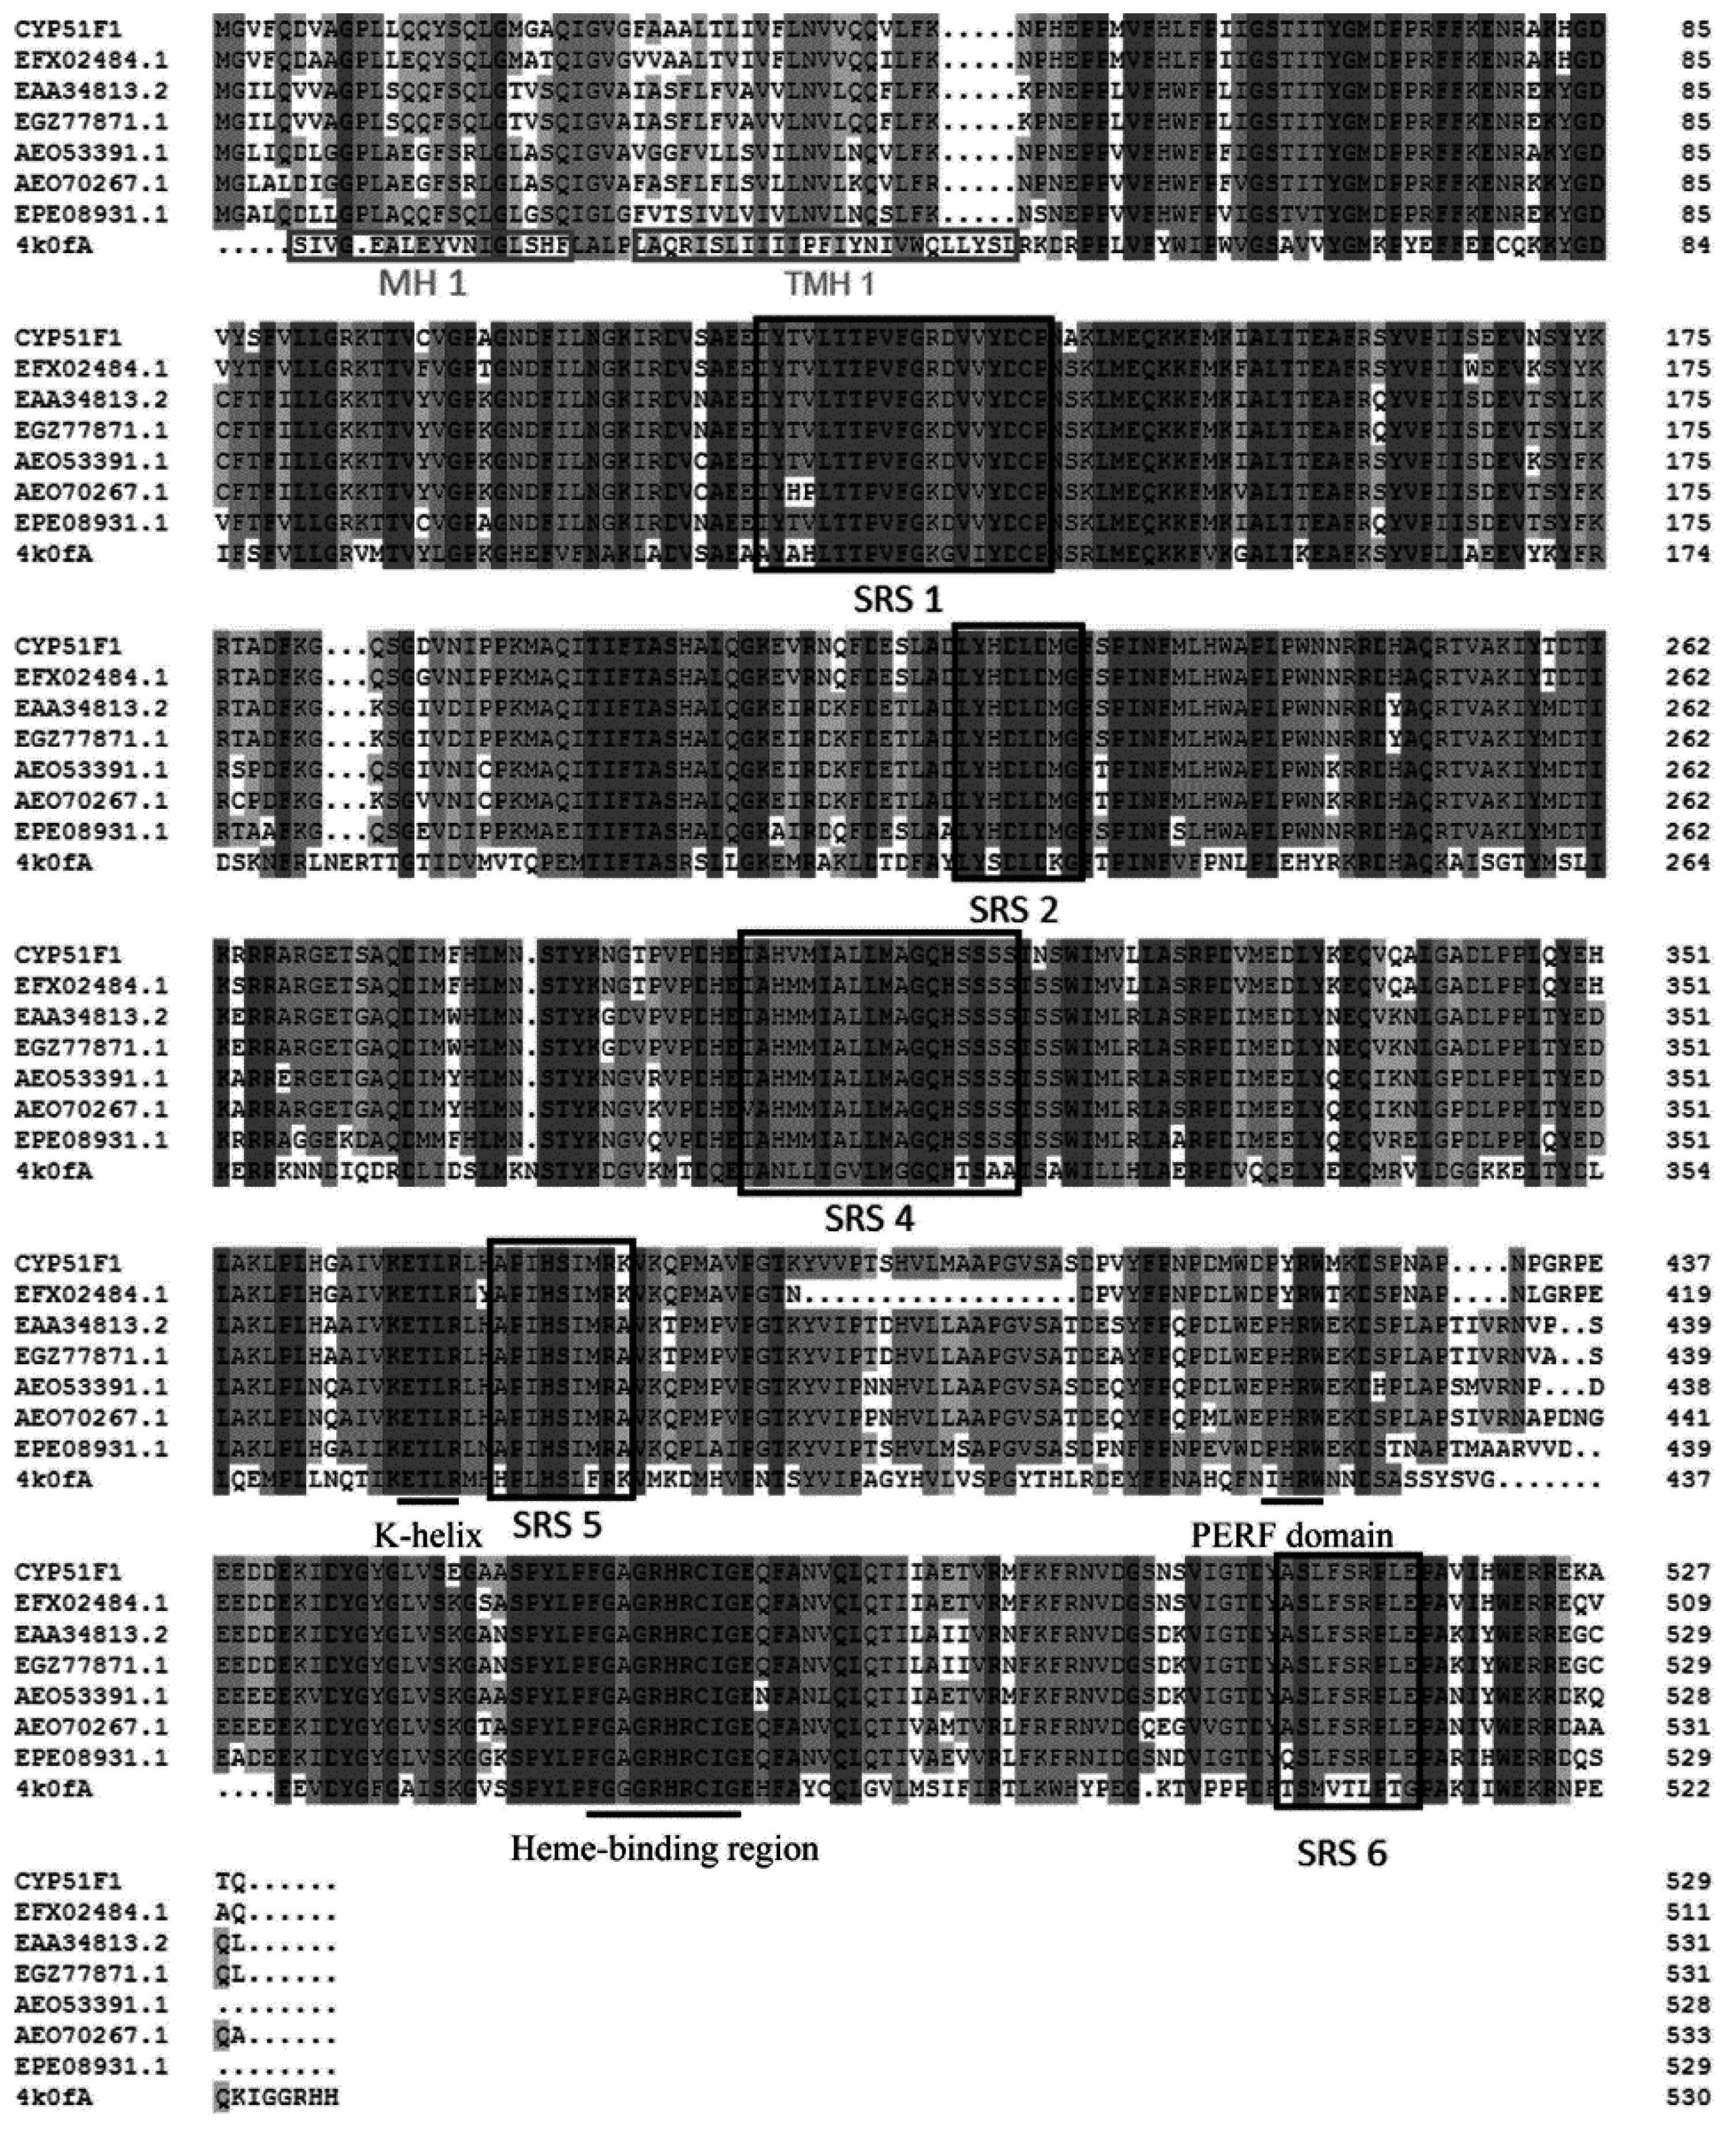
2.2. Physicochemical Properties and Bioinformatics Analysis

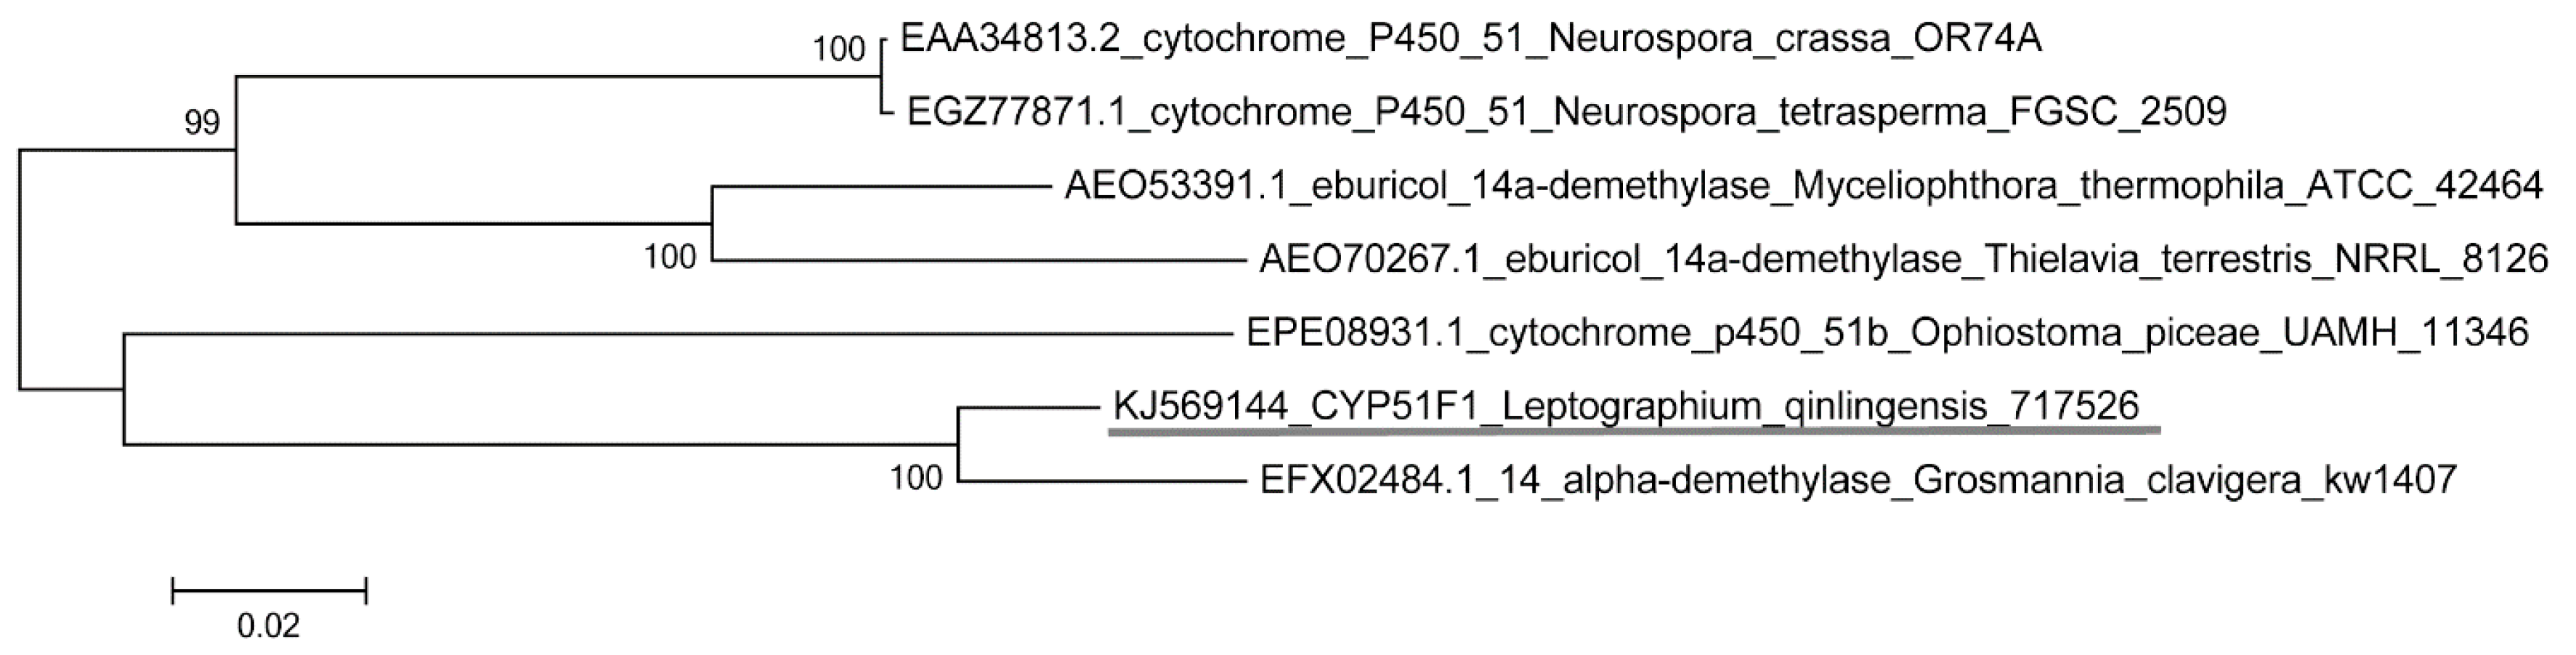
| L. qinlingensis P450 Name | Blast Matches in Gene Bank | Identity % in Partial and Full Length a | Identity % in Full Length b | |||
|---|---|---|---|---|---|---|
| Species | P450 Name | Accession Number | A | B | BlastP | |
| CYP51F1 | Grosmannia clavigera kw1407 | 14 alpha-demethylase | EFX02484.1 | 96.9 | 91.1 | 91 |
| Neurospora crassa OR74A | cytochrome P450 51 | EAA34813.2 | 88.2 | 81.2 | 82 | |
| Neurospora tetrasperma FGSC 2509 | cytochrome P450 51 | EGZ77871.1 | 88.2 | 81.0 | 82 | |
| Myceliophthora thermophila ATCC 42464 | eburicol 14a-demethylase | AEO53391.1 | 87.6 | 79.8 | 80 | |
| Thielavia terrestris NRRL 8126 | eburicol 14a-demethylase | AEO70267.1 | 86.3 | 77.5 | 77 | |
| Ophiostoma piceae UAMH 11346 | cytochrome p450 51b | EPE08931.1 | 87.0 | 80.4 | 81 | |
| P450 Name | Accession No. | Full Length | ORF Size (aa/bp) a | Flanked (bp) | Mw (kDa) a | I.P. a | Signal Peptide Prediction b |
|---|---|---|---|---|---|---|---|
| CYP51F1 | KJ569144 | 1996 bp | 529 aa 1590 bp | 206–200 | 59.31 | 6.82 | SP 0.554 mTP 0.048 other 0.625 |

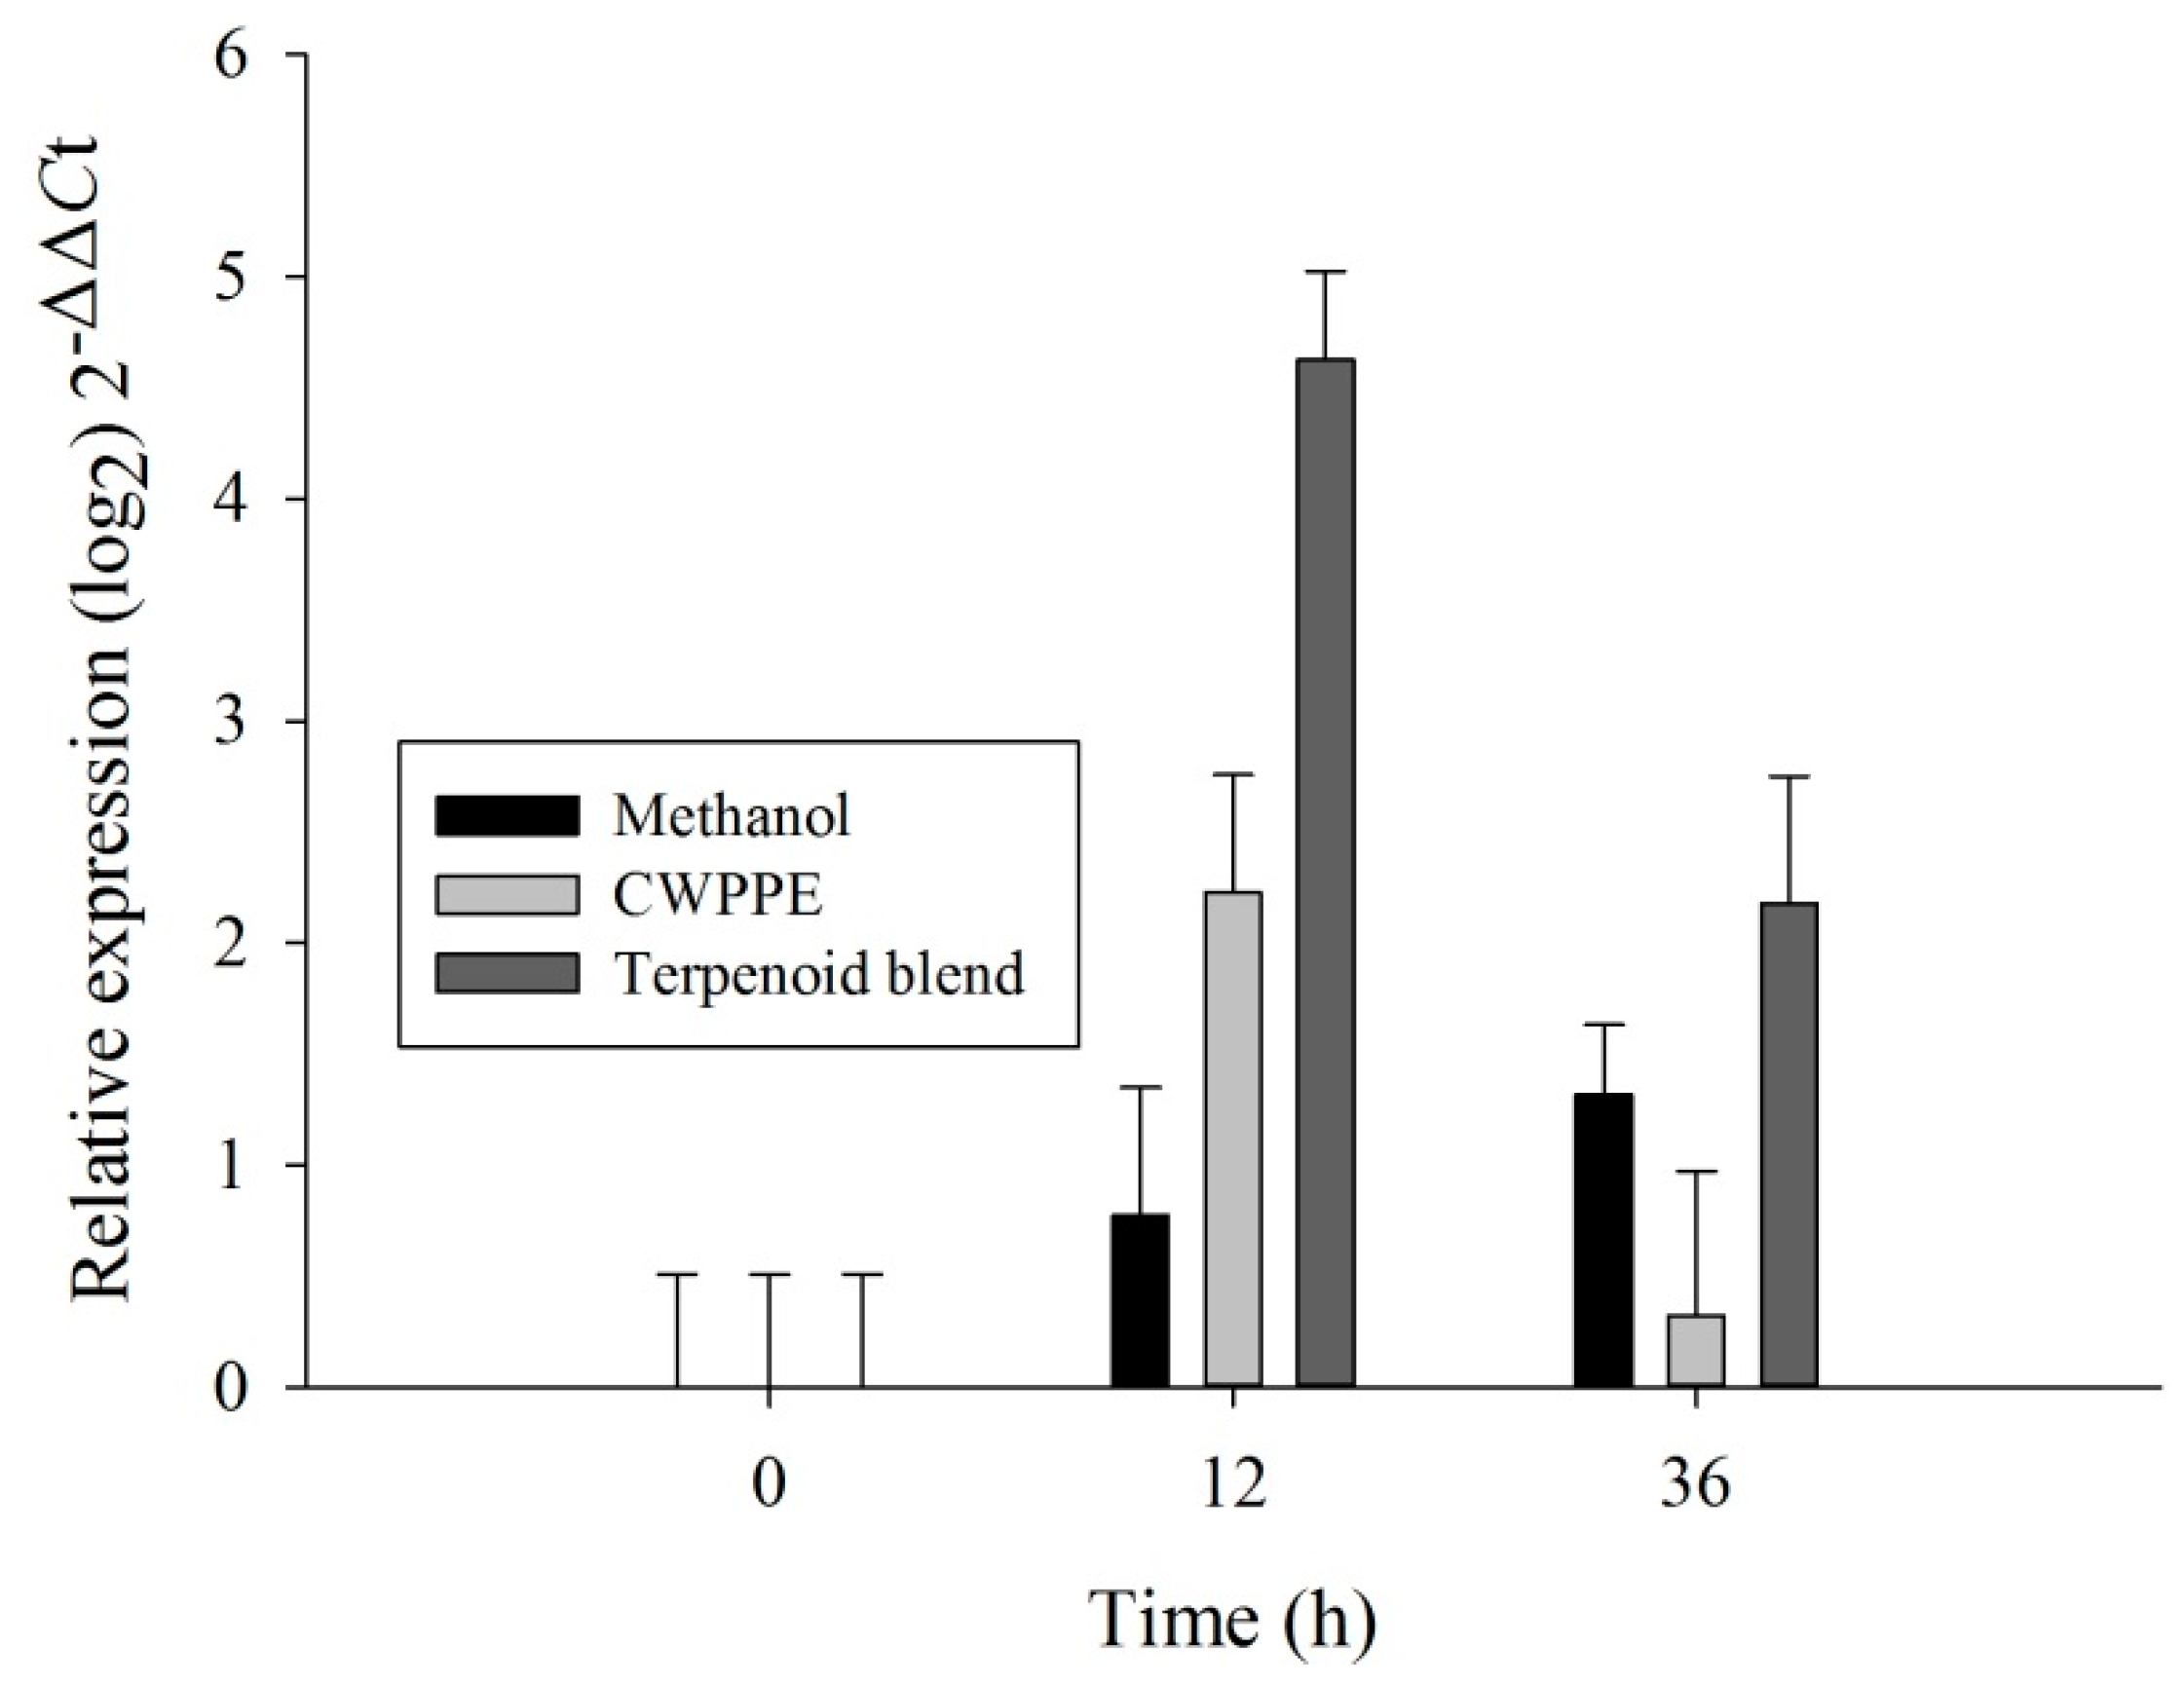
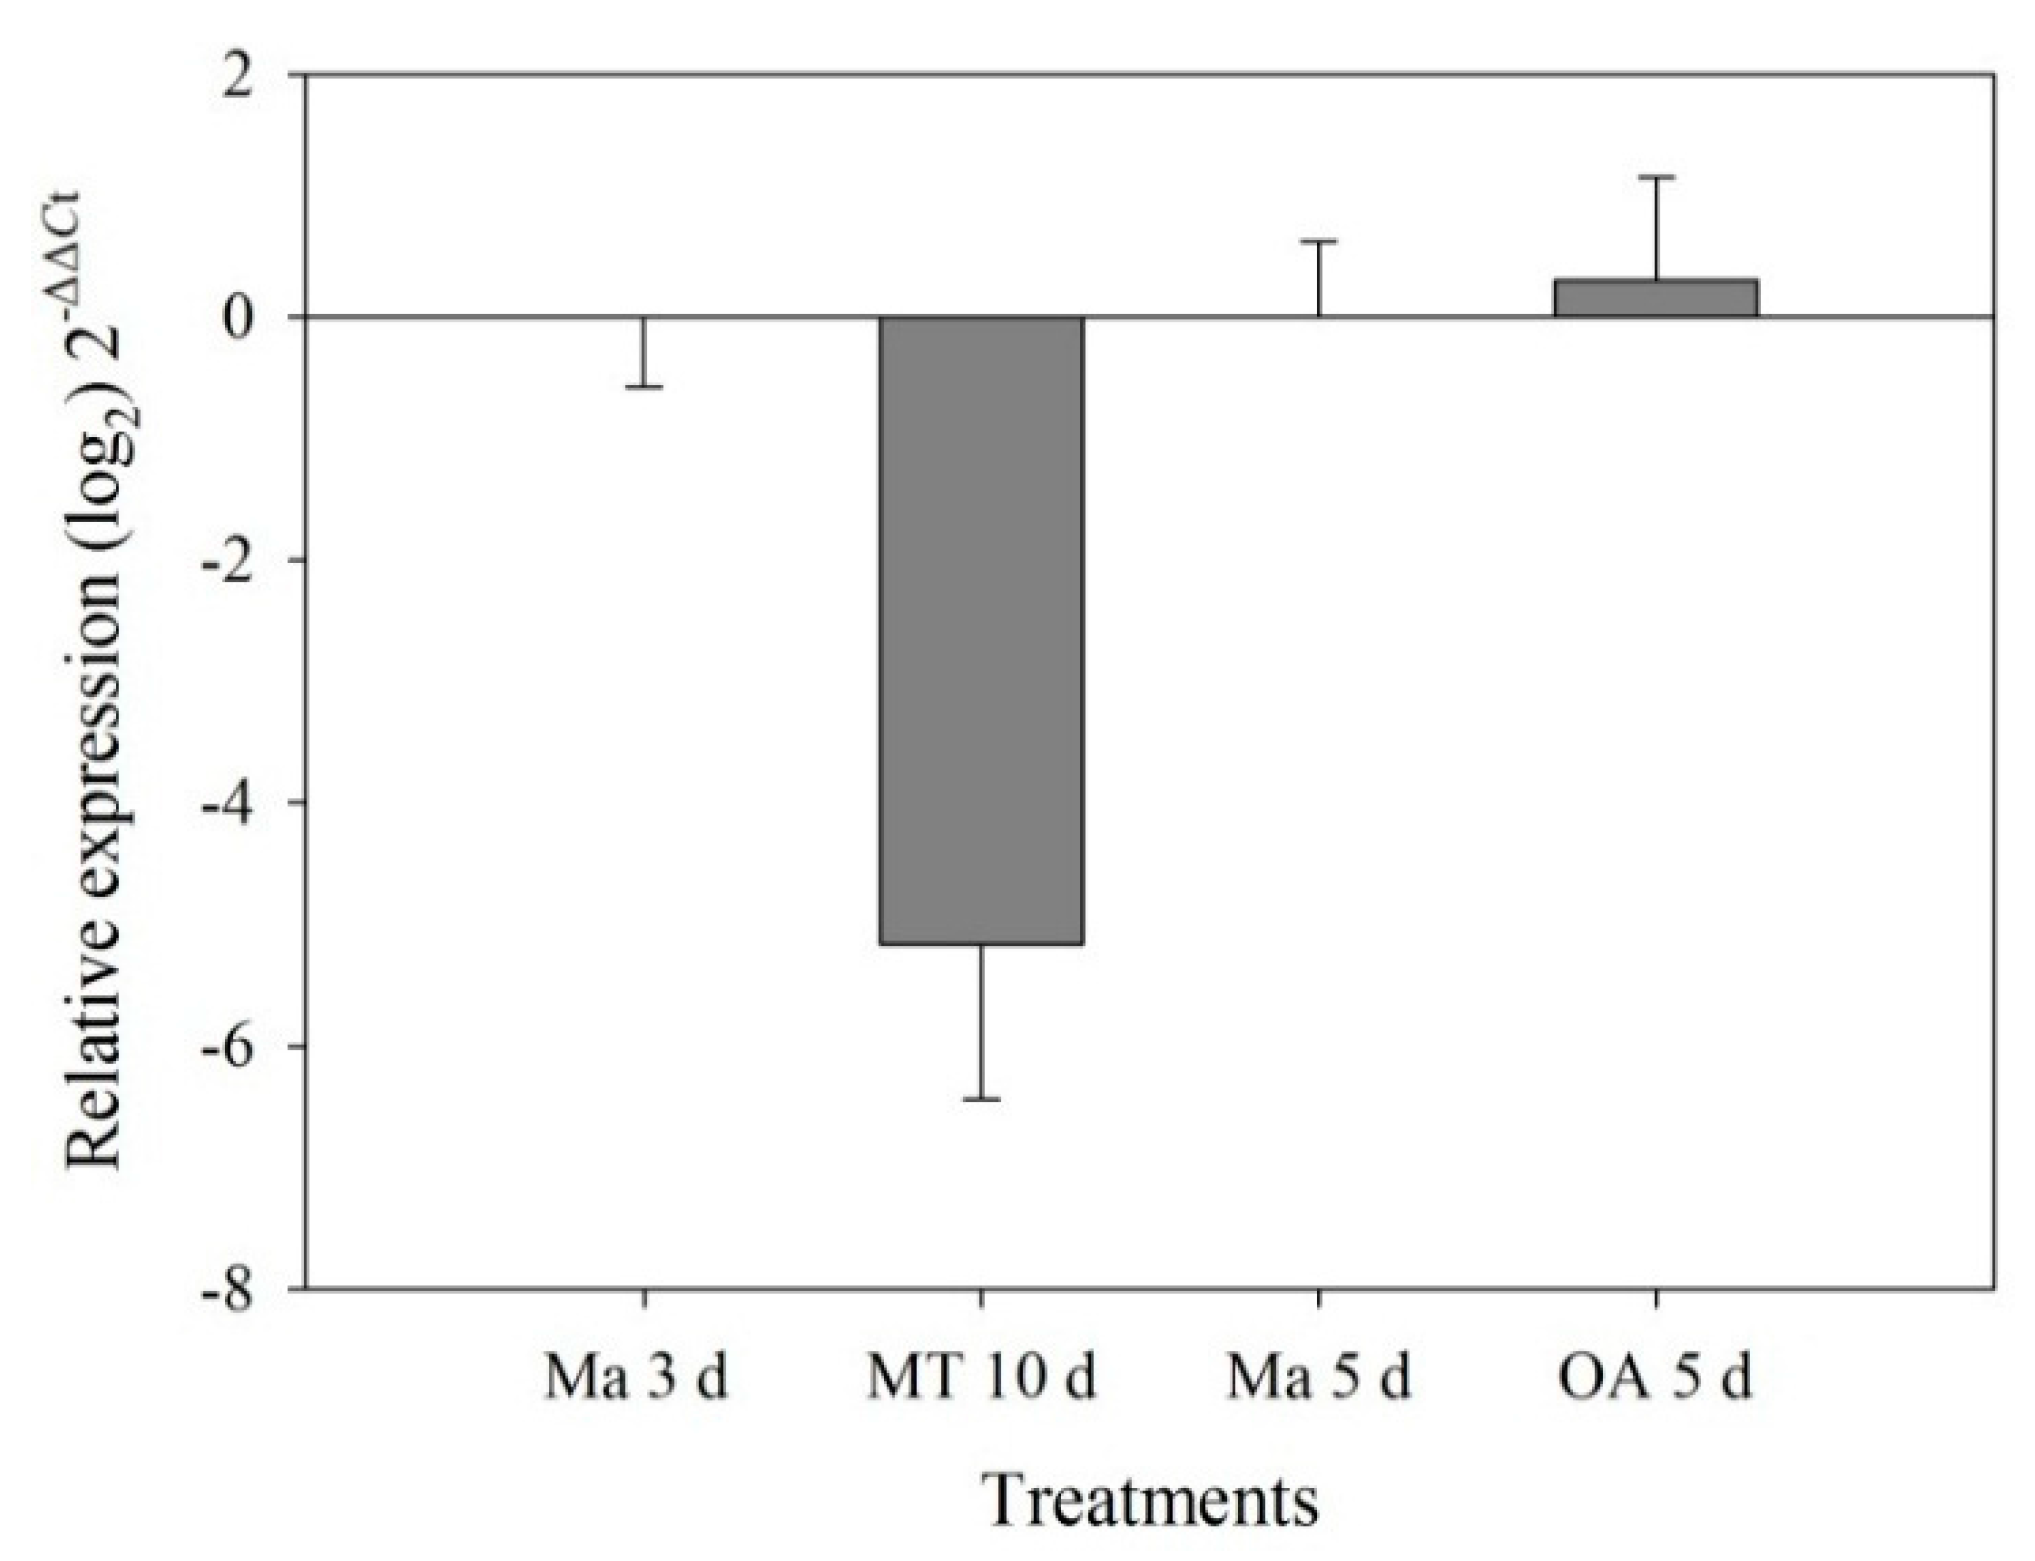
2.3. RT-qPCR


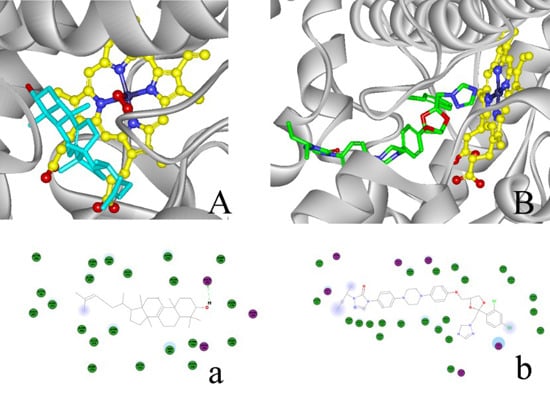
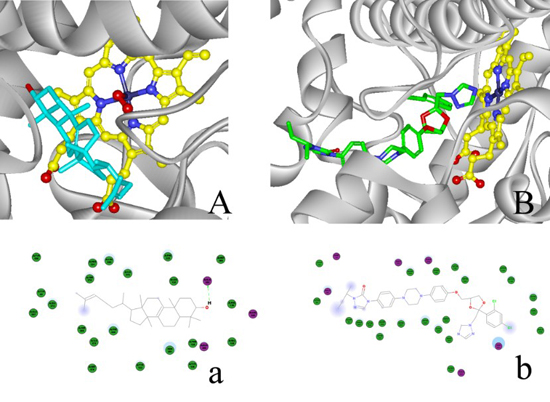
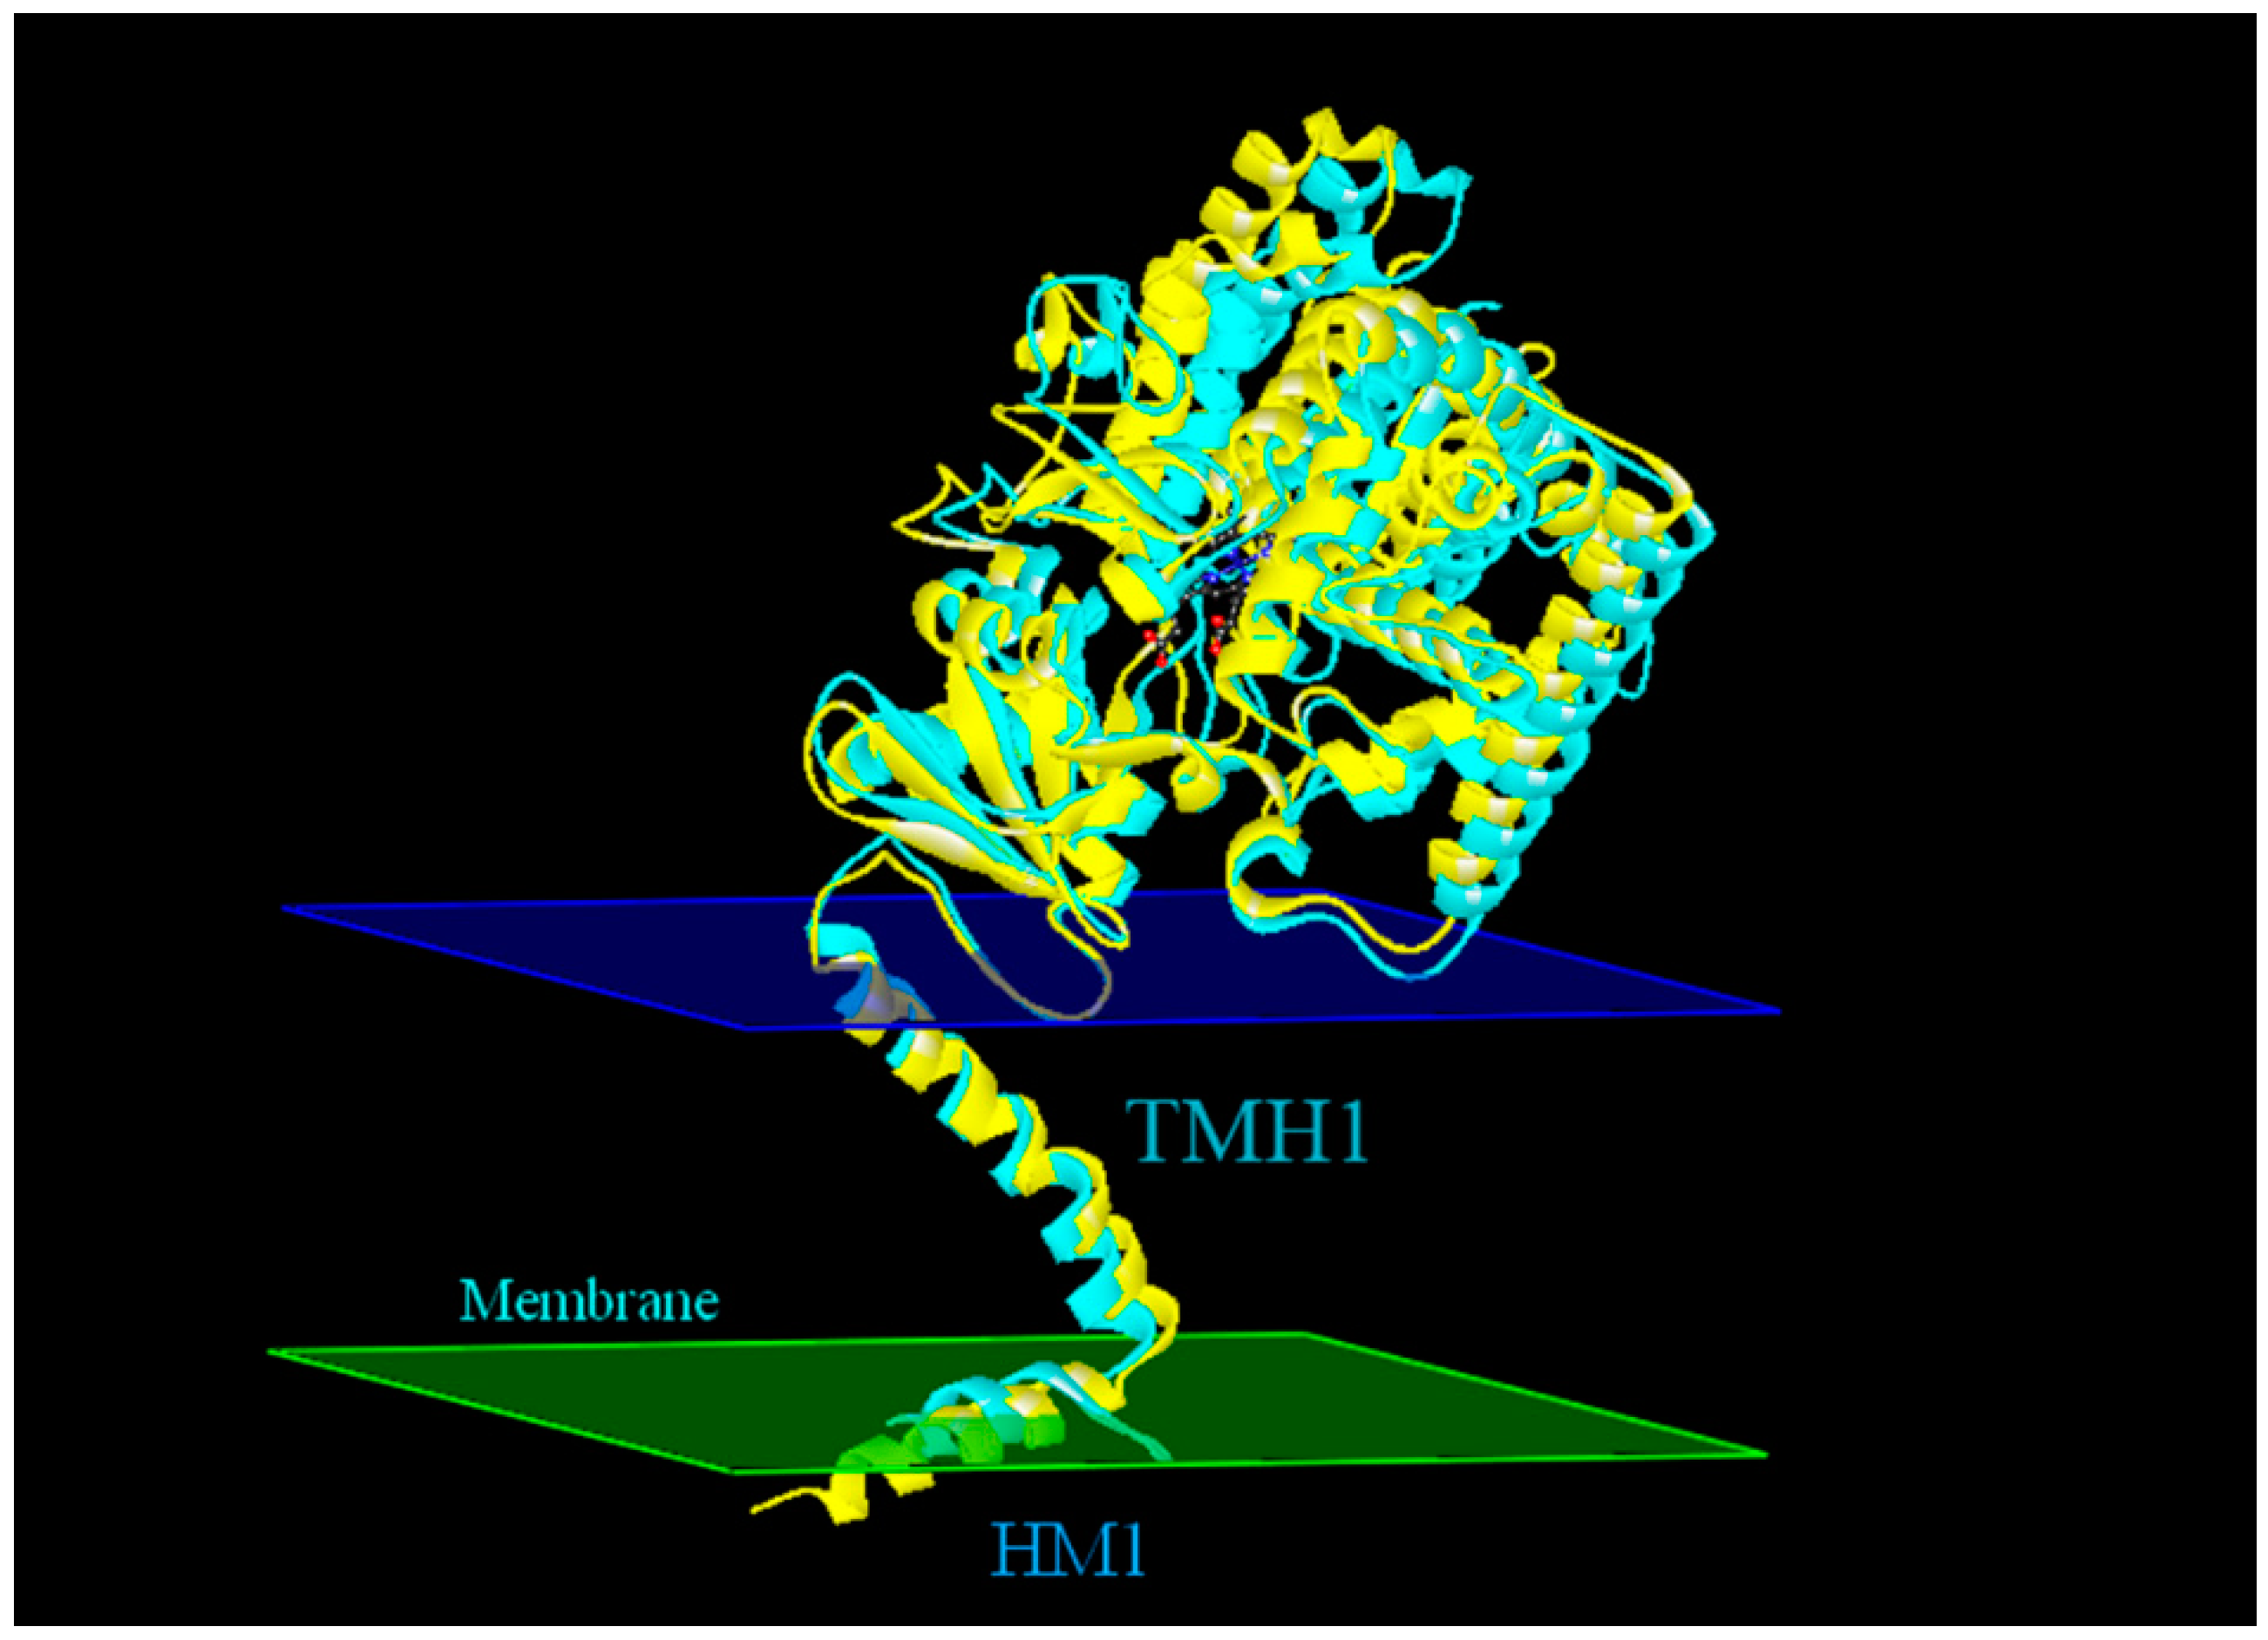
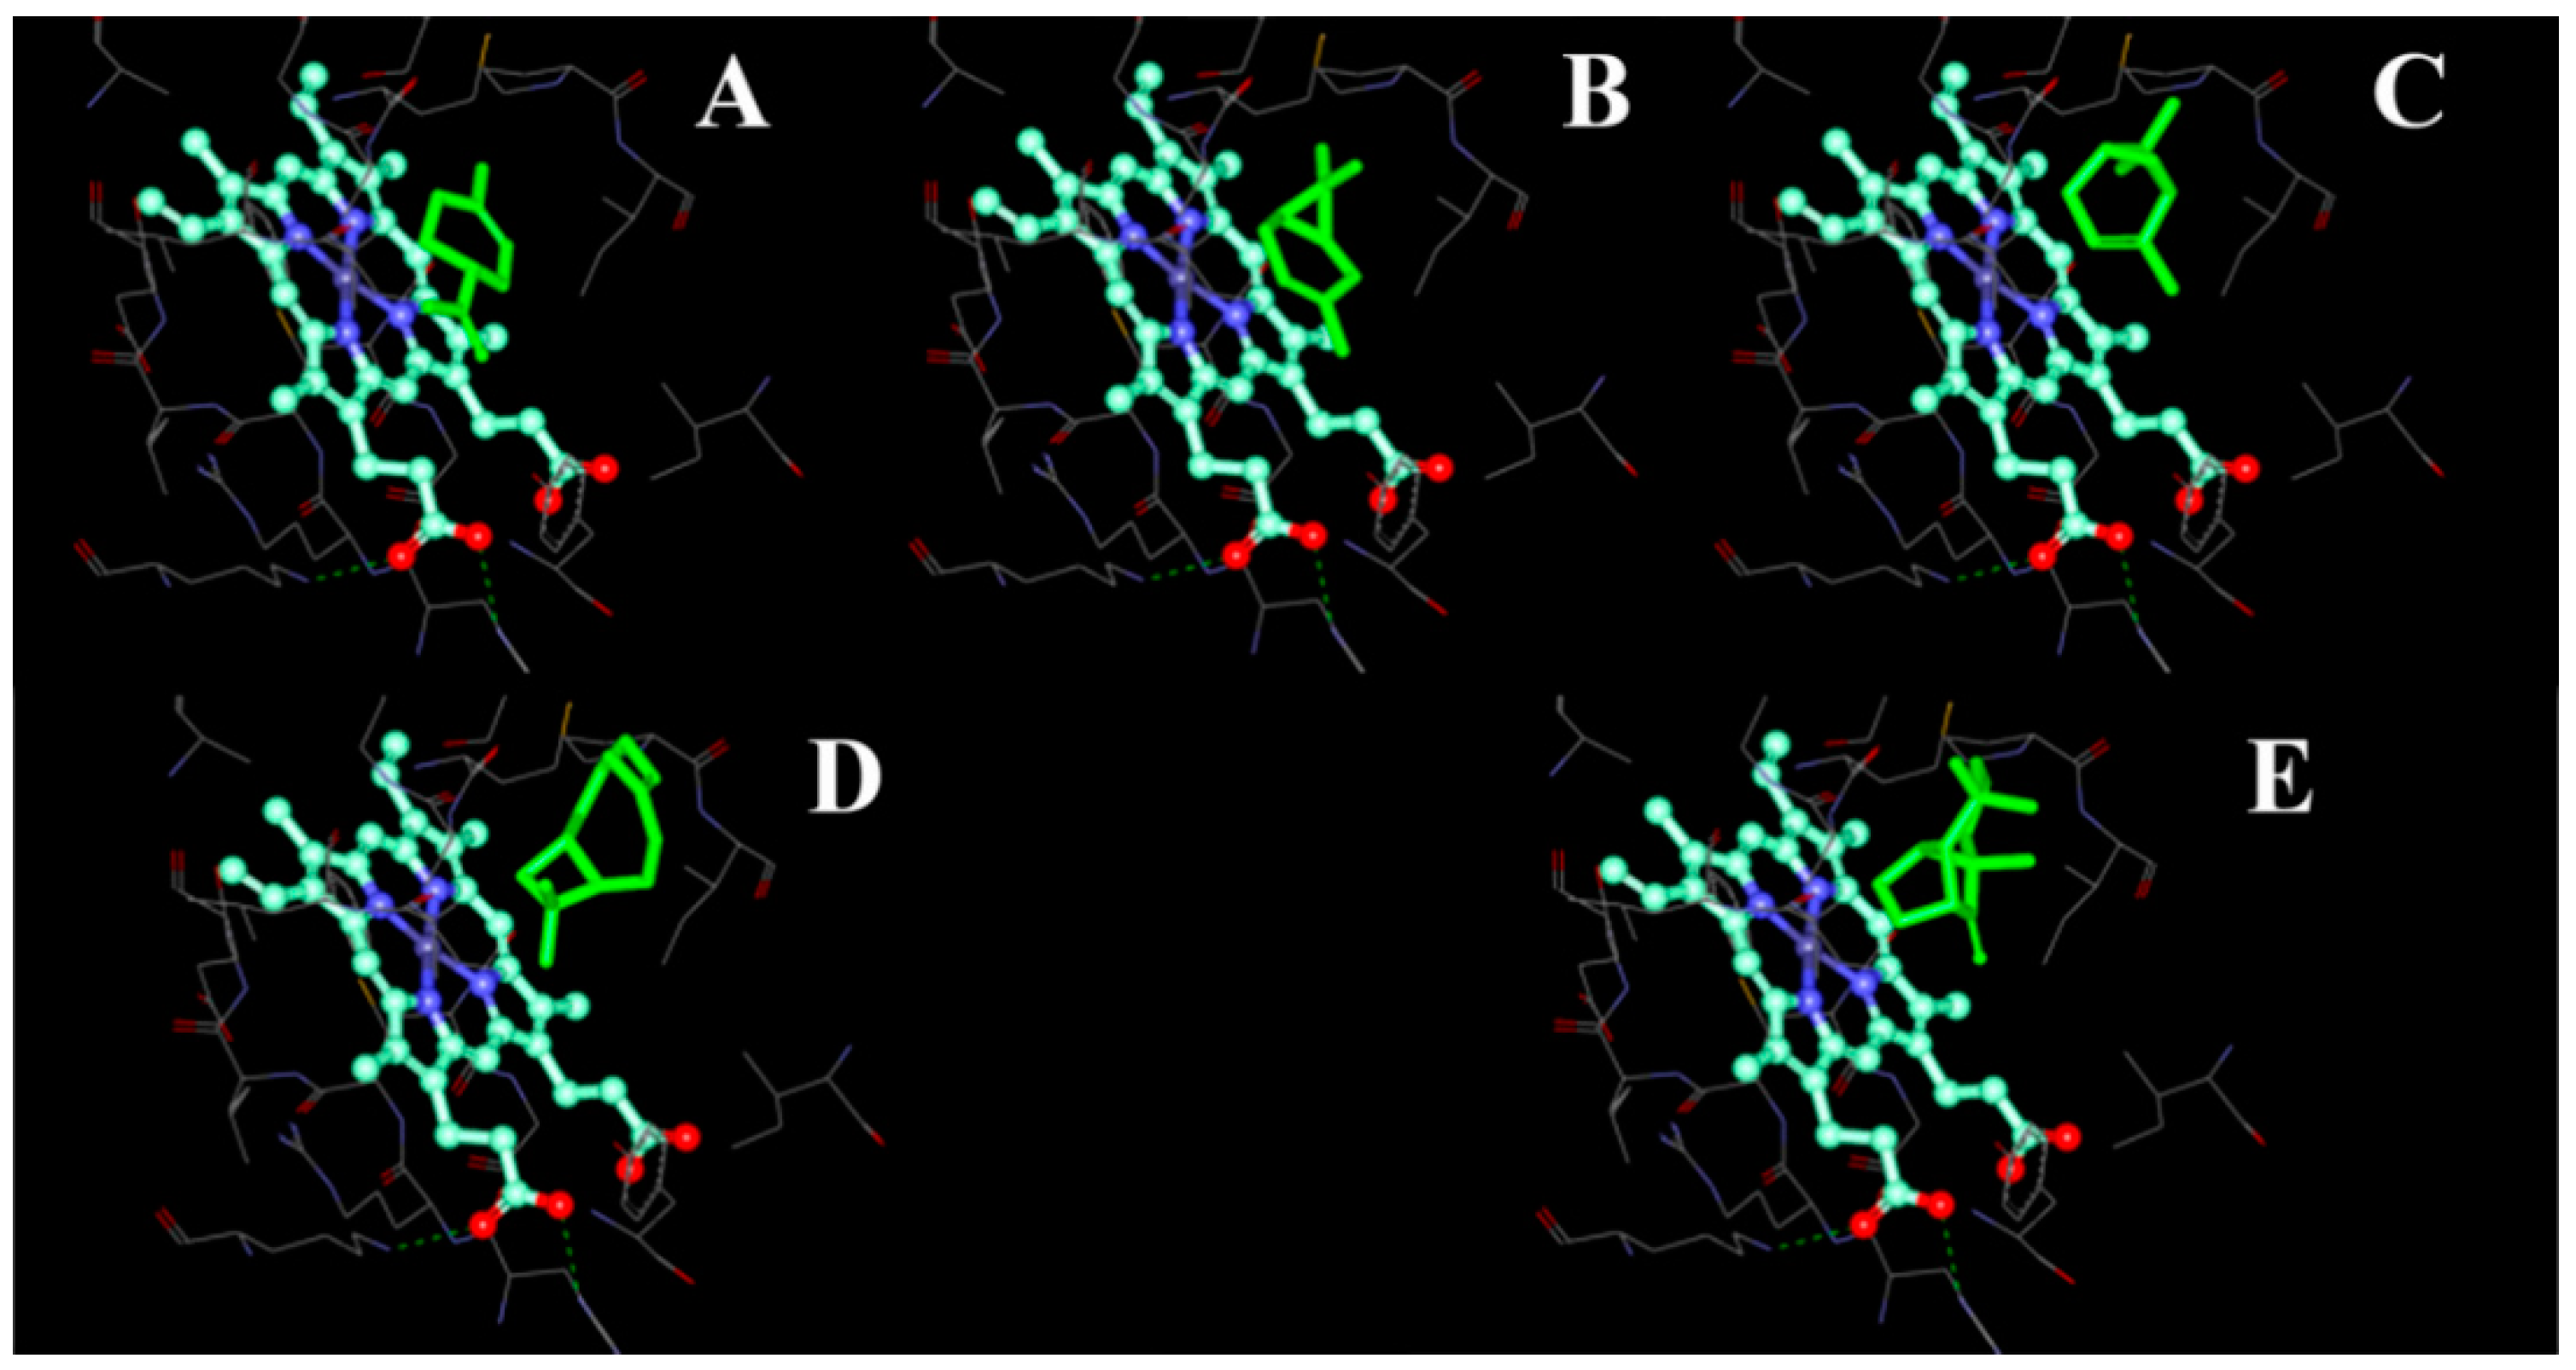
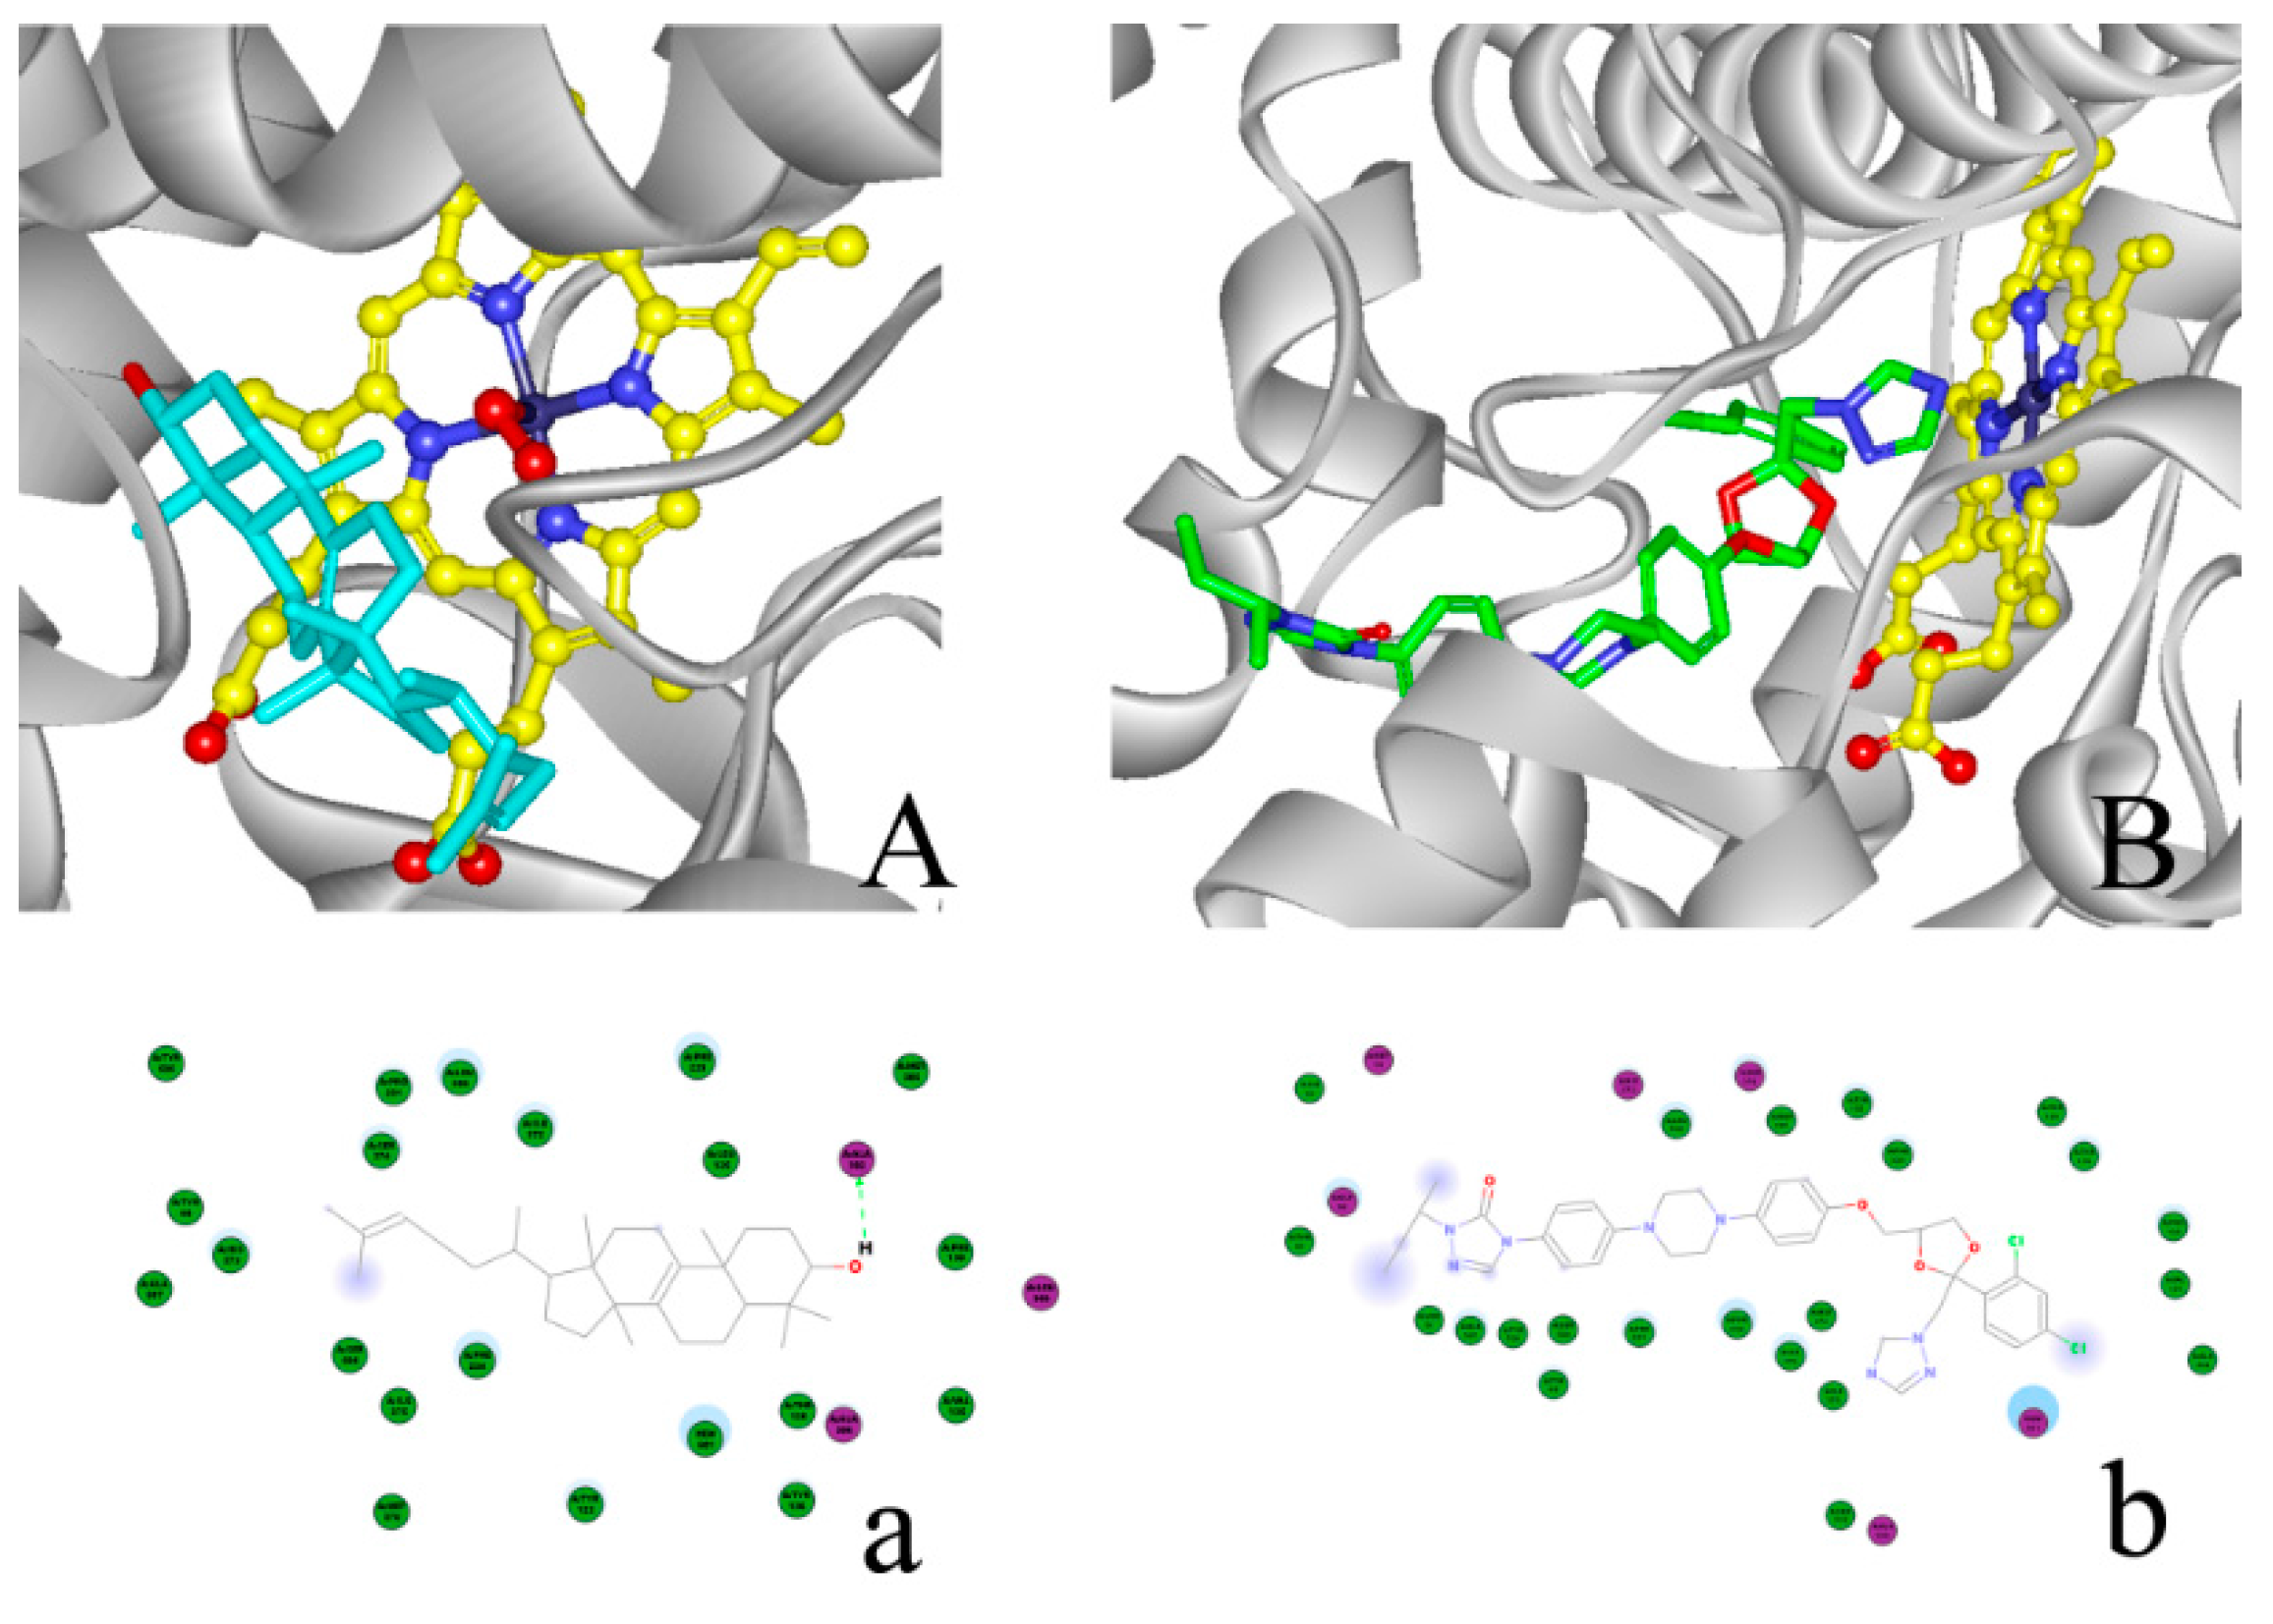
2.4. Modeling Structure of CYP51F1 and Molecule Docking
| Model | Template | Identify % | QMEAN4 a | ERRAT b | VERIFY_3D b % | PROCHECK b % |
|---|---|---|---|---|---|---|
| 1 | 4k0f.1 A | 44.29 | −4.67 | 78.125 | 86.02 | 87.0 |
| 2 | 4lxj.1 A | 44.29 | −5.15 | 77.193 | 84.29 | 88.4 |
| 3 | 3ld6.1 B | 39.77 | −7.74 | 61.290 | 87.34 | 85.7 |
| 4 | 3juv.1 A | 39.77 | −7.62 | 54.310 | 87.97 | 85.7 |


| Molecules | Ligscore1_Dreiding | Ligscore2_Dreiding | -PLP1 | -PLP2 | Jain | -PMF | -PMF04 | Consensus Score |
|---|---|---|---|---|---|---|---|---|
| Limonene | −0.91 | 0.54 | 58.95 | 59.85 | 2.15 | 39.96 | 17.08 | 6 |
| 3-Carene | −0.69 | 0.93 | 53.39 | 54.82 | 1.66 | 42.01 | 19.76 | 4 |
| Pinene | −0.66 | 0.96 | 44.28 | 47.31 | 3.36 | 20.88 | 6.1 | 3 |
| β-Caryophyllene | −4.37 | −5.11 | 61.84 | 64.42 | 3.77 | 41.38 | 3.55 | 4 |
| Longifolene | −3.37 | −3.54 | 57.63 | 62.2 | 4.62 | 36.29 | 7.93 | 4 |

2.5. MIC (Minimal Inhibitory Concentrations) of the Azole Fungicide and Monoterpenes
| (A) | |||||||||||||||||
| Fungicide | Concentration (μg/mL) | Control | |||||||||||||||
| 4 | 2 | 1 | 1/2 | 1/4 | 1/8 | 1/16 | 1/32 | 0 | |||||||||
| ITC | − | − | − | − | − | + | + | + | + | − | |||||||
| − | − | − | − | − | + | + | + | + | − | ||||||||
| − | − | − | − | − | + | + | + | + | − | ||||||||
| − | − | − | − | − | + | + | + | + | − | ||||||||
| − | − | − | − | − | + | + | + | + | − | ||||||||
| Epoxiconazole | − | − | − | − | + | + | + | + | + | − | |||||||
| − | − | − | − | + | + | + | + | + | − | ||||||||
| − | − | − | − | + | + | + | + | + | − | ||||||||
| − | − | − | − | + | + | + | + | + | − | ||||||||
| − | − | − | − | + | + | + | + | + | − | ||||||||
| (B) | |||||||||||||||||
| Monoterpenes a | Concentration (μL/mL) | Control | |||||||||||||||
| 20 | 50 | 100 | 150 | 200 | 0 | ||||||||||||
| Number of Colonies | 72 | 43 | 65 | 54 | 20 | >150 | >150 | ||||||||||
| 81 | 73 | 56 | 22 | 7 | >150 | >150 | |||||||||||
| 52 | 49 | 53 | 47 | 12 | >150 | >150 | |||||||||||
| Total | 205 | 163 | 174 | 123 | 39 | >450 | >450 | ||||||||||
3. Discussion
4. Experimental Section
4.1. Strains
4.2. Fungal Media and Growth Conditions
4.3. Obtaining the CYP51 Gene
4.3.1. RNA Isolation and cDNA Synthesis
4.3.2. Amplification of Genes, Cloning and Sequence Analyses
4.3.3. End Sequence Determination and Cloning of Full-Length cDNAs
4.3.4. Analysis of the Full-Length Cytochrome P450 Sequence
4.4. Real-Time Fluorescent Quantitative PCR
4.4.1. Treatments for RT-qPCR
4.4.2. RNA Isolation and cDNA Synthesis for Expression Analyses
4.4.3. RT-qPCR
4.4.4. Reference Gene Validation Experiment
4.4.5. Statistical Analysis
4.5. Protein Structure and Ligand Docking
4.5.1. Homology Modeling
4.5.2. Protein-Ligand Interaction Study
4.6. Determination of the MIC of Terpenoid and Azole Fungicides
5. Conclusions
Supplementary Materials
Acknowledgments
Author Contributions
Conflicts of Interest
References
- Paine, T.D.; Raffa, K.F.; Harrington, T.C. Interactions among scolytid bark beetles, their associated fungi, and live host conifers. Annu. Rev. Entomol. 1997, 42, 179–206. [Google Scholar] [CrossRef] [PubMed]
- Johnson, M.A.; Croteau, R. Biochemistry of conifer resistance to bark beetles and their fungal symbionts. In ACS Symposium Series No. 325: Ecology and Metabolism of Plant Lipids; Fuller, G., Nes, W.D., Eds.; American Chemical Society: Washington, DC, USA, 1987; pp. 76–92. [Google Scholar]
- Whitney, H.S. Relationships between bark beetles and symbiotic organisms. In Bark Beetles in North American Conifers; Mitton, J.B., Sturgeon, K.B., Eds.; University of Texas: Austin, TX, USA, 1982; pp. 183–211. [Google Scholar]
- Tang, M.; Chen, H. Effect of symbiotic fungi of Dendroctonus armandi on host trees. Sci. Silvae Sin. 1999, 35, 63–66. [Google Scholar]
- Chen, H.; Tang, M.; Zhu, C.J.; Hu, J.J. The enzymes in the secretions of Dendroctonus armandi (Scolytidae) and their symbiotic fungus of Leptographium qinlingensis. Sci. Silvae Sin. 2004, 40, 123–126. [Google Scholar]
- Chen, H.; Tang, M. Spatial and temporal dynamics of bark beetles in Chinese white pine in Qinling Mountains of Shaanxi Province, China. Environ. Entomol. 2007, 36, 1124–1130. [Google Scholar] [CrossRef] [PubMed]
- Chen, H.; Tang, M. Microstructure of blue-stain fungi (Leptographium terebrantis) associated with Dendroctonus. armandi in the xylem tissue of Pinus armandi. Acta Bot. Boreal. Occident. Sin. 2002, 22, 1391–1395. [Google Scholar]
- Pu, X.J.; Chen, H.; Wang, S.J. Influences of Leptographium qinglingensis on metabolism of Pinus armandi. J. Northwest. For. Univ. 2008, 23, 109–112. [Google Scholar]
- Li, X.J.; Gao, J.M.; Chen, H.; Zhang, A.L.; Tang, M. Toxins from a symbiotic fungus, Leptographium qinlingensis associated with Dendroctonus armandi and their in vitro toxicities to Pinus armandi seedling. Eur. J. Plant Pathol. 2012, 134, 239–247. [Google Scholar] [CrossRef]
- Pham, T.; Chen, H.; Yu, J.; Dai, L.; Zhang, R.; Trang Vu, T.Q. The Differential effects of the blue-stain fungus Leptographium qinlingensis on monoterpenes and sesquiterpenes in the stem of Chinese white pine (Pinus armandi) saplings. Forests 2014, 5, 2730–2749. [Google Scholar] [CrossRef]
- Lee, S.; Kim, J.; Breuil, C. Pathogenicity of a new species associated with mountain pine beetle (Dendroctonus ponderosae). Can. J. Plant Pathol. 2005, 27, 154. [Google Scholar]
- Lee, S.; Kim, J.J.; Breuil, C. Pathogenicity of Leptographium longiclavatum associated with Dendroctonus ponderosae to Pinus contorta. Can. J. Res. 2006, 36, 2864–2872. [Google Scholar] [CrossRef]
- DiGuistini, S.; Wang, Y.; Liao, N.Y.; Taylor, G.; Tanguay, P.; Feau, N.; Henrissat, B.; Chan, S.K.; Hesse-Orce, U.; Alamouti, S.M.; et al. Genome and transcriptome analyses of the mountain pine beetle-fungal symbiont Grosmannia clavigera, a lodgepole pine pathogen. Proc. Natl. Acad. Sci. USA 2011, 108, 2504–2509. [Google Scholar] [CrossRef] [PubMed]
- Lah, L.; Haridas, S.; Bohlmann, J.; Breuil, C. The cytochromes P450 of Grosmannia clavigera: Genome organization, phylogeny, and expression in response to pine host chemicals. Fungal Genet. Biol. 2013, 50, 72–81. [Google Scholar] [CrossRef] [PubMed]
- Kelly, S.L.; Lamb, D.C.; Cannieux, M.; Greetham, D.; Jackson, C.J.; Marczylo, T.; Ugochukwu, C.; Kelly, D.E. An old activity in the cytochrome P450 superfamily (CYP51) and a new story of drugs and resistance. Biochem. Soc. Trans. 2001, 29, 122–128. [Google Scholar] [CrossRef] [PubMed]
- Cresnar, B.; Petric, S. Cytochrome P450 enzymes in the fungal kingdom. BBA Proteins Proteomics 2011, 1814, 29–35. [Google Scholar] [CrossRef] [PubMed]
- Becher, R.; Wirsel, S.G.R. Fungal cytochrome P450 sterol 14α-demethylase (CYP51) and azole resistance in plant and human pathogens. Appl. Microbiol. Biotechnol. 2012, 95, 825–840. [Google Scholar] [CrossRef] [PubMed]
- Lepesheva, G.I.; Waterman, M.R. Sterol 14alpha-demethylase cytochrome P450 (CYP51), a P450 in all biological kingdoms. Biochim. Biophys. Acta Gen. Subj. 2007, 1770, 467–477. [Google Scholar] [CrossRef] [PubMed]
- Lamb, D.; Kelly, D.; Kelly, S. Molecular aspects of azole antifungal action and resistance. Drug Resist. Update 1999, 2, 390–402. [Google Scholar] [CrossRef] [PubMed]
- Lepesheva, G.I.; Hargrove, T.Y.; Kleshchenko, Y.; Nes, W.D.; Villalta, F.; Waterman, M.R. CYP51: A major drug target in the cytochrome P450 superfamily. Lipids 2008, 43, 1117–1125. [Google Scholar] [CrossRef] [PubMed]
- Warrilow, A.G.S.; Hull, C.M.; Rolley, N.J.; Parker, J.E.; Nes, W.D.; Smith, S.N.; Kelly, D.E.; Kelly, S.L. Clotrimazole as a potent agent for treating the Oomycete fish pathogen Saprolegnia parasitica through inhibition of sterol 14 alpha-demethylase (CYP51). Appl. Environ. Microb. 2014, 80, 6154–6166. [Google Scholar]
- Campanella, J.J.; Bitincka, L.; Smalley, J. MatGAT: An application that generates similarity/identity matrices using protein or DNA sequences. BMC Bioinform. 2003, 4, 29. [Google Scholar] [CrossRef] [PubMed] [Green Version]
- Altschul, S.F.; Gish, W.; Miller, W.; Myers, E.W.; Lipman, D.J. Basic local alignment search tool. J. Mol. Biol. 1990, 215, 403–410. [Google Scholar] [CrossRef]
- Gasteiger, E.; Hoogland, C.; Gattiker, A.; Duvaud, S.; Wilkins, M.R.; Appel, R.D.; Bairoch, A.; Walker, J.M. Protein identification and analysis tools on the ExPASy server. In The Proteomics Protocols Handbook; Walker, J.M., Ed.; Humana Press: New Jersey, NJ, USA, 2005; pp. 571–607. [Google Scholar]
- Emanuelsson, O.; Nielsen, H.; Brunak, S.; von Heijne, G. Predicting subcellular localization of proteins based on their N-terminal amino acid sequence. J. Mol. Biol. 2000, 300, 1005–1016. [Google Scholar] [CrossRef] [PubMed]
- Hesse-Orce, U.; DiGuistini, S.; Keeling, C.I.; Wang, Y.; Li, M.; Henderson, H.; Docking, T.R.; Liao, N.Y.; Robertson, G.; Holt, R.A.; et al. Gene discovery for the bark beetle-vectored fungal tree pathogen Grosmannia clavigera. BMC Genomics 2010, 11, 536. [Google Scholar] [CrossRef] [PubMed]
- Aoyama, Y.; Noshiro, M.; Gotoh, O.; Imaoka, S.; Funae, Y.; Kurosawa, N.; Horiuchi, T.; Yoshida, Y. Sterol 14-demethylase P450 (P45014DM*) is one of the most ancient and conserved P450 species. J. Biochem. 1996, 119, 926–933. [Google Scholar] [CrossRef] [PubMed]
- Werck-Reichhart, D.; Feyereisen, R. Cytochromes P450: A success story. Genome Biol. 2000, 1, REVIEWS3003. [Google Scholar] [CrossRef] [PubMed]
- Tsui, C.K.M.; Roe, A.D.; El-Kassaby, Y.A.; Rice, A.V.; Alamouti, S.M.; Sperling, F.A.H.; Cooke, J.E.; Bohlmann, J.; Hamelin, R.C. Population structure and migration pattern of a conifer pathogen, Grosmannia clavigera, as influenced by its symbiont, the mountain pine beetle. Mol. Ecol. 2012, 21, 71–86. [Google Scholar] [CrossRef] [PubMed]
- Khoshraftar, S.; Hung, S.; Khan, S.; Gong, Y.; Tyagi, V.; Parkinson, J.; Sain, M.; Moses, A.M.; Christendat, D. Sequencing and annotation of the Ophiostoma ulmi genome. BMC Genomics 2013, 14, 162. [Google Scholar] [CrossRef] [PubMed]
- Comeau, A.M.; Dufour, J.; Bouvet, G.F.; Jacobi, V.; Nigg, M.; Henrissat, B.; Laroche, J.; Levesque, R.C.; Bernier, L. Functional annotation of the ophiostoma novo-ulmi genome: Insights into the phytopathogenicity of the fungal agent of dutch elm disease. Genome Biol. Evol. 2014, 7, 410–430. [Google Scholar] [CrossRef] [PubMed]
- Van der Nest, M.A.; Bihon, W.; de Vos, L.; Naidoo, K.; Roodt, D.; Rubagotti, E.; Slippers, B.; Steenkamp, E.T.; Wilken, P.M.; Wilson, A.; et al. Draft genome sequences of Diplodia sapinea, Ceratocystis manginecans, and Ceratocystis moniliformis. IMA Fungus 2014, 5, 135–140. [Google Scholar] [CrossRef] [PubMed]
- Monk, B.C.; Goffeau, A. Outwitting multidrug resistance to antifungals. Science 2008, 321, 367–369. [Google Scholar] [CrossRef] [PubMed]
- Podust, L.M.; Poulos, T.L.; Waterman, M.R. Crystal structure of cytochrome P450 14 alpha-sterol demethylase (CYP51) from Mycobacterium tuberculosis in complex with azole inhibitors. Proc. Natl. Acad. Sci. USA 2001, 98, 3068–3073. [Google Scholar] [CrossRef] [PubMed]
- Daum, G.; Lees, N.D.; Bard, M.; Dickson, R. Biochemistry, cell biology and molecular biology of lipids of Saccharomyces cerevisiae. Yeast 1998, 14, 1471–1510. [Google Scholar] [CrossRef]
- Vanden Bossche, H.; Lauwers, W.; Willemsens, G.; Marichal, P.; Cornelissen, F.; Cools, W. Molecular-basis for the antimycotic and antibacterial activity of N-substituted imidazoles and triazoles—The inhibition of isoprenoid biosynthesis. Pestic. Sci. 1984, 15, 188–198. [Google Scholar]
- Vanden Bossche, H. Biochemical targets for antifungal azole derivatives: Hypothesis on the mode of action. Curr. Top. Med. Mycol. 1985, 1, 313–351. [Google Scholar] [PubMed]
- De Nollin, S.; Van Belle, H.; Goossens, F.; Thone, F.; Borgers, M. Cytochemical and biochemical studies of yeasts after in vitro exposure to miconazole. Antimicrob. Agents Chemother. 1977, 11, 500–513. [Google Scholar] [CrossRef]
- Shimokawa, O.; Nakayama, H. Increased sensitivity of candida albicans cells accumulating 14-alpha-methylated sterols to active oxygen—Possible relevance to in vivo efficacies of azole antifungal agents. Antimicrob. Agents Chemother. 1992, 36, 1626–1629. [Google Scholar] [CrossRef] [PubMed]
- Chen, C.K.; Leung, S.S.F.; Guilbert, C.; Jacobson, M.P.; McKerrow, J.H.; Podust, L.M. Structural characterization of CYP51 from Trypanosoma cruzi and Trypanosoma. brucei bound to the antifungal drugs posaconazole and fluconazole. PLoS Negl. Trop. D 2010, 4, e651. [Google Scholar] [CrossRef] [PubMed]
- Monk, B.C.; Tomasiak, T.M.; Keniya, M.V.; Huschmann, F.U.; Tyndall, J.D.A.; O’Connell, J.D.; Cannon, R.D.; McDonald, J.G.; Rodriguez, A.; Finer-Moore, J.S.; et al. Architecture of a single membrane spanning cytochrome P450 suggests constraints that orient the catalytic domain relative to a bilayer. Proc. Natl. Acad. Sci. USA 2014, 111, 3865–3870. [Google Scholar] [CrossRef] [PubMed]
- Thompson, J.D.; Gibson, T.J.; Plewniak, F.; Jeanmougin, F.; Higgins, D.G. The CLUSTAL X windows interface flexible strategies for multiple sequence alignment aided by quality analysis tools. Nucleic Acids Res. 1997, 25, 4876–4882. [Google Scholar] [CrossRef] [PubMed]
- Tamura, K.; Peterson, D.; Peterson, N.; Stecher, G.; Nei, M.; Kumar, S. MEGA5: Molecular evolutionary genetics analysis using maximum likelihood, evolutionary distance, and maximum parsimony methods. Mol. Biol. Evol. 2011, 28, 2731–2739. [Google Scholar] [CrossRef] [PubMed]
- Vandesompele, J.; de Preter, K.; Pattyn, F.; Poppe, B.; van Roy, N.; de Paepe, A.; Speleman, F. Accurate normalization of real-time quantitative RT-PCR data by geometric averaging of multiple internal control genes. Genome Biol. 2002, 3, RESEARCH0034. [Google Scholar] [CrossRef] [PubMed] [Green Version]
- Livak, K.J.; Schmittgen, T.D. Analyzing real-time PCR data by the comparative CT method. Nat. Protoc. 2008, 3, 1101–1108. [Google Scholar]
- Kiefer, F.; Arnold, K.; Künzli, M.; Bordoli, L.; Schwede, T. The SWISS-MODEL repository and associated resources. Nucleic Acids Res. 2009, 37, D387–D392. [Google Scholar] [CrossRef] [PubMed]
- Colovos, C.; Yeates, T.O. Verification of protein structures: Patterns of nonbonded atomic interactions. Protein Sci. 1993, 2, 1511–1519. [Google Scholar] [CrossRef] [PubMed]
- Lüthy, R.; Bowie, J.U.; Eisenberg, D. Assessment of protein models with three-dimensional profiles. Nature 1992, 356, 83–85. [Google Scholar] [CrossRef] [PubMed]
- Laskowski, R.A.; MacArthur, M.W.; Moss, D.S.; Thornton, J.M. PROCHECK: A program to check the stereochemical quality of protein structures. J. Appl. Crystallogr. 1993, 26, 283–291. [Google Scholar] [CrossRef]
- Rao, S.N.; Head, M.S.; Kulkarni, A.; LaLonde, J.M. Validation studies of the site-directed docking program LibDock. J. Chem. Inf. Model. 2007, 47, 2159–2171. [Google Scholar] [CrossRef] [PubMed]
- Venkatachalam, C.M.; Jiang, X.; Oldfield, T.; Waldman, M. LigandFit: A novel method for the shape-directed rapid docking of ligands to protein active sites. J. Mol. Graph. Model. 2003, 21, 289–307. [Google Scholar] [CrossRef]
© 2015 by the authors; licensee MDPI, Basel, Switzerland. This article is an open access article distributed under the terms and conditions of the Creative Commons Attribution license (http://creativecommons.org/licenses/by/4.0/).
Share and Cite
Dai, L.; Li, Z.; Yu, J.; Ma, M.; Zhang, R.; Chen, H.; Pham, T. The CYP51F1 Gene of Leptographium qinlingensis: Sequence Characteristic, Phylogeny and Transcript Levels. Int. J. Mol. Sci. 2015, 16, 12014-12034. https://0-doi-org.brum.beds.ac.uk/10.3390/ijms160612014
Dai L, Li Z, Yu J, Ma M, Zhang R, Chen H, Pham T. The CYP51F1 Gene of Leptographium qinlingensis: Sequence Characteristic, Phylogeny and Transcript Levels. International Journal of Molecular Sciences. 2015; 16(6):12014-12034. https://0-doi-org.brum.beds.ac.uk/10.3390/ijms160612014
Chicago/Turabian StyleDai, Lulu, Zhumei Li, Jiamin Yu, Mingyuan Ma, Ranran Zhang, Hui Chen, and Thanh Pham. 2015. "The CYP51F1 Gene of Leptographium qinlingensis: Sequence Characteristic, Phylogeny and Transcript Levels" International Journal of Molecular Sciences 16, no. 6: 12014-12034. https://0-doi-org.brum.beds.ac.uk/10.3390/ijms160612014