Article

Transcriptional Profiling of Hydrogen Production Metabolism of Rhodobacter capsulatus under Temperature Stress by Microarray Analysis

1
Department of Biological Sciences, Middle East Technical University, Ankara 06800, Turkey
2
Micro-Electro-Mechanical Systems, Middle East Technical University, Ankara 06800, Turkey
3
Department of Chemical Engineering, Middle East Technical University, Ankara 06800, Turkey
*
Author to whom correspondence should be addressed.
Int. J. Mol. Sci. 2015, 16(6), 13781-13797; https://0-doi-org.brum.beds.ac.uk/10.3390/ijms160613781
Submission received: 30 March 2015 / Accepted: 9 June 2015 / Published: 16 June 2015
(This article belongs to the Special Issue Photosynthesis and Biological Hydrogen Production)

Abstract

:
Biohydrogen is a clean and renewable form of hydrogen, which can be produced by photosynthetic bacteria in outdoor large-scale photobioreactors using sunlight. In this study, the transcriptional response of Rhodobacter capsulatus to cold (4 °C) and heat (42 °C) stress was studied using microarrays. Bacteria were grown in 30/2 acetate/glutamate medium at 30 °C for 48 h under continuous illumination. Then, cold and heat stresses were applied for two and six hours. Growth and hydrogen production were impaired under both stress conditions. Microarray chips for R. capsulatus were custom designed by Affymetrix (GeneChip®. TR_RCH2a520699F). The numbers of significantly changed genes were 328 and 293 out of 3685 genes under cold and heat stress, respectively. Our results indicate that temperature stress greatly affects the hydrogen production metabolisms of R. capsulatus. Specifically, the expression of genes that participate in nitrogen metabolism, photosynthesis and the electron transport system were induced by cold stress, while decreased by heat stress. Heat stress also resulted in down regulation of genes related to cell envelope, transporter and binding proteins. Transcriptome analysis and physiological results were consistent with each other. The results presented here may aid clarification of the genetic mechanisms for hydrogen production in purple non-sulfur (PNS) bacteria under temperature stress.

1. Introduction

The increasing demand for energy leads to search for alternative energy sources. Hydrogen is a renewable and environmentally safe alternative to fossil fuels, which cause global warming. The ability to employ microorganisms that can use of a variety of renewable substrates make biological hydrogen production a primary choice for the generation of hydrogen.
Purple non-sulfur (PNS) bacteria can produce hydrogen from the degradation of organic substrates under an anaerobic atmosphere and nitrogen limiting conditions using light energy via the nitrogenase enzyme [1,2]. The Gram-negative PNS bacterium R. capsulatus has long been studied for its versatile metabolism, nitrogen fixation and hydrogen production. Moreover, this bacterium is suitable for biochemical and genetic approaches since it can be easily mutated by standard procedures [3].
Since hydrogen production in PNS bacteria is catalyzed by nitrogenase, and thus an enzymatic reaction, it is affected by temperature. The optimum temperature range for hydrogen production by Rhodobacter species is between 31–36 °C [4]. Accordingly, Androga et al. [5] determined that the highest hydrogen productivity of R. capsulatus was at 30 °C. Furthermore, the expression of nitrogenase activator nifA gene decreased compared to 30 °C when the temperature was 20 and 38 °C [6]. Özgür et al. [7] studied the effect of fluctuating temperatures on hydrogen production of an R. capsulatus hup mutant in outdoor photobioreactors. They showed a decrease in hydrogen production in daily fluctuations of temperature (15–40 °C) and light/dark cycle. Lack of temperature and light intensity control are the major challenges for the operation of photobioreactors in outdoor conditions. Androga et al. [8] investigated the factors affecting hydrogen production of R. capsulatus hup strain under outdoor conditions and showed the decrease in hydrogen yield during the winter (October–December) in Ankara, Turkey where night temperatures were less than 5 °C. Avcioğlu et al. [9] reported that the temperature in the four-liter outdoor photobioreactor could increase above 45 °C, causing decrease of hydrogen productivity and yield. They concluded that hydrogen production under natural sunlight was affected greatly by seasonal variations in temperature and suggested that the temperature should not exceed 38 °C in outdoor photobioreactors.
Temperature extremes in outdoor photobioreactor operations may cause stress on the microorganism damaging membrane components, proteins and nucleic acids; which may result in lag phase increase, growth rate reduction, or even death [10].
Understanding genetic regulations under temperature stress may help to genetically engineer the bacteria to increase hydrogen yield in large-scale industrial photobioreactors. DNA microarrays are powerful tools for genome-wide expression analysis. Microarray analysis provides a detailed insight into cellular processes by simultaneously monitoring expression levels of thousands of genes [11]. In this study, a custom designed Affymetrix GeneChip®. TR_RCH2a520699F (GEO accession number GPL1860) for R. capsulatus DSM1710 was constructed. The effects of temperature stress on the hydrogen production metabolism of R. capsulatus were investigated at the transcriptome level and reported here for the first time.

2. Results and Discussion

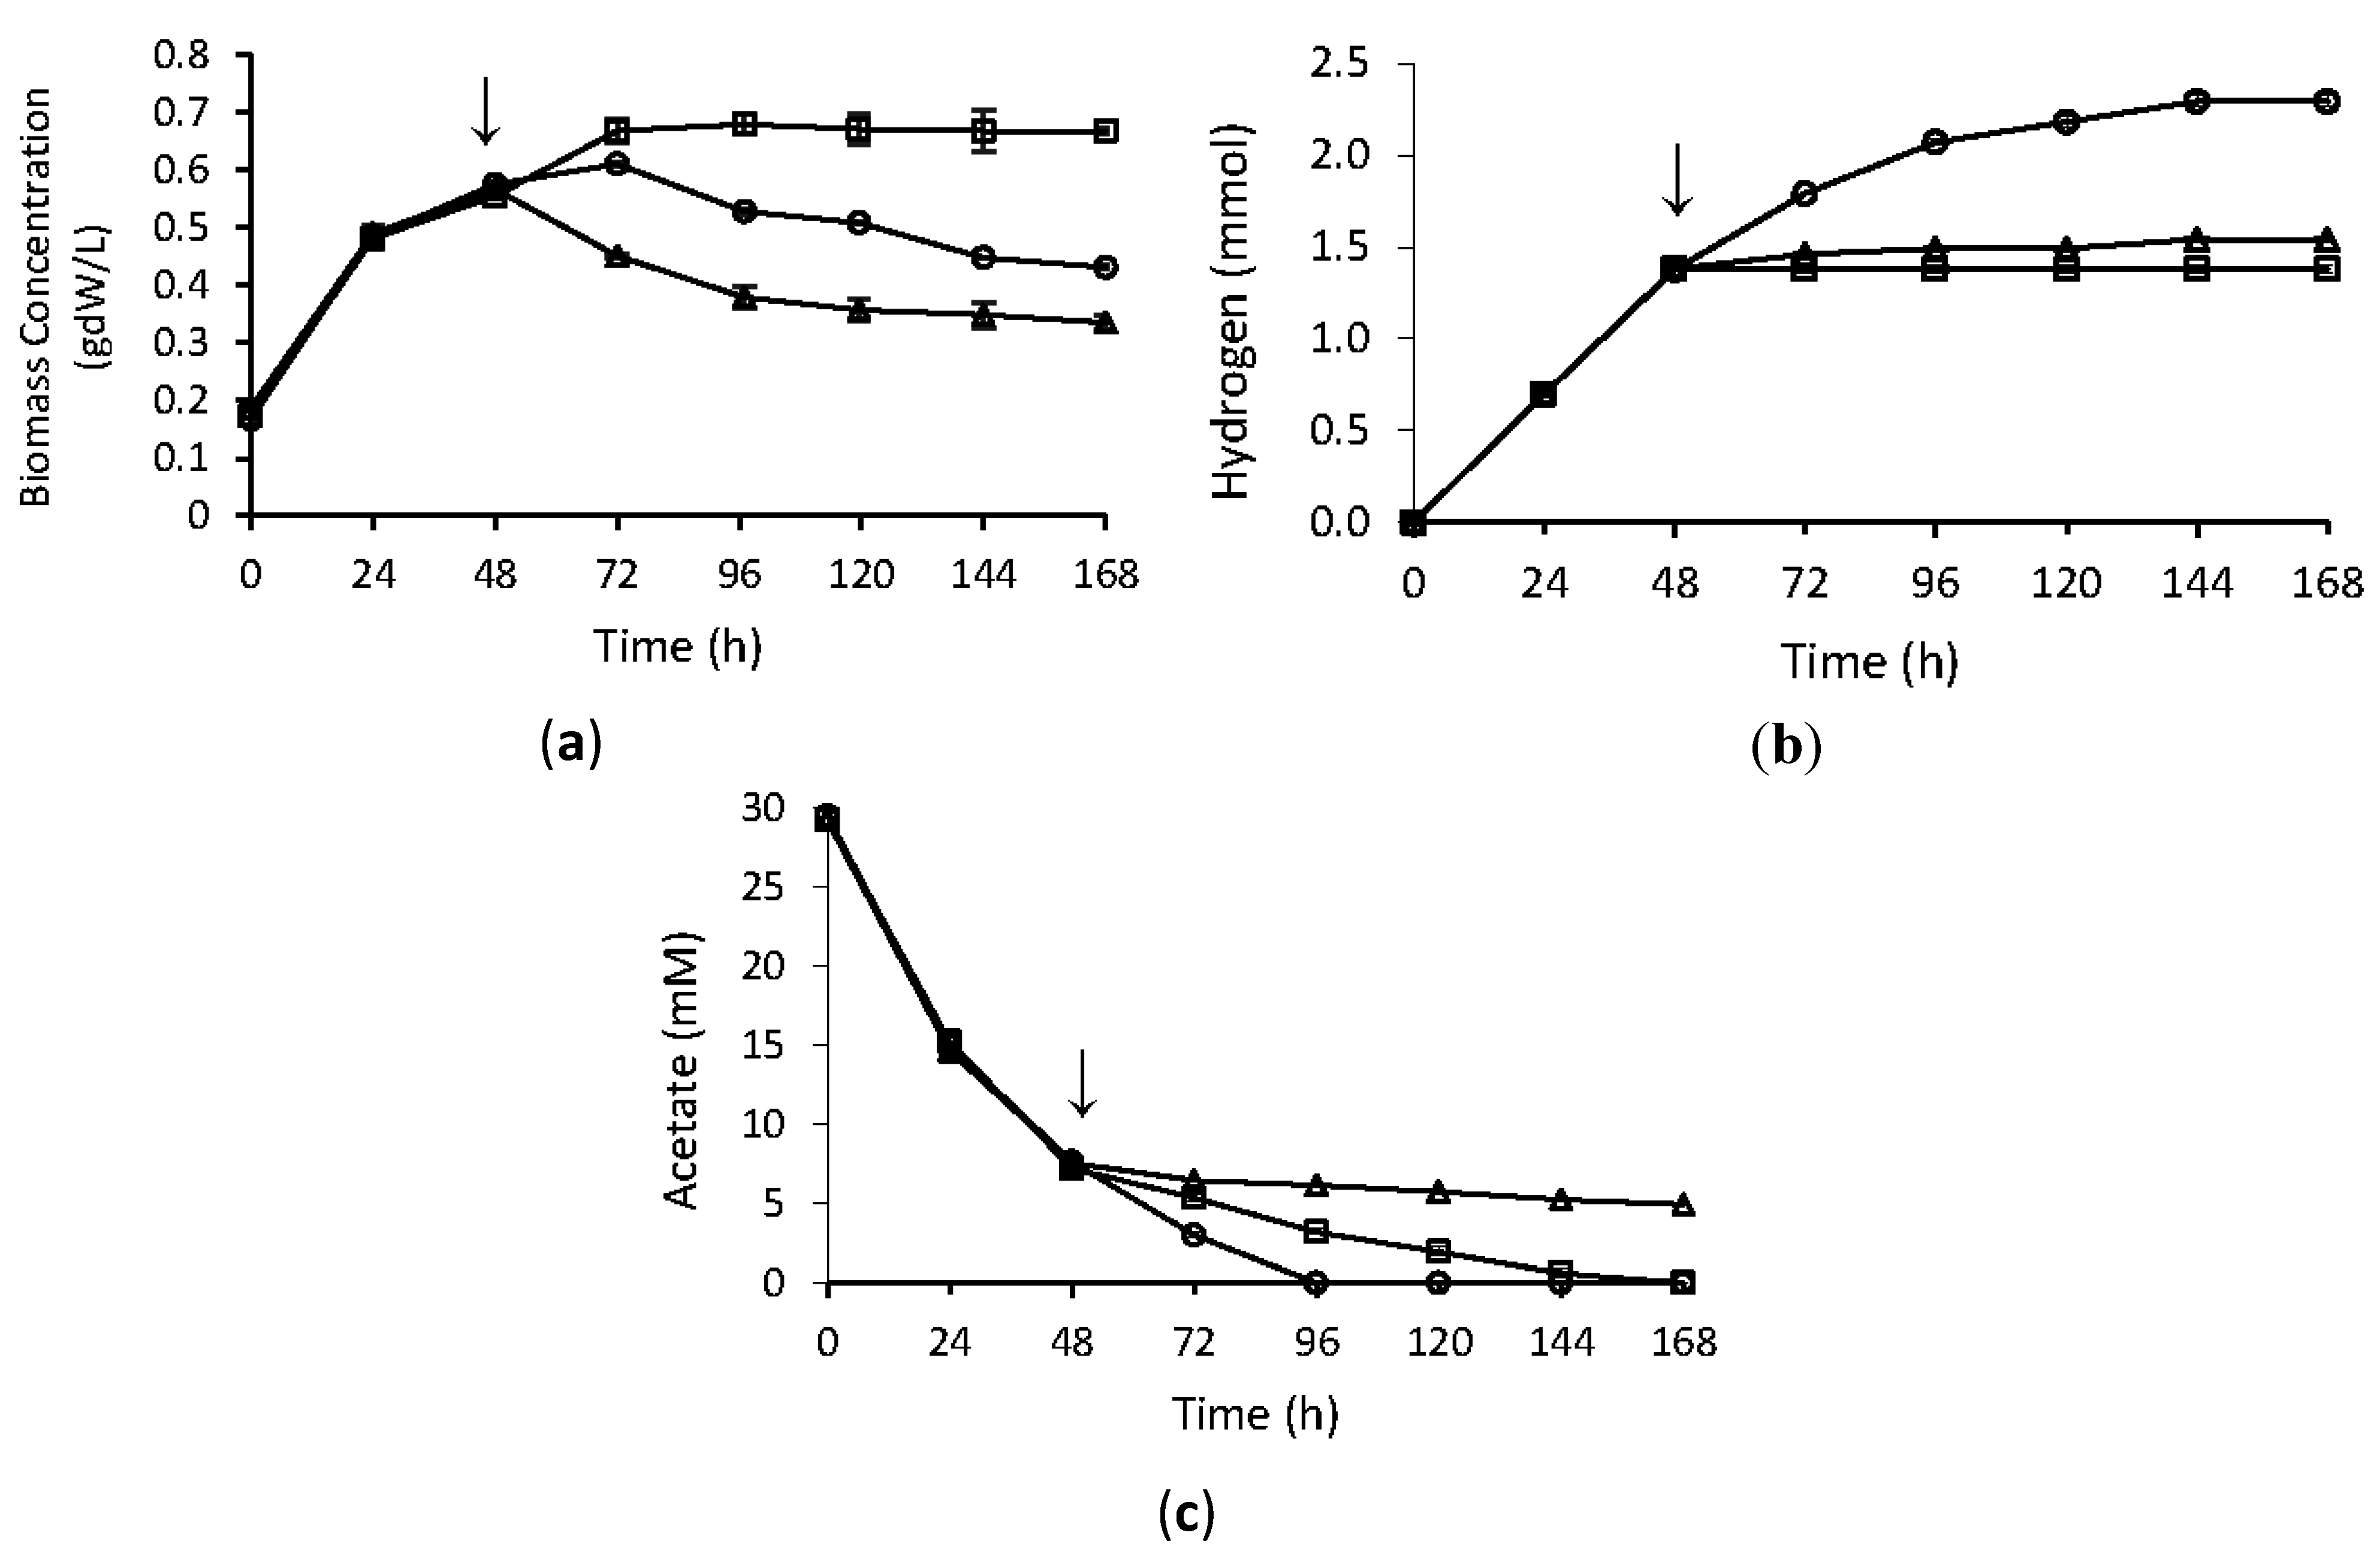
2.1. Physiological Analyses

In this study we investigated the effects of temperature stress on hydrogen production metabolism of R. capsulatus. The bacteria were grown under anaerobic conditions in hydrogen production medium at 30 °C for 48 h. After 48 h, when the hydrogen production was at exponential phase, bacteria received either cold stress at 4 °C, or heat stress at 42 °C. Physiological data on H2 production, growth and substrate consumption were followed for five days after heat and cold stress were applied. Control groups were kept at 30 °C throughout the experiment. As shown in Figure 1, until stress application, growth, hydrogen production, and substrate consumption profiles were very similar to each other. Hydrogen production immediately stopped upon both cold and heat stress applications. Heat stress causes the death of the bacteria in the long term, however, bacteria continued to survive under cold stress. Substrate uptake rate decreased under cold stress treatment, but all acetate was consumed. On the other hand, upon heat stress, treatment uptake of acetate ceased completely.
Figure 1. Bacterial growth (a); hydrogen production (b); and acetate consumption (c) of R. capsulatus under temperature stress. Arrow indicates the time of stress application. Experiments were carried out as duplicates and error bars indicate ± SEM. (○: control; □: cold stress; Δ: heat stress).
Ijms 16 13781 g001

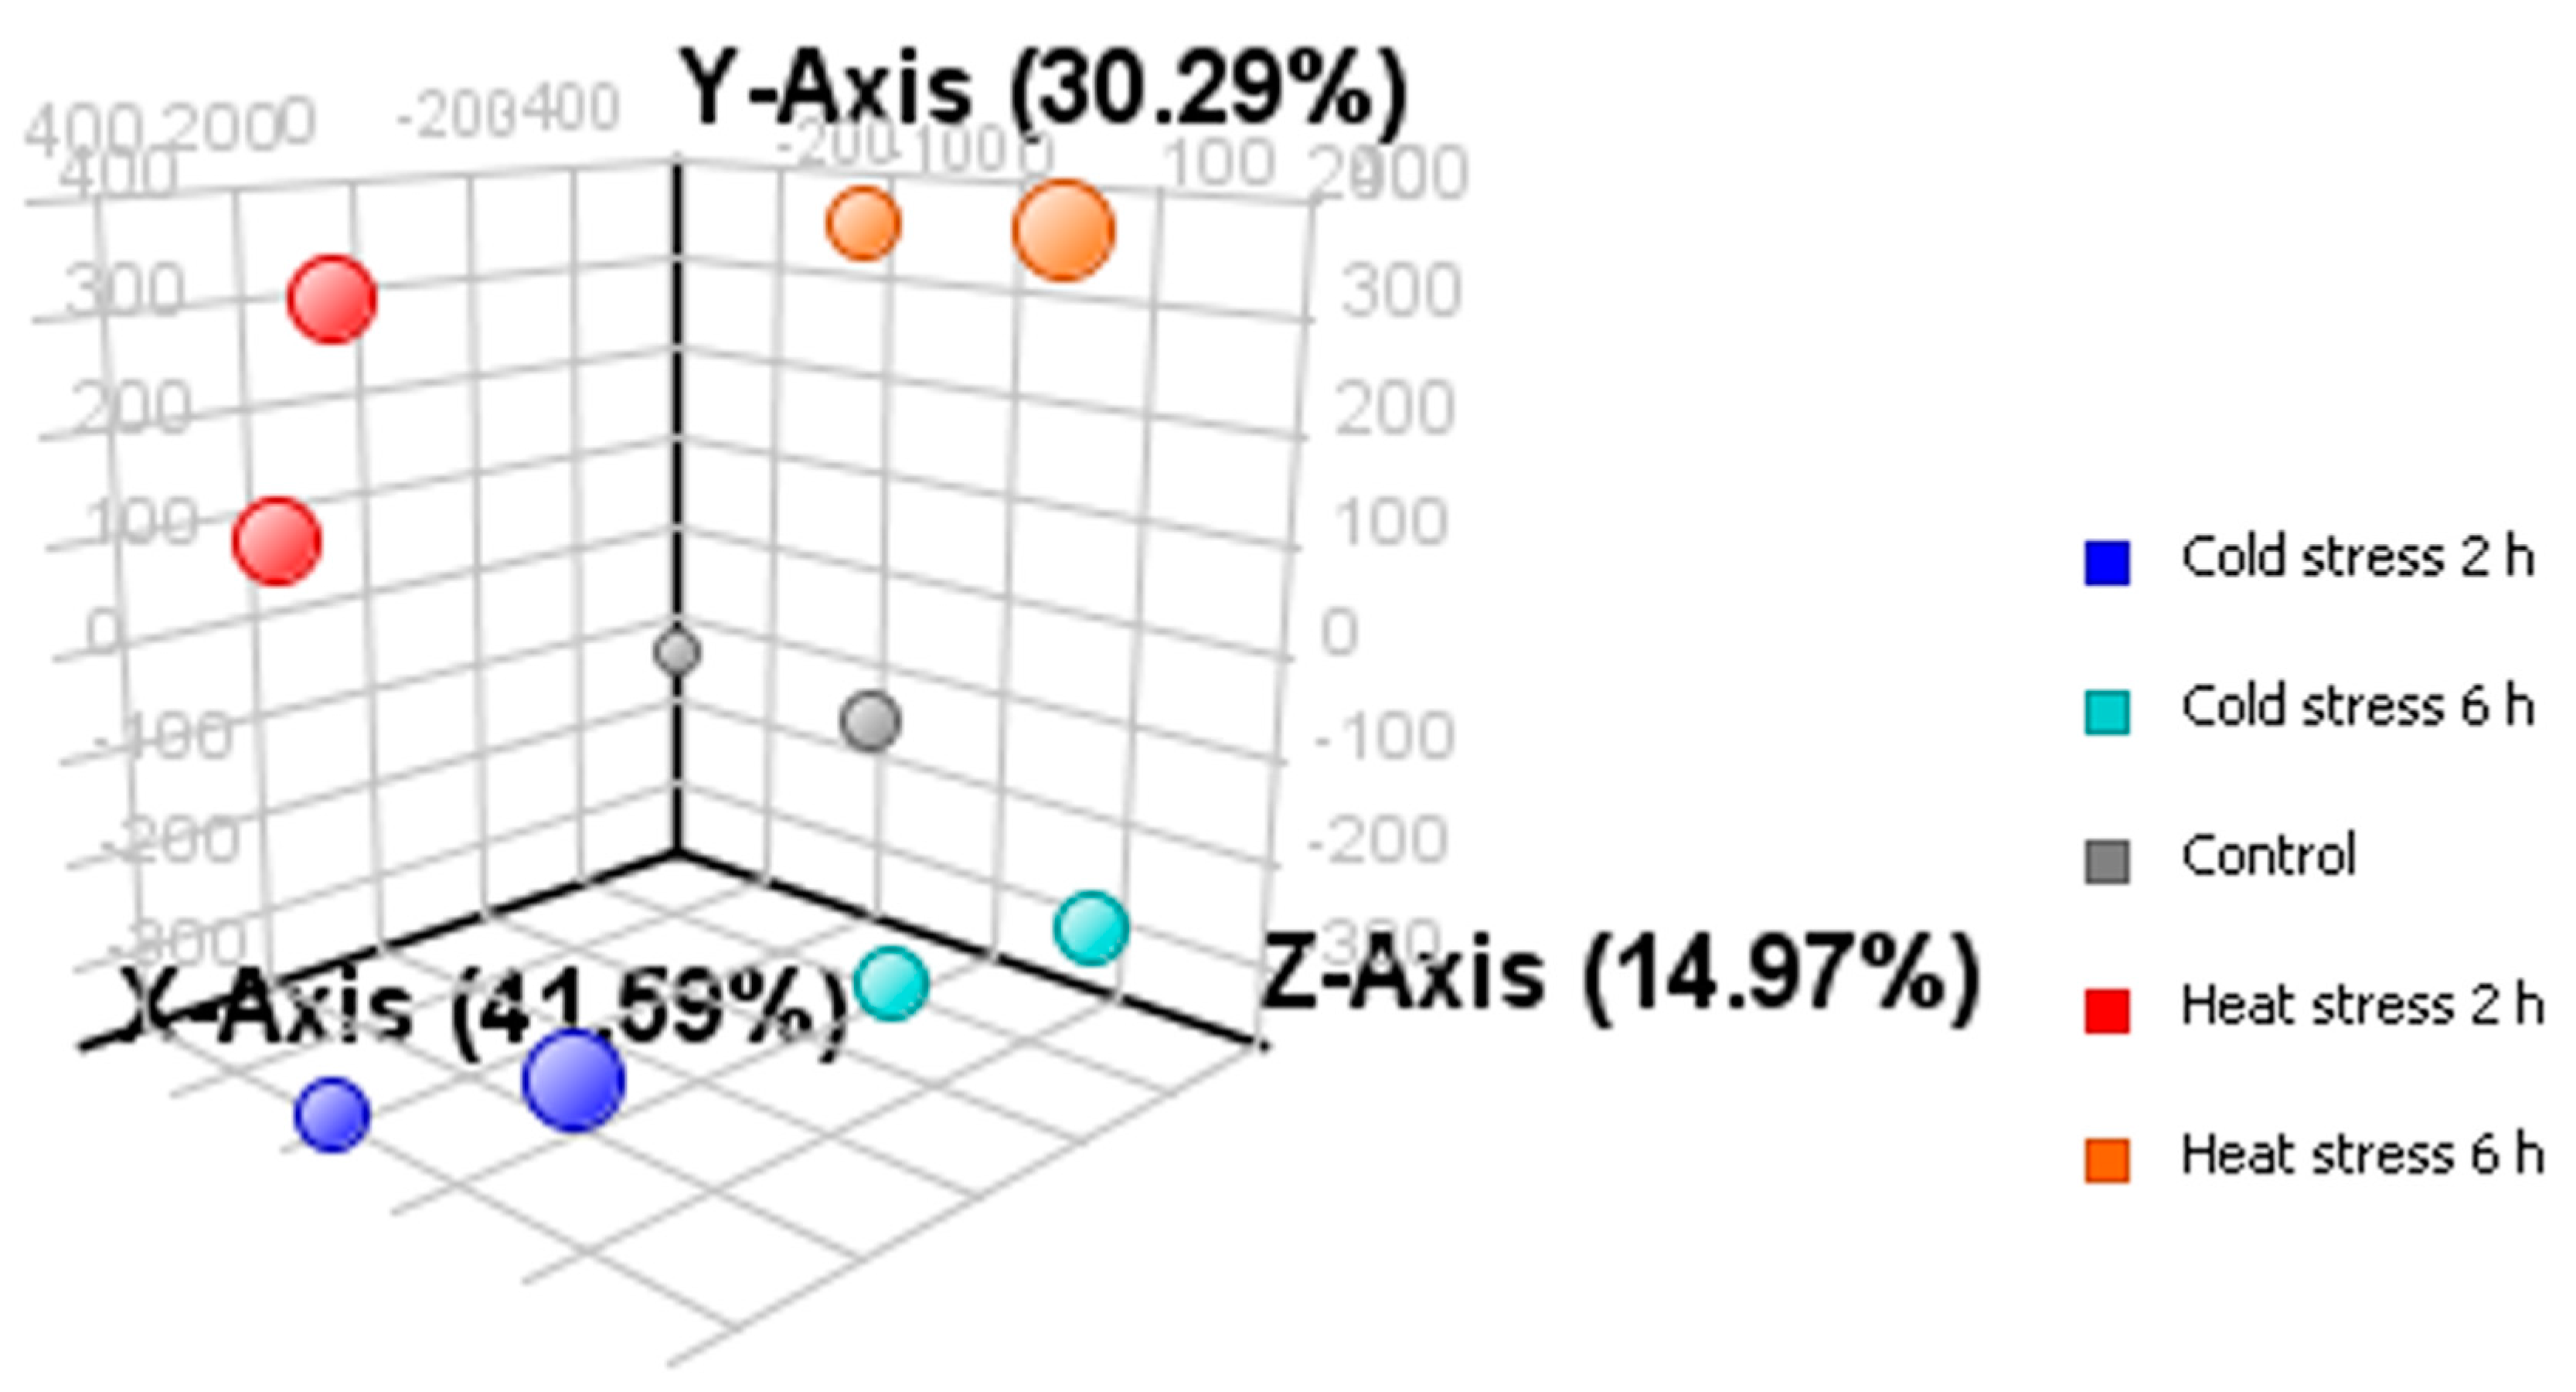
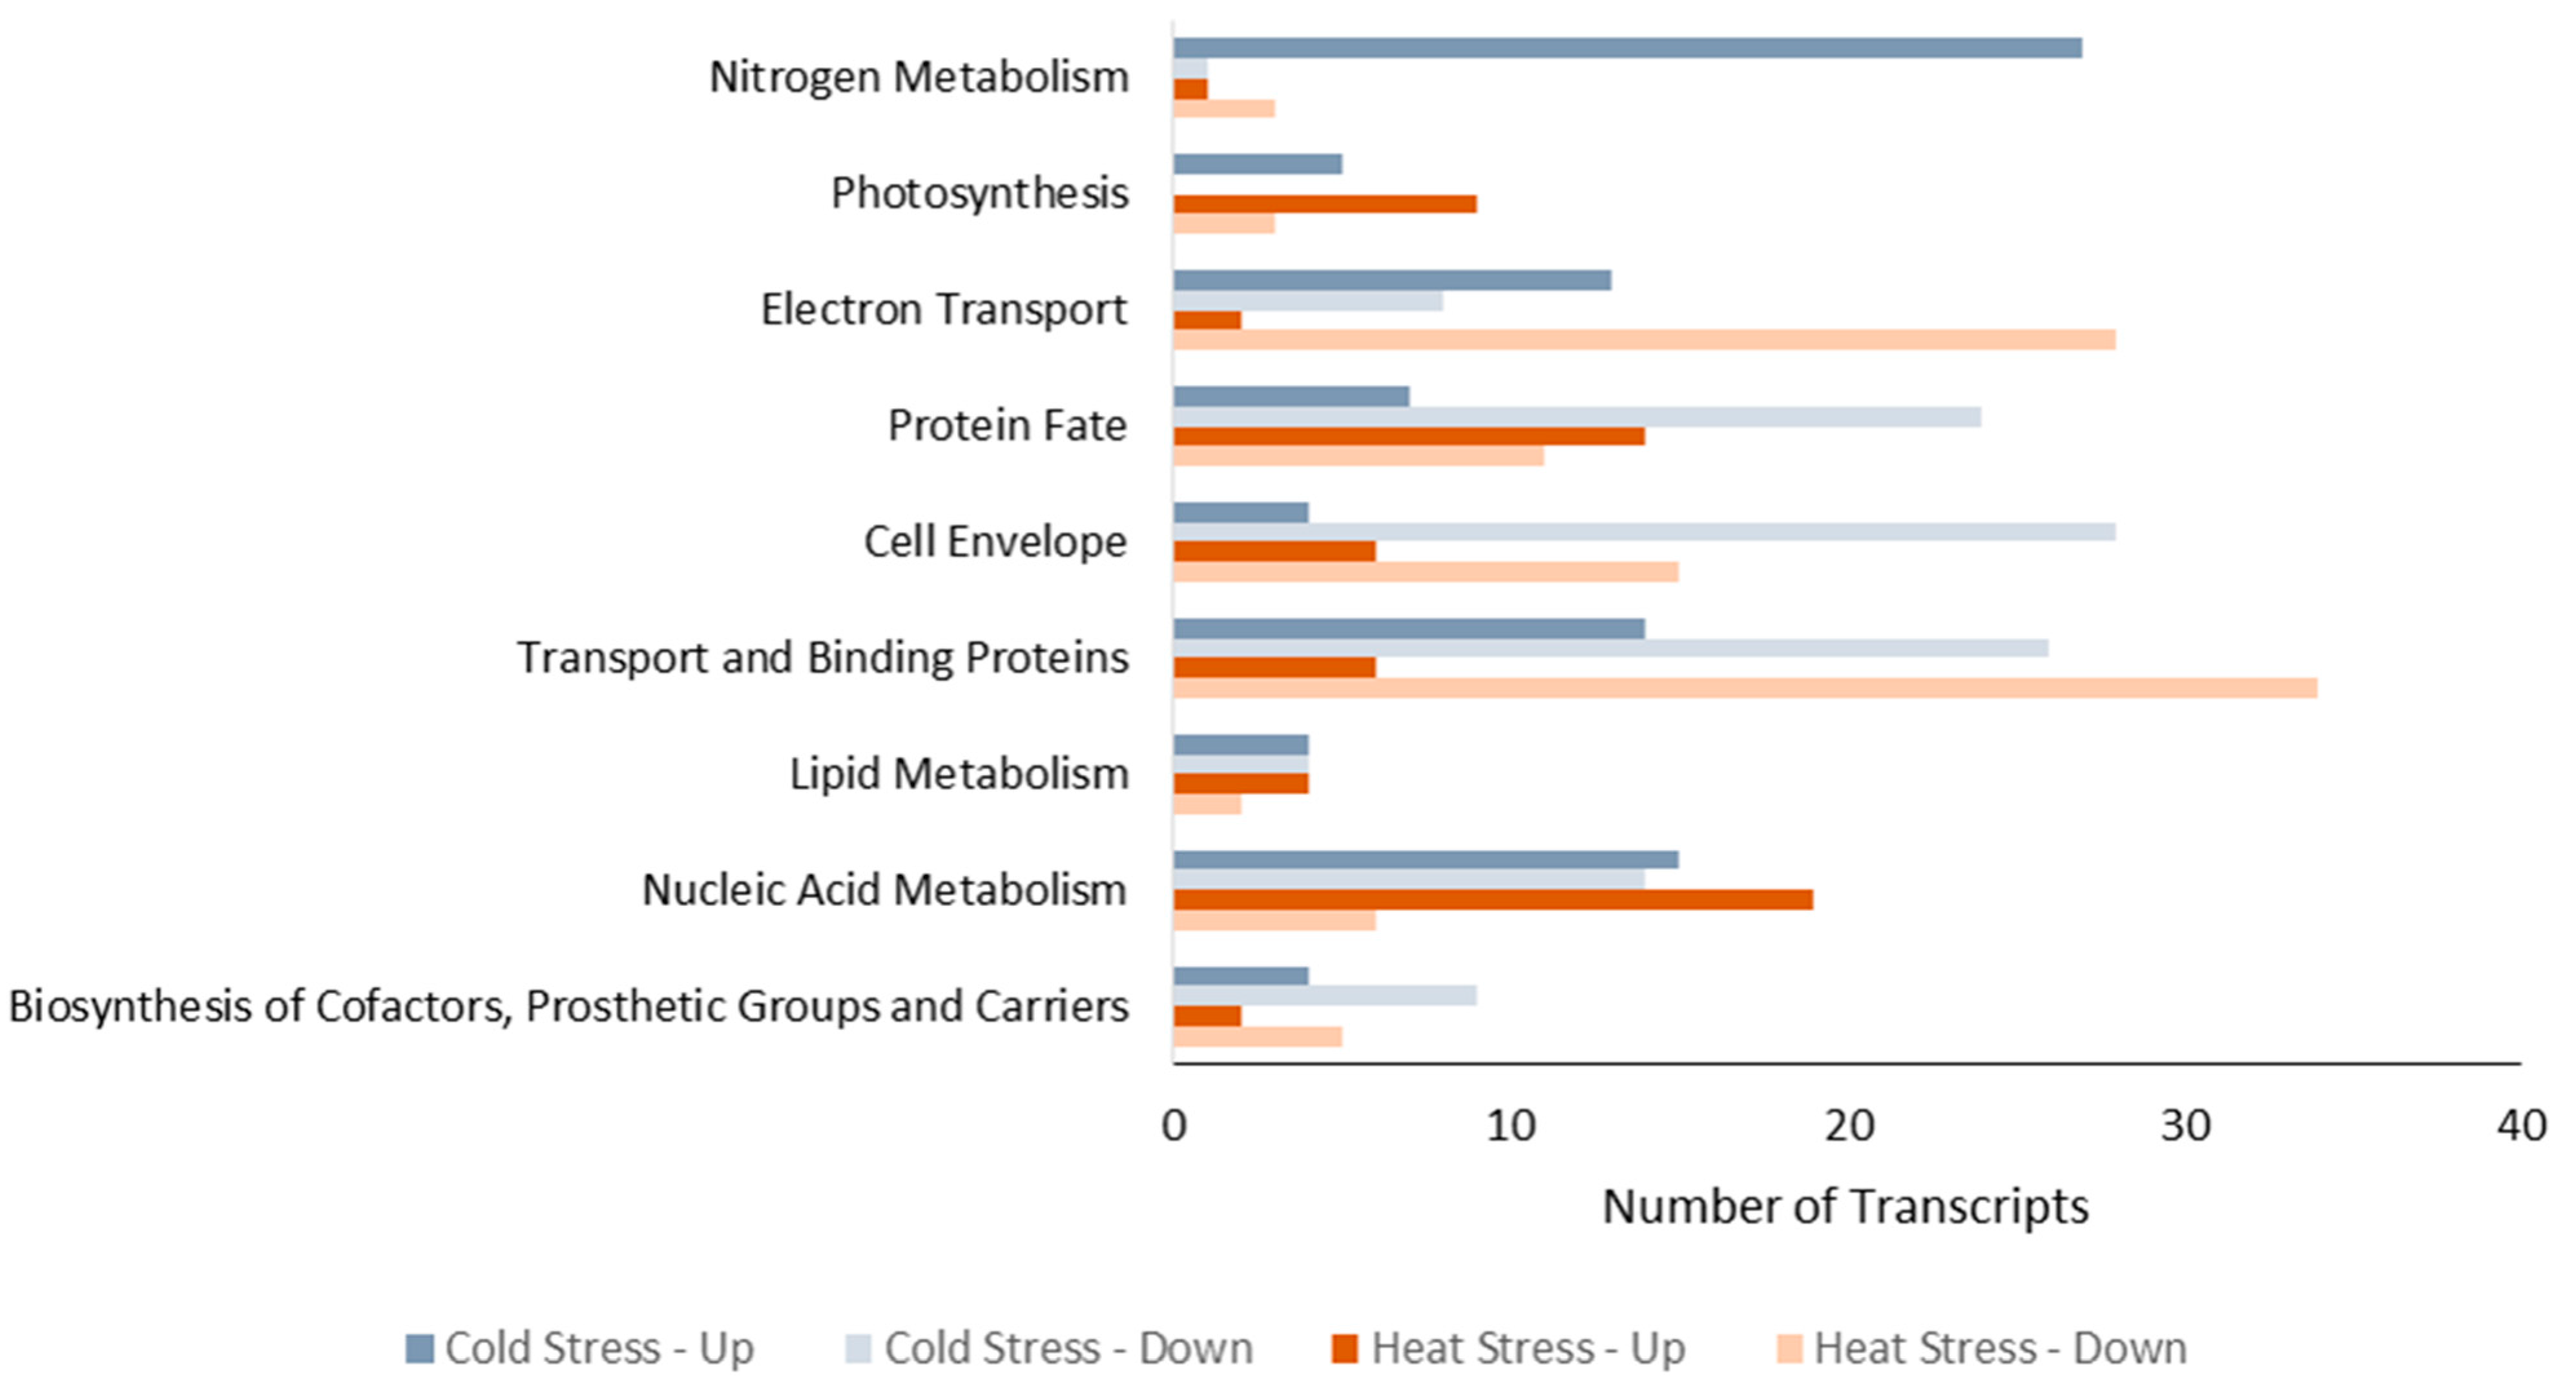
2.2. Microarray Analysis

Transcriptome analysis was carried out using samples taken at the 2nd and 6th h of stress applications. Microarray data quality was checked as previously described, and data analysis was continued with the chips that met comparable quality control parameters [12]. In order to explore the correlations between duplicate samples, Principal Component Analysis was performed. Duplicate samples were close to each other and clearly separated from the rest (Figure 2). Moreover, the Pearson correlation coefficients between the duplicates were significant (Table 1). Together with physiological analyses, these results reveal that the differences in gene expression levels are a result of temperature stress application. According to the Microarray Quality Control (MAQC) Project [13], significance analysis was based on a fold change ≥2.0 with the p-value cut-off at 0.1.
Figure 2. Principal Component Analysis of duplicate samples. The percentages of the total variation that are accounted by the 1st, 2nd, and 3rd principal components are shown on the x, y and z axes labels.
Ijms 16 13781 g002
Table 1. Correlation coefficients of duplicate samples of temperature treatments.
SamplesCorrelation Coefficients between Duplicates
Control0.975
Cold stress 2 h0.959
Cold stress 6 h0.985
Heat stress 2 h0.967
Heat stress 6 h0.987
To test the validity of the microarray results we performed real-time qPCR analysis on three genes: pufM, atpF and oppA. These genes were chosen from three different metabolic pathways: photosynthesis, electron transport system, and membrane transport. The pufM gene encodes the medium subunit of the photosynthetic reaction center. It was significantly down regulated (3.1-fold) at 6 h of heat stress. The product of atpF is B subunit of ATP synthase F0 and the product of oppA is an oligopeptide ABC transporter. atpF was up regulated 3.57-fold at 2 h of cold stress; oppA was down regulated 3.2-fold at 2 h of heat stress. Table 2 shows the corroboration of our microarray results with the real-time qPCR analysis, which provides an independent verification of transcript level changes.
Table 2. Transcript level comparison genes of R. capsulatus between real-time qPCR and microarray analyses.
GeneTranscript Change with Real-Time qPCRTranscript Level Change with MicroarrayForward Primer (5′>3′)Reverse Primer (3′>5′)
16S rRNA1.01.0GCTAGTAATCGCGTAACAGCACAGTCACTGAGCCTACCGT
atpF+2.50 ± 0.23+3.57ACGTTCCTGCTTGTTGCTCTTCGAGGGAACCTTGAACTTG
pufM−1.43 ± 0.02−3.10CACCATCGGTGTGTGGTACTAGACACCACCCTGTTTCAGC
oppA−2.58 ± 0.12−3.20AGGAACTGCTCAAACCGATGGTCCTTGTAGTCCGCAAACC
We found that expressions of 328 genes out of 4052 probe sets changed significantly under cold stress, and 293 genes under heat stress.
We grouped the genes into appropriate metabolisms using information from the web site of the R. capsulatus genome (http://onco.img.cas.cz/rhodo/results/index.html) and the protein grouping of Onder et al. [14]. Figure 3 shows the metabolic distribution of significantly changed genes under both stress conditions. The distribution of genes in nitrogen metabolism, photosynthesis, and electron transport differ significantly between cold and heat stress. These are the most important metabolisms for hydrogen production since photoproduction of hydrogen in PNS bacteria is primarily related to nitrogen metabolism, together with electron transport and photosynthesis [15]. The detailed lists of expression levels of significantly changed genes are given in Table 3 and Table 4
Figure 3. Metabolic distributions of genes with significant change in expression levels under cold and heat stress. Data are given as the number of transcripts.
Ijms 16 13781 g003
Table 3. Differentially expressed R. capsulatus genes under cold stress.
Functional GroupProbe Set IDGene SymbolDescriptionFold Changep Value
2 h6 h
Nitrogen MetabolismRCAP_rcc00566_s_atnifBNitrogenase cofactor biosynthesis protein NifB+6.317+2.4870.0204
RCAP_rcc00571_atnifDNitrogenase molybdenum-iron protein α chain+59.112+38.4800.0176
RCAP_rcc03280_atnifENitrogenase molybdenum-iron cofactor biosynts protein NifE+3.069+1.2230.0089
RCAP_rcc00572_atnifHNitrogenase iron protein+99.953+44.1110.006
RCAP_rcc00570_atnifKNitrogenase molybdenum-iron protein β chain+29.376+16.5300.003
RCAP_rcc03279_atnifNNitrogenase molybdenum-iron cofactor biosynthesis protein NifN+6.598+1.9570.0038
RCAP_rcc00586_atanfDNitrogenase iron-iron protein, α subunit+23.486+13.1260.0301
RCAP_rcc00587_atanfGNitrogenase iron-iron protein, delta subunit+37.180+22.1940.0379
RCAP_rcc00585_atanfHNitrogenase iron protein+33.189+20.2100.0873
RCAP_rcc01674_atglnAGlutamine synthetase+2.249+2.2120.0027
RCAP_rcc01673_atglnBNitrogen regulatory protein P-II+2.756+2.0930.0355
PhotosynthesisRCAP_rcc01830_atfbaFructose-bisphosphate aldolase+2.056+3.4410.0137
RCAP_rcc01834_atfbpFructose-bisphosphatase+2.748+2.5640.0988
RCAP_rcc00744_atatpFATP synthase F0, B subunit+3.575+1.6400.0535
Electron TransportRCAP_rcc03284_atfdxNFerredoxin I+23.668+10.2140.0093
RCAP_rcc03285_atfdxCFerredoxin IV+13.582+2.4550.0000
RCAP_rcc03287_atrnfAElectron transport complex protein RnfA+20.417+5.8740.0033
RCAP_rcc03288_atrnfBElectron transport complex protein RnfB+9.373+1.9720.0018
RCAP_rcc03289_atrnfCElectron transport complex protein RnfC+17.068+7.5260.0036
Electron TransportRCAP_rcc03290_atrnfDElectron transport complex protein RnfD+7.219+4.2820.0042
RCAP_rcc03292_atrnfEElectron transport complex protein RnfE+7.124+5.6010.0039
RCAP_rcc03291_atrnfGElectron transport complex protein RnfG+8.091+3.5260.0028
RCAP_rcc00768_athupBHydrogenase, large subunit+1.442+3.4070.0749
Protein FateRCAP_rcc00223_atdnaJChaperone DnaJ−4.573−2.0220.0422
RCAP_rcc00224_atdnaKChaperone DnaK−5.482−1.3070.0031
RCAP_rcc02977_atclpAATP-dependent Clp protease, ATP-binding subunit ClpA−3.889−1.2710.0850
RCAP_rcc03406_atclpBChaperone ClpB−12.622−1.7350.0035
RCAP_rcc02609_atclpPATP-dependent Clp protease, ATP-binding subunit ClpX−2.995−1.0540.0292
RCAP_rcc01167_atclpSATP-dependent Clp protease adaptor protein ClpS−3.602−1.3330.0108
RCAP_rcc02478_atgroLChaperonin GroL−8.799−1.0190.0037
RCAP_rcc02477_atgroSChaperonin GroS−6.357−1.0410.0021
RCAP_rcc02818_atibpASmall heat shock protein IbpA−13.62−1.7620.0023
RCAP_rcc02583_atlonATP-dependent protease La−5.656−1.8840.0193
RCAP_rcc00034_s_athslUATP-dependent hsl protease ATP-binding subunit hslU−5.356−3.5320.0979
RCAP_rcc00035_s_athslVATP-dependent protease HslV−5.836−2.6660.0585
RCAP_rcc00480_atrpsU30S ribosomal protein S21+5.586+2.1470.0835
RCAP_rcc00327_atrplQ50S ribosomal protein L17+4.036+2.1200.0982
Cell Envelope BiogenesisRCAP_rcc00373_atmdoHGlucans biosynthesis glucosyltransferase H−4.527−1.8430.0506
RCAP_rcc01872_atlpxDUDP-3-O-[3-hydroxymyristoyl] glucosamine N-acyltransferase−2.652−1.4990.0668
RCAP_rcc03179_atphbBAcetoacetyl-CoA reductase+2.664+1.0020.0081
Nucleic Acid MetabolismRCAP_rcc00561_atmopAMolybdenum transport operon repressor MopA+2.673+1.1500.0027
RCAP_rcc00568_atrpoNRNA polymerase σ-54 factor+6.031+2.6020.0269
RCAP_rcc01801_athfqRNA chaperone Hfq+2.452−1.0200.0017
RCAP_rcc02165_atrneRibonuclease E+3.679−1.0040.0014
RCAP_rcc01384_atuvrBUvrABC system protein B−4.826−1.9980.0136
RCAP_rcc00201_at-site specific DNA methyltransferase+2.578+1.0700.0041
Transporter and Binding ProteinsRCAP_rcc00563_atmodBMolybdenum ABC transporter, permease protein ModB+3.113+1.0620.0033
Table 4. Differentially expressed R. capsulatus genes under heat stress.
Functional GroupProbe Set IDGene SymbolDescriptionFold Changep Value
2 h6 h
Nitrogen MetabolismRCAP_rcc01674_atglnAGlutamine synthetase−5.476−9.2660.0013
RCAP_rcc03387_atglnBNitrogen regulatory protein P-II−2.532−7.4450.0912
PhotosynthesisRCAP_rcc00733_atsdhASuccinate dehydrogenase, flavoprotein subunit−1.982−2.1470.0089
RCAP_rcc00736_atsdhBSuccinate dehydrogenase, iron-sulfur subunit−2.558−3.5080.0324
RCAP_rcc02531_atpucALight-harvesting protein B-800/850, α chain+1.070−2.0530.0405
RCAP_rcc00660_atpucCPucC protein−2.221−1.7280.0855
RCAP_rcc00693_atpufLPhotosynthetic reaction center, L subunit−1.894−3.8640.0825
RCAP_rcc00694_atpufMPhotosynthetic reaction center, M subunit−2.156−3.1020.0691
RCAP_rcc02970_atatpCATP synthase F1, epsilon subunit−1.981−2.5590.0380
RCAP_rcc02971_atatpDATP synthase F1, β subunit−6.198−9.1210.0211
RCAP_rcc02150_atacpAAconitate hydratase−2.482−2.8010.0930
Electron TransportRCAP_rcc00573_atfdxDFerredoxin V−3.345−2.9490.0075
RCAP_rcc00767_athupAHydrogenase, small subunit−2.436−3.3330.0778
RCAP_rcc00768_athupBHydrogenase, large subunit−3.744−5.2540.0249
RCAP_rcc00769_athupCHydrogenase, cytochrome b subunit−2.401−2.3540.0387
RCAP_rcc01517_atnuoANADH-quinone oxidoreductase, A subunit−2.363−2.2140.0795
RCAP_rcc01518_atnuoBNADH-quinone oxidoreductase, B subunit−2.401−2.7910.0719
RCAP_rcc01519_atnuoCNADH-quinone oxidoreductase, C subunit−2.884−2.7580.0153
RCAP_rcc01520_atnuoDNADH-quinone oxidoreductase, D subunit−3,101−4.1320.0043
RCAP_rcc01521_atnuoENADH-quinone oxidoreductase, E subunit−2,700−2.8690.0289
RCAP_rcc01527_atnuoGNADH-quinone oxidoreductase, G subunit−1,720−2.2620.0553
RCAP_rcc01529_atnuoHNADH-quinone oxidoreductase, H subunit−2.118−1,6630.0749
Protein FateRCAP_rcc03406_atclpBChaperone ClpB−2.502−2.5800.0120
RCAP_rcc02609_atclpPATP-dependent Clp protease, ATP-binding subunit ClpX−2,358−3.8590.0676
RCAP_rcc01167_atclpSATP-dependent Clp protease adaptor protein ClpS+1291+2.7040.0839
RCAP_rcc02583_atLonATP-dependent protease La−4.331−2.5440.0235
RCAP_rcc00480_atrpsU30S ribosomal protein S21+12.697+4.9620.0026
RCAP_rcc00321_atrplO50S ribosomal protein L15+8.431+8.2225.4674 × 10−4
RCAP_rcc00361_atrpmE50S ribosomal protein L31+3.899+2.1970.0983
Cell Envelope BiogenesisRCAP_rcc00350_atrpmH50S ribosomal protein L34+4.232+3.5510.0134
RCAP_rcc02380_atftsIPeptidoglycan synthetase FtsI−2.279−2.5460.0851
RCAP_rcc01678_atacpPAcyl carrier protein+4.132+1.4870.0863
RCAP_rcc00559_atpmtAPhosphatidylethanolamine N-methyltransferase+3.117+2.2730.0809
RCAP_rcc00028_atIdiIsopentenyl-diphosphate delta-isomerase+4.085+2.9810.0973
Nucleic Acid MetabolismRCAP_rcc00349_atrnpARibonuclease P+2.065+1.9190.0393
RCAP_rcc00286_atnusGTranscription antitermination protein NusG+3.113+2.4610.0678
RCAP_rcc03054_atrpoDRNA polymerase σ factor RpoD−2.919−2.4060.0329
RCAP_rcc00458_atrpoHRNA polymerase σ-32 factor−3.361−1.6670.0032
RCAP_rcc01751_atrecARecA protein+1.895+2.3570.0845
RCAP_rcc00201_at-Site specific DNA methyltransferase+2.231−1.0700.0013
Transporter and Binding ProteinsRCAP_rcc01243_atpotAPolyamine ABC transporter, ATP binding protein PotA−8.289−10.2730.0073
RCAP_rcc01245_atpotBPolyamine ABC transporter, permease protein PotB−4.566−7.0720.0040
RCAP_rcc01244_atpotDPolyamine ABC transporter, periplasmic polyamine-binding protein PotD−14.108−15.8420.0014
RCAP_rcc02186_atpotFSpermidine/putrescine ABC transporter, periplasmic spermidine/putrescine-binding protein PotF−4.010−4.5080.0193
RCAP_rcc02183_atpotGSpermidine/putrescine ABC transporter, ATP-binding protein PotG−3.135−2.8330.0203
RCAP_rcc01895_atpotHSpermidine/putrescine ABC transporter, permease protein−2.976−2.3010.0588
RCAP_rcc01246_atpotIPolyamine ABC transporter, permease protein PotI−3.940−4.1120.0304
RCAP_rcc01879_atsufCFeS assembly ATPase SufC−6.598−6.3512.1582 × 10−4
RCAP_rcc00092_atfeoBFerrous iron transport protein B−2.362−1.5240.0338
RCAP_rcc01878_atsufDFeS assembly protein SufD−4.363−4.2240.0306
RCAP_rcc01376_atdctPTRAP dicarboxylate transporter, DctP subunit−1.538−2.4360.0186
RCAP_rcc00706_atoppAOligopeptide ABC transporter, Periplasmic oligopeptide-binding protein OppA−3.203−3.0850.0069

2.3. Effect of Temperature Stress on Hydrogen Production Metabolism of R. capsulatus

Photofermentative hydrogen production by R. capsulatus is governed mostly by photosynthesis, electron transport, and nitrogen metabolism [15]. These were greatly affected by temperature stress.
Under cold stress, overall increase of gene expression of nitrogen metabolism and the electron transport system is remarkable. The nitrogenase enzyme genes, nif and anf, were highly up regulated (Table 3). The nitrogenase enzyme is primarily responsible for nitrogen fixation; however one mole of hydrogen is also produced during the following process:
N2 + 8H+ + 8e + 16ATP → 2NH3 + H2 + 16ADP + 16Pi
Under nitrogen limiting conditions, nitrogenase takes up the electron from ferredoxin/flavodoxin and reduces the protons to molecular hydrogen via the following reaction:
2H + 2e + 4ATP → H2 + 4ADP + 4Pi
Nitrogenase acts as a redox balancing system and reduces the electrons coming from cyclic photosynthesis and oxidation of organic acids [16,17]. The genes encoding ferredoxins (fdxC and fdxN), which carry the electrons to the nitrogenase from the electron transfer chain in the membrane, were also significantly up regulated (13–23-fold). Similarly, electron transport complex genes (rnf genes), which serve as electron donors to nitrogenase under photosynthetic conditions [18] were up regulated up to 20-fold. The molecular hydrogen produced by nitrogenase is recycled by the hydrogenase enzyme encoded by hup genes. Under cold stress, hydrogenase large subunit gene hupB was up regulated by three fold, which is consistent with up regulation of nitrogenase genes. The expression of ATP synthase (ATPase) F0 subunit gene (atpF) was up regulated 3.5-fold under cold stress. This finding is also consistent with up regulation of nitrogenase genes. This indicates that nitrogenase and electron transport metabolism are co-regulated under cold stress.
The regulators of nitrogen metabolism, glnA and glnB, were also up regulated under cold stress. Moreover, the alternative σ factor gene rpoN was up regulated six fold under cold stress. Alternative σ factors control transcription of specific regulons during special physiological conditions, such as stress. Several alternative σ factors mediating different stress responses have been defined in Bacteria. Among them, RpoN, σ 54, is an activator of nif genes [19]. Its up regulation under cold stress is consistent with the up regulation of nitrogenase genes under cold stress.
Although the nitrogenase genes were highly up regulated, hydrogen production stopped after application of cold stress, as shown in Figure 1. This result shows that there is an apparent increase in mRNA levels of nif genes at the time of sampling for microarray analysis (2 and 6 h of stress). However, the transcripts may not have been translated into functional proteins, or the activity of the nitrogenase enzyme could have been controlled at the post-translational level. Further studies are required both at the translational and enzyme activity level in order to clarify this point.
Under heat stress, on the other hand, no significant change in the expression of nitrogenase genes was observed, while electron transport system genes and photosynthesis genes were down regulated (Table 4). The down regulated genes include ATP synthase subunit genes (atpC and atpD), hydrogenase (hupA, hupB, hupC), NADH quinone oxidoreductase genes (nuoA, nuoB, nuoC, nuoD, nuoE, nuoG, nuoH), and photosystem reaction center genes (puf and puc genes). NADH quinone oxidoreductase links electrons from ubiquinone, resulting in the generation of a proton gradient for ATP synthesis [20]. The down regulation of these genes suggests impairment in energy production of R. capsulatus by heat stress. These results are also consistent with our physiological results demonstrating the death of bacteria under heat stress, which might be due to energy impairment (Figure 1).

2.4. Effect of Temperature Stress on Protein Metabolism of R. capsulatus

The ribosomal protein genes (both 30S and 50S) were up regulated under both stress conditions. Macario and Macario [21] suggested that a higher transcription rate of a gene and increased life span of its mRNA are necessary to cope with heat stress. Increased temperature induces protein degradation, thus under heat stress cells require higher ribosomal protein concentration to synthesize necessary proteins. On the other hand, the transcription rate decreases with low temperature and the tendency to restore transcription levels explains the up regulation under cold stress. The heat shock protein (HSP) genes dnaJ, dnaK, groEL, groES, and clp encode molecular chaperons and proteases, which respectively mediate the correct folding and assembly of proteins, and degrade abnormal proteins [22]. These proteins are synthesized under non-stress conditions at lower rates, but their expression increases rapidly and transiently under heat shock to cope with increased damaged proteins [23]. In this study, the change in expression values of HSPs after heat stress application was found to be insignificant. This is because the fast and transient induction of HSP genes was missed in our experimental design. Cold stress application caused a significant decrease in expression of HSP genes (dnaJ, dnaK, clpA, clpB, clpP, clpS, groL, groS, ibpA, lon, hslU, hslV) compared to non-stress conditions. Cold stress treatment also decreased the transcription and translation rates. Therefore, HSP genes were down regulated to protect the present proteins from degradation. It is known that under cold stress, bacteria can save valuable resources by down regulation of HSP genes [24].

2.5. Effect of Temperature Stress on Lipid, Cell Envelope, and Trasporter Metabolisms of R. capsulatus

The membrane is vital for selective transport, the growth and survival of bacteria. The membrane lipid composition changes to maintain membrane fluidity at lower temperature which increases under heat stress, and decreases under cold stress [25]. Our microarray analysis suggests that the expression of genes involved in the biosynthesis of the cell envelope and cell membrane were up regulated under heat stress. The pmtA gene, which is crucial for formation of photosynthetic membrane in PNS bacteria [26], was increased three fold. Isopentenyl-diphosphate delta-isomerase gene idi was also up regulated (four fold) under heat stress. This enzyme is the last enzyme in the non-mevalonate pathway, which contributes to the biosynthesis of carotenoids and bacteriochlorophylls, which are important members of the photosynthetic center required to build the photosynthetic membrane system [27]. The acyl carrier protein gene acpP, which plays a significant role in fatty acid biosynthesis [28], was also up regulated. These results suggest that heat stress results in damage to the membrane structure and integrity.
Another effect of heat stress was the 4.5–15-fold decrease in the expressions of polyamine and spermidine/putrescine ABC transporter genes. Polyamines stimulate RNA and protein synthesis, and thus are required for growth [29]. Fe/S assembly genes sufC and sufD, which support biosynthesis of the Fe/S clusters in photosystem and electron transport [30] were 4–6-fold down regulated under heat stress. Consistently, expression of ferrous iron transporter B gene feoB was also down regulated under heat stress. These down regulations are also consistent with decreased electron transport genes under heat stress.
Under cold stress, the molybdenum ABC transporter gene modB was up regulated. Molybdenum is present in the FeMo cofactor of nitrogenase MoFe protein. Thus the increase in nitrogenase expression brought about an increased need for molybdenum. The expression of genes taking place in biosynthesis of the cell envelope were down regulated after two hours of cold stress application, but returned to control levels by six hours. This suggests that the bacteria adapt to cold stress.

2.6. Effect of Temperature Stress on Nucleic Acid Metabolism of R. capsulatus

The other important pathway for the bacteria to cope with stress and to survive is nucleic acid metabolism. Temperature stress can affect the efficiency of transcription, translation and recombination. Both cold and heat stresses up regulated the DNA methyltransferase gene, whose product methylates DNA and protects it from degradation. Heat stress also up regulated the recA gene which plays a role in DNA damage repair by recombination. Ribonuclease E was up regulated under cold stress together with that of RNA chaperone Hfq and polynucleotidyltransferase. Hfq protein assists RNA-RNA interactions and affects the translation of specific transcripts, and contributes to complex post-transcriptional networks [31]. In R. sphaeroides, Hfq supports small RNA (sRNA) function under 1O2 stress [32]. Increased expression of Hfq (2.4-fold) may indicate that noncoding RNAs may play a role in the stress response.

3. Experimental Section

3.1. Growth of Bacteria and Stress Treatments

The purple non-sulfur bacterium Rhodobacter capsulatus strain DSM1710 was obtained from DSMZ (German Collection of Microorganisms and Cell Cultures, Braunschweig, Germany). The bacteria were grown photoheterotrophically on a modified medium of Biebl and Pfennig [33] containing 20 mM acetate and 10 mM glutamate as carbon and nitrogen sources, respectively, at 30 °C under a continuous illumination of 114 W/m2 with 100 W tungsten lamps in batch mode. From the grown bacterial culture, inoculations to hydrogen production medium (30 mM acetate/2 mM glutamate) were made under aseptic conditions to provide a starting bacterial concentration of OD660nm = 0.230–0.250 (0.127–0.137 g dry cell weight) in 50 mL of total culture volume in 55 mL of glass reactor bottles. The cultures were sparged with argon gas to generate an anerobic environment, connected to collection tubes filled with distilled water and the produced gas was collected by water displacement method [34] and incubated at 30 °C for 48 h. After 48 h, two photobioreactors were kept at 30 °C to be used as control cultures, two of them were transferred to an incubator that was set to 4 °C and two were transferred to an incubator at 42 °C. Samplings were done periodically. Bacterial growth was followed by measuring the OD at 660 nm by spectrophotometer (Shimadzu UV-1201, Kyoto, Japan). The regression coefficient (R2) of the optical density (OD660nm) vs. dry cell weight calibration curve is 0.55, therefore the OD660nm values were multiplied with 0.55 to obtain the dry cell weight/L values. The gas samples were taken from the top of the reactor bottles by a gas tight syringe (Hamilton, 22 GA 500 µL-No. 1750, Bonaduz, Switzerland). The composition of 100 µL gas samples from the top of the reactor bottles was analyzed by gas chromatography (Agilent Technologies 6890N, Santa Clara, CA, USA) with the column SupelcoCarboxen 1010 (Sigma-Aldrich, St. Louis, MO, USA). The carrier gas was argon with a flow rate of 26 mL/min. The oven temperature was 140 °C and the temperatures of injector and detector were 160 and 170 °C, respectively. The moles of the produced hydrogen were calculated by using ideal gas equation (PV = nRT). The software used was Agilent Chemstation ver.B.01.01 (Agilent Technologies, Santa Clara, CA, USA). High Performance Liquid Chromatography (HPLC) equipped with an Alltech IOA-1000 (300 mm × 7.8 mm, Alltech, Deerfield, IL, USA) column was used to analyze the acetate consumption. Ten microliters of sample were injected into the system by the autosampler (Shimadzu SIL-20AC, Kyoto, Japan). The UV detector (Shimadzu SPD-20A, Kyoto, Japan) detected the organic acids at 210 nm wavelength. The oven temperature was kept at 66 °C. The mobile phase was 0.085 M H2SO4, with a flow rate of 0.4 mL/min with a low gradient pump (Schimadzu LC-20AT, Kyoto, Japan).

3.2. Microarray Analysis

Since a microarray chip for R. capsulatus was not available, a 100-3660 format GeneChip® Custom array having 4052 probe sets for 3685 open reading frames was designed by our group according to the GeneChip® Custom Expression Array Design Guide (Affymetrix, Santa Clara, CA, USA). The whole genome sequence of R. capsulatus was obtained from http://rhodo.img.cas.cz [35].
The total RNA was isolated from 1 × 10⁹ cells/mL bacterial samples drawn at the second and sixth hours of stress treatments. TRIzol Reagent (Invitrogen, Carlsbad, CA, USA) was used to isolate RNA. The yield and RNA purity were determined spectrophotometrically by using NanoDrop 2000 (Thermo Scientific, Waltham, MA, USA) and integrity of RNA was checked using Agilent Bioanalyzer (Agilent Technologies, Santa Clara, CA, USA).
cDNA of the total RNA was produced by reverse transcription reaction according to the Affymetrix Expression Analysis Technical Manual for Prokaryotic Target Preparation Manual. cDNA was purified with MinElute PCR Purification columns (QIAGEN, Hilden, Germany). It was then fragmented, labeled with biotin and hybridized onto the array according to the manufacturer’s instructions. GeneChip® Scanner 3000 was employed for scanning the hybridized arrays. Gene Chip Operating Software (Affymetrix, Santa Clara, CA, USA) was used for the feature extraction, image analysis and data extraction process. The RMA normalization was performed using GeneSpring GX version 11 (Agilent Technologies, Santa Clara, CA, USA). After that probe sets were filtered by expression based on raw intensity values with a lower percentile cut off of 20. One-way Analysis of Variance (ANOVA) was used to calculate the p values and p value correction was performed by Benjamini Hochberg method. The genes with satisfying p values (p ≤ 0.1) were further filtered by fold change analysis with the 2.0-fold change cut-off.
The data is available in Gene Expression Omnibus with the accession number GSE53477.

3.3. Real Time PCR Analysis

In order to determine the validity of the microarray results, transcript level changes were compared between microarray and real time PCR data. Genes and primer sequences are listed in Table 2. The housekeeping gene 16S rRNA was used as endogenous control. Roche LightCycler 1.5 (Roche GmbH, Mannheim, Germany) was used for the reactions, the reaction mix was LightCycler FastStart DNA Master SYBR Green I. For each gene two biological replicates with three technical replicates were employed. Reaction mixtures were first incubated at 95 °C for 10 min, followed by 40 cycles of denaturation, annealing and extension reactions which lasted 10 s at 95 °C, 5 s at 60 °C and 5 s at 72 °C, respectively. Melt curve analysis was performed to evaluate PCR specificity, and resulted in primer–specific melting temperatures. PCR efficiencies were derived from standard curve slopes in the LightCycler Software 4.0 (Roche, Mannheim, Germany). In this study, transcript level changes are reported as relative quantification based on relative expression of the target gene vs. 16S rRNA gene.

4. Conclusions

In this study whole genome DNA microarray analysis was utilized to evaluate global gene expression of Rhodobacter capsulatus in response to temperature stress. This is the first study that characterizes temperature stress effects on the hydrogen production metabolism of R. capsulatus at the whole genome transcriptional level. Expression profiles indicate energy impairment with elevated temperatures. Heat stress repressed the expression of photosynthesis, electron transport system, tricarboxylic acid (TCA) cycle and ATPase genes. This energy impairment limits bacterial growth and causes death under heat stress. In contrast, energy metabolism related genes such as electron transport complex protein and ATPase genes were induced by cold stress and the cell concentration was maintained.
Under heat stress, the genes for biosynthesis of fatty acids and phospholipids were up regulated. These groups of genes were down regulated after two hours of cold stress application but returned to the expression levels of control condition after six hours. This suggests that the bacteria can adjust their metabolism for adaptation to cold stress.
Nitrogen metabolism genes, especially nitrogenase genes, were highly up regulated under cold stress, which is a novel finding. However, nitrogenase gene expression did not significantly change under heat stress. The up regulation of hydrogen production genes while the hydrogen production actually stops should indicate that the bacteria try to compensate the reduced metabolic flow through this pathway on the gene regulatory level. The reason for the reduction may likely be the temperature sensitivity of one or more enzymatic reactions involved.
The results of this study may be helpful for understanding critical points that should be considered in genetic manipulations of PNS bacteria for improvement of H2 production capacity under temperature stress.

Acknowledgments

This work was supported by the European Commission-Research: The Sixth Framework Program for Research and Technological Development Sustainable Energy Systems EU FP6-SES IP HYVOLUTION (contract No. 019825) and The Scientific and Technological Research Council of Turkey (TÜBİTAK) (Project No. 108T455). The authors are grateful to the Middle East Technical University Central Lab Biotechnology and Molecular Biology R&D Center for the microarray facilities. Authors would like to thank to Tufan Öz and Remziye Yılmaz for their helpful suggestions in data analysis, and to Fatma Rezan Sahinkaya for help in revising the language of the manuscript.
Part of this study was presented in the 20th World Hydrogen Energy Conference 2014, Gwangju, South Korea.

Author Contributions

Experiments and analyses: Muazzez Gürgan and Nilüfer Afşar Erkal; Supervision: Ebru Özgür and Meral Yücel; General comments and suggestions: Ufuk Gündüz and Inci Eroglu. This study is a part of the thesis of Muazzez Gürgan.

Conflicts of Interest

The authors declare no conflict of interest.

References

  1. Koku, H.; Eroglu, I.; Gündüz, U.; Yücel, M.; Türker, M. Aspects of the metabolism of hydrogen production by Rhodobacter sphaeroides. Int. J. Hydrog. Energy 2002, 27, 1315–1329. [Google Scholar] [CrossRef]
  2. Hallenbeck, P.; Benemann, J. Biological hydrogen production; fundamentals and limiting processes. Int. J. Hydrog. Energy 2002, 27, 1185–1193. [Google Scholar] [CrossRef]
  3. Weaver, P.F.; Wall, J.D.; Gest, H. Characterization of Rhodopseudomonas capsulata. Arch. Microbiol. 1975, 105, 207–216. [Google Scholar] [CrossRef] [PubMed]
  4. Basak, N.; Das, D. The prospect of purple non-sulfur (PNS) photosynthetic bacteria for hydrogen production: The present state of the art. World J. Microbiol. Biotechnol. 2007, 23, 31–42. [Google Scholar] [CrossRef]
  5. Androga, D.D.; Sevinc, P.; Koku, H.; Yücel, M.; Gündüz, U.; Eroglu, I. Optimization of temperature and light intensity for improved photofermentative hydrogen production using Rhodobacter capsulatus DSM1710. Int. J. Hydrog. Energy 2014, 39, 2472–2480. [Google Scholar]
  6. Ünlü, G.; Sevinç, P.; Gündüz, U. Expression analysis of nif A and nif H genes in Rhodobacter sphaeroides O.U.001 at different temperatures. In International Symposium on Biotechnology: Developments and Trends, BTEC 2009; Middle East Technical University: Ankara, Turkey, 2009; p. 91. [Google Scholar]
  7. Özgür, E.; Uyar, B.; Öztürk, Y.; Yücel, M.; Gündüz, U.; Eroglu, I. Biohydrogen production by Rhodobacter capsulatus on acetate at fluctuating temperatures. Resour. Conserv. Recycl. 2010, 54, 310–314. [Google Scholar] [CrossRef]
  8. Androga, D.D.; Özgür, E.; Gündüz, U.; Yücel, M.; Eroglu, I. Factors affecting the longterm stability of biomass and hydrogen productivity in outdoor photofermentation. Int. J. Hydrog. Energy 2011, 36, 11369–11378. [Google Scholar] [CrossRef]
  9. Avcioglu, S.G.; Özgür, E.; Eroglu, I.; Yücel, M.; Gündüz, U. Biohydrogen production in an outdoor panel photobioreactor on dark fermentation effluent of molasses. Int. J. Hydrog. Energy 2011, 36, 11360–11368. [Google Scholar] [CrossRef]
  10. Ray, B. Impact of bacterial injury and repair in food microbiology: Its past, present and future. J. Food Prot. 1986, 49, 651–655. [Google Scholar]
  11. Shi, L.; Perkins, R.G.; Tong, W. The current status of DNA microarrays. In Microarrays: Preparation, Microfluidics, Detection Methods, and Biological Applications, 1st ed.; Dill, K., Liu, R., Grodzinsky, P., Eds.; Springer: New York, NY, USA, 2009; Volume 1, pp. 3–24. [Google Scholar]
  12. Yilmaz, R.; Yücel, M.; Öktem, H.A. Quality assessment of gene expression data for an Affymetrix platform with the two sample t-tests statistical analysis. Int. J. Biotechnol. Biochem. 2008, 4, 101–108. [Google Scholar]
  13. Shi, L.; Jones, W.D.; Jensen, V.R.; Harris, S.C.; Perkins, R.G.; Goodsaid, F.M.; Guo, L.; Croner, L.J.; Boysen, C.; Fang, H.; et al. The balance of reproducibility, sensitivity, and specificity of lists of differentially expressed genes in microarray studies. BMC Bioinform. 2008, 9, 1–19. [Google Scholar] [CrossRef] [PubMed]
  14. Onder, O.; Aygun-Sunar, S.; Selamoglu, N.; Daldal, F. A glimpse into the proteome of phototrophic bacterium Rhodobacter capsulatus. Adv. Exp. Med. Biol. 2010, 675, 179–209. [Google Scholar] [PubMed]
  15. Hillmer, P.; Gest, H. H2 Metabolism in the photosynthetic bacterium Rhodopseudomonas capsulata: H2 production by growing cultures. J. Bacteriol. 1977, 129, 724–731. [Google Scholar] [PubMed]
  16. McEwan, A.G. Photosynthetic electron transport and anaerobic metabolism in purple non-sulfur bacteria. Antonie van Leeuwenhoek 1994, 66, 151–164. [Google Scholar] [CrossRef] [PubMed]
  17. Ferguson, S.J.; Jackson, J.B.; McEwan, A.G. Anaerobic respiration in the Rhodospirillaceae: characterisation of pathways and evaluation of the roles in the redox balancing during photosynthesis. FEMS Microbiol. Rev. 1987, 46, 117–143. [Google Scholar] [CrossRef]
  18. Biegel, E.; Schmidt, S.; Gonzáles, J.M.; Müller, V. Biochemistry, evolution and physiological function of the Rnf complex, a novel ion-motive electron transport complex in prokaryotes. Cell. Mol. Life Sci. 2011, 68, 613–634. [Google Scholar] [CrossRef] [PubMed]
  19. Cullen, P.J.; Foster-Hartnett, D.; Gabbert, K.K.; Kranz, R.G. Structure and expression of the alternative sigmafactor, RpoN, in Rhodobacter capsulatus; physiological relevance of an autoactivated nifU2-rpoN superoperon. Mol. Biol. 1994, 11, 51–65. [Google Scholar]
  20. Leif, H.; Sled, V.D.; Ohnishi, T.; Weiss, H.; Friedrich, T. Isolation and characterization of the proton-translocating NADH: Ubiquinone oxidoreductase from Escherichia coli. Eur. J. Biochem. 1995, 230, 538–548. [Google Scholar] [CrossRef] [PubMed]
  21. Macario, A.J.L.; Macario, E.J. Heat shock response, overview. In The Encyclopedia of Stress, 2nd ed.; Fink, G., Ed.; Academic Press: California, CA, USA, 2000; pp. 350–357. [Google Scholar]
  22. Gomes, S.L.; Simão, R.C.G. Stress responses: Heat. Encycl. Microbiol. 2009, 1, 464–476. [Google Scholar]
  23. Yura, T.; Nagai, H.; Mori, H. Regulation of the heat shock response in bacteria. Annu. Rev. Microbiol. 1994, 47, 321–250. [Google Scholar] [CrossRef] [PubMed]
  24. Beckering, C.L.; Steil, L.; Weber, M.H.W.; Völker, U.; Maraheil, M.A. Genomewide transcriptional analysis of the cold shock response in Bacillus subtilis. J. Bacteriol. 2002, 184, 6395–6402. [Google Scholar] [CrossRef] [PubMed]
  25. Methe, B.A.; Nelson, K.E.; Deming, J.W.; Momen, B.; Melamud, E.; Zhang, X.; Moult, J.; Madupu, R.; Nelson, W.C.; Dodson, R.J.; et al. The psyrophilic lifestyle as revealed by the genome sequence of Colwellia psycherythraea 34H through genomic and proteomic analyses. Proc. Natl. Acad. Sci. USA 2005, 102, 10913–10918. [Google Scholar] [CrossRef] [PubMed]
  26. Kim, E.J.; Kim, M.S.; Lee, J.K. Phosphatidycholine is required for the efficient formation of photosynthetic membrane and B800-850 light harvesting complex in Rhodobacter sphaeroides. J. Microbiol. Bacteriol. 2007, 17, 373–377. [Google Scholar]
  27. Hahn, F.M.; Baker, J.A.; Poulter, C.D. Open reading frame 176 in the photosynthesis gene cluster of Rhodobacter capsulatus encods idi, a gene for isopenthyl diphosphate isomerase. J. Bacteriol. 1996, 178, 619–624. [Google Scholar] [PubMed]
  28. Majerus, P.W.; Alberts, A.W.; Vagelos, P.R. Acyl carrier protein. III An enoyl hydrase specific for acyl carrier protein thioesters. J. Biol. Chem. 1964, 240, 618–621. [Google Scholar]
  29. Raina, A.; Jänne, J. Physiology of the natural polyamines putrescine, spermidine and spermine. Med. Biol. 1975, 53, 121–147. [Google Scholar] [PubMed]
  30. Shen, G.; Golbeck, J.H. Assembly of the bound iron–sulfur clusters in Photosystem I. Adv. Photosynth. Respir. 2006, 24, 529–548. [Google Scholar]
  31. Vogel, J.; Luisi, B.F. Hfq and its constellation of RNA. Nat. Rev. Microbiol. 2011, 9, 578–589. [Google Scholar] [CrossRef] [PubMed]
  32. Hess, W.R.; Berghoff, B.A.; Wilde, A.; Steglich, C.; Klug, G. Riboregulators and the role of Hfq in photosynthetic bacteria. RNA Biol. 2014, 11, 413–426. [Google Scholar] [CrossRef] [PubMed]
  33. Biebl, H.; Pfennig, N. Isolation of member of the family Rhodosprillaceae. In The Prokaryotes; Starr, M.P., Stolp, H., Trüper, H.G., Balows, A., Schlegel, H.G., Eds.; Springer: New York, NY, USA, 1981; pp. 267–273. [Google Scholar]
  34. Uyar, B.; Eroglu, I.; Yücel, M.; Gündüz, U.; Türker, L. Effect of light intensity, wavelength and illumination protocol on hydrogen production in photobioreactors. Int. J. Hydrog. Energy 2007, 32, 4670–4677. [Google Scholar] [CrossRef]
  35. Strnad, H.; Lapidus, A.; Paces, J.; Ulbrich, P.; Vlcek, C.; Paces, V.; Haselkorn, R. Complete genome sequence of the photosynthetic purple nonsulfur bacterium Rhodobacter capsulatus SB 1003. J. Bacteriol. 2010, 192, 3545–3546. [Google Scholar] [CrossRef] [PubMed]

