Article

Stress-Responsive Expression, Subcellular Localization and Protein–Protein Interactions of the Rice Metacaspase Family

National Key Laboratory for Rice Biology, Institute of Biotechnology, Zhejiang University, Hangzhou 310058, China
*
Author to whom correspondence should be addressed.
Int. J. Mol. Sci. 2015, 16(7), 16216-16241; https://0-doi-org.brum.beds.ac.uk/10.3390/ijms160716216
Submission received: 26 April 2015 / Revised: 17 June 2015 / Accepted: 3 July 2015 / Published: 17 July 2015
(This article belongs to the Special Issue Abiotic Stress and Gene Networks in Plants)

Abstract

:
Metacaspases, a class of cysteine-dependent proteases like caspases in animals, are important regulators of programmed cell death (PCD) during development and stress responses in plants. The present study was focused on comprehensive analyses of expression patterns of the rice metacaspase (OsMC) genes in response to abiotic and biotic stresses and stress-related hormones. Results indicate that members of the OsMC family displayed differential expression patterns in response to abiotic (e.g., drought, salt, cold, and heat) and biotic (e.g., infection by Magnaporthe oryzae, Xanthomonas oryzae pv. oryzae and Rhizoctonia solani) stresses and stress-related hormones such as abscisic acid, salicylic acid, jasmonic acid, and 1-amino cyclopropane-1-carboxylic acid (a precursor of ethylene), although the responsiveness to these stresses or hormones varies to some extent. Subcellular localization analyses revealed that OsMC1 was solely localized and OsMC2 was mainly localized in the nucleus. Whereas OsMC3, OsMC4, and OsMC7 were evenly distributed in the cells, OsMC5, OsMC6, and OsMC8 were localized in cytoplasm. OsMC1 interacted with OsLSD1 and OsLSD3 while OsMC3 only interacted with OsLSD1 and that the zinc finger domain in OsMC1 is responsible for the interaction activity. The systematic expression and biochemical analyses of the OsMC family provide valuable information for further functional studies on the biological roles of OsMCs in PCD that is related to abiotic and biotic stress responses.

Graphical Abstract

1. Introduction

Programmed cell death (PCD) is an important life process that orchestrates cell suicide and keeps the proper metabolism function [1,2]. During PCD, a kind of enzymes, known as caspases, are often activated and thus initiate the cell death program [3,4,5,6]. In mammals, caspases are a family of cysteine-dependent aspartate-directed proteases, which cleave a variety of intracellular polypeptides and cause the stereotypic morphological and biochemical changes of the cells [7]. However, higher plants do not have close homologues of caspases, but possess a phylogenetically distant family of caspase-like proteins, called metacaspases [8]. Recent genome-wide characterizations in various plant species have revealed that the plant metacaspases are presented as a multigene family. For example, there are nine members in Arabidopsis [9], 8 or 9 members in rice [10,11] and 6 members in grapevine [12]. Phylogenetic analyses indicate that the plant metacaspases can be divided into two categories, type I and type II, according to the protein structure. The type I metacaspases possess a N-terminal extension prodomain ranging from 80 to 120 amino acids in length and two CxxC-type zinc finger domains, whereas type II metacaspases do not have such structures [9]. Both types of metacaspases have a p20 and a p10 subunits in the C-terminal regions, but the linker region between the two subunits in the type I is shorter than the type II metacaspase [11]. Recent biochemical studies demonstrated that two aspartate residues at the p10 subunit in a tobacco type II metacaspase contribute to the substrate-binding pocket [13] and identified a number of physiological substrates for some of the plant metacaspases [14,15].
Although the activity of some plant metacaspases is post-translationally regulated [16,17,18,19,20,21,22,23,24,25], transcriptional regulation of the gene expression is a major mechanism that modulates the activity of metacaspases in plants. A number of studies have indicated that the expression of the metacaspase genes can be regulated by developmental cues [11,12] and induced by a wide range of abiotic and biotic stresses [26,27,28,29,30,31]. For example, Arabidopsis AtMC1 and AtMC3 [32], tomato LeMCA1 [27], pepper CaMC9 [28], wheat TaMCA4 [29] and Nicotiana benthamiana NbMCA1 [30] were previously reported to be upregulated by infection from fungal or bacterial pathogens. Recent functional studies using overexpression or knockout/knockdown approaches have demonstrated that the metacaspases play critical roles in regulating PCD involved in developmental processes and stress responses. Two type II metacaspases, Arabidopsis AtMC9 and Norway spruce mcII-Pa, were found to regulate PCD that are required for the formation of xylem vessel elements [33] and embryogenesis [22,34], respectively. In Arabidopsis, AtMC1 and AtMC3, two type I metacaspases, were shown to positively and negatively regulate PCD, respectively [35], while overexpression of AtMC8 increased oxidative stress-induced PCD [26]. Knockout of AtMCP2d, coding for a type II metacaspase, suppressed PCD induced by fumonisin B1, oxidative stress and Pseudomonas syringae [24]. Additionally, the pepper CaMC9 [28], wheat TaMC4 [29] and N. benthamian NbMCA1 [30] are positive regulators of PCD and defense response. It was recently found that the functions of Arabidopsis AtMC1 and Norway spruce mcII-Pa are linked to autophagy [36,37].
Subcellular localization and interaction relationships with other proteins are critical to the mode of action for plants’ metacaspases. For example, the Arabidopsis AtMC9 was found to be present in apoplast, nucleus, and cytoplasm and its subcellular localization can be changed during late autolysis process [14,33]. In regulation of PCD, AtMC1 is a positive regulator via interacting with AtLSD1, a negative regulator of cell death [38], whereas AtMC2 is a negative regulator with weak interaction with AtLSD1 [35].
The rice metacaspase (OsMC) family contains eight members [10,11]. Among them, three (OsMC1–3) belong to type I and the remaining five (OsMC4–8) are members of type II [11]. However, very little is known about the biological function of the rice metacaspases so far. As a first step toward understanding the function of rice metacaspases in abiotic and biotic stress-related PCD, we performed a comprehensive analysis of gene expression in response to abiotic and biotic stresses as well as to stress-related hormones. We also analyzed the subcellular localizations of all rice metacaspases and examined the possible interactions of type I with OsLSDs, negative regulators of PCD [38]. Our results presented in this study provide valuable information for further functional studies on the biological roles of rice metacaspases in PCD that is related to abiotic and biotic stress responses.

2. Results

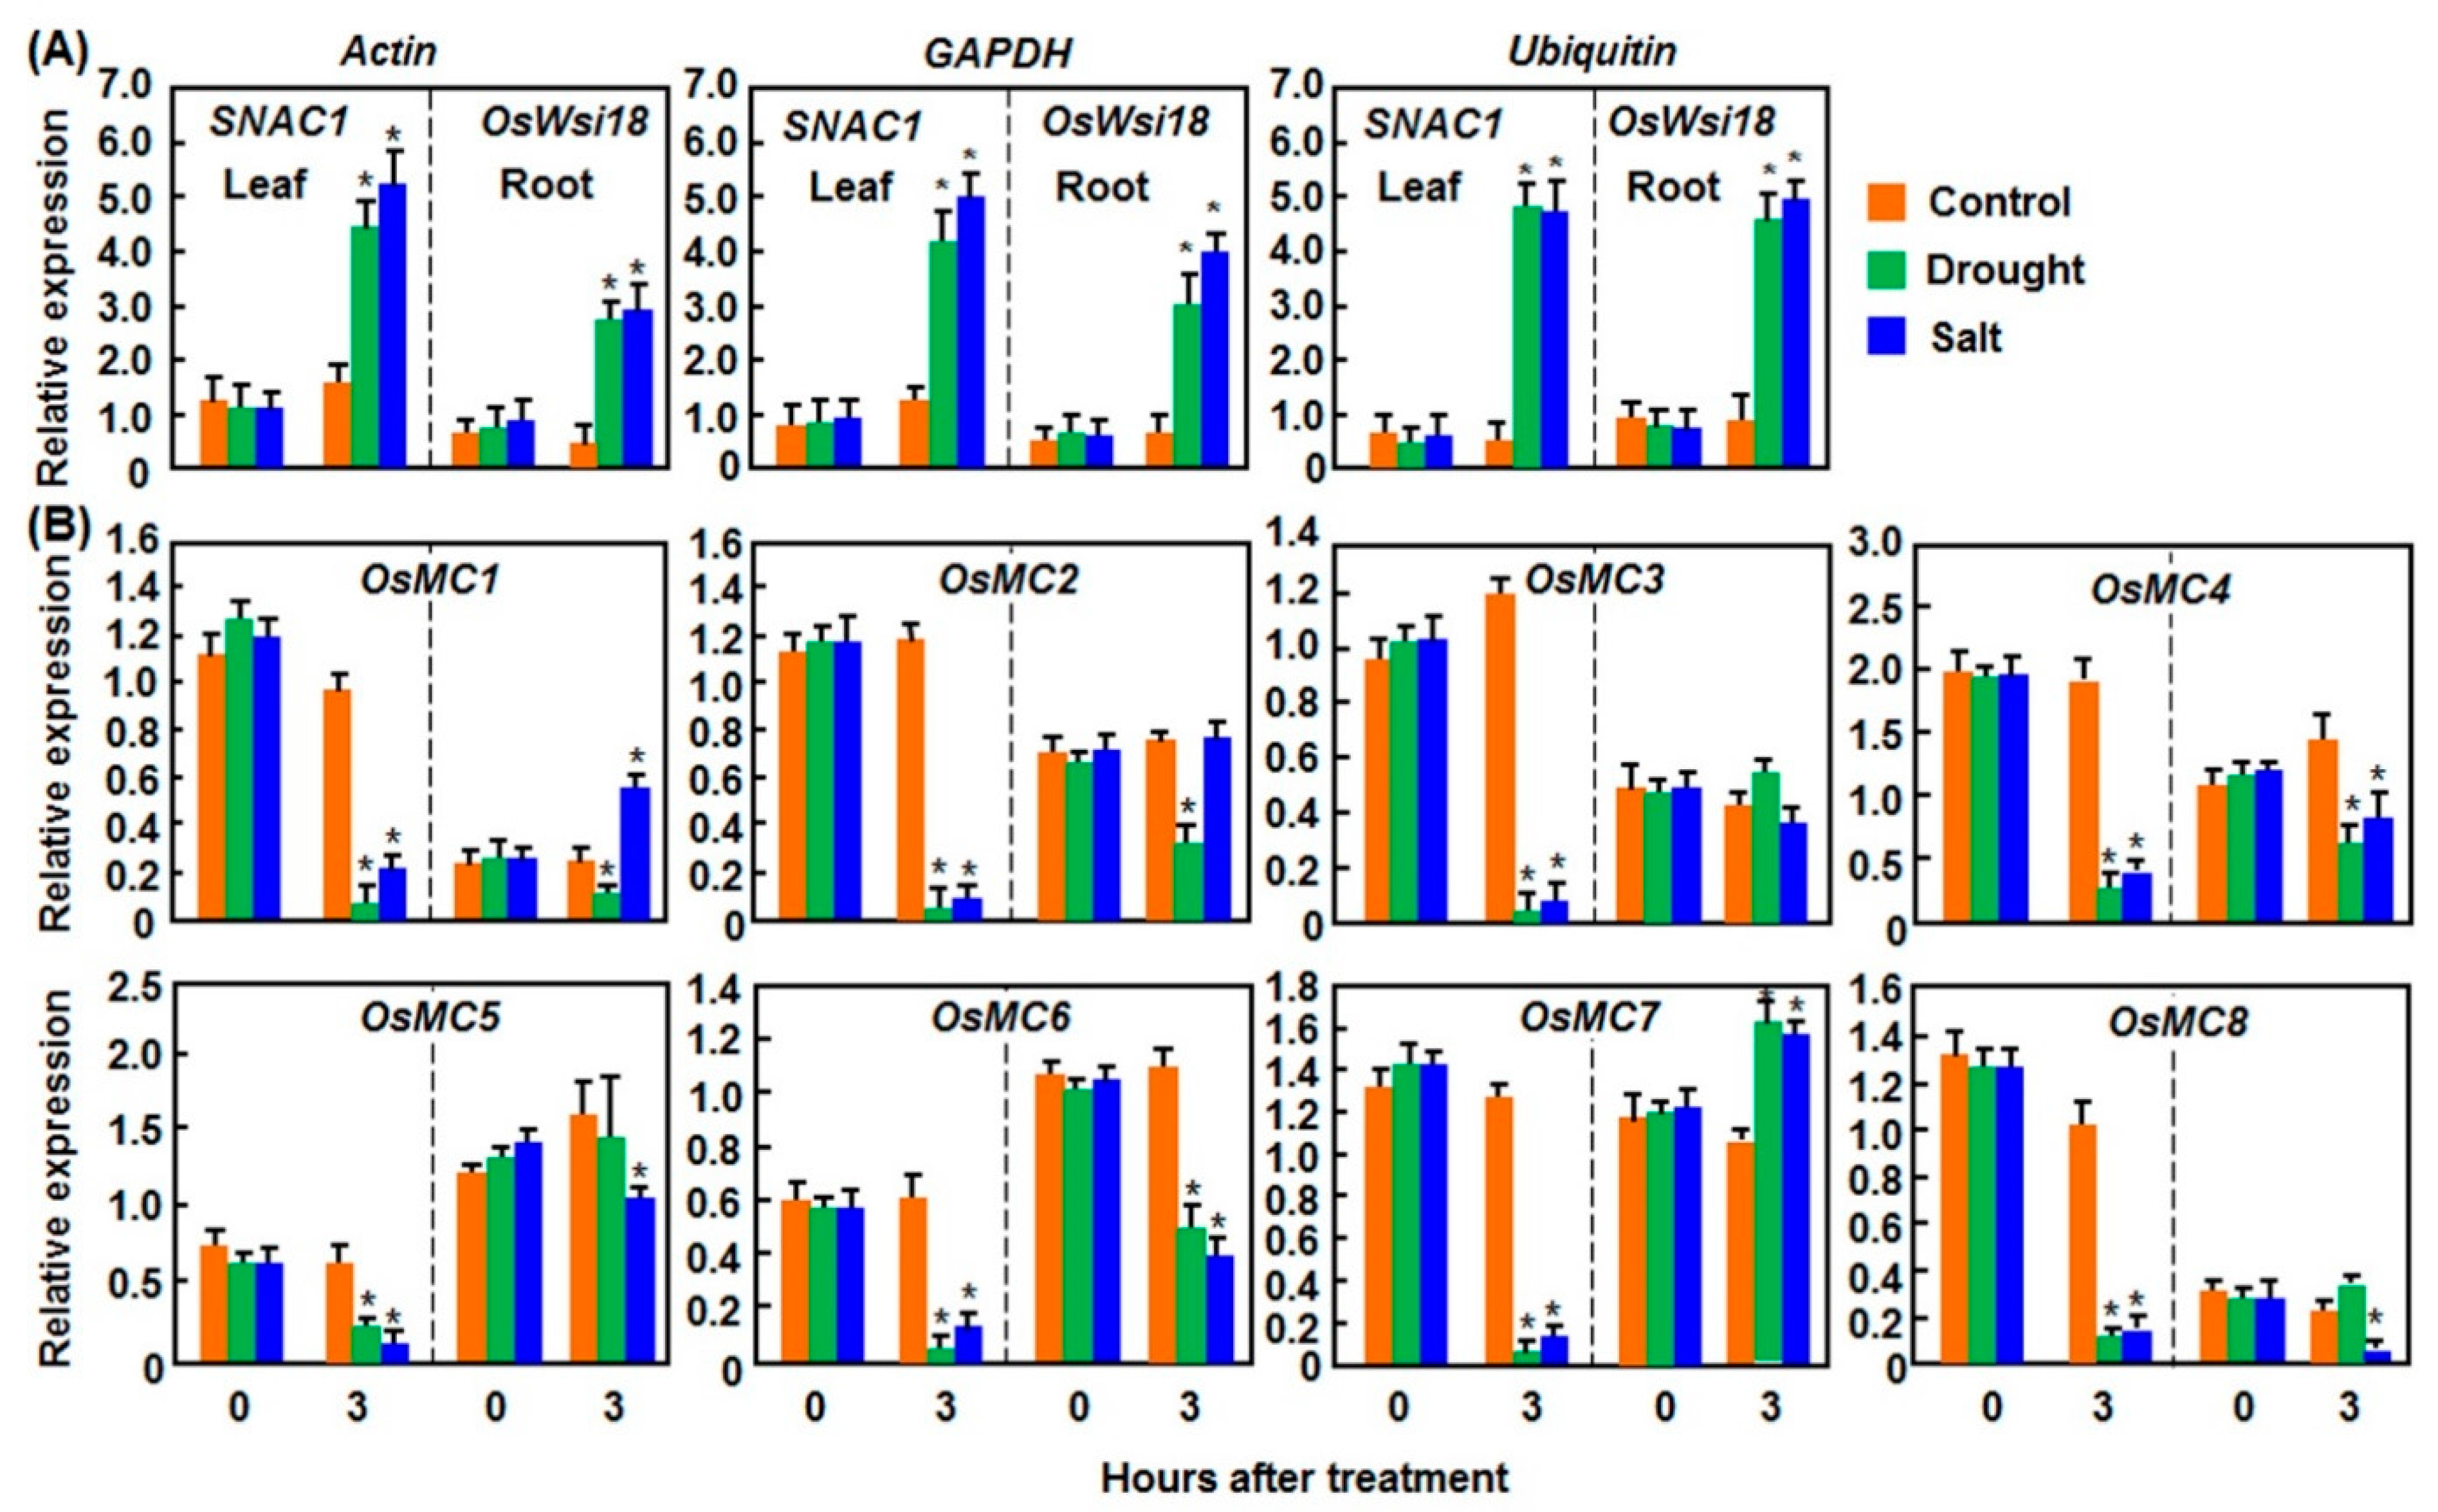
2.1. Expression Patterns of OsMCs in Response to Abiotic Stresses

Abiotic stresses such as dehydration (e.g., drought and salt) and extreme temperature (e.g., cold and heat) are the main deleterious factors affecting on plant growth/development and ultimately crop yield [39]. To explore the involvement of OsMCs in abiotic stresses, the expression patterns of OsMCs in rice plants after drought, salt, cold, and heat stresses were analyzed.

2.1.1. Expression Patterns in Response to Drought and Salt Stresses

We first analyzed the expression patterns of OsMCs in rice leaves and roots under drought and salt stresses (Figure 1). To assess the accuracy of qRT-PCR [40] and confirm the drought and salt stresses applied to the experimental rice plants, we examined the expression changes of SNAC1 (Stress-responsive NAC 1) in leaves and Wsi18 (Water stress-induced 18) in roots, which are drought- and salt-responsive in leaf and root tissues, respectively [41,42], after drought and salt stresses. As shown in Figure 1A, the expression of SNAC1 in leaf tissues of plants treated with drought or salt stress was significantly induced while the expression of OsWsi18 in root tissues of plants treated with drought or salt stress was also upregulated, as compared with corresponding controls in rice plants without stress treatment. Meanwhile, the expression levels of SNAC1 and OsWsi18 calculated with three different reference genes such as Actin, GAPDH, and Ubiquitin [43] exhibited similar patterns (Figure 1A). These indicated that the drought and salt treatments in our stress experiments were satisfactory for further analyses of the expression patterns of OsMCs in response to drought and salt stresses. In leaf tissues of rice plants treated with drought or salt stress, the expression levels of all OsMC genes were significantly downregulated at 3 h after treatment, leading to >3-fold of reduction, as compared with that in control plants without stress treatment (Figure 1B). However, the expressions of OsMCs in root tissues of rice plants treated with drought and salt stresses exhibited quite diverse patterns as compared with the patterns in leaf tissues. In drought stress-treated rice plants, only the expression of OsMC7 was slightly induced, while the expression of OsMC3, OsMC5, and OsMC8 was not affected (Figure 1B). By contrast, the expression levels of OsMC1, OsMC2, OsMC4, and OsMC6 were significantly decreased, leading to >1-fold of reduction, as compared with those in the control plants (Figure 1B). In salt stress-treated rice plants, the expression of OsMC2 and OsMC3 was not affected, whereas the expression levels of OsMC1 and OsMC7 were increased by approximately 1-fold (Figure 1B). By contrast, the expression levels of OsMC4, OsMC5, OsMC6, and OsMC8 were significantly decreased, as compared with those in control plants (Figure 1B).
Figure 1. Expression patterns of OsMCs in rice leaf and root tissues after treatment with drought and salt stresses. Drought stress was applied to two-week-old seedlings by transferring to three layers of filter papers for fast dehydration. Salt stress was applied to two-week-old seedlings by drenching with 150 mM NaCl solution. Leaf and root samples were collected at indicated time points for qRT-PCR analyses. (A) Expression patterns of SNAC1 and OsWsi18 calculated with different reference genes; and (B) Expression patterns of OsMCs. Relative expression is shown as folds of transcript level of different reference genes (A) or Actin gene (B). Left and right parts in each graph divided by dashed lines represent the expression levels in leaf and root tissues, respectively. Data presented are the means ± SD from thee independent experiments and * above the columns indicate significant difference at p < 0.05 level.
Ijms 16 16216 g001

2.1.2. Expression Patterns in Response to Cold and Heat Stresses

We next analyzed the expression patterns of OsMCs in rice leaves under cold and heat stresses (Figure 2). Similarly, we examined the expression changes of OsSRO1c (SIMILAR TO RCD ONE 1c) and OsHCI1 (Heat and cold induced 1), which were reported to be strongly induced by cold and heat stresses, respectively [44,45], after cold and heat stresses to confirm the stress treatment applied to the experimental rice plants. As shown in Figure 2A, the expression of OsSRO1c and OsHCI1 in leaf tissues of plants treated with cold and heat stresses was significantly induced, respectively, at 12 h after treatment, as compared with corresponding controls without stress treatment. The expression levels of OsSRO1c and OsHCI1 calculated with three different reference genes such as Actin, GAPDH, and Ubiquitin [43] exhibited similar patterns (Figure 2A). The data indicated that the cold and heat treatments were effective to the rice plants in our stress experiments, which were satisfied for analyses of the expression patterns of OsMCs in response to cold and heat stresses. In cold stress-treated plants, the expression level of OsMC4 was significantly induced, resulting in >4-fold of increase at 12 h after treatment, while the expression levels of OsMC3, OsMC5, and OsMC7 were decreased, as compared with those in the control plants (Figure 2B). The expression of OsMC1, OsMC2, OsMC6, and OsMC8 was not affected by cold stress (Figure 2B). In heat stress-treated plants, the expression levels of OsMC4 and OsMC7 were significantly decreased, giving >1-fold of reduction; whereas the expression levels of OsMC1, OsMC3, OsMC5, and OsMC6 were slightly induced (Figure 2B). By contrast, the expression of OsMC2 and OsMC8 was not affected by heat stress (Figure 2B).
Figure 2. Expression patterns of OsMCs in response to cold and heat stresses. Cold and heat stresses were applied by placing two-week-old seedlings in growth chambers with temperatures set at 4 and 42 °C, respectively. Leaf samples were collected at indicated time points for qRT-PCR analyses. (A) Expression patterns of OsSRO1c and OsHCI1 calculated with different reference genes; and (B) Expression patterns of OsMCs. Relative expression is shown as folds of transcript levels of three different reference genes (A) or Actin gene (B). Data presented are the means ± SD from thee independent experiments and * above the columns indicate significant difference at p < 0.05 level.
Ijms 16 16216 g002
Collectively, these data indicate that the expression of OsMCs display differential expression patterns upon different abiotic stresses and such differential expression may imply their involvement in different networks and have different biological functions.

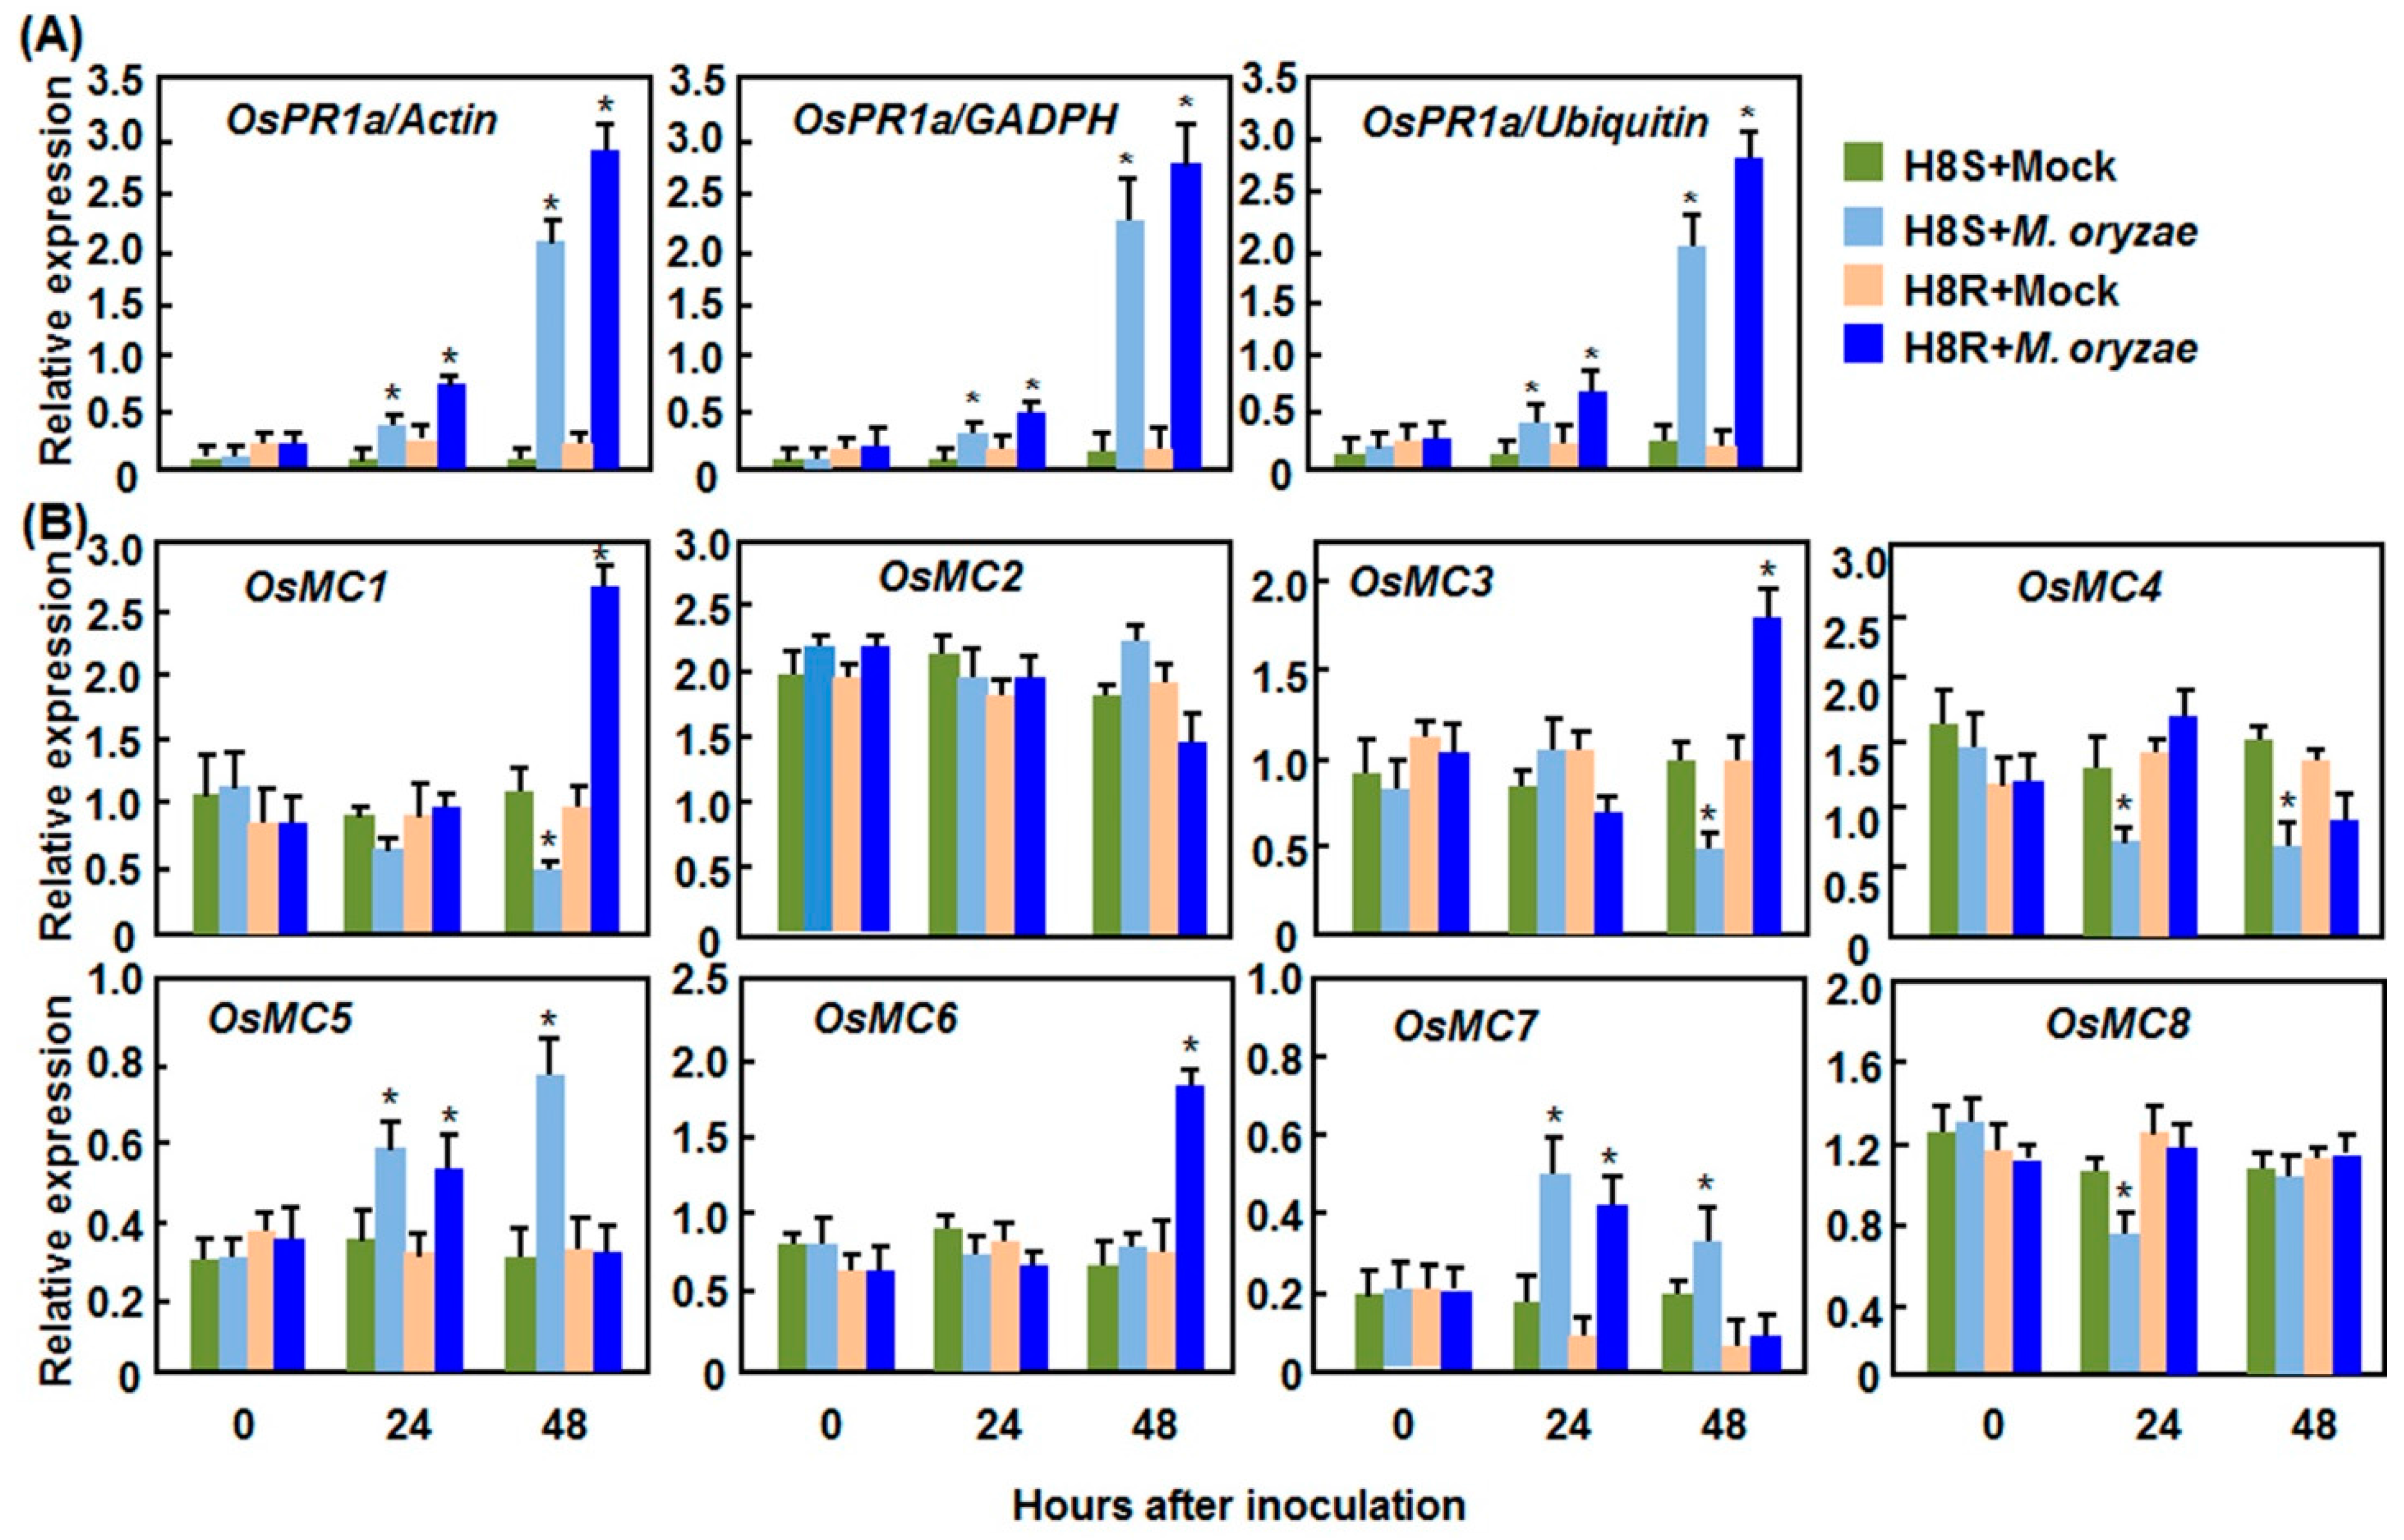
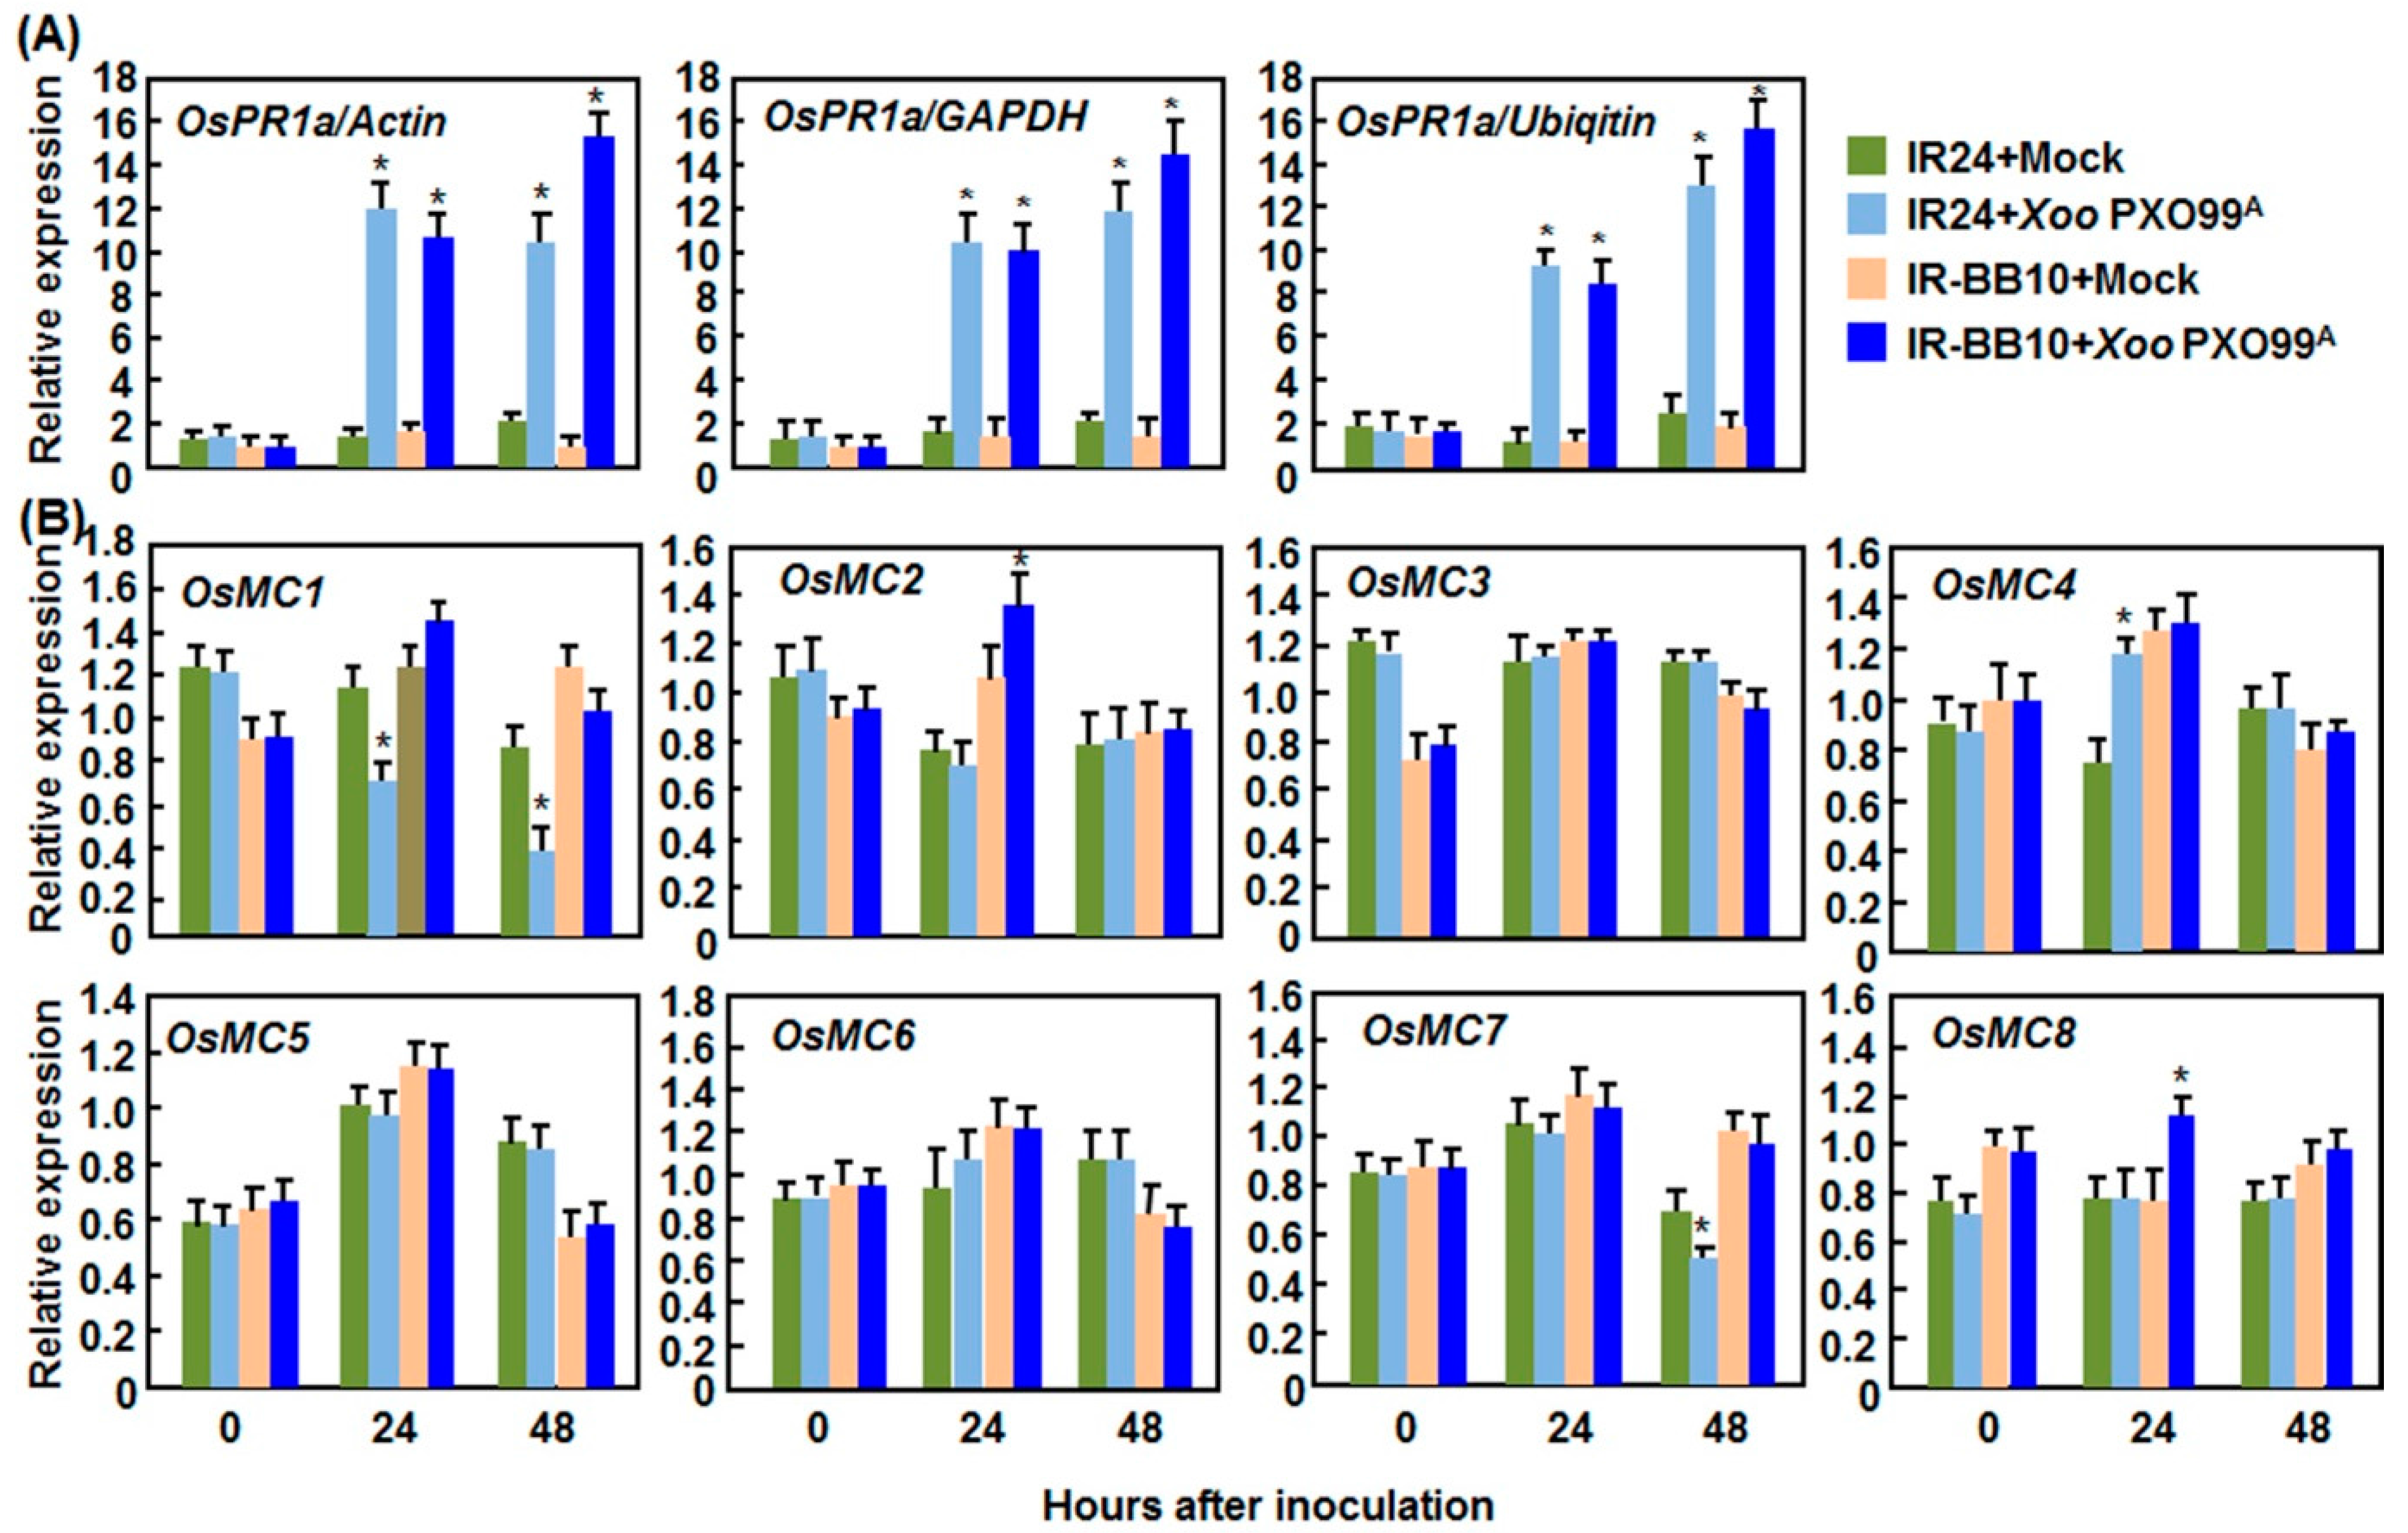
2.2. Expression Patterns of OsMCs in Response to Pathogens

To explore the possible involvement of OsMCs in response to biotic stress, we analyzed the expression patterns of the OsMCs genes in rice after infection with different types of pathogens. Rice blast disease caused by Magnaporthe oryzae and sheath blight disease caused by Rhizoctonia solani are two of the most important fungal diseases of rice, whereas the bacterial blight disease caused by Xanthomonas oryzae pv. oryzae (Xoo) is a major rice bacterial disease. Among the thee diseases chosen, M. oryzae and Xoo are generally (hemi)biotrophoic pathogens while R. solani is a typical necrotrophic fungus.

2.2.1. Expression Patterns in Response to M. oryzae

In rice-M. grisea interactions, a pair of near isogenic lines (NILs) H8R and H8S interact differentially with strain 85-14-B1 of M. oryzae, resulting in incompatible and compatible interactions, respectively [46]. We first confirmed the induction of defense response in incompatible and compatible interactions between rice and M. oryzae by analyzing the expression changes of known defense-related genes in rice plants after inoculation. As shown in Figure 3A, the expression levels of OsPR1a (Pathogenesis-related 1a), a well-known defense-related gene that is induced by M. oryzae [47], in both of the incompatible and compatible interactions were significantly increased at 48 h after inoculation. Meanwhile, typical disease symptom appeared in leaves of H8S plants while small restricted disease spots was observed on leaves of H8R plants at 3 days after inoculation. Similar expression patterns of OsPR1a were observed when calculated with three different reference genes such as Actin, GAPDH, and Ubiquitin [43] (Figure 3A). These data demonstrate the effectiveness and reliability of our pathogen inoculation experiments. As compared with those in the mock-inoculated plants, the expression levels of OsMC1, OsMC3, and OsMC6 were significantly induced in leaves of H8R plants at 48 h after inoculation, leading to 2~3-fold of increases, while the expression levels of OsMC1 and OsMC3 in H8S plants was decreased (Figure 3B). Similar expression patterns and dynamics were observed for OsMC5 and OsMC7 (Figure 3B). The expression of both OsMC5 and OsMC7 in incompatible and compatible interactions was induced at 24 h after inoculation; however, increased expression at 48 h after inoculation was only observed in compatible interaction (Figure 3B). Additionally, the expression of OsMC4 and OsMC8 was decreased only in compatible interaction (Figure 3B). The expression of OsMC2 was not affected by infection of M. grisea in both of the incompatible and compatible interactions (Figure 3B).
Figure 3. Expression patterns of OsMCs in incompatible and compatible interactions between rice and Magnaporthe oryzae. Two-week-old seedlings were inoculated by spraying with spore suspension of M. oryzae and leaf samples were collected at indicated time points after inoculation for qRT-PCR analyses. (A) Expression patterns of OsPR1a calculated with different reference genes; and (B) Expression patterns of OsMCs. Relative expression is shown as folds of transcript levels of three different reference genes (A) or Actin gene (B). Data presented are the means ± SD from thee independent experiments and * above the columns indicate significant difference at p < 0.05 level.
Ijms 16 16216 g003

2.2.2. Expression Patterns in Response to Xoo

In rice-Xoo interactions, a pair of NILs IR-BB10 and IR24 interact differentially with Xoo strain PXO99A, resulting in incompatible and compatible interactions, respectively [48]. Also, we examined the expression changes of defense-related genes as a sign of activation of defense response in incompatible and compatible interactions between rice and Xoo before analyzing the expression patterns of OsMCs. As shown in Figure 4A, the expression levels of OsPR1a, a defense-related gene that is induced by Xoo [49], both the incompatible and compatible interactions were significantly increased at 48 h after inoculation. Meanwhile, typical disease symptoms appeared in the inoculated leaves of IR-BB10 and IR24 plant at 7 days after inoculation, but the IR-BB10 plants showed a disease resistance phenotype with shorter lesions than the IR24 plants. Similar expression patterns of OsPR1a were observed when calculated with three different reference genes such as Actin, GAPDH, and Ubiquitin [43] (Figure 4A). These data demonstrate the effectiveness and reliability of our pathogen inoculation experiments. Surprisingly, the expression of most of the OsMC genes was not affected significantly in both of the IR-BB10 and IR24 plants after Xoo infection (Figure 4B). However, the expression levels of OsMC1 at 24 and 48 h and OsMC7 at 48 h were significantly decreased while the expression level of OsMC4 at 24 h was induced markedly in IR24 plants after Xoo infection, but the levels in IR-BB10 plants were not affected (Figure 4B). By contrast, the expression of OsMC2 and OsMC8 in IR-BB10 plants was induced significantly at 24 h after Xoo infection (Figure 4B).
Figure 4. Expression patterns of OsMCs in the incompatible and compatible interactions between rice and Xanthomonas oryzae pv. oryzae. Eight-week-old seedlings were inoculated with X. oryzae pv. oryzae strain PXO99A by leaf clipping method and leaf samples were collected at indicated time points after inoculation for qRT-PCR analyses. (A) Expression patterns of OsPR1a calculated with different reference genes; and (B) Expression patterns of OsMCs. Relative expression is shown as folds of transcript levels of three different reference genes (A) or Actin gene (B). Data presented are the means ± SD from thee independent experiments and * above the columns indicate significant difference at p < 0.05 level.
Ijms 16 16216 g004

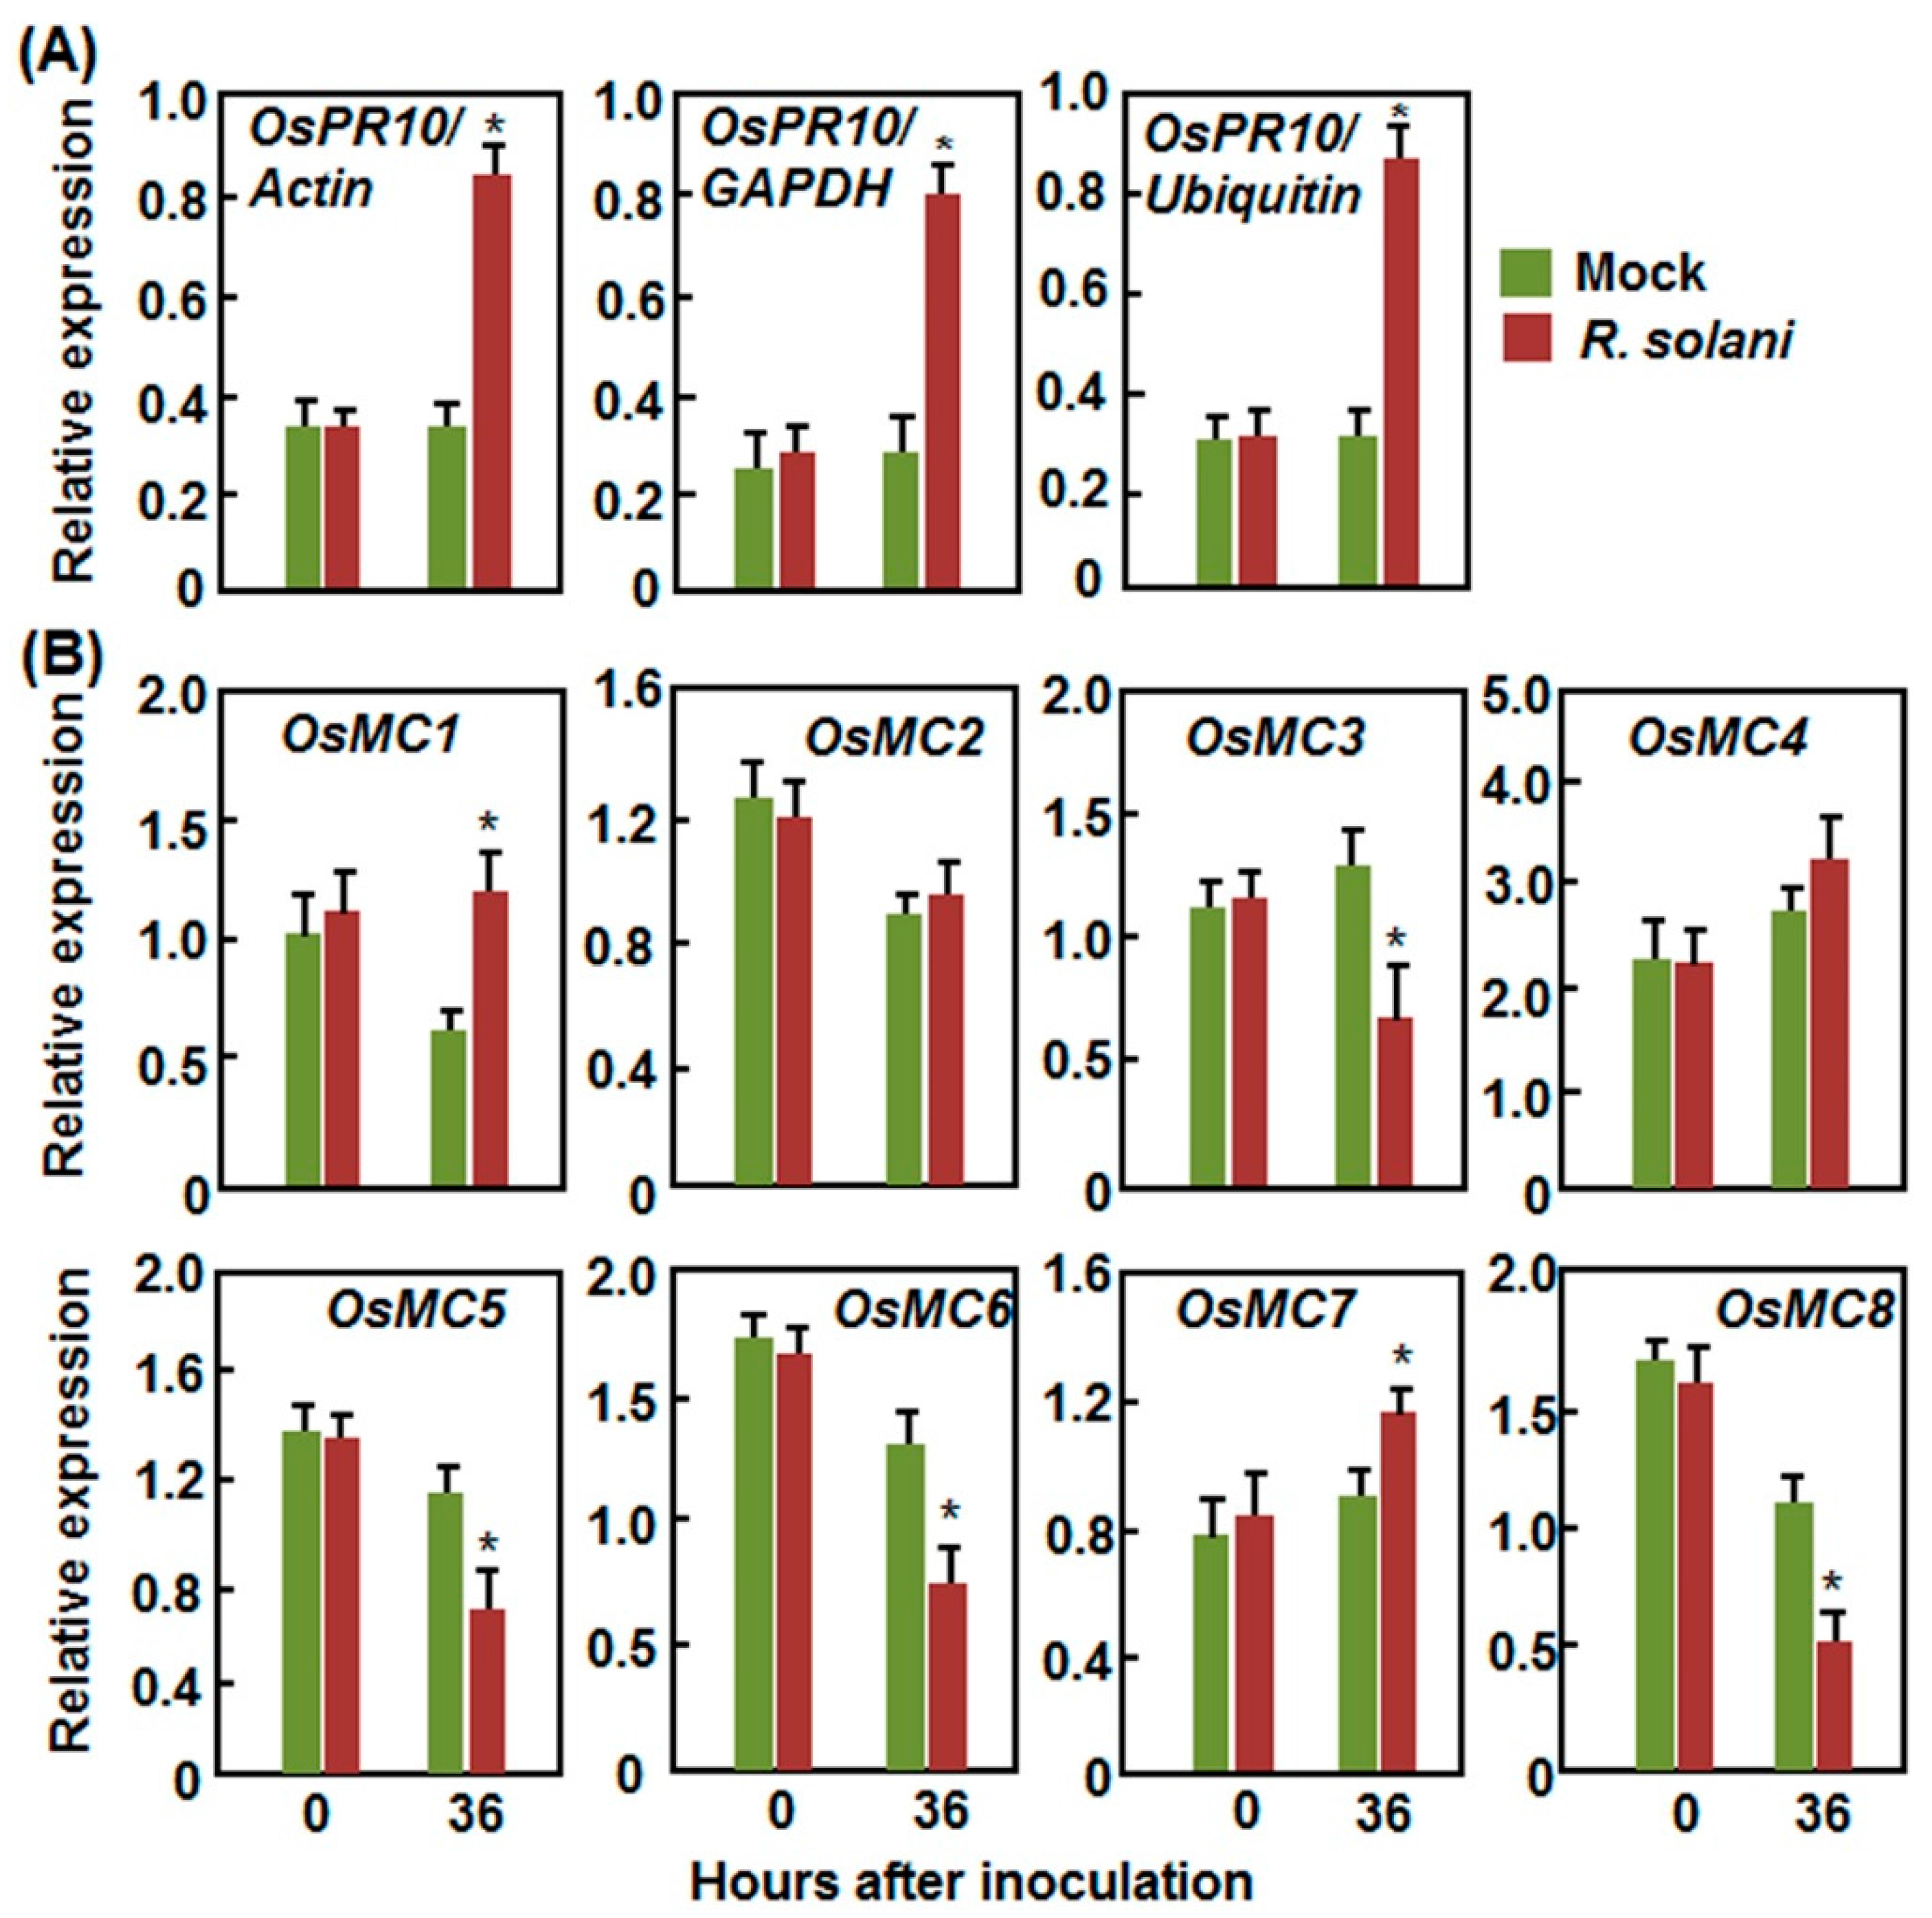
2.2.3. Expression Patterns in Response to R. solani

In rice-R. solani interaction, the expression level of OsPR10 (Pathogenesis-related 10), a defense-related gene that is induced by R. solani [50], was significantly increased by 2 folds at 36 h after inoculation, as compared with that in the mock-inoculated plants (Figure 5A). Similar expression patterns of OsPR10 were observed when calculated with three different reference genes such as Actin, GAPDH, and Ubiquitin [43] (Figure 5A). Therefore, the effectiveness and reliability of our pathogen inoculation experiments were satisfied for further analyses of expression of OsMCs in response to R. solani. Among the OsMCs, the expression of OsMC1 and OsMC7 was induced significantly by R. solani as compared with that in the mock-inoculation plants (Figure 5B). By contrast, the expression of OsMC3, OsMC5, OsMC6, and OsMC8 was downregulated by R. solani while the expression of OsMC2 and OsMC4 was not affected by R. solani (Figure 5B).
Together, these data indicate that the expression of OsMCs exhibit differential expression patterns in rice upon infections from different fungal and bacterial pathogens and such differential expression may imply their involvement in defense response to pathogens.
Figure 5. Expression patterns of OsMCs in response to Rhizoctonia solani. Six-week-old plants were inoculated by attaching mycelial of R. solani strain GD-118 onto sheath and leaf samples were collected at indicated time points after inoculation for qRT-PCR analyses. (A) Expression patterns of OsPR10 calculated with different reference genes; and (B) Expression patterns of OsMCs. Relative expression is shown as folds of transcript levels of three different reference genes (A) or Actin gene (B). Data presented are the means ± SD from three independent experiments and * above the columns indicate significant difference at p < 0.05 level.
Ijms 16 16216 g005

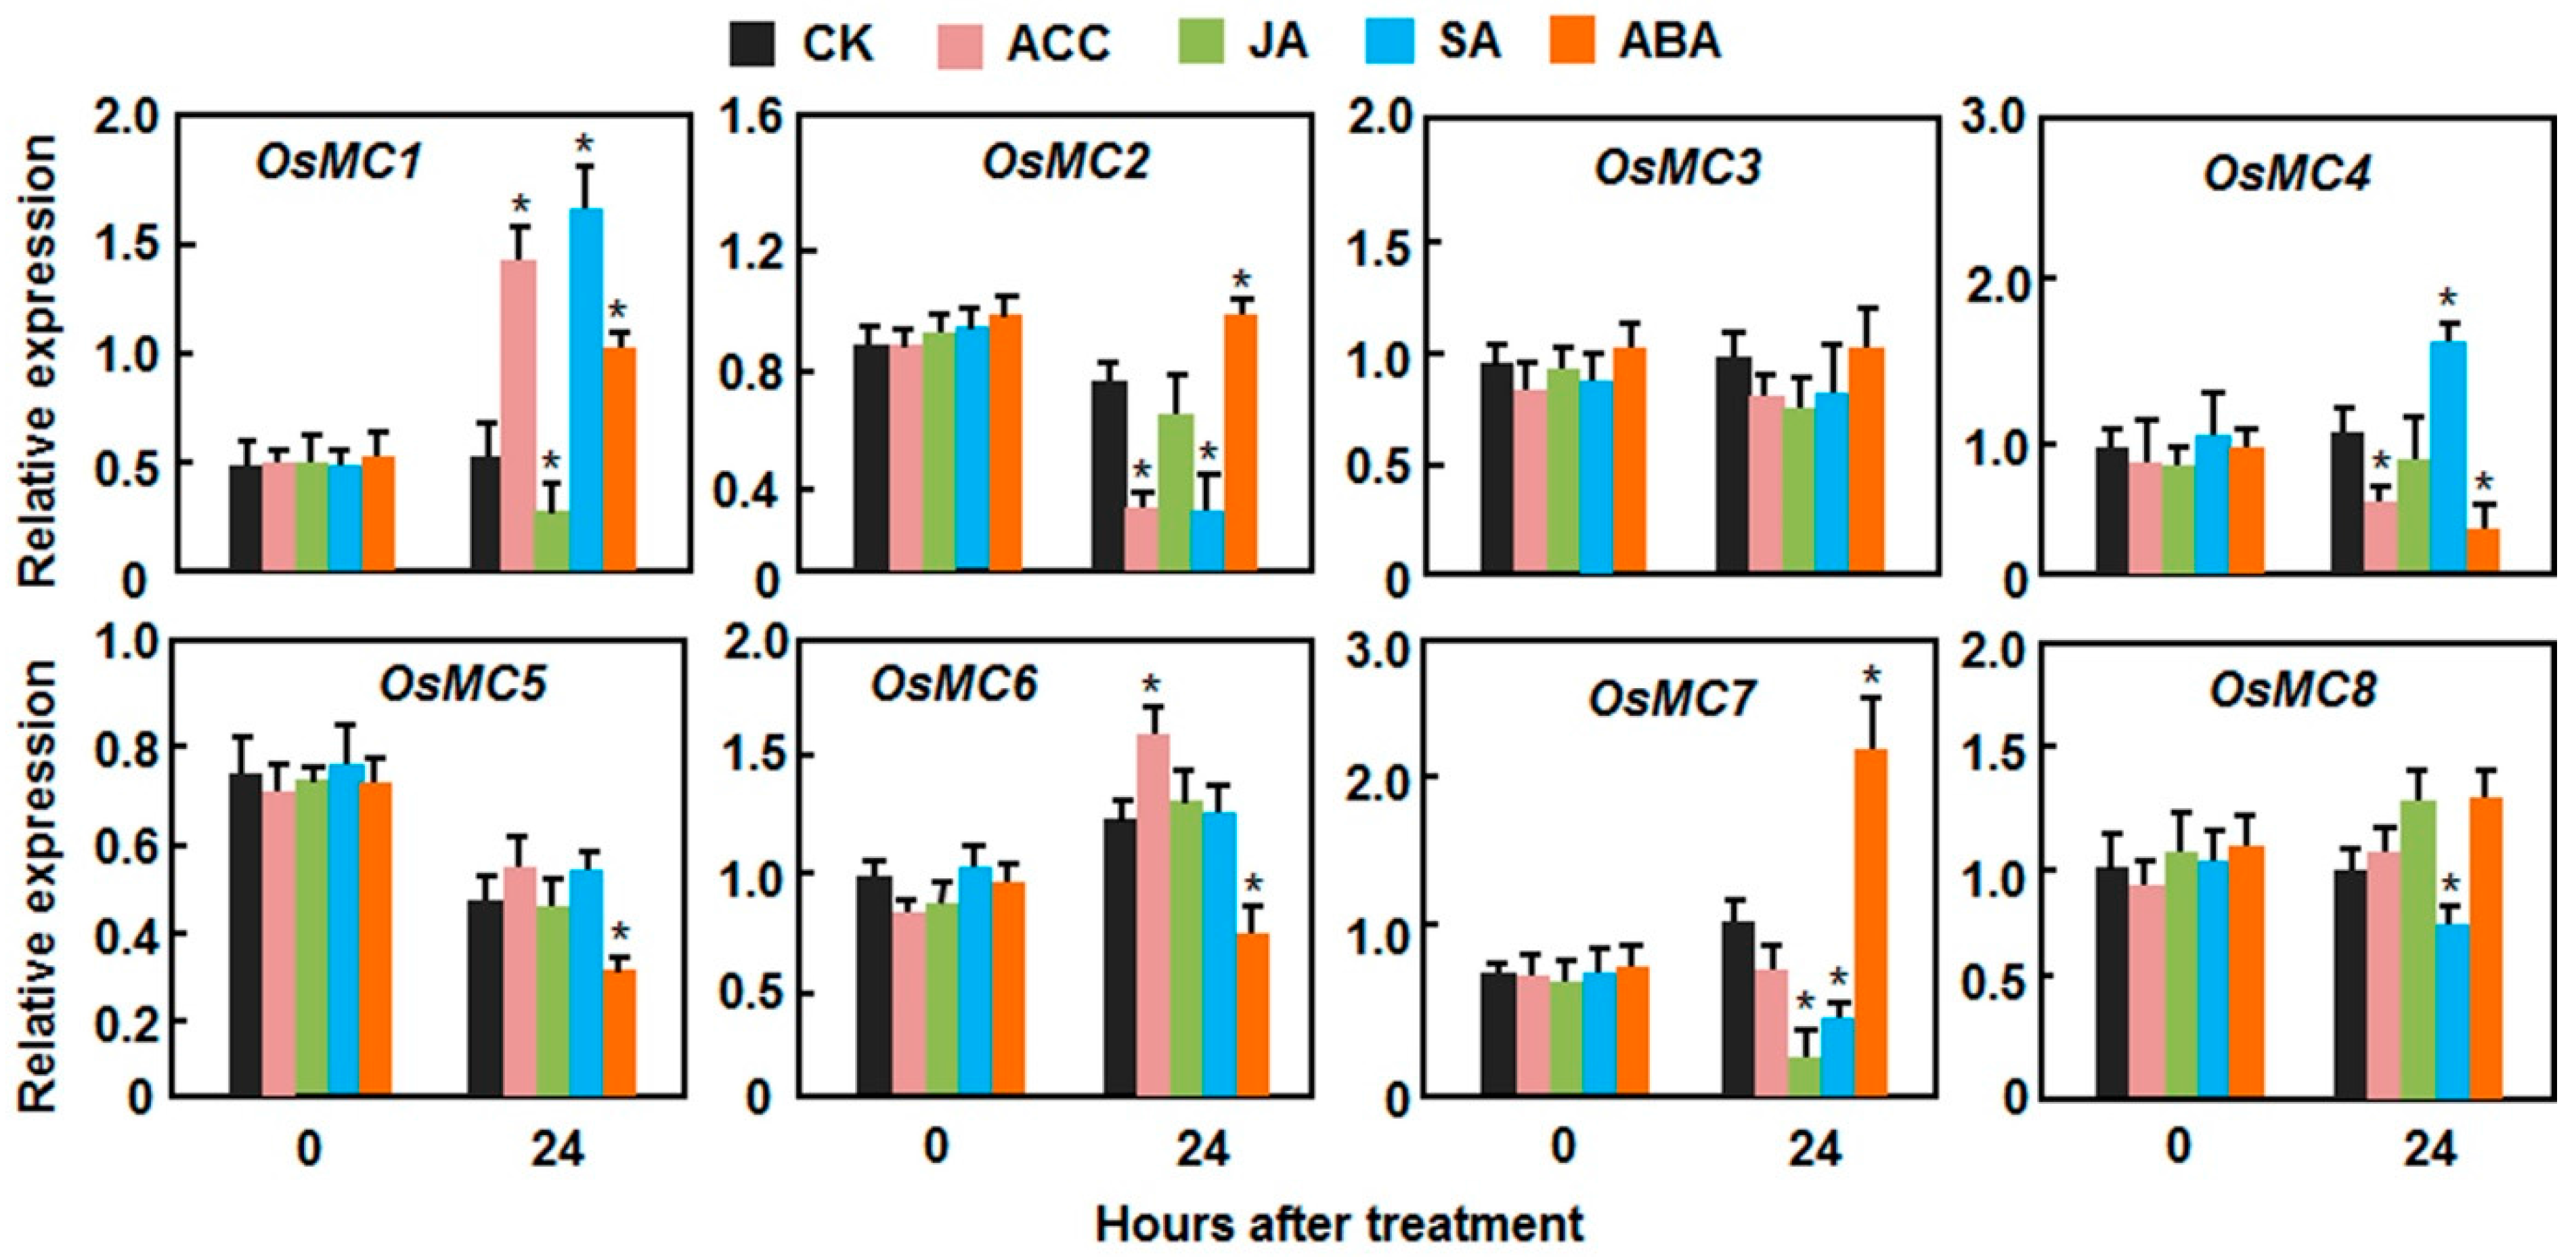
2.3. Expression Patterns of OsMCs in Response to Stress-Related Hormones

Abscisic acid (ABA), salicylic acid (SA), jasmonic acid (JA), and ethylene (ET) are well-known stress-related hormones in plants and are involved in abiotic and biotic stress responses [51,52,53,54]. The differential expression patterns of OsMCs in response to multiple abiotic and biotic stresses led us to examine the responsiveness of OsMCs to these stress-related hormones. As shown in Figure 6, the OsMC genes responded differentially as revealed by their expression changes in plants after treatment with ABA, SA, JA, or 1-amino cyclopropane-1-carboxylic acid (ACC, a precursor of ET). In ACC-treated plants, dramatic expression changes of OsMC1, OsMC2, OsMC4 and OsMC6 were observed (Figure 6). The expression levels of OsMC1 and OsMC6 were increased while the expression levels of OsMC2 and OsMC4 were decreased at 24 h after treatment (Figure 6). The expression of OsMC3, OsMC5, OsMC7, and OsMC8 was not affected by ACC treatment (Figure 6). After JA treatment, the expression levels of OsMC1 and OsMC7 were significantly decreased while the expression of OsMC2, OsMC3, OsMC4, OsMC5, OsMC6, and OsMC8 was not affected (Figure 6). In response to SA treatment, the expression levels of OsMC1 and OsMC4 were upregulated by 3- and 1.5-fold, respectively, whereas the expression levels of OsMC2, OsMC7, and OsMC8 were downregulated significantly by >1.5-fold (Figure 6). The expression of OsMC3, OsMC5, and OsMC6 was not affected by SA treatment (Figure 6). After ABA treatment, the expression levels of OsMC1, OsMC2, and OsMC7 were increased while the expression levels of OsMC4, OsMC5, and OsMC6 were decreased (Figure 6). The expression of OsMC3 and OsMC8 was not affected by ABA treatment (Figure 6). Taken together, the OsMC genes respond to multiple stress-related hormones with differential expression patterns, which may imply their relationships with the stress hormone-mediated signaling for their biological functions.
Figure 6. Expression patterns of OsMCs in response to stress-related hormones. Two-week-old seedlings were sprayed with 100 µM SA, 100 µM MeJA, 100 µM ACC, 100 µM ABA or similar volumes of solution as controls. Leaf samples were collected at indicated time points and relative expression of the genes is shown as folds of transcript level of the actin gene. Data presented are the means ± SD from thee independent experiments and * above the columns indicate significant difference at p < 0.05 level.
Ijms 16 16216 g006

2.4. Putative Cis-Elements in Promoter Regions of the OsMC Genes

To gain insights into the transcriptional regulation of the OsMC genes, putative cis-elements in the promoter regions were examined. A number of well-known cis-elements that are involved in growth/development and stress response were detected in the 1 kb upstream regions of the OsMC genes (Table 1). One MYB-related (S000176), one MYC-related (S000407) and one WRKY-related (S000447) cis-elements, which are known to be involved in abiotic and biotic stress responses [55,56], were found in the promoter regions of all OsMC genes. Two other WRKY-related (S000390 and S000457) cis-elements were also detected in the promoter regions of the OsMC genes except the OsMC6 (Table 1). The promoter regions of OsMC3, OsMC4, OsMC5, OsMC6, and OsMC8 further contain GCC-box (S000430), known recognition site for ERFs [57]. Three ABA-responsive cis-elements, ABRELATERD1 (S000414), ABREOSRAB21 (S000012), and ABRERATCAL (S000408), were found in the promoter regions of OsMC2, OsMC3, OsMC6, and OsMC8; however, the promoter regions of OsMC1, OsMC4, OsMC5, and OsMC7 do not contain known ABA-responsive cis-element (Table 1). Additionally, both of the OsMC1 and OsMC5 promoter regions harbor one NtBBF1motif (S000273), which is known to be auxin-responsive [58].
Table 1. Putative cis-elements in promoter regions of the OsMC genes.
RegulatorCis-ElementCodeNumbers of cis-Elements
OsMC1OsMC2OsMC3OsMC4OsMC5OsMC6OsMC7OsMC8
ABAABRELATERD1S0004142121
ABREOSRAB21S0000122
ABRERATCALS000408321
MYBMYBCORES00017624511211
MYCMYCCONSENSUSATS000407414844868
WRKYWBOXATNPR1S00039011143
WBOXNTERF3S0004572111216
WRKY710SS000447343461110
ERFGCCCORES00043031221
AuxinNTBBF1ARROLBS00027311

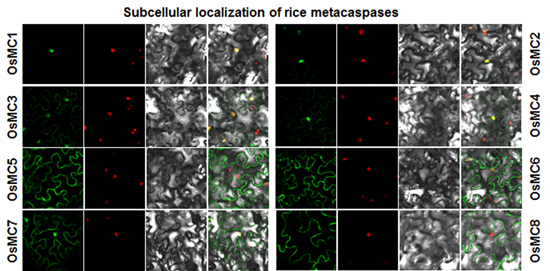
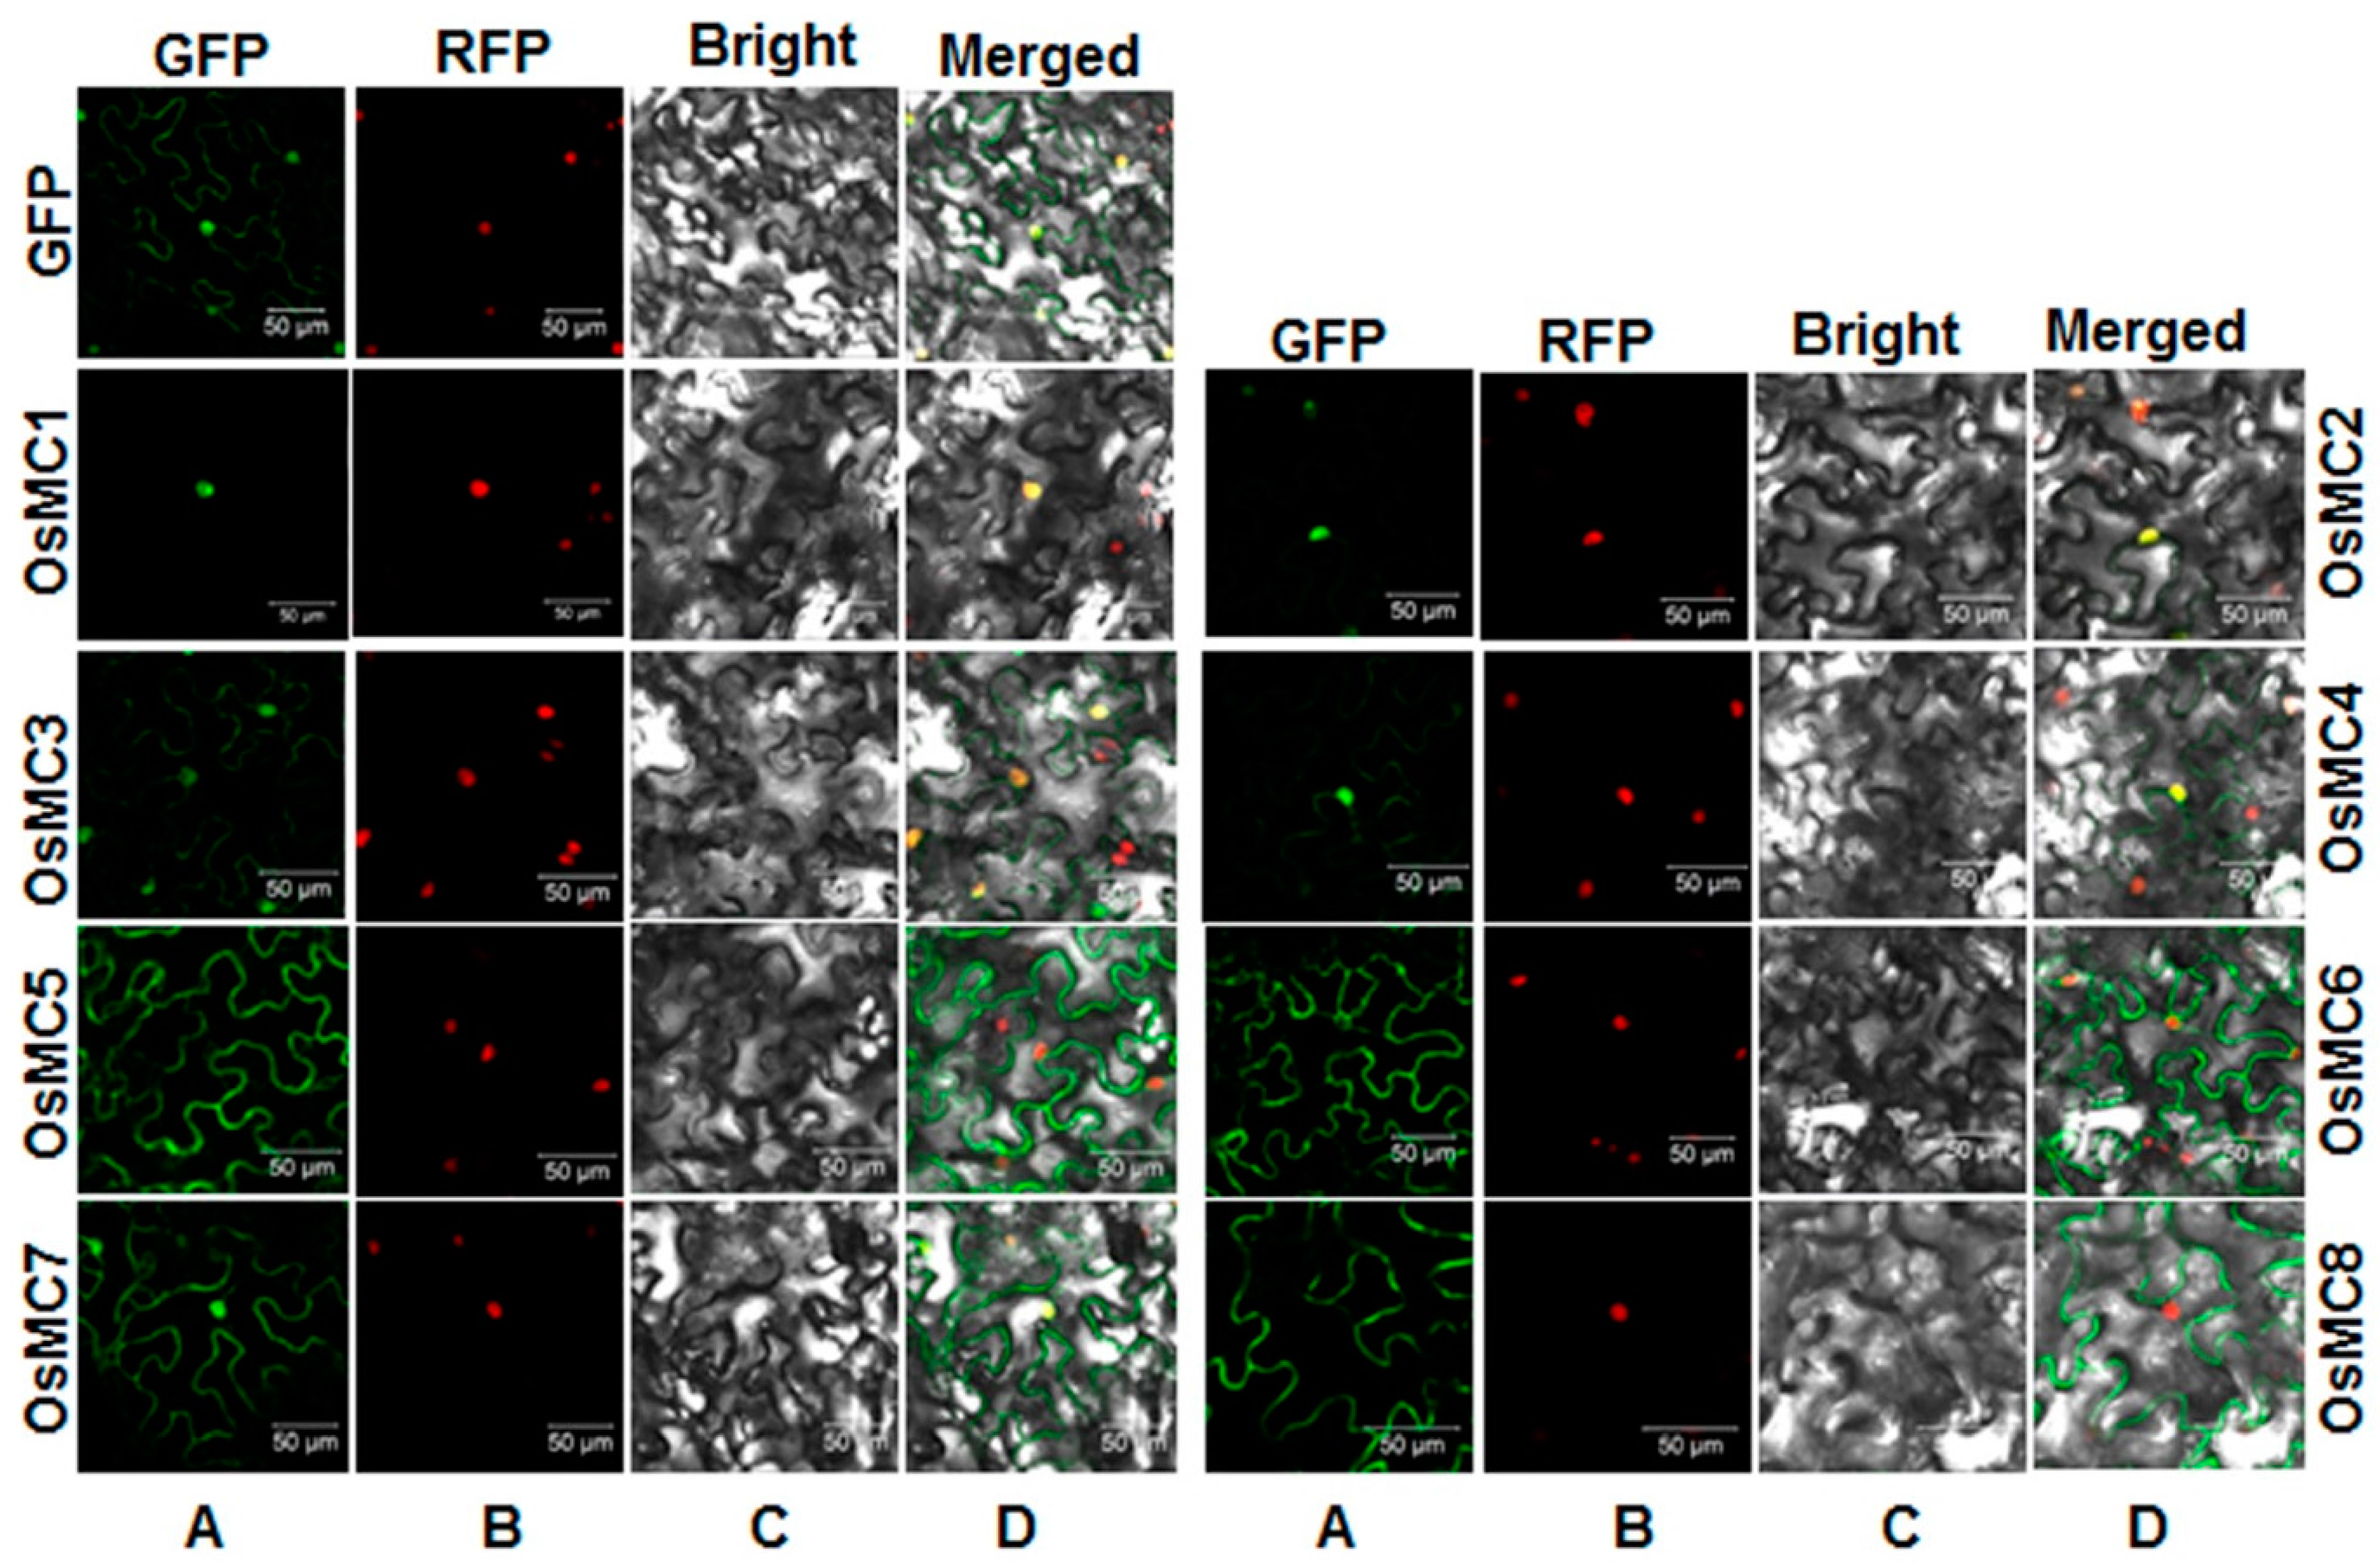
2.5. Subcellular Localization of OsMCs

To explore the subcellular localization of the OsMC proteins, we first searched putative nuclear localization signal (NLS) in the OsMC proteins by PSORT analysis. Putative NLSs were identified in OsMC1 and OsMC7, which contain NLS of RRRH and PVKGRRH sequences, respectively. No NLS was detected in OsMC2, OsMC3, OsMC4, OsMC5, OsMC6, and OsMC8 proteins. We then examined experimentally the subcellular localization of OsMC proteins though transient expression of GFP:OsMC fusions in leaves of Nicotiana benthamiana plants that expressed a red nuclear marker RFP–H2B protein [59]. Confocal laser scanning microscope observation at 48 h after agroinfiltration revealed that the GFP:OsMC1 fusion was solely localized to the nucleus, co-localized with the known nucleus marker RFP–H2B protein and the GFP:OsMC2 fusion was mainly localized in the nucleus with a very weak signal in the cytoplasm (Figure 7). The GFP:OsMC3, GFP:OsMC4 and GFP:OsMC7 fusions were found to distribute both in the cytoplasm and nucleus whereas the GFP:OsMC5, GFP:OsMC6, and GFP:OsMC8 fusions were exclusively localized in the cytoplasm without any localization in the nucleus (Figure 7). The GFP alone was detected in both the cytoplasm and nucleus. These results indicate that the OsMC proteins exhibit differential subcellular localization, which may be associated with their specific biological functions in the cells.
Figure 7. Subcellular localization of the OsMC proteins when transiently expressed in leaves of Nicotiana benthamiana. Agrobacteria harboring pFGC-OsMC1/2/3/4/5/6/7/8 or pFGC-Egfp were infiltrated into leaves of N. benthamiana plants expressing a red nucleus marker protein RFP-H2B and leaf samples were collected at 24 h after agroinfiltration. Images were observed and taken under a confocal laser scanning microscope in dark field for green fluorescence (A); red fluorescence (B); white field for cell morphology (C) and in combination (D), respectively. Bar = 50 µM.
Ijms 16 16216 g007

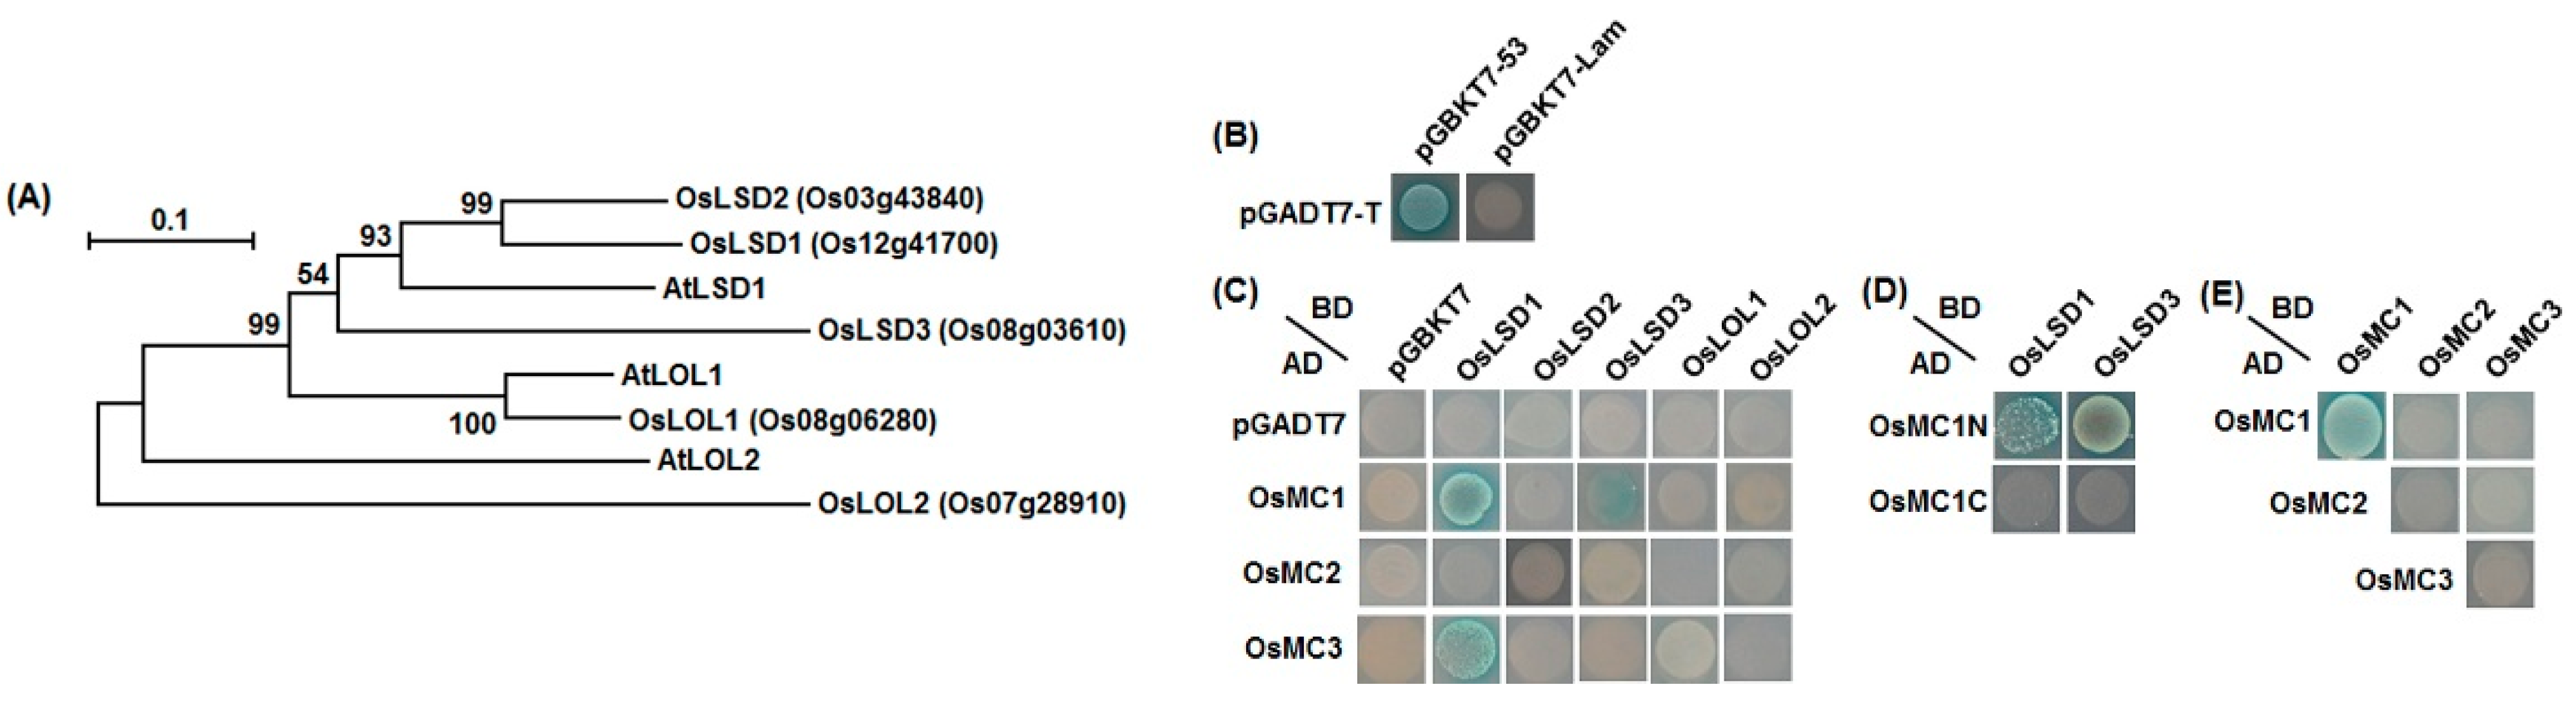
2.6. Interaction Relationships between Type I OsMCs and OsLSDs

It was previously reported that the Arabidopsis type I metacaspase AtMC1 interacted with AtLSD1 [35], a negative regulator of cell death [38]. To examine whether thee rice type I metacaspases, OsMC1, OsMC2, and OsMC3, can also interact with OsLSDs. In Arabidopsis, there are one AtLSD1 and two LSD One Like proteins (AtLOL1 and AtLOL2) [38,60]. Five putative AtLSD1 homologs were identified in rice genome [10,61] and the nomenclature for these proteins are somewhat confused in literatures. To avoid confusion in nomenclature for these genes, we generated a phylogenetic tree including the rice OsLSDs and OsLOLs and Arabidopsis AtLSD1 and AtLOLs and assigned unique names to them (Figure 8A). OsLOL1 (OsLSD1) and OsLOL2 were previously reported and found to function in PCD, disease resistance and growth [62,63,64]. In our yeast two hybrid experiments, a positive control (pGADT7-T + pGBKT7-53) and a negative control (pGADT7-T + pGBKT7-Lam) were always included to rule out possible false interactions (Figure 8B). As shown in Figure 8C, significant interactions between OsMC1 and OsLSD1/OsLSD3 and between OsMC3 and OsLSD1 were detected; no interaction in other pairwise combinations between OsMC1/2/3 and OsLSDs/OsLOLs was observed. Notably, OsMC2 did not interact with any of OsLSDs while OsLSD2 did not interact with all three type I metacaspases OsMC1, OsMC2, and OsMC3 (Figure 8C). We further examined which region of OsMC1 is responsible for the interaction activity with OsLSD1 and OsLSD3. As shown in Figure 8D, the N-terminal region (1-84 aa), which contains the conserved zinc finger domain, did interact with both of OsLSD1 and OsLSD3, but the C-terminal region of OsMC1 (85–368 aa), which lacked the conserved zinc finger domain, did not interact with OsLSD1 and OsLSD3, indicating that the zinc finger domain in OsMC1 is critical for its interaction activity with OsLSDs. Furthermore, we also examined whether these type I OsMCs interact with each other or itself. Self-interaction in OsMC1 was observed (Figure 8E). However, OsMC1, OsMC2, and OsMC3 did not interact to each other and OsMC2 and OsMC3 did not show self-interaction in yeast (Figure 8E).
Figure 8. Interactions between type I OsMCs and OsLSDs. (A) Phylogenetic tree of rice OsLSDs/OsLOLs with Arabidopsis AtLSD1/AtLOLs. Phylogenetic tree was constructed by Neighbor-joining method using MEGA program; The bar represents 0.1 amino acid substitution per site; (B) Positive (pGADT7-T + pGBKT7-53) and negative (pGADT7-T + pGBKT7-Lam) controls; (C) Interactions of OsMC1, OsMC2 and OsMC3 with OsLSD1 and OsLSD3 but not with OsLSD2, OsLOL1 and OsLOL2; (D) Interactions of N- and C-terminals of OsMC1 with OsLSD1 and OsLSD3; and (E) Interactions among OsMC1, OsMC2 and OsMC3. Yeasts harboring the indicated plasmid combinations were grown on selective medium SD/TrpLeuHisAde and β-galactosidase activity showing positive interactions was examined by addition of X-α-gal. Repeated experiments showed similar results. AD, pGADT7 vector; BD, pGBKT7 vector.
Ijms 16 16216 g008

3. Discussion

Although the rice OsMC family has been previously characterized [10,11], none of the family members has been studied for the biological function so far. The results presented in this study indicate that members of the OsMC family respond differentially to multiple abiotic and biotic stresses as well as to some well-known stress-related hormones. However, the responsiveness of the members of the OsMC family to these stresses or hormones varies to some extent. For example, OsMC1 was found to be induced by all of the stresses or hormones tested; while other OsMCs responded to less stresses or hormones (Figure 1, Figure 2, Figure 3, Figure 4, Figure 5 and Figure 6). Such differential stress- or hormone-related responsiveness may imply the specific involvement of the members of the OsMC family in different abiotic and biotic stress responses.
It was previously reported that the Arabidopsis AtMC1 and AtMC3, tomato LeMCA1, pepper CaMC9, wheat TaMCA4 and N. benthamiana NbMCA1 were significantly induced by infection from fungal or bacterial pathogens [27,28,29,30,32], indicating the importance of transcriptional regulation of metacaspase genes for the biological functions in plants. In the present study, we also found that infection with M. oryzae, Xoo, or R. solani, thee different pathogens with distinct infection styles, did cause transcriptional reprogramming in expression of the OsMC genes. For example, more than half of the OsMCs displayed differential expression in either compatible or incompatible interaction between rice and M. oryzae. Among these OsMCs, OsMC5, a type II metacaspase, was induced by the blast fungus in both compatible and incompatible interactions (Figure 3) but not by SA and JA (Figure 6), two well-known signaling molecules in defense responses. This is in accordance with a previous observation from RNA-Seq analysis of rice samples infected with M. grisea [65]. On the other hand, some of the OsMCs exhibited differential expression patterns in different rice-pathogen interactions. For example, OsMC1 was found to be induced by the blast fungus in the incompatible interaction of rice-M. oryzae (Figure 3) and by SA (Figure 6); however, its expression was downregulated in the incompatible interaction of rice-Xoo (Figure 4). Further, OsMC7 showed a higher level of expression in compatible rice-M. oryzae interaction (Figure 3) but was downregulated by SA and JA (Figure 6), whereas its expression was not affected dramatically in interactions of rice-Xoo and rice-R. solani (Figure 4 and Figure 5). The differential expression of OsMC1 and OsMC7 in response to different pathogens may be attributed to different mechanisms that are used by M. grisea, Xoo, and R. solani during their infection processes [66]. This is similar to the observations that OsEDR1 was found to play opposite roles in the rice-M. oryzae and rice-Xoo interactions [67].
Diverse abiotic stresses have been found to induce PCD and the abiotic stress-induced PCD significantly affects plant growth and development [68]. It was found that abiotic stress-induced PCD is often accompanied with accumulation of reactive oxygen species (ROS) [68]. In fact, ROS and other abiotic factors such as ultraviolet light and ozone were reported to induce expression of metacaspase genes in Arabidopsis and maize [26,31]. In the present study, we found that, like the responsiveness to pathogens, members of the OsMC family also respond differentially to dehydration (drought and salt) and extreme temperature (cold and heat) stresses. Interestingly, expression of most OsMC genes was downregulated by drought and salt stresses (Figure 1 and Figure 2). Some of the OsMC genes exhibited overlapping expression patterns under different abiotic stress conditions, indicating their possible involvement in diverse abiotic stress responses. For example, the expression of the OsMC genes in leaf tissues was significantly downregulated by drought and salt stresses (Figure 1). However, the downregulated expression patterns of OsMCs in leaf tissues are not well correlated with the patterns in the root tissues (Figure 1). This is in agreement with the observations that some of the transcriptional factor genes exhibited distinct expression patterns in leaf and root tissues under abiotic stress conditions [69,70]. Furthermore, the drought and salt stress-caused differential expression patterns of some OsMCs are correlated with the patterns in rice plants treated with ABA (Figure 1, Figure 2 and Figure 6), which is believed to play critical roles in response to drought and salt stresses [51,52]. For example, the expression of OsMC4 was suppressed by drought and salt stresses (Figure 1) and also was suppressed by ABA (Figure 6). On the other hand, opposite expression patterns of OsMCs under abiotic stress conditions were also observed. For example, the expression of OsMC4 was induced by cold stress but suppressed by heat stress, whereas the expression of OsMC5 was suppressed by cold stress but induced by heat stress (Figure 2), indicating opposite roles for OsMC4 and OsMC5 in extreme temperature stresses.
Notably, the range of changes in the expression of OsMCs in response to abiotic and biotic stress varied greatly. For example, expression of OsMC1, OsMC3, and OsMC6 was induced by 2–3-fold in leaves inoculated with an incompatible strain of M. oryzae (Figure 3), whereas the expression changes of some OsMCs in response to pathogens or abiotic stress were less than 2-fold (Figure 1, Figure 2, Figure 3, Figure 4and Figure 5). Similar results were also observed for the expression changes of MC genes in other plants; for example, 3–4-fold induction for CamC9 in pepper leaves inoculated with Xanthomonas campestris pv. vesicatoria [28], ~5-fold upregulation for TaMC4 in wheat leaves challenged with the avirulent race of Puccinia striiformis f. sp. tritici [29], ~1.5-fold induction for NbMCA1 in N. benthamiana leaves infected with Colletotrichum destructivum [30] and ~1-fold change for TaeMCAII in wheat under heat stress [71]. The difference in the expression changes among the OsMC genes in response to different pathogens may be explained by the possibility that both of the transcriptional and post-transcriptional regulations are required for the functions of OsMCs in given abiotic ad biotic stress responses [16,17].
Several features on the subcellular localization and protein-protein interactions provide valuable information on the mode of action of OsMCs. In the present study, we examined the subcellular localization of all members in the OsMC family and our results indicate that the members of this family exhibit diverse subcellular localization. The OsMC1 protein contains a predicted NLS with sequence of RRRH and was found to be localized in nucleus (Figure 7). This is further supported by the interaction between OsMC1 and OsLSD1 (Figure 8), whose homolog in Pisum sativa, PsLSD1, was shown to be a nucleus-localized protein [72]. Further experiments are required to examine the in vivo OsMC1-OsLSD1 interaction and whether such interaction takes place in the nucleus. OsMC7, along with OsMC3 and OsMC4, were evenly distributed in the cells (Figure 7), although OsMC7 contains a putative NLS sequence. Interestingly, OsMC5, OsMC6, and OsMC8 were found to be exclusively localized in the cytoplasm without any localization in the nucleus (Figure 7). However, it was previously reported that the Arabidopsis AtMC9 is present in apoplast, nucleus and cytoplasm [14] and its subcellular localization can be changed from an even cytoplasmic localization in living cells to patches or aggregates of different sizes in cells during late autolysis [33]. Thus, whether dynamics in subcellular localization upon developmental and stress signals are the case for the OsMC proteins needs to be examined further. On the other hand, the type I metacaspase, OsMC1 interacted with OsLSD1 and OsLSD3 while OsMC3 only interacted with OsLSD1 (Figure 8). The N-terminal LSD1-type zinc finger domain in OsMC1 is responsible for the interaction activity with OsLSD1 and OsLSD3 (Figure 8). This is in agreement with the interactions between AtMC1 and AtLSD1 [35]. Furthermore, OsMC1 was found to interact with itself while OsMC2 and OsMC3 did not (Figure 8), indicating possible different modes of action for these type I metacaspases.

4. Materials and Methods

4.1. Plant Materials and Growth

Rice (Oryza sativa L.) cv. Yuanfengzao and two NIL pairs (provided by Dr. Zuhua He, Shanghai Institute of plant physiology and ecology, Chinese Academy of Sciences, Shanghai, China) were used in this study for different purposes. The cv. Yuanfengzao was used for analyses of gene expression in response to abiotic stress, hormone treatments, and infection by R. solani. The pair of NILs H8S and H8R was used for analysis of gene expression in compatible and incompatible interactions between rice and M. oryzae race ZB1 (provided by Mr. Rongyao Chai, Zhejiang Academy of Agricultural Sciences, Hangzhou, China) while the pair of NILs IR-BB10 and IR24 (provided by International Rice Research Institute, Los Banos, the Philippines) was used for analysis of gene expression in compatible and incompatible interactions between rice and X. oryzae pv. oryzae (Xoo) strain PXO99A (provided by Dr. Jean Leach, Colorado State University, Fort Collins, CO, USA). The rice plants were grown in a growth room under a 14-h light/10-h dark cycle at 26 °C.

4.2. Treatments with Abiotic Stress and Hormones

Two-week-old cv. Yuanfengzao seedlings were treated with varied abiotic stresses or hormones. Drought stress was applied by transferring the hydroponically cultivated seedlings to thee layered filter papers for fast dehydration. Salt stress treatment was achieved by drenching 150 mM NaCl (Sinopharm Chemical Reagents Co., Shanghai, China) solution to the rice seedlings. For cold stress, seedlings were transferred to a growth chamber at 4 °C. Heat stress was applied by transferring the seedlings to a chamber with temperature at 42 °C. Leaf samples were harvested for all four abiotic stress treatments and root samples were only collected for drought and salt treatments. For hormone treatment, seedlings were sprayed with 100 µM ABA, 100 µM methyl jasmonate (MeJA) (Sigma-Aldrich, St. Louis, MO, USA), 100 µM ACC (Sigma-Aldrich, St. Louis, MO, USA), 150 µM SA (Sigma-Aldrich, St. Louis, MO, USA) in a solution containing 0.1% ethanol (Sinopharm Chemical Reagents Co., Shanghai, China) and 0.02% Tween-20 (Sinopharm Chemical Reagents Co., Shanghai, China) or with the solution as controls. All samples were stored at −80 °C until use.

4.3. Inoculation with Different Pathogens

M. oryzae strain 85-14B1 was cultivated on complete medium at 25 °C for 10 days and spores were collected to prepare inoculum. Two-week-old H8S and H8R seedlings at thee leaf stages were inoculated spraying with 5 × 10⁵ conidia/mL spore suspension containing 0.02% Tween-20 or with similar volume of solution containing only 0.02% Tween-20 as mock-inoculation controls [46]. Inoculated plants were kept under moist conditions in the dark at room temperature for 24 h and then moved to a growth chamber (12 h 28 °C light/12 h 24 °C dark). Xoo strain PXO99A was grown in NA broth at 28 °C with shaking and cells were collected by centrifugation and diluted in distilled water to OD600 = 0.8. Eight-week-old IR-BB10 and IR24 plants were inoculated using leaf clipping method [73]. R. solani strain GD-118 (provide by Dr. Weiliang Chen, Zhejiang University, Hangzhou, China) was grown in 250 mL of potato dextrose broth medium and incubated on a 28 °C shaker for 3 days and the culture was centrifuged to collect the mycelia. Six-week-old cv. Yuanfengzao plants were inoculated by closely attaching mycelial balls (8 mm in diameter) on the sheath with aluminium foil [74]. Mock-inoculation control plants were only inoculated by attaching aluminium foil onto sheath without mycelial balls. Samples were collected from pathogen-inoculated and mock-inoculated plants at indicated time points and stored at –80 °C until use.

4.4. qRT-PCR Analysis of Gene Expression

Total RNAs were extracted from frozen samples using TRIzol reagent (Invitrogen, Shanghai, China) and then treated with RNase-free DNase (TaKaRa, Dalian, China). First-strand cDNA was synthesized from 1 μg total RNA using AMV reserves transcriptase (TaKaRa, Dalian, China) according to the manufacturer’s instructions. According to the previously suggested guidelines [40,75], thee different reference genes were used to assess the accuracy of qRT-PCR data and no template controls were always included in qRT-PCR experiments. Each qRT-PCR reaction contained 12.5 µL of SYBR premix Ex Taq (TaKaRa, Dalian, China), 1 µL of cDNA samples and 10 µM gene-specific primers (Table 2) in a final volume of 25 µL and was performed on a CFX96 Real-time System (Bio-Rad, Hercules, CA, USA). The relative gene expression data were calculated using the 2−ΔΔCt method. Rice Actin (accession number KC140129), GAPDH (accession number AK062215) and Ubiquitin (accession number AK059011) genes were used as internal reference controls. Thee independent biological replicates were conducted for all experiments.
Table 2. Primers used in this study.
PrimersSequences (5′-3′)Size (bp)
Cloning of cDNAs
OsMC1-FATGGATCACTTCGGCGGACG1107
OsMC1-RTTACAGGACGAACGGCTTGC
OsMC2-FATGGCGAGCGCGAGGCCGCC1110
OsMC2-RTCACAAGAGGAAGGGCTTCC
OsMC3-FATGGGCTGCAACTGCCTCGT1203
OsMC3-RTCACAGGAGAAACGGTTTCC
OsMC4-FATGGGGCGGAAGAGAGCGGT1230
OsMC4-RTTAGCATATGAAAGCCACGT
OsMC5-FATGGGGGGCCGGAAGCGCGC1263
OsMC5-RTCAGCATATGAAGGCCACAC
OsMC6-FATGGGCCGCAAGCGCGCGCT1254
OsMC6-RTCAGCATATAAAAGACACAT
OsMC7-FATGGAGAGGGGTCAGAAGAA1026
OsMC7-RTCAGAGCGCCGTCATGGCCT
OsMC8-FATGGCGGTCGTCAGCGGCGG909
OsMC8-RTCACAGGATAAACTGCTCCT
OsLSD1-FATGTGCATTGCTGAACCAAT606
OsLSD1-RTCAGCTGCTGGGCTTCTGGT
OsLSD2-FATGGTGGCTTCAAGAGCTCCA444
OsLSD2-RCTATCCTAGACTGAAAAGCA
OsLSD3-FATGCAGAGCCAGATCGTGT519
OsLSD3-RTTACTTTTTACCACCAGTTGTA
OsLSD4-FATGCAGAGCCAGATCGTGTG561
OsLSD4-RCTATTTCCCAGTTGTAACTCCA
OsLSD5-FATGCAGGACCAGCTGATCTG444
OsLSD5-RTCATCTTTTCCATGAGGTGAC
Subcellular Localization Assays
OsMC1-GFP-FCGCGGATCC ATGGATCACTTCGGCGGACG1107
OsMC1-GFP-RTGCTCTAGA TTACAGGACGAACGGCTTGC
OsMC2-GFP-FCGCGGATCC ATGGCGAGCGCGAGGCCGCC1110
OsMC2-GFP-RTGCTCTAGA TCACAAGAGGAAGGGCTTCC
OsMC3-GFP-FCGCGGATCC ATGGGCTGCAACTGCCTCGT1203
OsMC3-GFP-RTGCTCTAGA TCACAGGAGAAACGGTTTCC
OsMC4-GFP-FCGCGGATCC ATGGGGCGGAAGAGAGCGGT1230
OsMC4-GFP-RTGCTCTAGA TTAGCATATGAAAGCCACGT
OsMC5-GFP-FCGCGGATCC ATGGGGGGCCGGAAGCGCGC1263
OsMC5-GFP-RTGCTCTAGA TCAGCATATGAAGGCCACAC
OsMC6-GFP-FCGCGGATCC ATGGGCCGCAAGCGCGCGCT1254
OsMC6-GFP-RTGCTCTAGA TCAGCATATAAAAGACACAT
OsMC7-GFP-FCGCGGATCC ATGGAGAGGGGTCAGAAGAA1026
OsMC7-GFP-RTGCTCTAGA TCAGAGCGCCGTCATGGCCT
OsMC8-GFP-FCGCGGATCC ATGGCGGTCGTCAGCGGCGG909
OsMC8-GFP-RTCCCCCGGG TCACAGGATAAACTGCTCCT
qRT-PCR Assays
OsMC1-RT-FGCTTCATCAAGGCGGTGGAGTG142
OsMC1-RT-RAAGTTGGCGACCTTGCGGATG
OsMC2-RT-FCGACCCGTACAGGGTGCCGA166
OsMC2-RT-RGCACAGCGCCTCGTCGTAGC
OsMC3-RT-FGGCTCCTTCGTCCGCAAGAT101
OsMC3-RT-RCACAGGAGAAACGGTTTCCTGT
OsMC4-RT-FTCGACGTTCGTGGAGATGCTC126
OsMC4-RT-RATTCACGAGCCGCCTGATCTT
OsMC5-RT-FGTGCCAGACCGACCAGACAT102
OsMC5-RT-RCCGCTCTTCTCCGACAGGAT
OsMC1-RT-FGCTTCATCAAGGCGGTGGAGTG142
OsMC1-RT-RAAGTTGGCGACCTTGCGGATG
OsMC6-RT-FCCACACCGCAGGGTTCTTCAT147
OsMC6-RT-RGTCCAGGCTGCTGAGTGTATCC
OsMC7-RT-FATACAGACCGTGCTGGCGTC143
OsMC7-RT-RAGGAATGGCGTCTCGGCGTT
OsMC8-RT-FTCCGGCAAGTGCCTCGTAAC150
OsMC8-RT-RCAATGCGGTCGGTCACAGGAT
Yeast Two-Hybrid Assays
OsMC1-BD-FCGGAATTC ATGGATCACTTCGGCGGACGT1107
OsMC1-BD-RCGCGGATCC TTACAGGACGAACGGCTTGCG
OsMC2-BD-FCCGGAATTC ATGGCGAGCGCGAGGCCG1110
OsMC2-BD-RCGCGGATCC TCACAAGAGGAAGGGCTTC
OsMC3-BD-FCCGGAATTC ATGGGCTGCAACTGCCTCGTC1203
OsMC3-BD-RCGCGGATCC TCACAGGAGAAACGGTTTCC
OsMC1-BDN-RTGCTCTAGA CTTGCCGCGGGAGCCCGGGA252
OsMC1-BDC-FCGCGGATCC AAGCGCGCCGTCCTGATCGGC855
OsLSD1-AD-FCCGGAATTC ATGTGCATTGCTGAACCAAT606
OsLSD1-AD-RCGCGGATCC TCAGCTGCTGGGCTTCTGGT
OsLSD2-AD-FCCGGAATTC ATGGTGGCTTCAAGAGCTCCA444
OsLSD2-AD-RCGCGGATCC CTATCCTAGACTGAAAAGCA
OsLSD3-AD-FCCGGAATTC ATGCAGAGCCAGATCGTGT519
OsLSD3-AD-RCGCGGATCC TTACTTTTTACCACCAGTTGTA
OsLSD4-AD-FCCGGAATTC ATGCAGAGCCAGATCGTGTG561
OsLSD4-AD-RCGCGGATCC CTATTTCCCAGTTGTAACTCCA
OsLSD5-AD-FCCGGAATTC ATGCAGGACCAGCTGATCTG444
OsLSD5-AD-RCGCGGATCC TCATCTTTTCCATGAGGTGAC

4.5. Subcellular Localization of the OsMC Proteins

The coding sequences of the OsMC genes was amplified using gene-specific primers (Table 2) and cloned into pMD-19T (Takara, Dalian, China) by T/A cloning, yielding plasmids pMD-19T-OsMC1/2/3/4/5/6/7/8. After confirmation by sequencing, the coding sequences were amplified from plasmids pMD-19T-OsMC1/2/3/4/5/6/7/8 with gene-specific primers containing restriction enzyme sites and cloned into pFGC-Egfp at the corresponding restriction enzyme sites, yielding pFGC-OsMC1/2/3/4/5/6/7/8. The recombinant plasmids pFGC-OsMC1/2/3/4/5/6/7/8 and the pFGC-Egfp empty vector were transformed into Agrobacterium tumefacies strain GV3101 by electroporation using GENE PULSER II Electroporation System (Bio-Rad Laboratories, Hercules, CA, USA). Agrobacteria harboring pFGC-OsMC1/2/3/4/5/6/7/8 and pFGC-Egfp were grown in YEP medium (50 µg/mL rifampicin, 50 µg/mL kanamycin and 25 µg/mL gentamicin) for 24 h with continuous shaking at 28 °C, collected by centrifugation and resuspended in infiltration buffer (10 mM MgCl2, 10 mM MES, 200 µM acetosyringone, pH 5.7). Agrobacteria carrying pFGC-OsMC1/2/3/4/5/6/7/8 or pFGC-Egfp empty vector were infiltrated into leaves of 4-week-old N. benthamiana plants expressing a red nuclear marker RFP-Histone 2B protein [56] using 1 mL needless syringes and the agroinfiltrated plants were grown in a growth room at 25 °C for 48 h. Fluorescence signals were excited at 488 nm and detected using a 500–530 nm emission filter preformed with Zeiss LSM 780 confocal laser scanning microscope (Carl Zeiss, Jena, Germany).

4.6. Yeast Two-Hybrid Interaction Assays

Protein-protein interactions between OsMCs and OsLSDs were examined though yeast two-hybrid assay using Matchmaker Gold Yeast Two-Hybrid System according to the manufacturer’s instructions. The coding sequences of OsMC1/2/3 were amplified using gene-specific primers (Table 2) from pMD-19T-OsMC1/2/3 and inserted into pGBKT7, yielding pGBKT7-OsMC1/2/3 bait vectors or inserted into pGADT7, yielding pGADT7-OsMC1/2/3 prey vectors. The sequences for the N-terminal (1–84 aa) and C-terminal (85–368 aa) regions of the OsMC1 gene were also amplified from pMD-19T-OsMC1 with gene-specific primers (Table 2) and cloned into pGBKT7, yielding pGBKT7-OsMC1N and pGBKT7-OsMC1C vectors. The coding sequences of the OsLSD genes was amplified using gene-specific primers (Table 2) and cloned into pM D-19T (Takara, Dalian, China), yielding plasmids pMD-19T-OsLSD1/2/3 and pMD-19T-OsLOL1/2. After confirmation by sequencing, the coding sequences were amplified from plasmids pMD-19T-OsLSD1/2/3 and pMD-19T-OsLOL1/2 with gene-specific primers containing restriction enzyme sites and cloned into pGADT7, yielding pGADT7-OsLSD1/2/3 and pGADT7-OsLOL1/2 prey vectors. The bait and prey vectors in different combinations were co-transformed into Y2HGold yeast cells and confirmed by colony PCR. The transformed yeasts were cultivated on SD/TrpLeuHisAde medium for 3 days at 30 °C and added with X-α-gal (5-bromo-4chloro-3-indolyl-a-d-galactopyranoside) solution to examine the activity of β-galactosidase. Interactions were evaluated based on the growth situation of the transformed yeast cells on the SD/TrpLeuHisAde medium and the production of blue pigment after the addition of X-α-Gal. Yeasts co-transformed with pGBKT7-53 or pGBKT7-Lam and pGADT7-T were as positive and negative controls, respectively.

4.7. Bioinformatics Analysis of Cis-Element in the Promoters of the OsMC Genes

Approximately 1000 bp sequences upstream of the transcriptional start site of each OsMC genewere downloaded from the rice genome sequence database at the Rice Genome Annotation Project (http://rice.plantbiology.msu.edu). Putative cis-elements in the promoter regions were identified by searching against the PLACE cis-element database at http://www.dna.affrc.go.jp/PLACE/signalscan.html.

4.8. Accession Numbers

Sequences of the OsMC genes used in this study were obtained from the Rice Genome Annotation Database (http://rice.plantbiology.msu.edu/) under the following identifiers: OsMC1 (LOC_Os03g27120), OsMC2 (LOC_Os03g27210), OsMC3 (LOC_Os03g27170), OsMC4 (LOC_Os05g41660), OsMC5 (LOC_Os05g41670), OsMC6 (LOC_Os01g58580), OsMC7 (LOC_Os11g04010), OsMC8 (LOC_Os03g27190), OsLOL1 (LOC_Os08g06280), OsLOL2 (LOC_Os07g28910), OsLSD1 (LOC_Os12g41700), OsLSD2 (LOC_Os03g43840) and OsLSD3 (LOC_Os08g03610).

5. Conclusions

As the first step toward understanding of the functions of OsMCs, the present study was focused on the possible involvement of OsMCs in abiotic and biotic stress responses though comprehensive analysis of the expression changes in rice plants treated with different abiotic stresses, three different pathogens and four well-known stress-related hormones. Our data indicate that members of the OsMC family respond differentially to multiple abiotic and biotic stresses as well as to stress-related hormones, as summarized in Table 3. Based on the expression patterns, OsMC1, OsMC7, and OsMC8 may have functions in interactions with M. oryzae, Xoo, and R. solani, while OsMC3, OsMC5, and OsMC6 seem to be involved in interaction with fungal pathogens such as M. oryzae and R. solani. OsMC4 responds in compatible interactions with M. oryzae and Xoo while OsMC2 specifically responds in incompatible rice-Xoo interaction. OsMC4, OsMC6, and OsMC7 in root tissues respond with similar patterns under drought and salt stresses. OsMC2 is specifically downregulated by drought stress while OsMC5 and OsMC8 are specifically downregulated by salt stress. OsMC1 showed opposite expression patterns in response to drought and salt stresses, whereas OsMC3 did not show expression change in these two stresses. OsMC3, OsMC4, and OsMC5 displayed opposite expression patterns in response to heat and cold stresses, respectively, while expression of OsMC7 is downregulated by both heat and cold stresses. OsMC1 and OsMC6 are upregulated by heat stress but not by cold stress. Importantly, our data revealed that the OsMC proteins have different subcellular localizations and type I metacaspases OsMC1 and OsMC3 can interact with OsLSD1 or OsLSD3. Results from this systematic analysis of the OsMC family not only provide evidence for the possible involvement of OsMCs in response to abiotic and biotic stresses, but also provide clues for further functional analysis of OsMCs genes in stress tolerance and pathogen resistance in rice.
Table 3. Summary on the expression patterns of OsMCs in response to pathogens, abiotic stresses and hormones.
GenesM. oryzaeXooR. solaniAbiotic StressHormones
CompatibleIncompatibleCompatibleIncompatibleDroughtSaltHeatColdACCJASAABA
OsMC1----
OsMC2----------------
OsMC3----------------
OsMC4--------
OsMC5------------
OsMC6------------
OsMC7----
OsMC8----------------
↑, represents significant upregulation; ↓, indicates significant downregulation; -- indicates no significant change. Expression patterns in root under drought and salt stresses are listed.

Acknowledgments

We thank Zuhua He, Institute of Plant Physiology and Ecology, Shanghai Institutes for Biological Sciences, Chinese Academy of Sciences, for providing the rice materials and Rongyao Chai, Zhejiang Academy of Agricultural Science, for providing the strain of M. oryzae. This work was supported by the National Natural Science Foundation of China (No. 31272028), National R & D Project of Transgenic Crops of the Ministry of Agriculture of China (No. 2011ZX08009-003-001), the National High-Tech R & D Program (No. 2012AA101505) and National Research Foundation for the Doctoral Program of Higher Education of China (No. 20120101110070).

Author Contributions

Lei Huang and Fengming Song designed the study. Lei Huang, Huijuan Zhang, Yongbo Hong, Shixia Liu, and Dayong Li performed the experiments. Fengming Song performed data interpretation and wrote the manuscript with Lei Huang.

Conflicts of Interest

The authors declare no conflict of interest.

References

  1. Kroemer, G.; El-Deiry, W.S.; Golstein, P.; Peter, M.E.; Vaux, D.; Vandenabeele, P.; Zhivotovsky, B.; Blagosklonny, M.V.; Malorni, W.; Knight, R.A.; et al. Classification of cell death: Recommendations of the nomenclature committee on cell death. Cell Death Differ. 2005, 12, 1463–1467. [Google Scholar] [CrossRef] [PubMed]
  2. Kerr, J.F.; Wyllie, A.H.; Currie, A.R. Apoptosis: A basic biological phenomenon with wide-ranging implications in tissue kinetics. Br. J. Cancer 1972, 26, 239–257. [Google Scholar] [CrossRef] [PubMed]
  3. Cohen, G.M. Caspases: The executioners of apoptosis. Biochem. J. 1997, 326, 1–16. [Google Scholar] [PubMed]
  4. Kitanaka, C.; Kuchino, Y. Caspase-independent programmed cell death with necrotic morphology. Cell Death Differ. 1999, 6, 508–515. [Google Scholar] [CrossRef] [PubMed]
  5. Kroemer, G.; Martin, S.J. Caspase-independent cell death. Nat. Med. 2005, 11, 725–730. [Google Scholar] [CrossRef] [PubMed]
  6. Aravind, L.; Koonin, E.V. Classification of the caspase-hemoglobinase fold: Detection of new families and implications for the origin of the eukaryotic separins. Proteins 2002, 46, 355–367. [Google Scholar] [CrossRef] [PubMed]
  7. Earnshaw, W.C.; Martins, L.M.; Kaufmann, S.H. Mammalian caspases: Structure, activation, substrates, and functions during apoptosis. Annu. Rev. Biochem. 1999, 68, 383–424. [Google Scholar] [CrossRef] [PubMed]
  8. Uren, A.G.; O’Rourke, K.; Aravind, L.; Pisabarro, M.T.; Seshagiri, S.; Koonin, E.V.; Dixit, V.M. Identification of paracaspases and metacaspases: Two ancient families of caspase-like proteins, one of which plays a key role in MALT lymphoma. Mol. Cell. 2000, 6, 961–967. [Google Scholar] [CrossRef]
  9. Tsiatsiani, L.; van Breusegem, F.; Gallois, P.; Zavialov, A.; Lam, E.; Bozhkov, P.V. Metacaspases. Cell Death Differ. 2011, 18, 1279–1288. [Google Scholar] [CrossRef] [PubMed]
  10. Liu, Q.; Xue, Q. Molecular phylogeny, evolution, and functional divergence of the LSD1-like gene family: Inference from the rice genome. J. Mol. Evol. 2007, 64, 354–363. [Google Scholar] [CrossRef] [PubMed]
  11. Wang, L.K.; Zhang, H. Genome wide survey and characterization of metacaspase gene family in rice (Oryza sativa). J. Genet. 2014, 93, 93–102. [Google Scholar] [CrossRef] [PubMed]
  12. Zhang, C.; Gong, P.; Wei, R.; Li, S.; Zhang, X.; Yu, Y.; Wang, Y. The metacaspase gene family of Vitis vinifera L.: Characterization and differential expression during ovule abortion in stenospermocarpic seedless grapes. Gene 2013, 528, 267–276. [Google Scholar] [CrossRef] [PubMed]
  13. Acosta-Maspons, A.; Sepulveda-Garcia, E.; Sanchez-Baldoquin, L.; Marrero-Gutierrez, J.; Pons, T.; Rocha-Sosa, M.; Gonzalez, L. Two aspartate residues at the putative p10 subunit of a type II metacaspase from Nicotiana tabacum L. may contribute to the substrate-binding pocket. Planta 2014, 239, 147–160. [Google Scholar] [CrossRef] [PubMed]
  14. Tsiatsiani, L.; Timmerman, E.; de Bock, P.J.; Vercammen, D.; Stael, S.; van de Cotte, B.; Staes, A.; Goethals, M.; Beunens, T.; van Damme, P.; et al. The Arabidopsis metacaspase9 degradome. Plant Cell 2013, 25, 2831–2847. [Google Scholar] [CrossRef] [PubMed]
  15. Wrzaczek, M.; Vainonen, J.P.; Stael, S.; Tsiatsiani, L.; Help-Rinta-Rahko, H.; Gauthier, A.; Kaufholdt, D.; Bollhoner, B.; Lamminmaki, A.; Gevaert, K.; et al. GRIM REAPER peptide binds to receptor kinase PRK5 to trigger cell death in Arabidopsis. EMBO J. 2015, 34, 55–66. [Google Scholar] [CrossRef] [PubMed]
  16. Zhang, Y.; Lam, E. Sheathing the swords of death: Post-translational modulation of plant metacaspases. Plant Signal. Behav. 2011, 6, 2051–2056. [Google Scholar] [CrossRef] [PubMed]
  17. Lam, E.; Zhang, Y. Regulating the reapers: Activating metacaspases for programmed cell death. Trends Plant Sci. 2012, 17, 487–494. [Google Scholar] [CrossRef] [PubMed]
  18. Vercammen, D.; van de Cotte, B.; de Jaeger, G.; Eeckhout, D.; Casteels, P.; Vandepoele, K.; Vandenberghe, I.; van Beeumen, J.; Inze, D.; van Breusegem, F. Type II metacaspases Atmc4 and Atmc9 of Arabidopsis thaliana cleave substrates after arginine and lysine. J. Biol. Chem. 2004, 279, 45329–45336. [Google Scholar] [CrossRef] [PubMed]
  19. Vercammen, D.; Belenghi, B.; van de Cotte, B.; Beunens, T.; Gavigan, J.A.; de Rycke, R.; Brackenier, A.; Inze, D.; Harris, J.L.; van Breusegem, F. Serpin1 of Arabidopsis thaliana is a suicide inhibitor for metacaspase 9. J. Mol. Biol. 2006, 364, 625–636. [Google Scholar] [CrossRef] [PubMed]
  20. Belenghi, B.; Romero-Puertas, M.C.; Vercammen, D.; Brackenier, A.; Inze, D.; Delledonne, M.; van Breusegem, F. Metacaspase activity of Arabidopsis thaliana is regulated by S-nitrosylation of a critical cysteine residue. J. Biol. Chem. 2007, 282, 1352–1358. [Google Scholar] [CrossRef] [PubMed]
  21. Wen, S.; Ma, Q.M.; Zhang, Y.L.; Yang, J.P.; Zhao, G.H.; Fu, D.Q.; Luo, Y.B.; Qu, G.Q. Biochemical evidence of key residues for the activation and autoprocessing of tomato type II metacaspase. FEBS Lett. 2013, 587, 2517–2522. [Google Scholar] [CrossRef] [PubMed]
  22. Bozhkov, P.V.; Suarez, M.F.; Filonova, L.H.; Daniel, G.; Zamyatnin, A.A., Jr.; Rodriguez-Nieto, S.; Zhivotovsky, B.; Smertenko, A. Cysteine protease mc II-Pa executes programmed cell death during plant embryogenesis. Proc. Natl. Acad. Sci. USA 2005, 102, 14463–14468. [Google Scholar] [CrossRef] [PubMed]
  23. Watanabe, N.; Lam, E. Two Arabidopsis metacaspases AtMCP1b and AtMCP2b are arginine/lysine-specific cysteine proteases and activate apoptosis-like cell death in yeast. J. Biol. Chem. 2005, 280, 14691–14699. [Google Scholar] [CrossRef] [PubMed]
  24. Watanabe, N.; Lam, E. Arabidopsis metacaspase 2d is a positive mediator of cell death induced during biotic and abiotic stresses. Plant J. 2011, 66, 969–982. [Google Scholar] [CrossRef] [PubMed]
  25. Piszczek, E.; Dudkiewicz, M.; Mielecki, M. Biochemical and bioinformatic characterization of type II metacaspase protein (TaeMCA II) from wheat. Plant Mol. Biol. Rep. 2012, 30, 1338–1347. [Google Scholar] [CrossRef] [PubMed]
  26. He, R.; Drury, G.E.; Rotari, V.I.; Gordon, A.; Willer, M.; Farzaneh, T.; Woltering, E.J.; Gallois, P. Metacaspase-8 modulates programmed cell death induced by ultraviolet light and H2O2 in Arabidopsis. J. Biol. Chem. 2008, 283, 774–783. [Google Scholar] [CrossRef] [PubMed]
  27. Hoeberichts, F.A.; ten Have, A.; Woltering, E.J. A tomato metacaspase gene is upregulated during programmed cell death in Botrytis cinerea-infected leaves. Planta 2003, 217, 517–522. [Google Scholar] [CrossRef] [PubMed]
  28. Kim, S.M.; Bae, C.; Oh, S.K.; Choi, D. A pepper (Capsicum annuum L.) metacaspase 9 (Camc9) plays a role in pathogen-induced cell death in plants. Mol. Plant Pathol. 2013, 14, 557–566. [Google Scholar] [CrossRef] [PubMed]
  29. Wang, X.D.; Wang, X.J.; Feng, H.; Tang, C.L.; Bai, P.F.; Wei, G.R.; Huang, L.L.; Kang, Z.S. TaMCA4, a novel wheat metacaspase gene functions in programmed cell death induced by the fungal pathogen Puccinia striiformis f. sp. tritici. Mol. Plant Microbe Interact. 2012, 25, 755–764. [Google Scholar] [CrossRef] [PubMed]
  30. Hao, L.; Goodwin, P.H.; Hsiang, T. Expression of a metacaspase gene of Nicotiana benthamiana after inoculation with Colletotrichum destructivum or Pseudomonas syringae pv. tomato, and the effect of silencing the gene on the host response. Plant Cell Rep. 2007, 26, 1879–1888. [Google Scholar] [PubMed]
  31. Ahmad, R.; Zuily-Fodil, Y.; Passaquet, C.; Bethenod, O.; Roche, R.; Repellin, A. Ozone and aging up-regulate type II metacaspase gene expression and global metacaspase activity in the leaves of field-grown maize (Zea. mays L.) plants. Chemosphere 2012, 87, 789–795. [Google Scholar] [CrossRef] [PubMed]
  32. Watanabe, N.; Lam, E. Recent advance in the study of caspase-like proteases and Bax inhibitor-1 in plants: Their possible roles as regulator of programmed cell death. Mol. Plant Pathol. 2004, 5, 65–70. [Google Scholar] [CrossRef] [PubMed]
  33. Bollhoner, B.; Zhang, B.; Stael, S.; Denance, N.; Overmyer, K.; Goffner, D.; van Breusegem, F.; Tuominen, H. Post mortem function of Atmc9 in xylem vessel elements. New Phytol. 2013, 200, 498–510. [Google Scholar] [CrossRef] [PubMed]
  34. Suarez, M.F.; Filonova, L.H.; Smertenko, A.; Savenkov, E.I.; Clapham, D.H.; von Arnold, S.; Zhivotovsky, B.; Bozhkov, P.V. Metacaspase-dependent programmed cell death is essential for plant embryogenesis. Curr. Biol. 2004, 14, R339–R340. [Google Scholar] [CrossRef] [PubMed]
  35. Coll, N.S.; Vercammen, D.; Smidler, A.; Clover, C.; van Breusegem, F.; Dangl, J.L.; Epple, P. Arabidopsis type I metacaspases control cell death. Science 2010, 330, 1393–1397. [Google Scholar] [CrossRef] [PubMed]
  36. Minina, E.A.; Filonova, L.H.; Fukada, K.; Savenkov, E.I.; Gogvadze, V.; Clapham, D.; Sanchez-Vera, V.; Suarez, M.F.; Zhivotovsky, B.; Daniel, G.; et al. Autophagy and metacaspase determine the mode of cell death in plants. J. Cell. Biol. 2013, 203, 917–927. [Google Scholar] [CrossRef] [PubMed]
  37. Coll, N.S.; Smidler, A.; Puigvert, M.; Popa, C.; Valls, M.; Dangl, J.L. The plant metacaspase AtMC1 in pathogen-triggered programmed cell death and aging: functional linkage with autophagy. Cell Death Differ. 2014, 21, 1399–1408. [Google Scholar] [CrossRef] [PubMed]
  38. Dietrich, R.A.; Richberg, M.H.; Schmidt, R.; Dean, C.; Dangl, J.L. A novel zinc finger protein is encoded by the Arabidopsis LSD1 gene and functions as a negative regulator of plant cell death. Cell 1997, 88, 685–694. [Google Scholar] [CrossRef]
  39. Vinocur, B.; Altman, A. Recent advances in engineering plant tolerance to abiotic stress: Achievements and limitations. Curr. Opin. Biotechnol. 2005, 16, 123–132. [Google Scholar] [CrossRef] [PubMed]
  40. Remans, T.; Keunen, E.; Bex, G.J.; Smeets, K.; Vangronsveld, J.; Cuypers, A. Reliable gene expression analysis by reverse transcription-quantitative PCR: Reporting and minimizing the uncertainty in data accuracy. Plant Cell 2014, 26, 3829–3837. [Google Scholar] [CrossRef] [PubMed]
  41. Hu, H.H.; Dai, M.Q.; Yao, J.L.; Xiao, B.Z.; Li, X.H.; Zhang, Q.F.; Xiong, L.Z. Overexpressing a NAM, ATAF, and CUC (NAC) transcription factor enhances drought resistance and salt tolerance in rice. Proc. Natl. Acad. Sci. USA 2006, 103, 12987–12992. [Google Scholar] [CrossRef] [PubMed]
  42. Yi, N.; Oh, S.J.; Kim, Y.S.; Jang, H.J.; Park, S.H.; Jeong, J.S.; Song, S.I.; Do Choi, Y.; Kim, J.K. Analysis of the Wsi18, a stress-inducible promoter that is active in the whole grain of transgenic rice. Transgenic Res. 2011, 20, 153–163. [Google Scholar] [CrossRef] [PubMed]
  43. Jain, M.; Nijhawan, A.; Tyagi, A.K.; Khurana, J.P. Validation of housekeeping genes as internal control for studying gene expression in rice by quantitative real-time PCR. Biochem. Biophys. Res. Commun. 2006, 345, 646–651. [Google Scholar] [CrossRef] [PubMed]
  44. You, J.; Zong, W.; Du, H.; Hu, H.H.; Xiong, L.Z. A special member of the rice SRO family, OsSRO1c, mediates responses to multiple abiotic stresses though interaction with various transcription factors. Plant Mol. Biol. 2014, 84, 693–705. [Google Scholar] [CrossRef] [PubMed]
  45. Lim, S.D.; Cho, H.Y.; Park, Y.C.; Ham, D.J.; Lee, J.K.; Jang, C.S. The rice RING finger E3 ligase, OsHCI1, drives nuclear export of multiple substrate proteins and its heterogeneous overexpression enhances acquired thermotolerance. J. Exp. Bot. 2013, 64, 2899–2914. [Google Scholar] [CrossRef] [PubMed]
  46. Sun, L.J.; Zhang, H.J.; Li, D.Y.; Huang, L.; Hong, Y.B.; Ding, X.S.; Nelson, R.S.; Zhou, X.P.; Song, F.M. Functions of rice NAC transcriptional factors, ONAC122 and ONAC131, in defense responses against Magnaporthe grisea. Plant Mol. Biol. 2013, 81, 41–56. [Google Scholar] [CrossRef] [PubMed]
  47. Agrawal, G.K.; Rakwal, R.; Jwa, N.S.; Agrawal, V.P. Signalling molecules and blast pathogen attack activates rice OsPR1a and OsPR1b genes: A model illustrating components participating during defence/stress response. Plant Physiol. Biochem. 2001, 39, 1095–1103. [Google Scholar] [CrossRef]
  48. Young, S.A.; Guo, A.; Guikema, J.A.; White, F.F.; Leach, J.E. Rice cationic peroxidase accumulates in xylem vessels during incompatible interactions with Xanthomonas oryzae pv. oryzae. Plant Physiol. 1995, 107, 1333–1341. [Google Scholar] [CrossRef] [PubMed]
  49. Mitsuhara, I.; Iwai, T.; Seo, S.; Yanagawa, Y.; Kawahigasi, H.; Hirose, S.; Ohkawa, Y.; Ohashi, Y. Characteristic expression of twelve rice PR1 family genes in response to pathogen infection, wounding, and defense-related signal compounds (121/180). Mol. Genet. Genomics 2008, 279, 415–427. [Google Scholar] [CrossRef] [PubMed]
  50. Zhao, C.J.; Wang, A.R.; Shi, Y.J.; Wang, L.Q.; Liu, W.D.; Wang, Z.H.; Lu, G.D. Identification of defense-related genes in rice responding to challenge by Rhizoctonia solani. Theor. Appl. Genet. 2008, 116, 501–516. [Google Scholar] [CrossRef] [PubMed]
  51. Zhang, J.H.; Jia, W.S.; Yang, J.C.; Ismail, A.M. Role of ABA in integrating plant responses to drought and salt stresses. Field Crop. Res. 2006, 97, 111–119. [Google Scholar] [CrossRef]
  52. Lee, S.C.; Luan, S. ABA signal transduction at the crossroad of biotic and abiotic stress responses. Plant Cell Environ. 2012, 35, 53–60. [Google Scholar] [CrossRef] [PubMed]
  53. Halim, V.A.; Vess, A.; Scheel, D.; Rosahl, S. The role of salicylic acid and jasmonic acid in pathogen defence. Plant Biol. 2006, 8, 307–313. [Google Scholar] [CrossRef] [PubMed]
  54. Gontia-Misha, I.; Sasidharan, S.; Tiwari, S. Recent developments in use of 1-aminocyclopropane-1-carboxylate (ACC) deaminase for conferring tolerance to biotic and abiotic stress. Biotechnol. Lett. 2014, 36, 889–898. [Google Scholar] [CrossRef] [PubMed]
  55. Abe, H.; Urao, T.; Ito, T.; Seki, M.; Shinozaki, K.; Yamaguchi-Shinozaki, K. Arabidopsis AtMYC2 (bHLH) and AtMYB2 (MYB) function as transcriptional activators in abscisic acid signaling. Plant Cell 2003, 15, 63–78. [Google Scholar] [CrossRef] [PubMed]
  56. Eulgem, T.; Rushton, P.J.; Robatzek, S.; Somssich, I.E. The WRKYsuperfamily of plant transcription factors. Trends Plant Sci. 2000, 5, 199–206. [Google Scholar] [CrossRef]
  57. Chakravarthy, S.; Tuori, R.P.; D’Ascenzo, M.D.; Fobert, P.R.; Despres, C.; Martin, G.B. The tomato transcription factor Pti4 regulates defense-related gene expression via GCC box and non-GCC box cis elements. Plant Cell 2003, 15, 3033–3050. [Google Scholar] [CrossRef] [PubMed]
  58. Baumann, K.; de Paolis, A.; Costantino, P.; Gualberti, G. The DNA binding site of the Dof protein NtBBF1 is essential for tissue-specific and auxin-regulated expression of the roIB oncogene in plants. Plant Cell 1999, 11, 323–333. [Google Scholar] [CrossRef] [PubMed]
  59. Chakrabarty, R.; Banerjee, R.; Chung, S.M.; Farman, M.; Citovsky, V.; Hogenhout, S.A.; Tzfira, T.; Goodin, M. pSITE vectors for stable integration or transient expression of autofluorescent protein fusions in plants: Probing Nicotiana. benthamiana-virus interactions. Mol. Plant Microbe Interact. 2007, 20, 740–750. [Google Scholar] [CrossRef] [PubMed]
  60. Epple, P.; Mack, A.A.; Morris, V.R.F.; Dangl, J.L. Antagonistic control of oxidative stress-induced cell death in Arabidopsis by two related, plant-specific zinc finger proteins. Proc. Natl. Acad. Sci. USA 2003, 100, 6831–6836. [Google Scholar] [CrossRef] [PubMed]
  61. Wang, L.J.; Tian, Y.C.; He, C.Z. Cloning of a novel rice gene OsLSD1 and bioinformatic analysis of LSD1-like gene family from Arabidopsis and rice. Prog. Biochem. Biophys. 2005, 32, 268–274. [Google Scholar]
  62. Wang, L.J.; Pei, Z.Y.; Tian, Y.C.; He, C.Z. OsLSD1, a rice zinc finger protein, regulates programmed cell death and callus differentiation. Mol. Plant Microbe Interact. 2005, 18, 375–384. [Google Scholar] [CrossRef] [PubMed]
  63. Xu, C.X.; He, C.Z. The rice OsLOL2 gene encodes a zinc finger protein involved in rice growth and disease resistance. Mol. Genet. Genomics 2007, 278, 85–94. [Google Scholar] [CrossRef] [PubMed]
  64. Wu, J.H.; Zhu, C.F.; Pang, J.H.; Zhang, X.R.; Yang, C.L.; Xia, G.X.; Tian, Y.C.; He, C.Z. OsLOL1, a C2C2-type zinc finger protein, interacts with OsbZIP58 to promote seed germination though the modulation of gibberellin biosynthesis in Oryza sativa. Plant J. 2014, 80, 1118–1130. [Google Scholar] [CrossRef] [PubMed]
  65. Kawahara, Y.; Oono, Y.; Kanamori, H.; Matsumoto, T.; Itoh, T.; Minami, E. Simultaneous RNA-seq analysis of a mixed transcriptome of rice and blast fungus interaction. PLoS ONE 2012, 7, e49423. [Google Scholar] [CrossRef] [PubMed]
  66. Liu, W.; Liu, J.; Triplett, L.; Leach, J.E.; Wang, G.L. Novel insights into rice innate immunity against bacterial and fungal pathogens. Annu. Rev. Phytopathol. 2014, 52, 213–241. [Google Scholar] [CrossRef] [PubMed]
  67. Shen, X.L.; Liu, H.B.; Yuan, B.; Li, X.H.; Xu, C.G.; Wang, S.P. OsEDR1 negatively regulates rice bacterial resistance via activation of ethylene biosynthesis. Plant Cell Environ. 2011, 34, 179–191. [Google Scholar] [CrossRef] [PubMed]
  68. Petrov, V.; Hille, J.; Mueller-Roeber, B.; Gechev, T.S. ROS-mediated abiotic stress-induced programmed cell death in plants. Front. Plant Sci. 2015, 6, 69. [Google Scholar] [CrossRef] [PubMed]
  69. Jeong, J.S.; Kim, Y.S.; Baek, K.H.; Jung, H.; Ha, S.H.; Do Choi, Y.; Kim, M.; Reuzeau, C.; Kim, J.K. Root-specific expression of OsNAC10 improves drought tolerance and grain yield in rice under field drought conditions. Plant Physiol. 2010, 153, 185–197. [Google Scholar] [CrossRef] [PubMed]
  70. Zheng, X.; Chen, B.; Lu, G.; Han, B. Overexpression of a NAC transcription factor enhances rice drought and salt tolerance. Biochem. Biophys. Res. Commun. 2009, 379, 985–989. [Google Scholar] [CrossRef] [PubMed]
  71. Piszczek, E.; Dudkiewicz, M.; Sobczak, M. Molecular cloning and phylogenetic analysis of cereal type II metacaspase cDNA from wheat. Biol. Plant. 2011, 55, 614–624. [Google Scholar] [CrossRef]
  72. He, S.P.; Huang, K.W.; Zhang, X.; Yu, X.C.; Huang, P.; An, C.C. The LSD1-type zinc finger motifs of Pisum sativa LSD1 are a novel nuclear localization signal and interact with importin α. PLoS ONE 2011, 6, e22131. [Google Scholar] [CrossRef] [PubMed]
  73. Chen, H.L.; Wang, S.P.; Zhang, Q.F. New gene for bacterial blight resistance in rice located on chomosome 12 identified from Minghui 63, an elite restorer line. Phytopathology 2002, 92, 750–754. [Google Scholar] [CrossRef] [PubMed]
  74. Jia, Y.; Liu, G.; Park, D.S.; Yang, Y. Inoculation and scoring methods for rice sheath blight disease. Methods Mol. Biol. 2013, 956, 257–268. [Google Scholar] [PubMed]
  75. Bustin, S.; Beaulieu, J.-F.; Huggett, J.; Jaggi, R.; Kibenge, F.; Olsvik, P.; Penning, L.; Toegel, S. MIQE precis: Practical implementation of minimum standard guidelines for fluorescence-based quantitative real-time PCR experiments. BMC Mol. Biol. 2010, 11, 74. [Google Scholar] [CrossRef] [PubMed] [Green Version]

