Article

Deep Sequencing Analysis of miRNA Expression in Breast Muscle of Fast-Growing and Slow-Growing Broilers

1
Department of Animal Genetics, Breeding and Reproduction, College of Animal Science, South China Agricultural University, Guangzhou 510642, China
2
Guangdong Provincial Key Lab of Agro-Animal Genomics and Molecular Breeding and Key Lab of Chicken Genetics, Breeding and Reproduction, Ministry of Agriculture, Guangzhou 510642, China
*
Author to whom correspondence should be addressed.
Int. J. Mol. Sci. 2015, 16(7), 16242-16262; https://0-doi-org.brum.beds.ac.uk/10.3390/ijms160716242
Submission received: 15 May 2015 / Revised: 3 July 2015 / Accepted: 10 July 2015 / Published: 17 July 2015
(This article belongs to the Special Issue Molecular Machinery of Cell Growth Regulation)

Abstract

:
Growth performance is an important economic trait in chicken. MicroRNAs (miRNAs) have been shown to play important roles in various biological processes, but their functions in chicken growth are not yet clear. To investigate the function of miRNAs in chicken growth, breast muscle tissues of the two-tail samples (highest and lowest body weight) from Recessive White Rock (WRR) and Xinghua Chickens (XH) were performed on high throughput small RNA deep sequencing. In this study, a total of 921 miRNAs were identified, including 733 known mature miRNAs and 188 novel miRNAs. There were 200, 279, 257 and 297 differentially expressed miRNAs in the comparisons of WRRh vs. WRRl, WRRh vs. XHh, WRRl vs. XHl, and XHh vs. XHl group, respectively. A total of 22 highly differentially expressed miRNAs (fold change > 2 or < 0.5; p-value < 0.05; q-value < 0.01), which also have abundant expression (read counts > 1000) were found in our comparisons. As far as two analyses (WRRh vs. WRRl, and XHh vs. XHl) are concerned, we found 80 common differentially expressed miRNAs, while 110 miRNAs were found in WRRh vs. XHh and WRRl vs. XHl. Furthermore, 26 common miRNAs were identified among all four comparisons. Four differentially expressed miRNAs (miR-223, miR-16, miR-205a and miR-222b-5p) were validated by quantitative real-time RT-PCR (qRT-PCR). Regulatory networks of interactions among miRNAs and their targets were constructed using integrative miRNA target-prediction and network-analysis. Growth hormone receptor (GHR) was confirmed as a target of miR-146b-3p by dual-luciferase assay and qPCR, indicating that miR-34c, miR-223, miR-146b-3p, miR-21 and miR-205a are key growth-related target genes in the network. These miRNAs are proposed as candidate miRNAs for future studies concerning miRNA-target function on regulation of chicken growth.

1. Introduction

Chicken growth traits play a crucial role in poultry production, which is affected by multiple factors, including genetic, nutritional, and environmental features [1]. In the past two decades, many growth candidate genes and quantitative trait loci (QTLs) for chicken growth have been identified [2,3,4,5,6,7]. With the development of next generation sequencing, a number of genome-wide association studies (GWAS) and transcriptome sequencing analyses were performed; more candidate genes and significant SNPs were found to influence chicken growth traits [8,9,10,11,12]. However, there are few studies about other genetic factors affecting chicken growth, such as microRNA regulation and epigenetic inheritance, and the genetic mechanisms of chicken growth are far from clear.
MicroRNAs, a class of non-coding small RNA with 20–23 nucleotides in length, can regulate gene expression by targeting specific sites in the 3′-untranslated region (3′-UTR) of mRNAs [13]. Increasing studies indicate that miRNAs widely control biological and metabolic processes by regulating post-transcriptional gene expression [14,15,16]. Furthermore, variations of microRNA may lead to abnormal function, and change the phenotypic character [17,18]. Until now, chicken has the highest numbers of identified miRNAs in domestic animals; 1058 chicken miRNAs have been identified based on the database of miRase 21.0 [19]. Several studies have found miRNAs associated with embryo development [20,21], cell proliferation [22], immunity function [23,24,25], and skeletal muscle development in chicken [26]. Therefore, miRNAs may play an important role in affecting chicken growth traits.
The aim of the present study was to identify miRNAs associated with growth traits in chicken. Breast muscle tissues of two-tail samples from WRR and XH, which exhibit different growth performance at seven weeks of age, were used for high throughput small RNA deep sequencing to detect the differentially expressed miRNAs.

2. Results

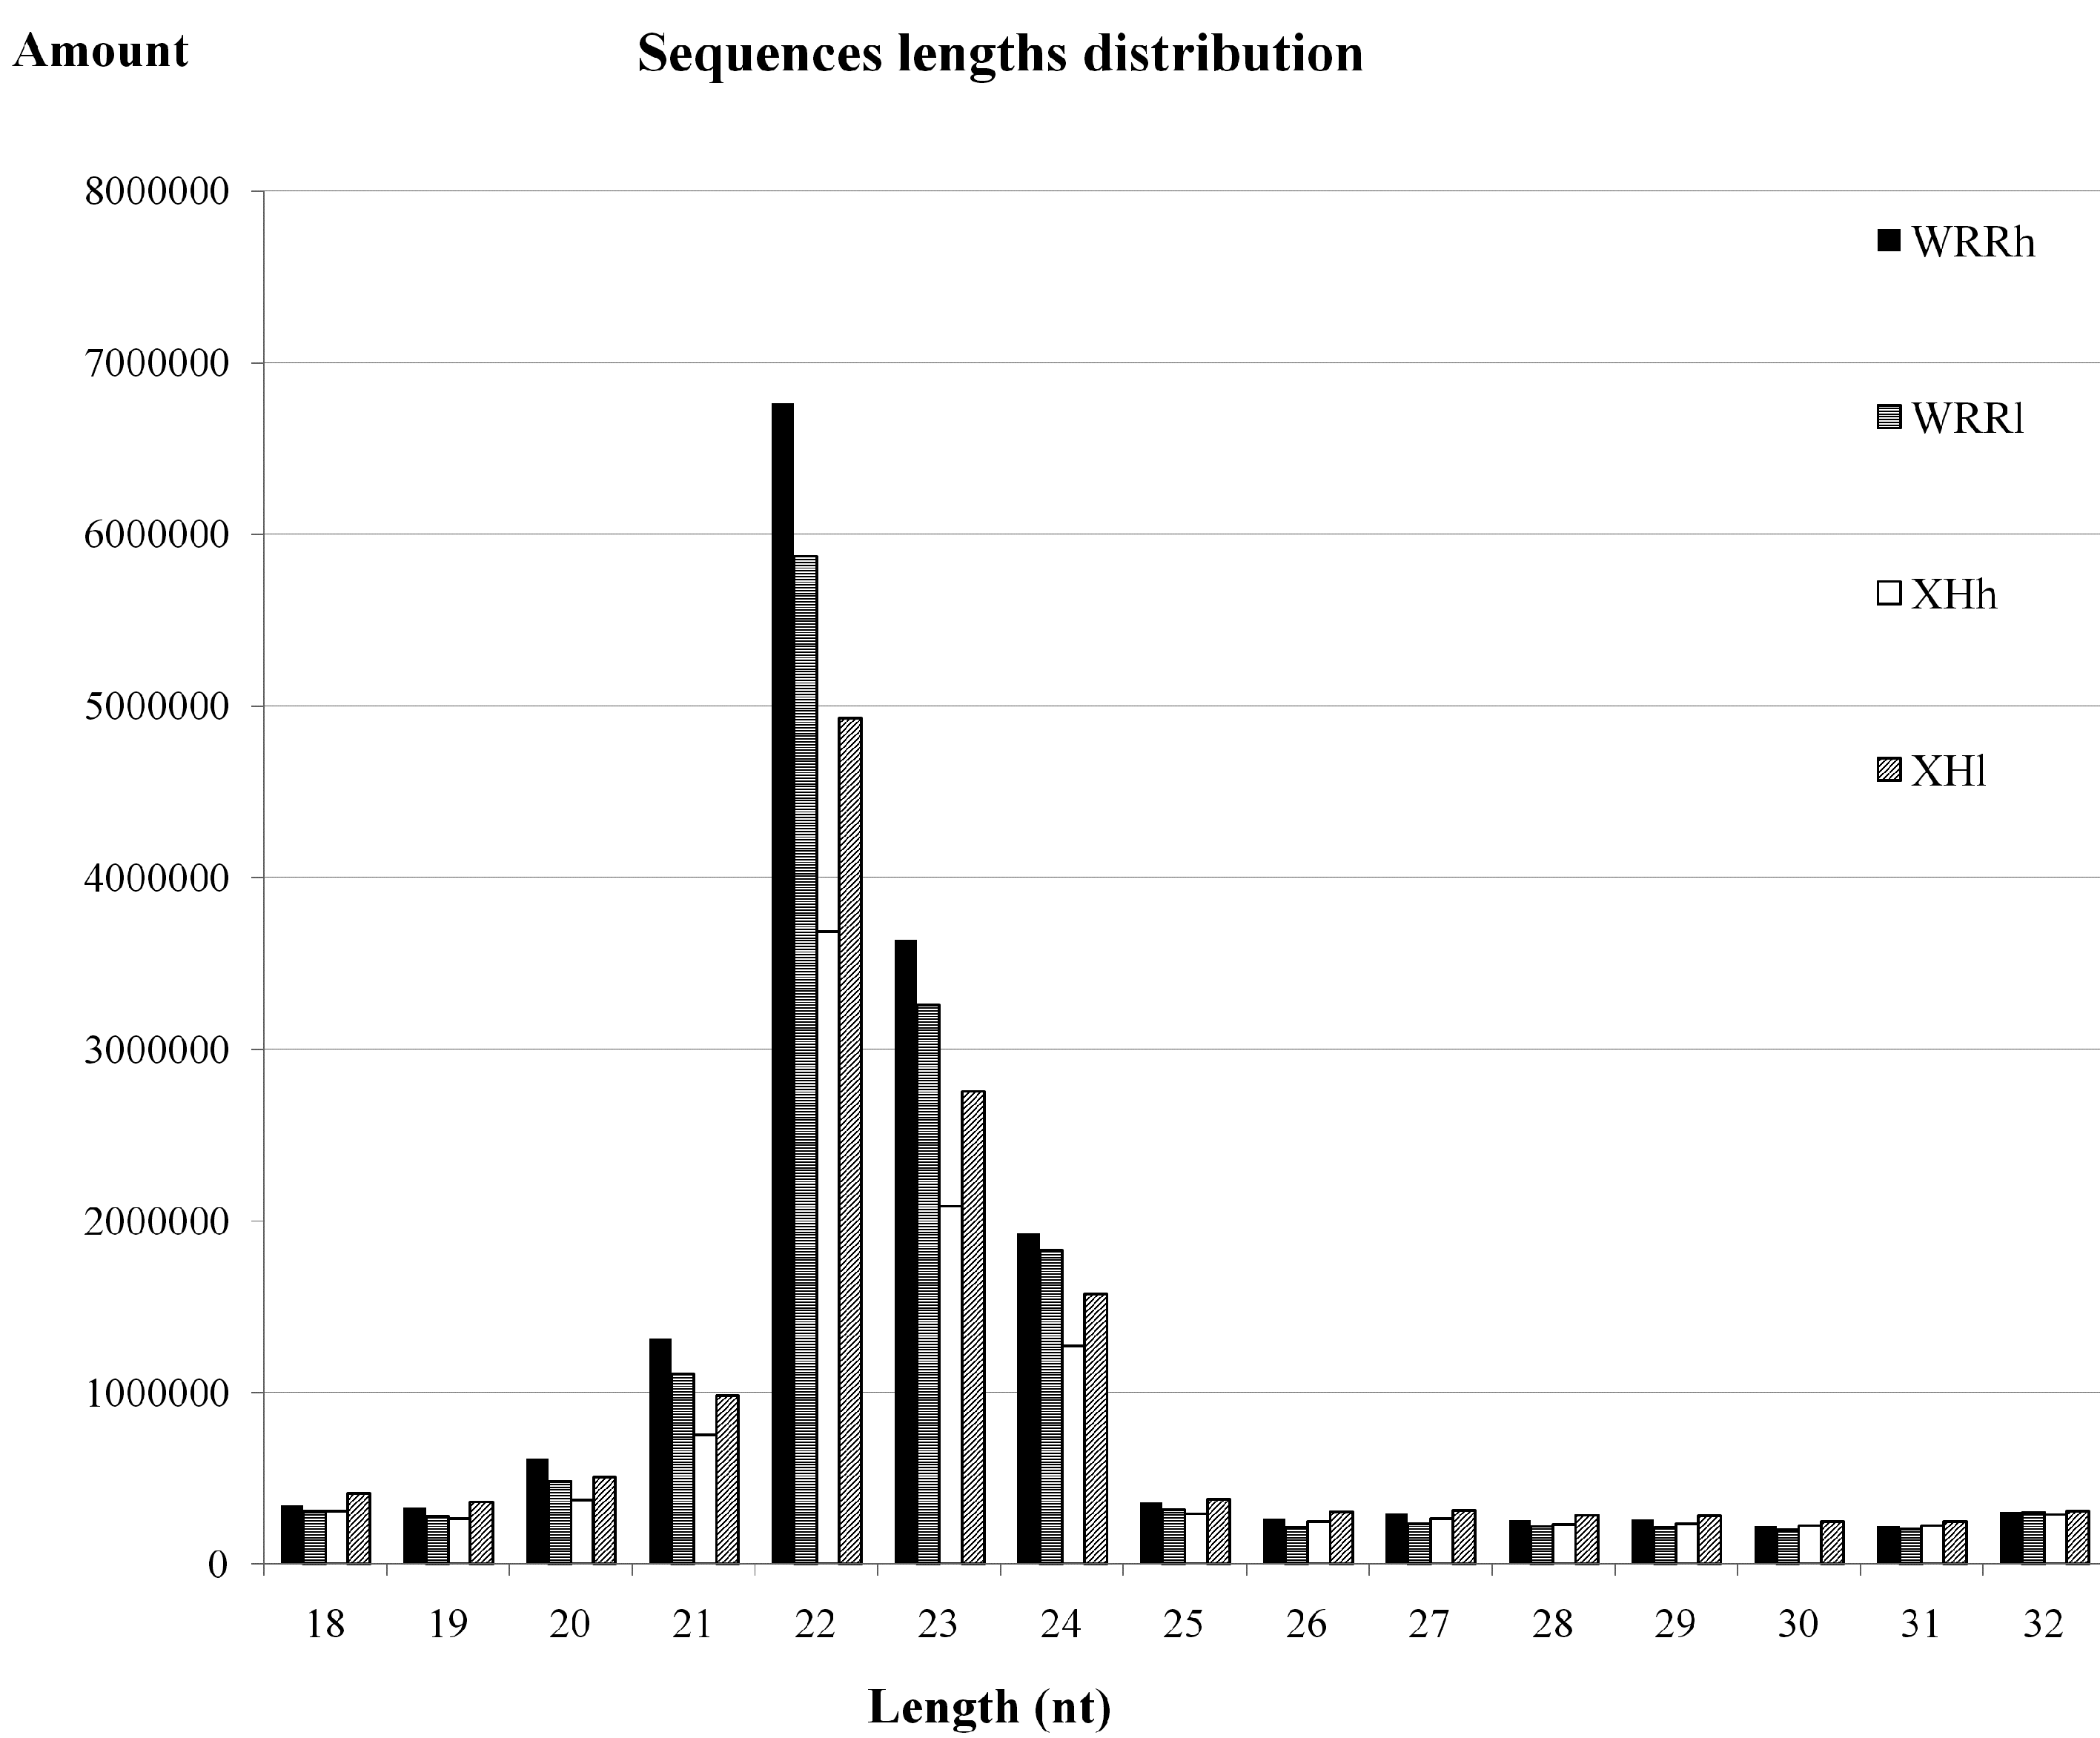
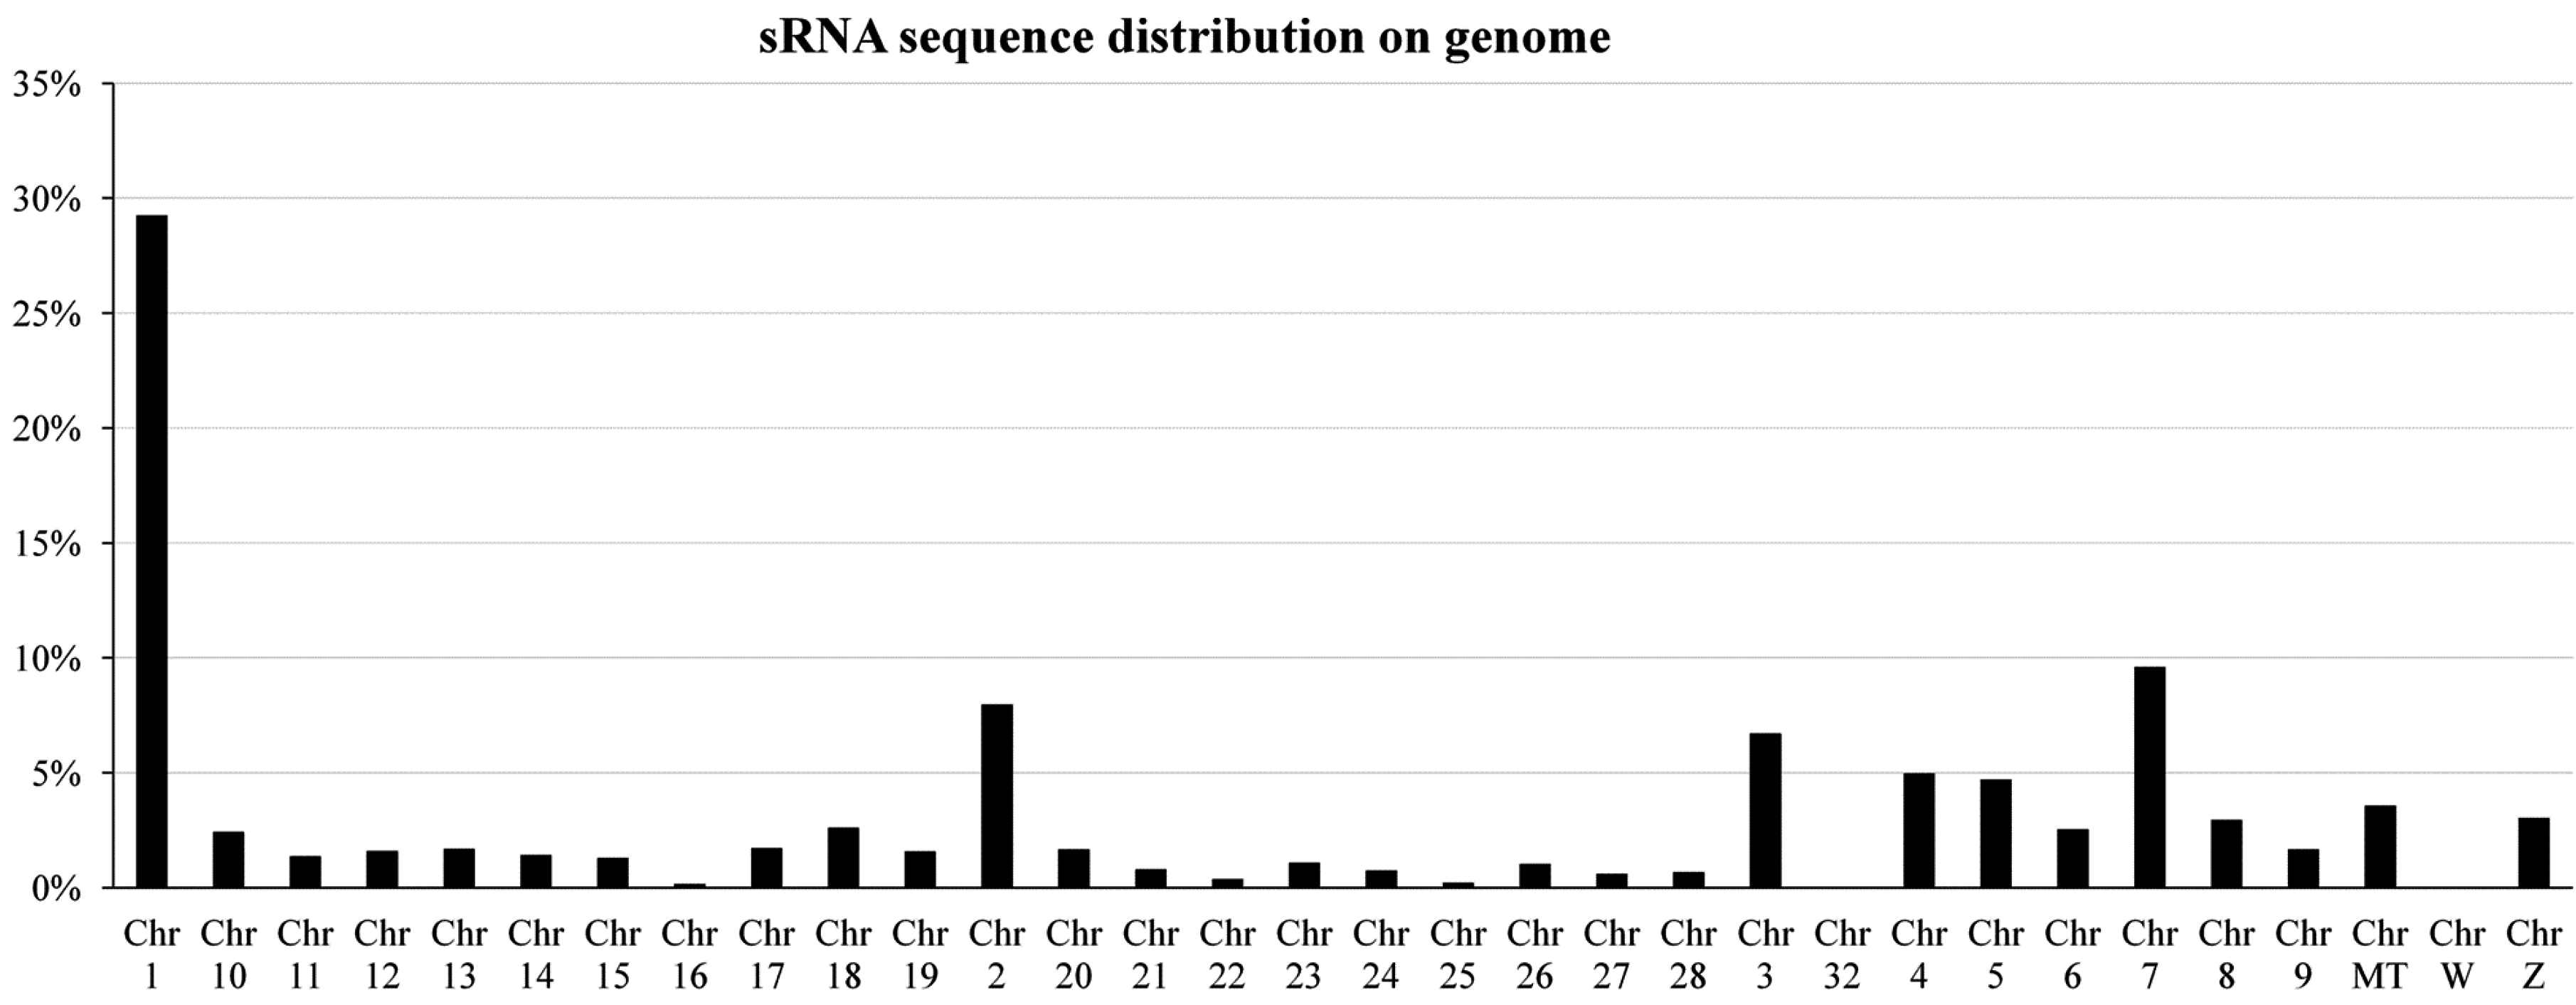
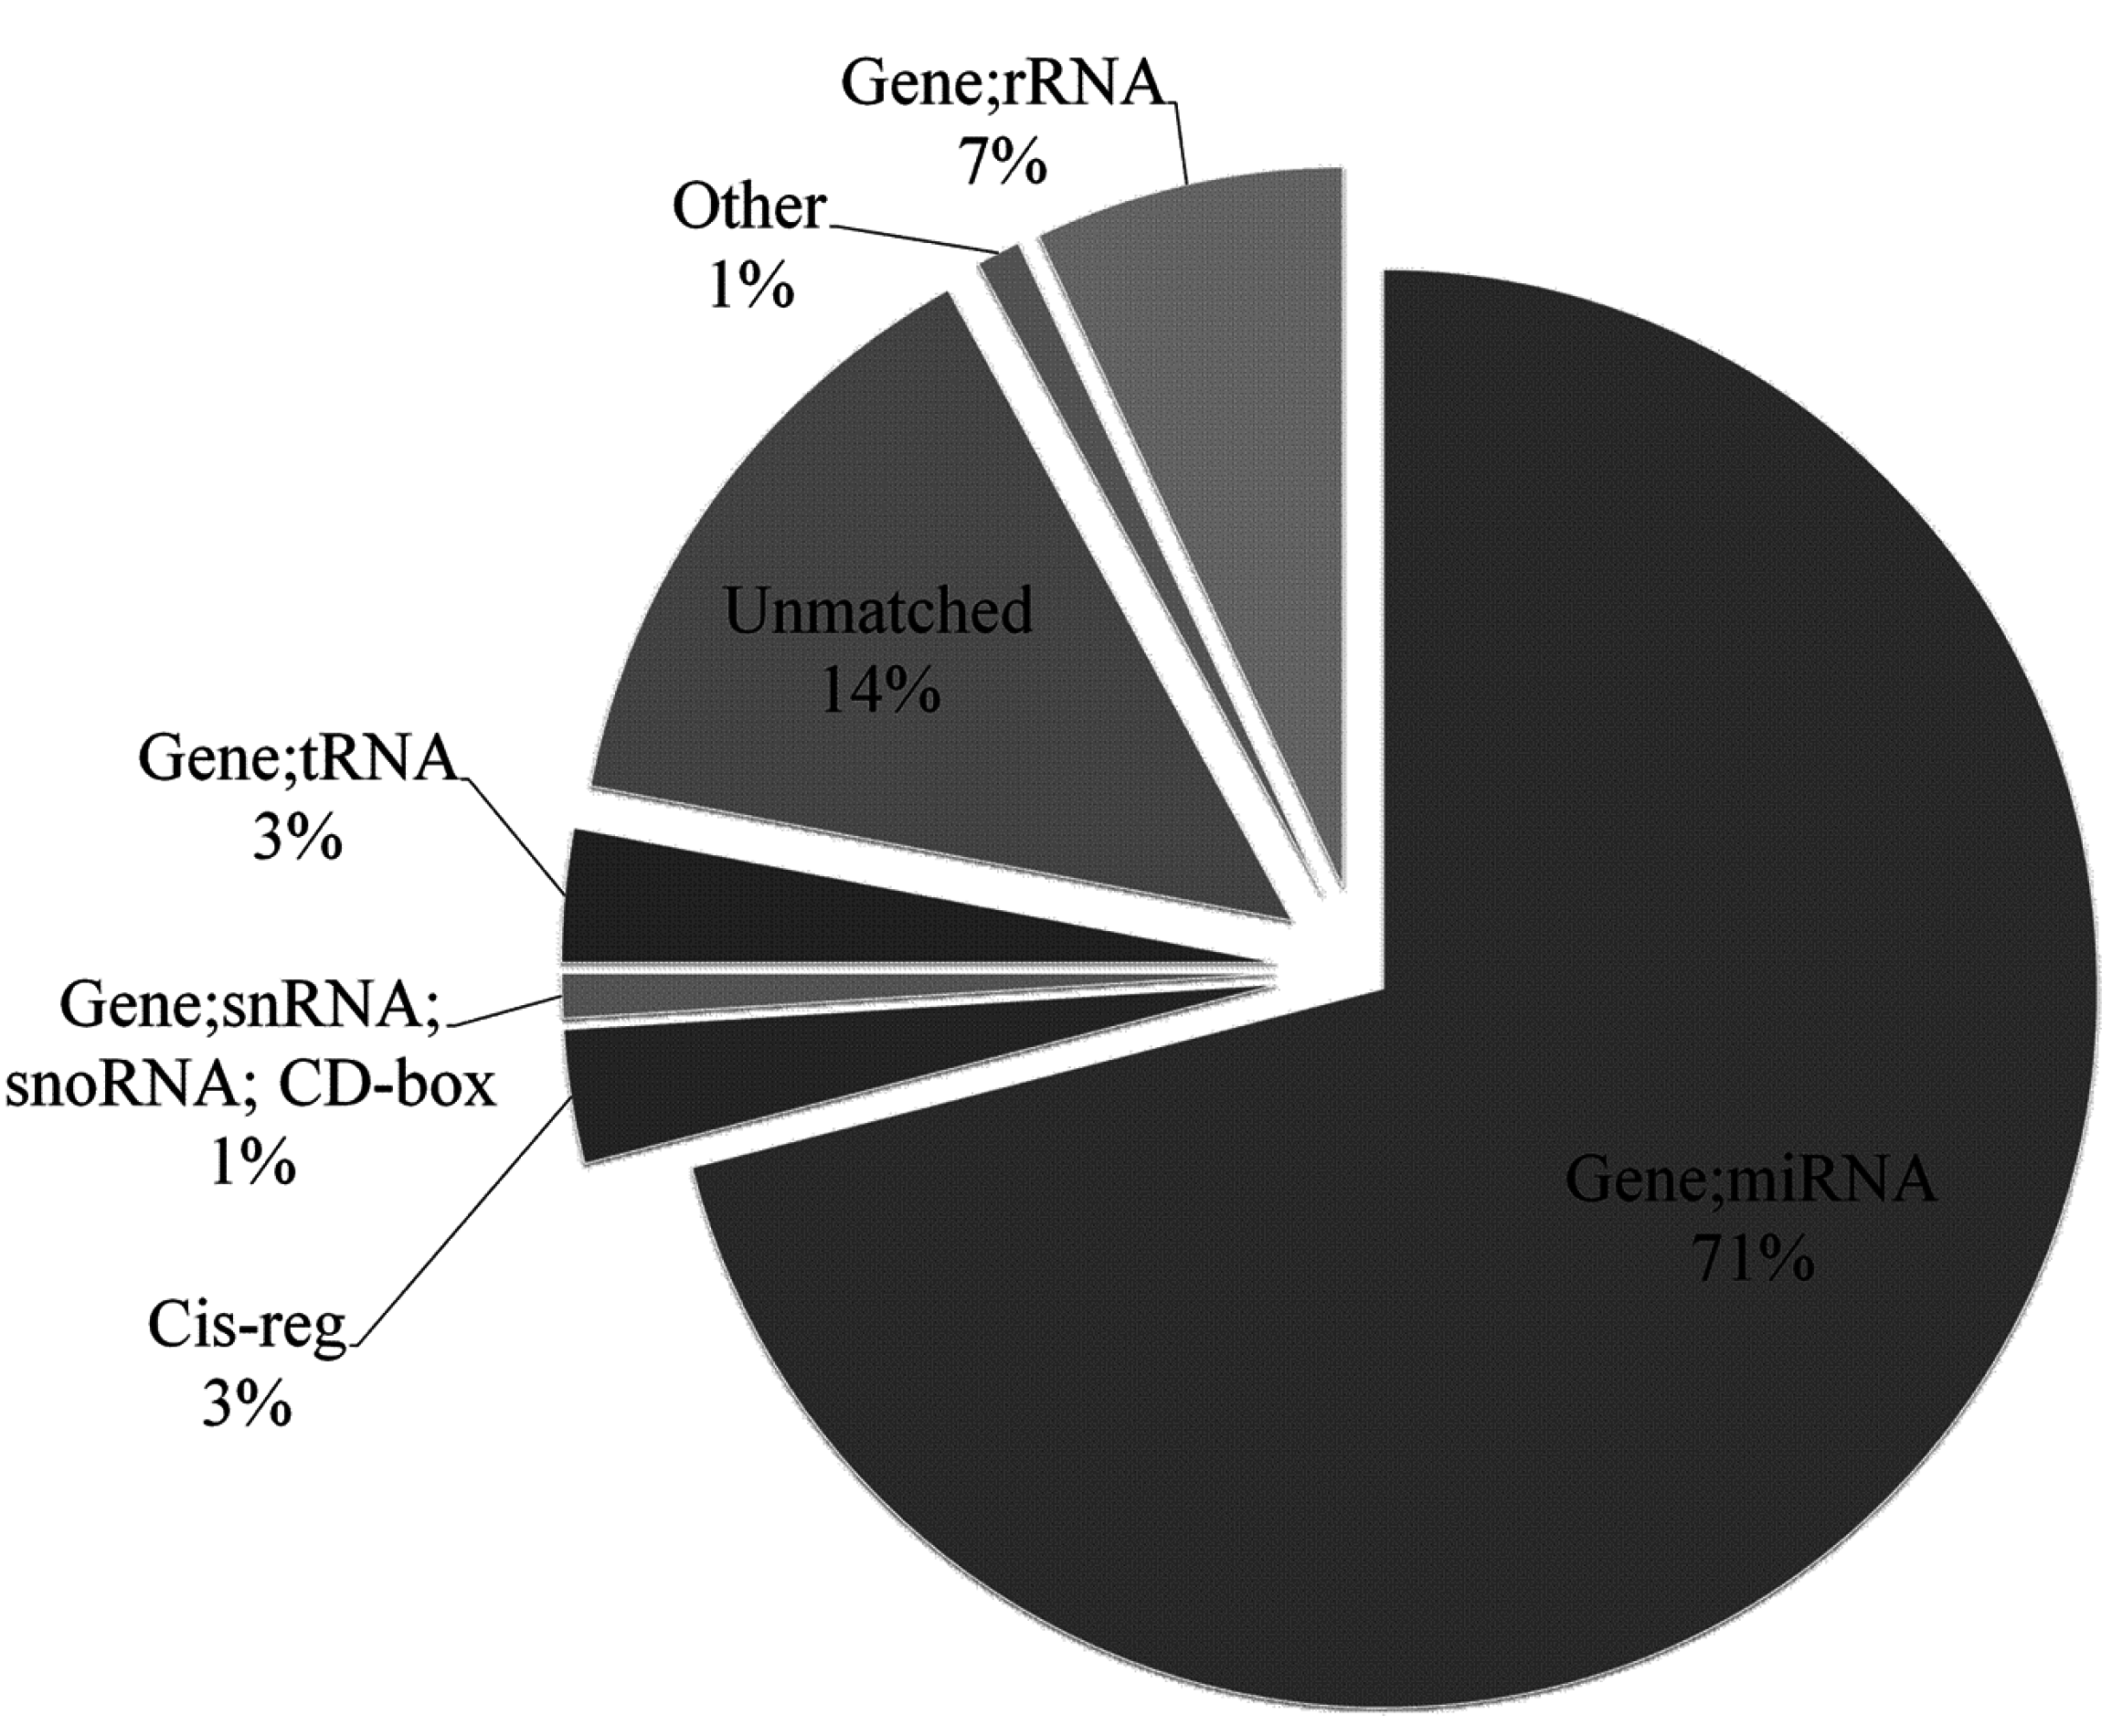
2.1. Overview of Small RNA Deep Sequencing Data

In this study, three pooled breast muscle tissues for each group of WRRh (the group of Recessive White Rock with high body weight), WRRl (the group of Recessive White Rock with low body weight), XHh (the group of Xinhua Chickens with high body weight) and XHl (the group of Xinhua Chickens with low body weight) were sequenced simultaneously by Illumina Solexa sequencing. All sequencing data were submitted to the NCBI GEO database with the accession number GSE62971 [27]. A range of 22,080,436 to 16,410,221 raw reads for the four groups was obtained. Firstly, low-quality reads and meaningless reads were filtered out. The quality data for RNA samples are shown in Figure S1. A total of 20,424,161, 18,160,137, 14,806,039 and 17,295,270 clean reads was obtained for WRRh, WRRl, XHh and XHl, respectively (Table 1). The size distribution of clean reads was assessed for all four groups. Small RNA sequence length was mainly concentrated at 21–24 nt, and the length of 22 nt was the maximum size (Figure 1).
Table 1. Summary of data generated from small RNA deep sequencing.
SampleTotal ReadsClean ReadsUnique ReadsMapped Reads aPercentage b
WRRh22,080,43620,424,161577,820433,84675.08%
WRRl19,917,02518,160,137513,726392,32376.37%
XHh16,410,22114,806,039494,539366,89874.19%
XHl19,473,65117,295,270625,063482,98977.27%
a The unique reads mapped in chicken genome; b The percentage of mapped reads in unique reads.
Figure 1. Length distribution and abundance of small RNAs sequences in chicken breast tissue. Clean reads of 18–32 nt for all four groups were assessed for size distribution; and the most abundant size class was 22 nt; followed by 23 and 24 nt.
Ijms 16 16242 g001
Then, the clean reads were assembled by groups, giving rise to 577,820, 513,726, 494,539, and 625,063 unique sequences for WRRh, WRRl, XHh, and XHl, respectively (Table 1). The unique small RNA reads were mapped to the chromosome by blasting with the chicken genome. Results showed that over 70% of the reads could be perfectly mapped to the chicken genome. Moreover, they were mainly located at chromosome 1 (29.25%), 2 (7.96%), 3 (6.71%), 4 (4.97%), 5 (4.71%) and 7 (9.59%) (Figure 2). Finally, the type and number of sRNA were searched using Rfam databases (rRNA, tRNA, sn/snoRNA, miRNAs, other noncoding RNA). The unique sequences were categorized into seven groups; 71.0% of them were defined as miRNAs, 14% were unmatched, and 15% were other known categories of identified small RNA including rRNA, tRNA, snRNA, snoRNA, etc. (Figure 3).
Figure 2. Distribution percentages of unique small RNAs sequences on chicken chromosome. The unique small RNA reads were mapped to chromosome by BLASTing with the chicken genome; and then the percentages of mapped reads of each chromosome in total mapped reads were then calculated. Chr MT: mitochondrial genome.
Ijms 16 16242 g002
Figure 3. Frequency of unique small RNA distribution among the different categories. The unique sequences were subjected to searches for the types and numbers of sRNA using the Rfam databases (rRNA; tRNA; sn/snoRNA; miRNAs; other noncoding RNA).
Ijms 16 16242 g003

2.2. Characterization of Known miRNAs and Predicted Novel miRNAs

Known conserved miRNAs were identified from the breast muscle of four groups using miRBase 21.0 (http://www.mirbase.org/), and novel miRNAs were also predicted from unannotated sRNA by miRDeep2 [28]. In this study, a total of 921 miRNAs (733 known mature miRNAs and 188 novel miRNAs) were detected. There were 891 and 797 miRNAs in WRR and the XH chicken each, of which 477 known mature miRNAs were expressed in all four groups (Table S1 in supplementary materials).
The abundance of the miRNAs could reflect differences in the roles of these miRNAs in the regulation of growth. The top 20 abundant known miRNAs in our libraries are listed in Table 2. The most abundant miRNAs is the gga-miR-133 family, which includes gga-miR-133a, gga-miR-133b and gga-miR-133c. The let-7 family was also expressed abundantly in the breast muscle libraries, five of them (gga-let-7a, gga-let-7c, gga-let-7f, gga-let-7j and gga-let-7k) are in the list of the top 20 abundant miRNAs. We found that putative novel miRNAs were less abundant than known miRNAs. There were 12 putative novel miRNAs and 131 known miRNAs in the libraries which have read counts greater than 1000 (Table S2 in supplementary materials). The predicted secondary structures of the two most abundant novel miRNAs are shown in Figure S2. Comparing the chicken miRNAs sequences, heterogeneity at the 5′ and/or 3′ ends of miRNAs was observed (Figure S3). These variations of miRNAs from their miRBase reference sequences are referred to as isomiRs [29]. We found that many miRNAs have various isoforms in chicken breast muscle libraries, and some miRNAs have more than one highly abundant isoform (e.g., gga-let-7c, gga-miR-205a and gga-miR-223). In addition to a few miRNAs (e.g., gga-let-7c), the most abundant isoforms are identical to the reference in miRBase. The most highly expressed miRNAs appear to have a greater number of different isoforms, e.g., 26 isoforms of gga-let-7c were identified.
Table 2. The top 20 abundant known miRNAs in chicken breast muscles.
miRNAsNormalized ReadsTotal Reads
WRRhWRRlXHhXHl
gga-miR-133a3,558,6833,069,0711,997,2862,607,78711,232,827
gga-miR-133c3,350,9362,885,4401,878,9252,449,20910,564,510
gga-miR-133b3,326,8482,864,5781,864,7212,431,27410,487,421
gga-let-7a1,699,6211,513,865857,2101,133,5325,204,228
gga-miR-22-3p1,333,2331,145,421712,464988,1864,179,304
gga-miR-30a-5p1,213,4681,148,128790,893930,5074,082,996
gga-miR-26a1,212,6351,054,689691,4561,006,5223,965,302
gga-miR-30d851,887813,262583,932667,0022,916,083
gga-miR-181a-6p918,452836,452485,661650,8362,891,401
gga-miR-10a-5p943,686782,180420,809663,4012,810,076
gga-miR-10b911,725757,564398,852633,5672,701,708
gga-miR-30e799,679730,832501,718596,2182,628,447
gga-let-7j848,972756,205428,182566,1652,599,524
gga-let-7f398,292363,598206,995274,3331,243,218
gga-miR-148a288,585300,432144,015180,973914,005
gga-miR-146c-5p224,147207,782171,443132,712736,084
gga-let-7k211,853206,518118,297155,412692,080
gga-let-7c242,661189,820111,118139,257682,856
gga-miR-199-3p168,417152,15875,346121,460517,381
gga-miR-126-5p139,914109,80589,60786,681426,007

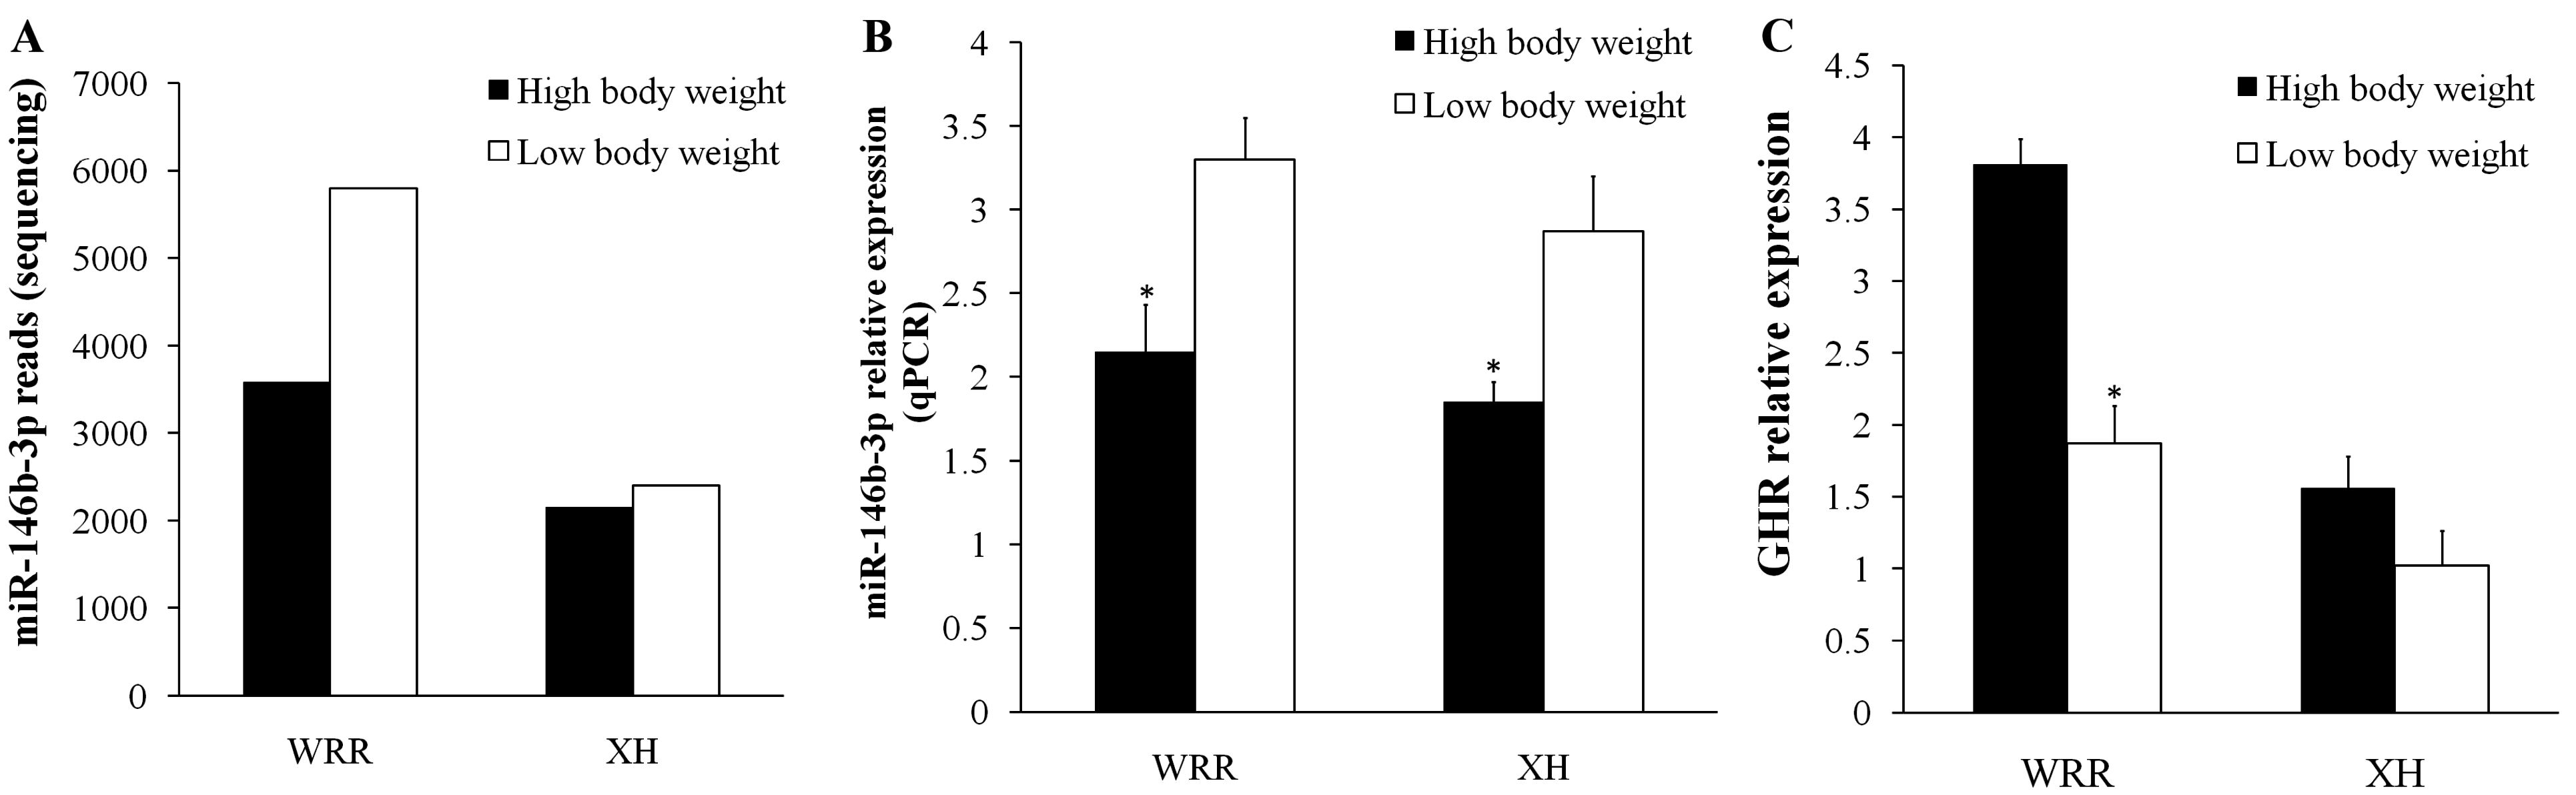
2.3. Identification of Differentially Expressed miRNAs

Differentially expressed miRNAs were identified by DEGseq analysis (fold change > 1.5 or < 0.66; p-value < 0.05; q-value < 0.01), as a result, 200, 279, 257 and 297 miRNAs were detected in four comparisons of WRRh vs. WRRl, WRRh vs. XHh, WRRl vs. XHl and XHh vs. XHl, respectively. Multiple comparisons revealed 80 miRNAs within breeds (WRRh vs. WRRl and XHh vs. XHl), and 110 miRNAs between breeds (WRRh vs. XHh and WRRl vs. XHl). The details of differentially expressed miRNAs are shown in Table S3 in supplementary materials. Among them, moreover, 26 miRNAs (including 10 known miRNAs of miR-122, miR-1329-3p, miR-1587, miR-1736-3p, miR-1769-3p, miR-1769-5p, miR-1773-5p, miR-205a, miR-31 and miR-375) were found in all four comparisons (Table 3). Furthermore, we focused on the miRNAs that were both abundant (read counts > 1000) and highly differentially expressed (fold change > 2 or < 0.5; p-value < 0.05; q-value < 0.01) in our comparisons, and found that 22 miRNAs met the standards (Table 4).
Table 3. Statistics of significant differently expressed miRNAs.
Sample 1 vs. Sample 2Up aDown bTotalShared
WRRh vs. WRRl116 (47)84 (24)200 (71)80 (22)26 (16)
XHh vs. XHl129 (44)150 (40)279 (84)
WRRh vs. XHh130 (31)127 (47)257 (78)110 (39)
WRR vs. XHl137 (41)160 (60)297 (101)
a The numbers of miRNAs expressed in sample 1 more than sample 2; b The numbers of miRNAs expressed in sample 1 were lower than sample 2. The value in brackets is the number of novel miRNAs. WRRh vs. WRRl indicated the comparison between the two-tail samples of Recessive White Rock; XHh vs. XHl indicated the comparison between the two-tail samples of Xinhua Chickens; WRRh vs XHh indicated the comparison between the groups of Recessive White Rock and Xinhua Chickens with high body weight; WRRl vs. XHl indicated the comparison between the groups of Recessive White Rock and Xinhua Chickens with low body weight.
Table 4. Differently expressed miRNAs and their candidate target genes.
miRNAsNormalized ReadsFold ChangeTarget Gene
Sample 1Sample 2
gga-miR-1329-5pWRRh 459WRRl 15820.29EDNRB; WWP2
WRRl 1582XHl 1749.07
gga-miR-1416-5pXHh 5680XHl 27212.09CTGF; CXCL12
WRRl 8061XHl 27212.96
gga-miR-142-5pWRRh 108,463XHh 54,0592.01FOXO3; ITGA8
WRRl 173,442XHl 71,8602.41
gga-miR-146b-3pWRRl 5800XHl 24042.41TNNC1; AKT1; GHR
gga-miR-146b-5pWRRl 191,004XHl 71,1692.68
gga-miR-147WRRh 882WRRl 28240.31
WRRl 2824XHl 9283.04
gga-miR-155WRRh 5205WRRl 14,0580.37ACTA1; AKT1; EDNRA
WRRh 5205XHh 17592.96
WRRl 14,058XHl 20186.97
gga-miR-1744-3pWRRh 2359WRRl 7403.19TMOD1; EDN3
gga-miR-1769-3pWRRh 377WRRl 11200.34DMD; BMP10
WRRl 1120XHl 4982.25
gga-miR-184WRRh 382XHh 17350.22COL11A1
gga-miR-194WRRh 946WRRl 46690.20MYBPC3; GCG
WRRh 946XHh 19810.48
WRRl 4669XHl 14703.18
gga-miR-204XHh 2762XHl 58480.47MYO6; PDGFRA; SOCS3
gga-miR-205aWRRh 4900WRRl 22812.15CISH; IFNG
WRRh 4900XHh 21372.29
WRRl 2281XHl 9402.43
gga-miR-21WRRh 489,673WRRl 1,060,6690.46CISH
WRRl 1,060,669XHl 360,2672.94
gga-miR-222b-3pWRRh 2477WRRl 66410.37ITGB1
WRRh 2477XHh 6583.77
WRRl 6641XHl 7918.40
gga-miR-223WRRl 10,225XHl 40042.55MYH10; ADAM17; FOXO3
gga-miR-34bXHh 41XHl 17500.02MYH10; BMP10
WRRl 218XHl 17500.12STRAP; THY1
gga-miR-34cXHh 41XHl 17500.02MYH7B; APP
WRRl 218XHl 17500.12THY1; COL11A1; SOCS3; GCG
gga-miR-383WRRh 37316030.23MYH7; APP; ITGA8
gga-miR-499WRRl 1754XHl 60840.29ADAM17; FLNB
gga-miR-9-3pXHh 82XHl 11770.07ACTG1
WRRl 81XHl 11770.07
gga-miR-9-5pXHh 1036XHl 30950.33TGFB2
The miRNAs were both abundant (read counts > 1000) and highly differentially expressed (fold change > 2 or < 0.5; p-value < 0.05; q-value < 0.01) in our comparisons; the target genes were involved in growth related gene interaction networks.
To verify the RNA-Seq data, the differential expression of four miRNAs including miR-223, miR-16, miR-205a and miR-222b-5p were validated by qRT-PCR among all four comparisons (Figure 4). In general, except for miR-222b-5p in XHh vs. XHl contrast, the expression patterns of these four miRNAs were consistent with the RNA-Seq results, indicating that the deep sequencing results were reliable and appropriate for further analysis.
Figure 4. qRT-PCR validation of four differentially expressed miRNAs in all four comparisons. (A) WRRh vs. XHh; (B) WRRh vs. WRRl; (C) WRRl vs. XHl; (D) XHh vs. XHl. qRT-PCR reactions were run in triplicates and presented as means ± S.E.M. The Student’s t-test was used to compare expression levels among different groups. * p < 0.05; ** p < 0.01. WRRh vs. WRRl indicated the comparison between the two-tail samples of Recessive White Rock; XHh vs. XHl indicated the comparison between the two-tail samples of Xinhua Chickens; WRRh vs. XHh indicated the comparison between the groups of Recessive White Rock and Xinhua Chickens with high body weight; WRRl vs. XHl indicated the comparison between the groups of Recessive White Rock and Xinhua Chickens with low body weight.
Ijms 16 16242 g004

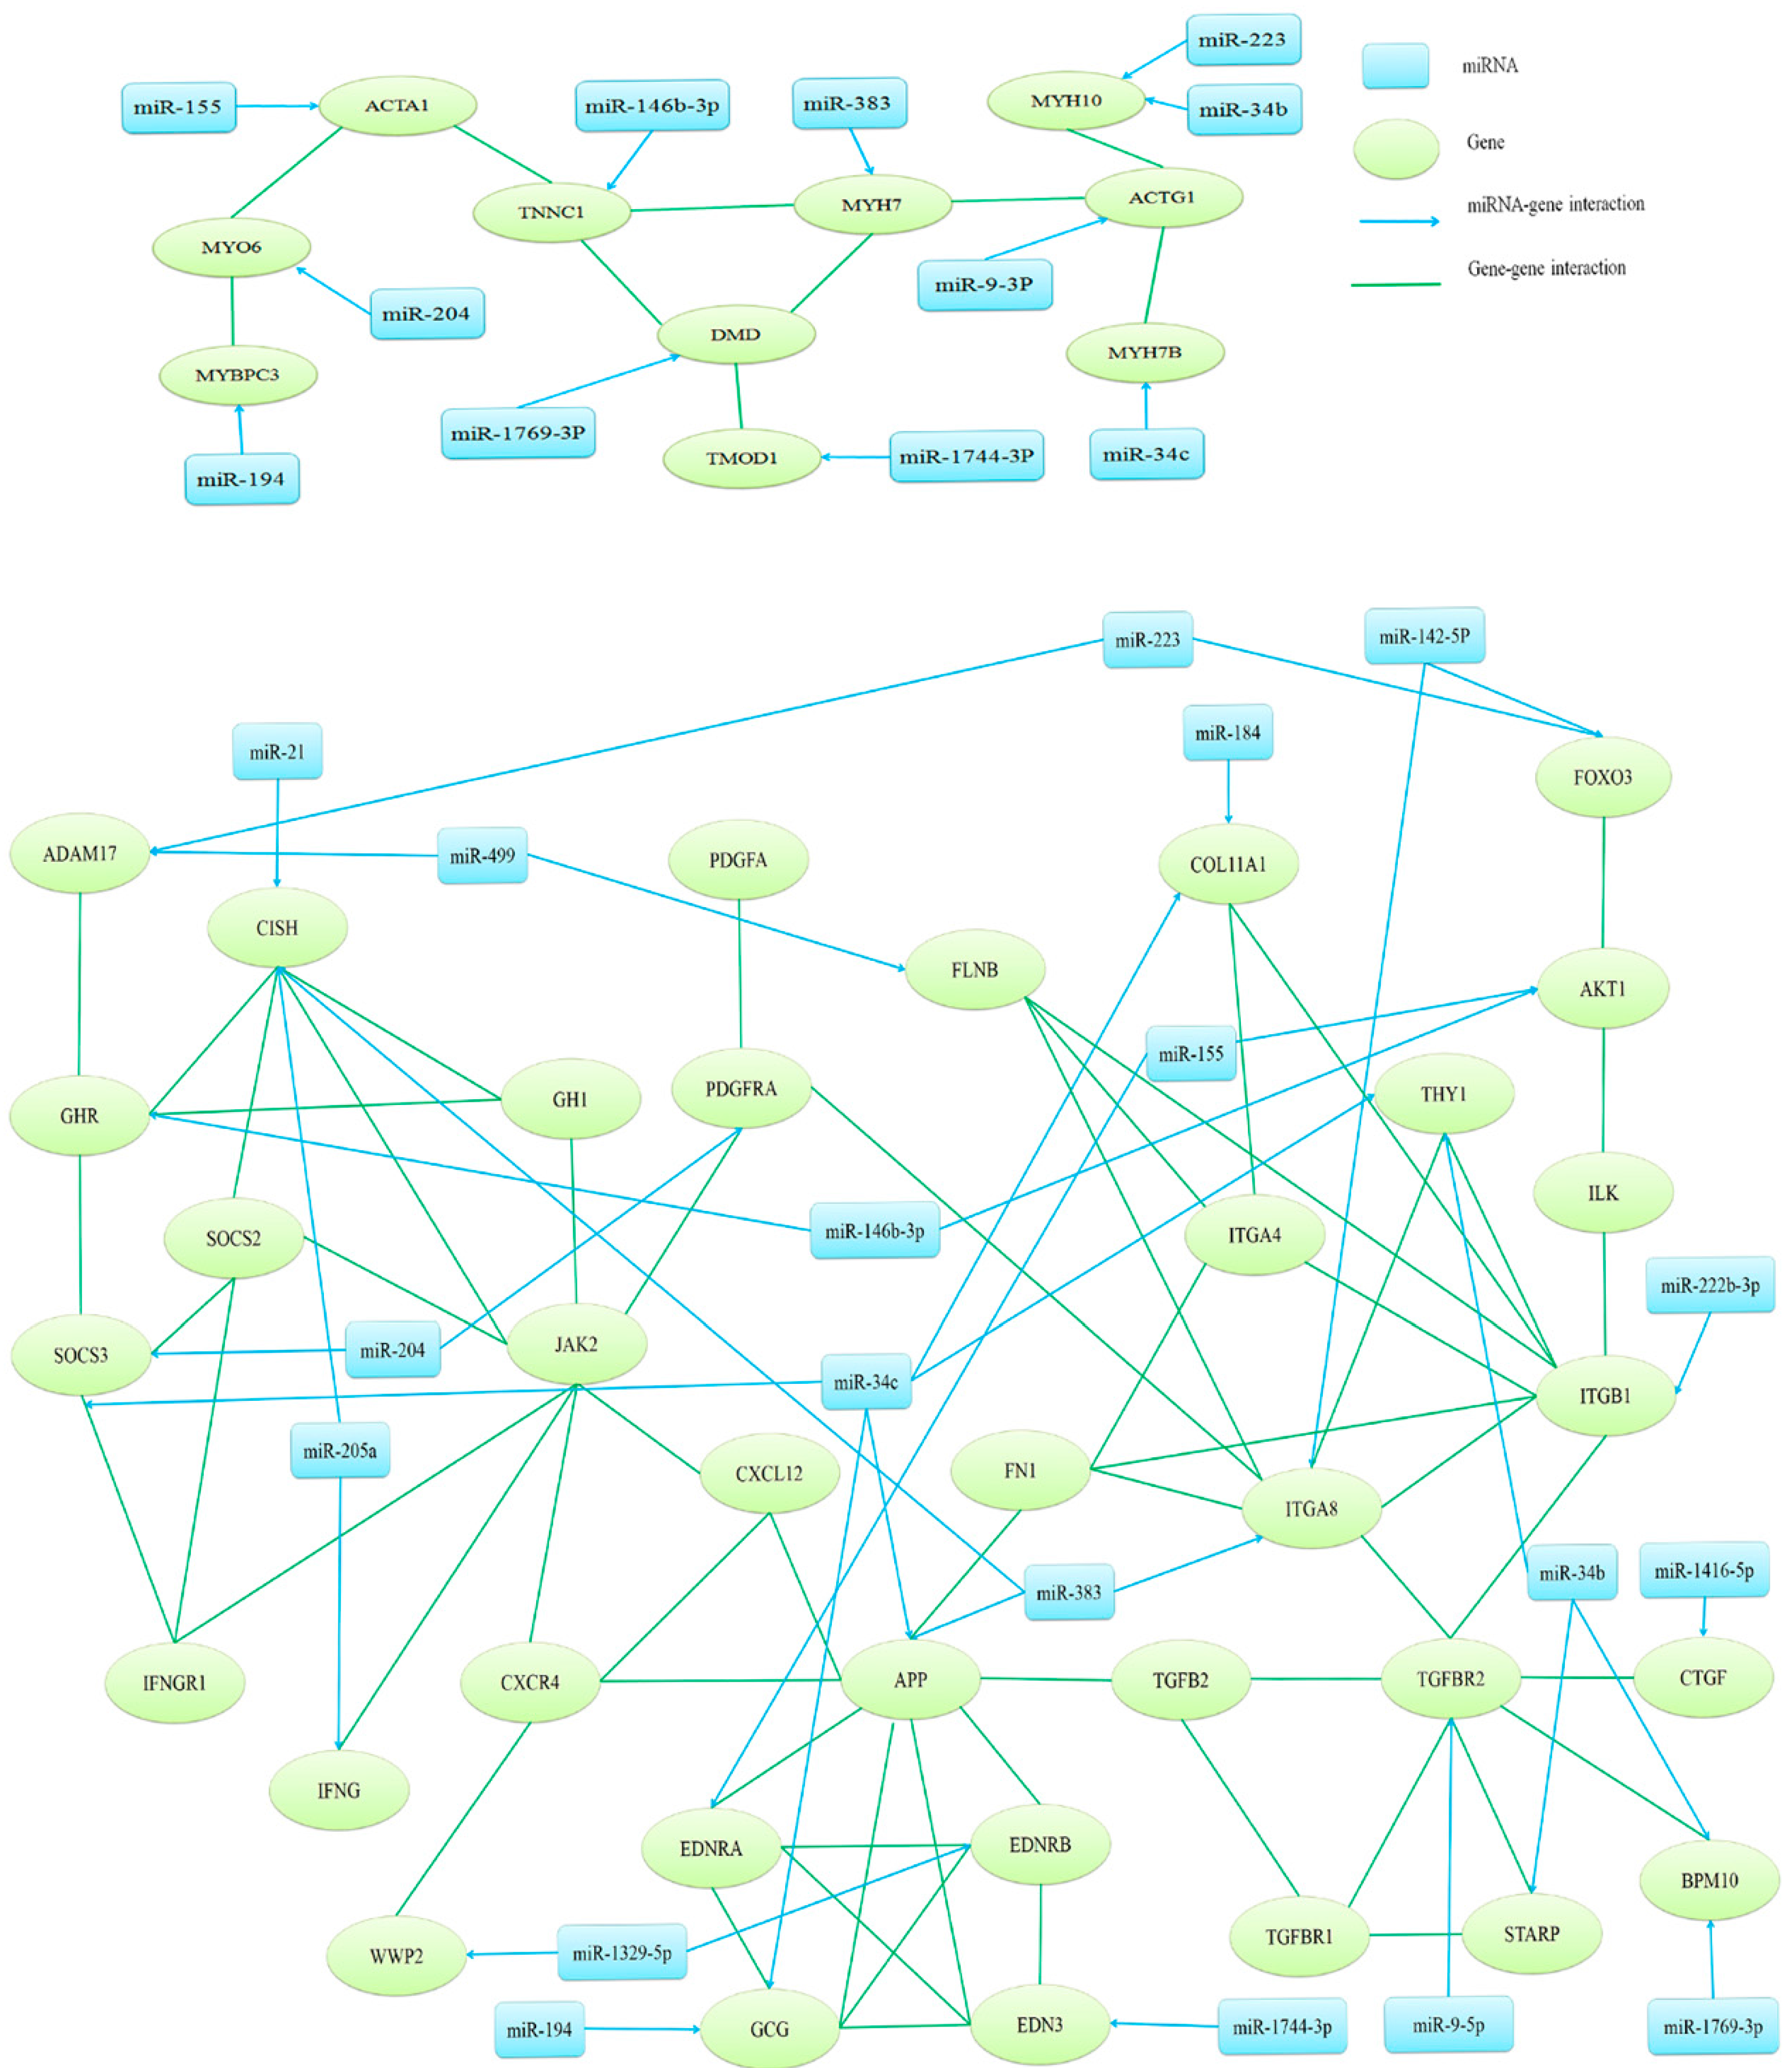
2.4. Target Gene Prediction, Function Annotation and Network Analysis

Through miRanda and RANhybrid, a total of 22,194 consensus potential miRNAs targets were obtained for all differentially expressed miRNAs. For all potential targets, GO annotation and KEGG pathway analysis were performed to identify functional modules. The GO results showed that 16,428 genes were involved in the categories and 502 biological process categories were significantly enriched (p < 0.05). The top 29 GO terms with enriched genes over 1000 were listed in Table S4 in supplementary materials. Pathway analysis of all targets revealed that 65 KEGG pathways were significantly enriched (p < 0.05), including 13 in WRRh vs. WRRl, 12 in XHh vs. XHl, 8 in WRRh vs. XHh, and 15 in WRRl vs. XHl (Table S5 in supplementary materials). Lysosome and metabolic pathways were enriched in all four comparisons.
For the 22 highly differentially expressed miRNAs (Table 4), 3151 potential targets were obtained by both miRanda [30] and RNAhybrid [31]. The further GO analysis for these targets showed that 192 biological process categories were significantly enriched (p < 0.05). The important growth-related GO terms are listed in Table 5, and are involved in regulation of growth, cell growth, muscle cell differentiation and development, and the transforming growth factor beta receptor signaling pathway. These GO terms contained 87 target genes, and their interactions were predicted using database of STRING 9.1 [32]. Two possible regulatory networks of interactions among miRNAs and their targets were constructed (Figure 5). A total of 20 miRNAs and 34 targets (Table 4) were involved in the two networks presented. Most of these 20 miRNAs have rarely been identified for their functional role in growth or muscle development. However, a number of their target genes have been reported to play a key role in regulation of growth, such as GHR, CISH, SOCS3, APP, TGFBR2, AKT1 and FOXO3, etc. [33]. These miRNAs could participate in the regulation of growth through their target genes. For instance, gga-miR-34c has six targets in the present network, including SOCS3, GCG, APP, THY1, COL11A1 and MYH7B; gga-miR-146b-3p was predicted to target GHR and AKT1; gga-miR-223 was predicted to target FOXO3 and ADAM17; and the predicted target gene of gga-miR-9-5p was TGFBR2.
Table 5. Growth related biological processes identified by GO analysis for target genes of 22 highly differentially expressed miRNAs.
GO AccessionGO TermsGene NumbersFold Enrichmentp Value
GO:0040008regulation of growth291.50.016
GO:0001558regulation of cell growth161.80.019
GO:0045927positive regulation of growth1120.029
GO:0030307positive regulation of cell growth53.10.025
GO:0017015regulation of transforming growth factor β receptor signaling pathway52.80.034
GO:0055001muscle cell development112.40.034
GO:0051146striated muscle cell differentiation131.80.040
GO:0060415muscle tissue morphogenesis62.70.049
GO:0003012muscle system process131.80.049
GO:0060537muscle tissue development171.60.036
GO:0055002striated muscle cell development82.10.035
GO:0014706striated muscle tissue development161.50.027
Figure 5. Interaction network of highly differentially expressed miRNAs and their potential targets. Candidate miRNA targets were obtained from growth related GO terms; and target–target pair interactions were searched using the STRING database. In the network; blue nodes denoted miRNAs and blue arrows denoted miRNA-target interaction; green nodes denoted targets and green lines denote target–target interaction.
Ijms 16 16242 g005

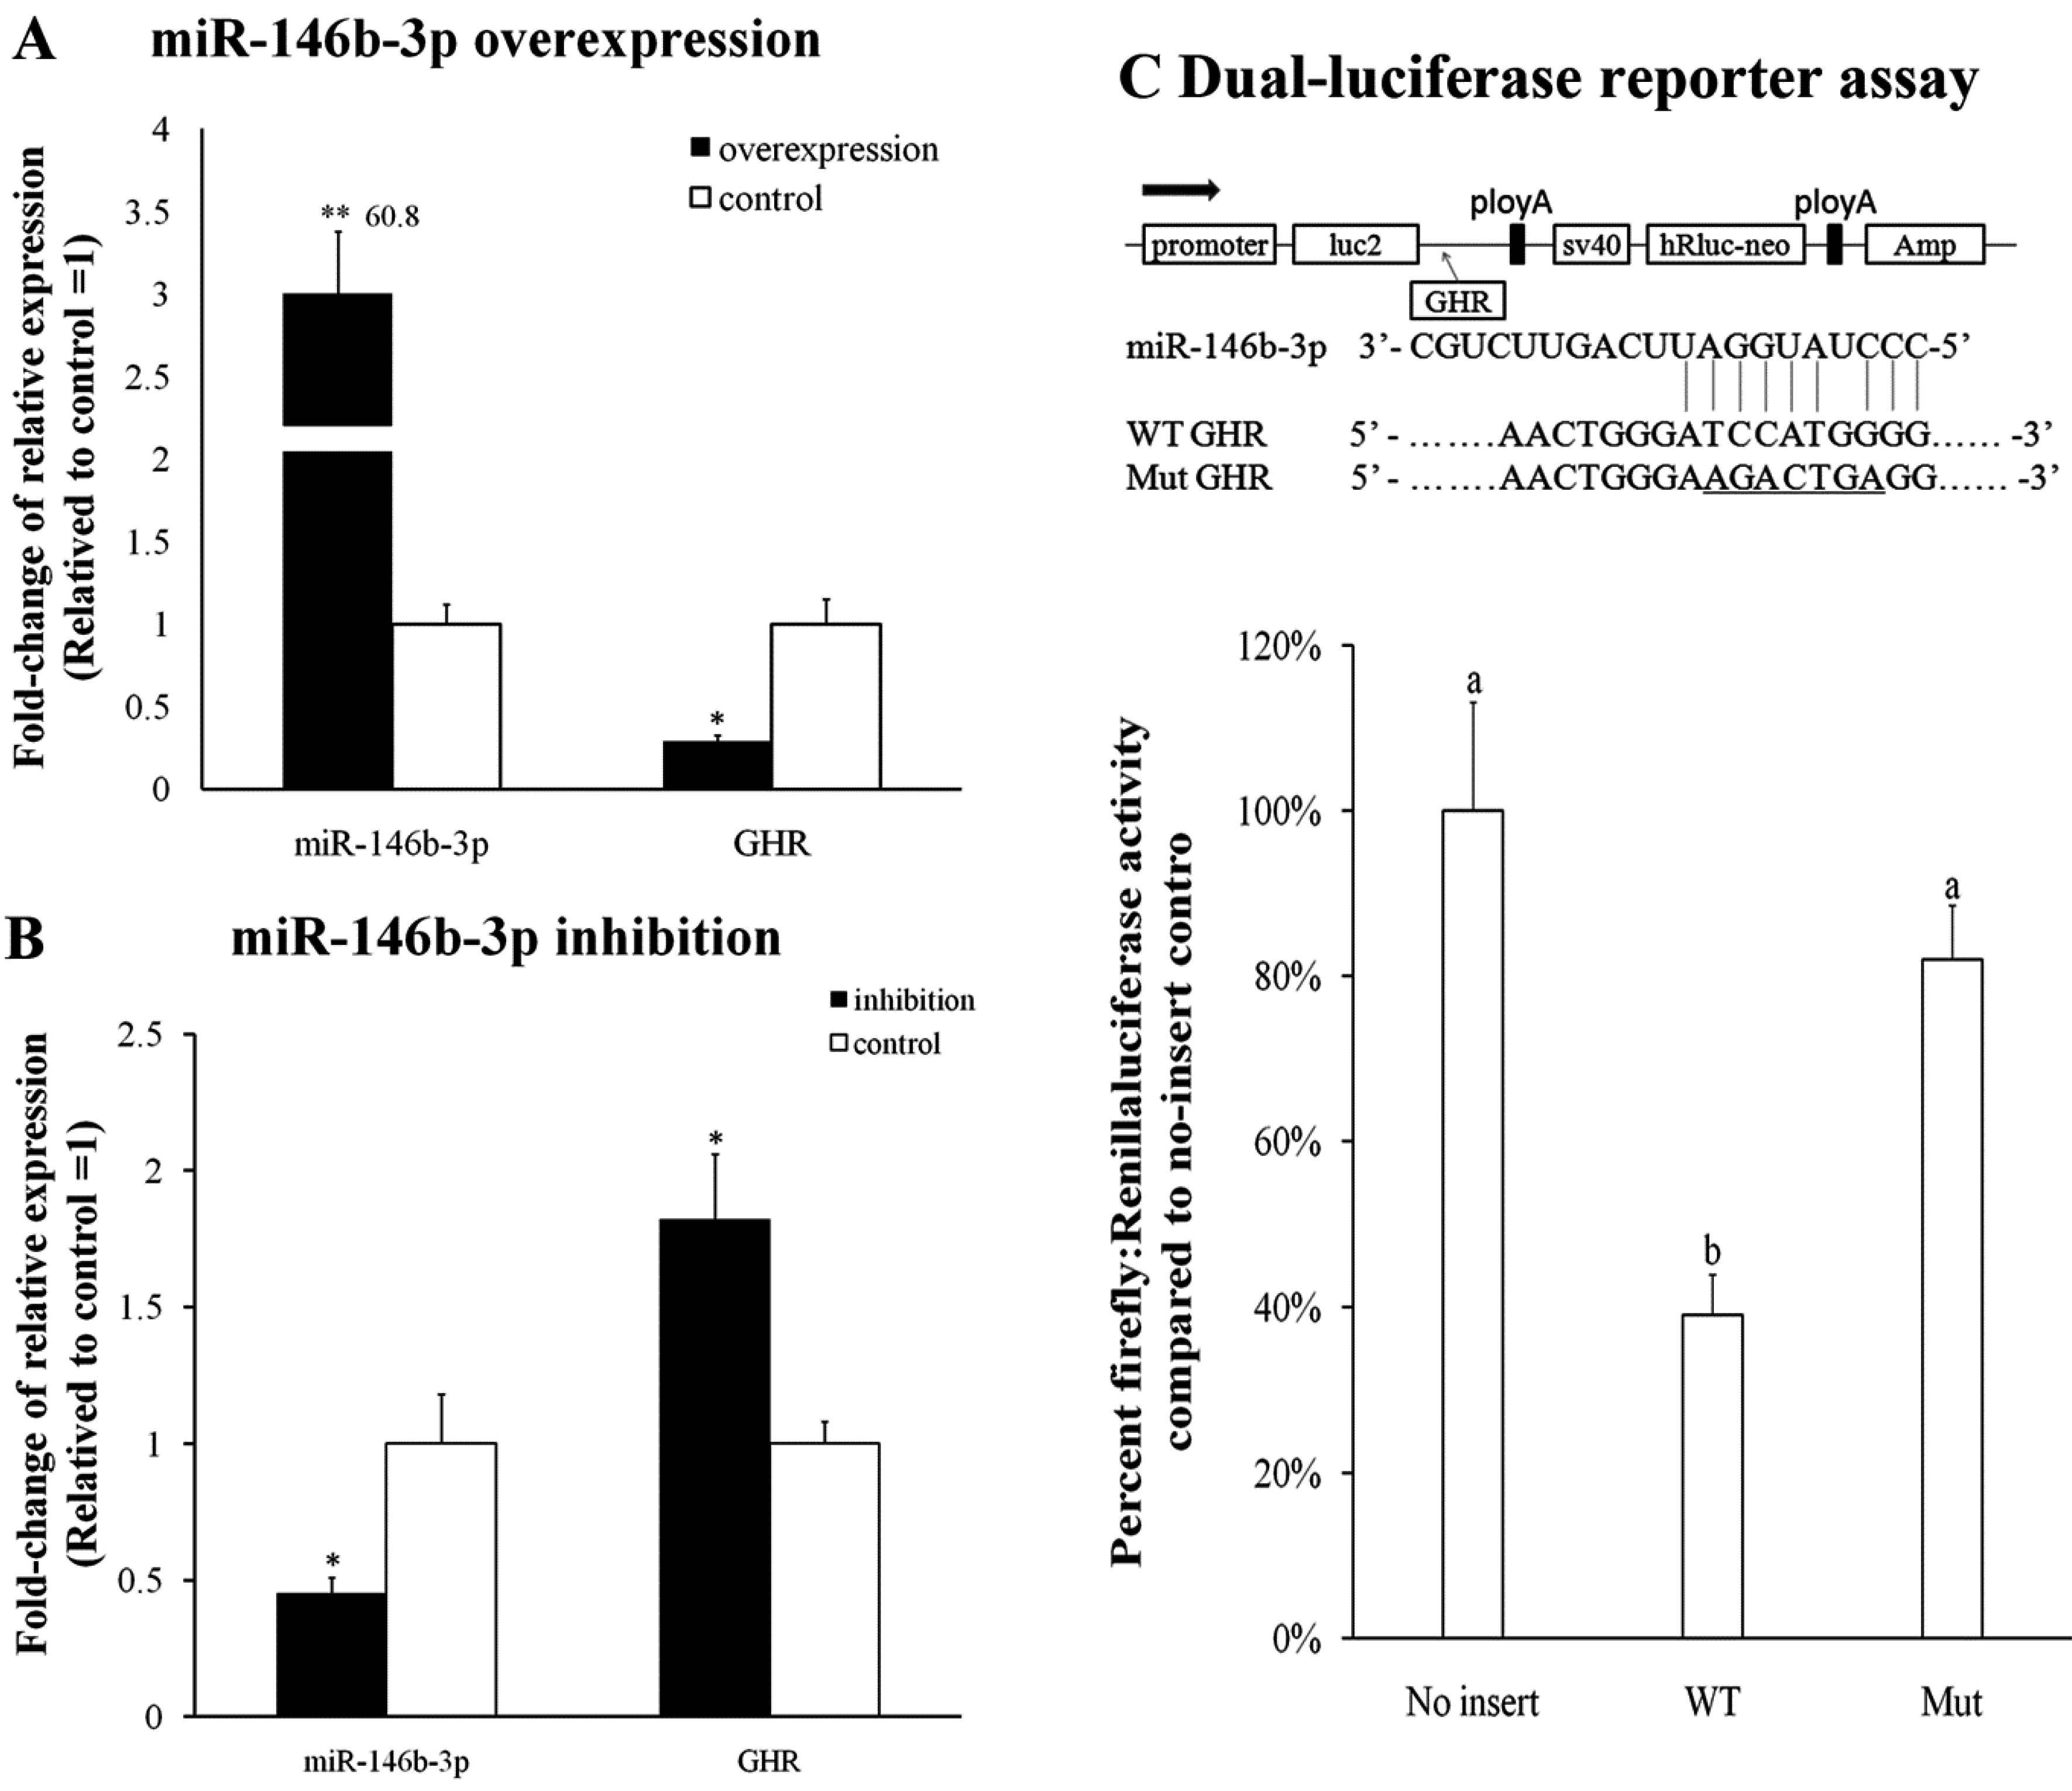
2.5. Validation of miR-146b-3p Targeted GHR Gene

DF-1 cells were transfected with miR-146b-3p mimics or inhibitor, and then the expression levels of miR-146b-3p and the GHR gene were detected after 48 h. The results show that overexpression of miR-146b-3p downregulated GHR mRNA expression (Figure 6A), and that the inhibition of endogenous miR-146b-3p increased GHR mRNA expression (Figure 6B). We constructed two dual-luciferase reporters with the wild-type or mutant of GHR inserted at the 3′ end of the firefly luciferase gene (Figure 6C). Dual-luciferase reporters assay showed that miR-146b-3p significantly reduced the firefly luciferase activity of the wild-type GHR reporter (p < 0.05) compared with no-insert control (Figure 6C). Furthermore, when miR-146b-3p was co-transfected with the mutant reporter, the firefly luciferase activity was only slightly decreased (p > 0.05) compared with the no-insert control. The expression of miR-146b-3p and GHR were detected in our sequencing samples, and the results indicate that their expression reveals a negative relationship (Figure 7). The expression of miR-146b-3p was higher (p < 0.05) in chickens with low body weight than those with high body weight in both WRR and XH chickens (Figure 7B), while the expression of GHR was higher in chickens with high body weight than those with low body weight (Figure 7C). These results indicated that the predicted site of GHR is a target of miR-146b-3p.
Figure 6. GHR is a target of miR-146b-3p in chickens. (A) The mRNA expression of c-GHR is significantly reduced after miR-146b-3p transfection in DF-1; (B) The mRNA expression of c-GHR is significantly increased after miR-146b-3p inhibitor transfection in DF-1; (C) DF-1 cells were transfected with miR-146b-3p mimic and co-transfected with no-insert control; c-GHR wild-type or mutant luciferase reporters. The predicted binding site and mutated site of miR-146b-3p in c-GHR is shown. All of the results are expressed as the mean ± S.E.M. of three replicates. * p < 0.05; ** p < 0.01; a,b p < 0.05. WT indicates c-GHR wild-type luciferase reporter and Mut indicates c-GHR mutant luciferase reporter.
Ijms 16 16242 g006
Figure 7. The expression of miR-146b-3p and GHR in breast muscle of two-tail samples of WRR and XH. (A) The reads of miR-146b-3p in four sequencing samples; (B) The expression of miR-146b-3p in two-tail samples of WRR and XH detected by qPCR; (C) The expression of GHR in two-tail samples of WRR and XH detected by qPCR. All of the results are expressed as the mean ± S.E.M. of three replicates. * p < 0.05.
Ijms 16 16242 g007

3. Discussion

Small RNA sequencing can uncover miRNAs expression at an overall level; it has become a useful tool for identifying functional miRNAs. Many miRNAs have been identified as being associated with animal growth performance by high-throughput sequencing [26,34,35]. In this study, we firstly reported the miRNAs expression profiles of chicken breast muscle between fast-growing and slow-growing chicken breeds. The sequence analysis showed that the main size of small RNAs in chicken breast muscle was 21–24, and 22 nt is the predominant size. This result was consistent with the known 19–24 nt range for miRNAs, and previous studies in chicken skeletal muscle and ovary also have similar findings [36,37]. In our sequencing libraries, a total of 921 miRNAs were detected, including 733 known miRNAs and 188 novel miRNAs. The three miRNAs of the gga-miR-133 family (gga-miR-133a, gga-miR-133b and gga-miR-133c) were the most abundant miRNAs in our breast muscle libraries. Previous studies showed that miR-133a was specifically expressed in muscle and regulates the process of skeletal muscle proliferation [38]. Overexpression of miR-133 could inhibit myoblast differentiation, but promotes myoblast proliferation by targeting SRF (serum response factor) [39]. The other abundantly expressed miRNAs family in our libraries was gga-let-7, which also was reported to have abundant expression in chicken skeletal muscle [40]. The family of let-7 miRNAs has been shown to play vital roles in mediating cell proliferation and differentiation, in particular, gga-let-7b has demonstrated a role in growth regulation through targeting GHR [26]. Of the top 20 abundantly expressed miRNAs identified, some, such as miR-133, miR-10b, miR-26a, miR-30e and gga-miR-30a were also abundantly expressed in chicken somites [41].
miRNAs have an important role in muscle tissues during embryonic development and miR-133, miR-1 and miR-206 are crucial regulatory factors during myogenesis [19,38,42,43]. In the present study, gga-miR-133 was expressed most highly in our samples, which indicated that it might also play a key role in chicken postnatal stages. Furthermore, miR-206 was also abundantly expressed in our samples, while miR-1 was not. These results suggest that some miRNAs might regulate muscle tissues during all development process, whereas some might play a key role only during a special muscle development stage. Differentially expressed miRNAs were confirmed by qPCR analysis. The good correlation between the two methods indicated that deep sequencing results were credible. A total of 22 highly differentially expressed miRNAs (fold change > 2 or < 0.5; p-value < 0.05; q-value < 0.01), which also have abundant expression (read counts > 1000) were found in our comparisons. Among these miRNAs, miR-21 was found to be highly expressed in many species, and associated with cardiac disease and a wide variety of human cancers [44,45]. In this study, miR-21 was upregulated in low-body weight of both WRR and XH chickens. Different expression levels of miR-21 were found in chicken skeletal muscle of different growth periods [26], and in skeletal muscle between broiler and layer [37]. One recent study showed that miR-21 can inhibit cell proliferation [46], suggesting that it might be a negative regulatory factor for chicken growth. These highly differentially expressed miRNAs may play a key role in chicken growth traits, and could be used as candidate genes for further study. However, with the exception of miR-21, most of these miRNAs were little known in terms of growth. It is known that the effects of miRNAs are mainly through regulating the expression of target genes [13]. Therefore, target gene prediction, and annotation of their biological function is useful to predict miRNA function. In this study, we used two different methods to predict the targets for the differently expressed miRNAs, and removed the different targets to reduce false-positive predictions. A total of 3151 consensus targets were obtained for the 22 highly differentially expressed miRNAs. The GO result showed that 192 biological process categories were significantly enriched (p < 0.05) for these targets, including many growth-related biological processes, such as regulation of growth, cell growth, muscle cell differentiation and development, and transforming growth factor beta receptor signaling pathway.
Regulatory networks of interactions among miRNAs and their targets were constructed by using String 9.1. Many target genes in the present interaction networks have been reported to play a key role in regulation of growth. GHR and GH1 are crucial genes of the hypothalamus-pituitary growth axis, which plays a major role in regulating chicken growth [47,48]. Interaction networks predicted that GHR was a target of miR-146b-3p, and this was confirmed by dual-luciferase reporter assay and qPCR in our study. Chicken miR-146b-3p may regulate muscle growth by inhibiting GHR expression. In human, miR-146b was reported to promote myogenic differentiation and modulate multiple gene targets in muscle cells, and might be involved in the pathogenesis of asthma and Myotonic Dystrophy Type-2 [49,50,51]. SOCS3 and CISH interacted with GHR directly in the network analysis. As a target of miR-34c, SOCS3 is a suppressor of cytokine signaling which affects cell proliferation, differentiation, apoptosis, and immunoregulation [52]. SOCS3 could block insulin signaling by targeting insulin receptor substrate 1 (IRS1) and insulin receptor substrate 2 (IRS2) [53]. It also blocks the JAK/STAT pathway, relying on binding to the janus kinase. CISH is a target of miR-21, miR-383 and miR-205a. CISH is also a cytokine signaling factor, such as SOCS3, which was reported to inhibit GHR-JAK2 signaling to STAT5b by interacting with the tyrosine kinase JAK2 or the cytoplasmic tail of GHR [54]. In this network, AKT1, another target of miR-146b-3p, was predicted to interact with FOXO3. The AKT-FOXO3 pathway has been reported to affect the IGF1 pathway by regulating miR-1 expression [55]. FOXO3 is an important member of the transcriptional regulatory factor FOXO family; it was found involved in insulin and the IGF1 signaling pathway, which has an important role in growth [56]. The transcriptional regulatory activity of FOXO3 can affect muscle growth, and FOXO3 knockout mice were shown to have a stronger ability to regenerate muscle [57,58]. miR-223 and miR-142-5p were found to potentially target the FOXO3 gene in our study. miR-223 was reported to associate with cell growth and proliferation, many signal pathways and various tumors [59,60,61]. It can regulate the expression of IGF1R in tumor tissue, and thus act as a potential tumor suppressor [62]. miR-223 was also found to regulate the cell proliferation by decreasing the FOXO1 gene expression in human [63]. Some studies indicate that miR-142-5p could target and regulate cell cycle related genes, and inhibit vascular smooth muscle cell proliferation by down-regulating cell cycle progression [64,65]. The TGF-β signaling pathway is involved in many cellular processes including cell growth and differentiation [66,67], and the TGF-β signaling gene was also involved in the present network. TGFBR2 was regulated by miR-9-3p and interacted with TGFB and TGFBR1. All these investigations indicate that the highly differentially expressed miRNAs are closely related to growth of chicken through interaction with their target genes; further studies are needed to reveal their regulatory mechanisms involved in chicken growth.

4. Experimental Section

4.1. Ethics Statement

Animal experiments were handled in compliance with and approved by the Animal Care Committee of South China Agricultural University (Guangzhou, China) with approval number SCAU#0011, 3 August 2010. All efforts were made to minimize animal subject suffering.

4.2. Sample Preparation

Two chicken breeds, WRR (a breed with a fast growth rate) and XH (Chinese native breed with a slow growth rate), were used for Solexa sequencing. In this study, the animals were the same as those used in our previous research on MeDIP-Seq [68]. Three female birds from each of the two-tail groups of WRR and XH at 7 weeks were selected, and then four groups including WRRh, WRRl, XHh and XHl were generated. The averages of body weight values were 1064.0 ± 11.1, 695.0 ± 24.4, 305.8 ± 23.3, and 207.6 ± 11.1 g for WRRh, WRRl, XHh, and XHl group, respectively. All chickens were euthanized by decapitation for tissues collection. Breast muscle tissues of the 12 individuals were rapidly dissected and immediately placed in liquid nitrogen then stored at −80 °C.

4.3. Small RNA Library Construction and Solexa Sequencing

Total RNA was extracted from each breast muscle using Trizol (Invitrogen, Carlsbad, CA, USA) according to the manufacturer’s instructions. The quality and concentration of all twelve RNA samples were determined by 1.5% agarose gel electrophoresis and absorbance at A260/280 ratio, and then divided to four mixed RNA pools for WRRh, WRRl, XHh, and XHl. Subsequently, 20 µg of total RNA were purified by denaturing 15% PAGE to enrich for 16–32 nt small RNAs, and then ligated with proprietary adapters. The ligated products were purified and reverse transcribed to cDNA to produce libraries. Finally, the libraries were deep sequenced using Genome Analyzer IIx (Illumina, San Diego, CA, USA) at Shanghai Majorbio Bio-pharm Biotechnology Co., Ltd. (Shanghai, China).

4.4. Sequence Analysis

The original image figure from sequencing was converted into sequence data (raw reads) by the base-calling step. For all generated raw reads, adaptor sequences, low quality reads (Sanger bases quality < 20), and contaminant reads were removed with the Fastx-Toolkit software [69]. The final data were named as clean reads. Firstly, clean reads from 18–32 nt were counted and the identical sequences eliminated. Subsequently, the assembled unique sequences were identified for the type and number of small RNA (rRNAs, tRNA, sn/snoRNAs, miRNAs, other noncoding RNAs) using Rfam databases 10.1 (http://rfam.sanger.ac.uk/). Meanwhile, the sequences were mapped to chicken genome to annotate the location in the chromosomes using Bowtie [70]. Finally, the remaining sequences were analyzed through BLASTing the miRbase 21.0 (http://www.mirbase.org/), to identify the known miRNAs in chicken. Furthermore, the novel miRNAs were predicted using miRDeep2 (https://www.mdc-berlin.de/8551903/en/) [28] from unannotated sRNAs.

4.5. Analysis of Differently Expressed miRNAs

DEGseq package (http://www.bioconductor.org/packages/release/bioc/html/DEGseq.html) was used to analyze differentially expressed miRNAs in this study [71]. The miRNAs expression in each library (WRRh, WRRl, XHh, and XHl) was normalized to obtain the expression of transcripts per million using total clean reads count. If the normalized reads of a given miRNAs is less than 20 in all libraries, it was removed in future differential expression analyses. Two contrasts of WRRh vs. WRRl and XHh vs. XHl were analyzed, and the fold-changes and p-value were calculated from the normalized reads. The differentially expressed miRNAs are identified only if |log2Ratio| > 0.585 (fold-change value > 1.5) and p-value < 0.05.

4.6. Target Gene Prediction, Pathway and Network Analysis

Both known and novel miRNAs were used to predict the miRNAs potential targets by RNAhybrid (http://bibiserv.techfak.uni-bielefeld.de/rnahybrid/) [31] and miranda (http://www.microrna.org/microrna/home.do) [30]. Only the target genes predicted by both of two methods were considered as reliable targets for further analysis. All target genes of differentially expressed miRNAs were subjected to Gene Ontology (GO) and KEGG pathway enrichment analysis by using DAVID 6.7 Functional Annotation Tool (http://david.abcc.ncifcrf.gov/). The results were filtered based on a Fisher Exact statistic methodology similar to that previously described [72]. Gene interaction analysis was performance by String 9.1 (http://www.string-db.org/) [32], and a medium Pearson Correlation Coefficient (PCC) value of 0.4 was used as a cutoff [73].

4.7. RNA Oligonucleotides and Transfection

The miR-146b-3p mimics, inhibitors of miR-146b-3p, mimic NC and inhibitor NC were purchased from GenePharma (GenePharma, Suzhou, China). The DF-1 chicken fibroblast cell line was cultured at 37 °C in high-glucose Dulbecco’s modified Eagle’s medium (Gibco, Grand Island, NY, USA) supplemented with 10% (v/v) fetal bovine serum (Hyclone, Logan, UT, USA), and 100 μg/mL penicillin/ streptomycin (Invitrogen). Transfection was performed with the Lipofectamine 3000 reagent (Invitrogen) combined with 50 nM of miRNA mimics, 120 nM of inhibitors, and the procedure was performed according to the manufacturer’s instructions.

4.8. cDNA Synthesis and Quantitative Real Time PCR (qPCR)

Total RNA of each sample and cultured cells were polyadenylated and reverse transcribed to cDNA using miScript Reverse Transcription kit (Qiagen, Valencia, CA, USA). The miScript SYBR Green PCR kit (Qiagen, Valencia, CA, USA) was used in qPCR to determine the expression of miRNA. U6 and GAPDH genes were chosen as reference genes for miRNAs and gene expression respectively. The primers of miRNAs and related genes were designed by Primer 5.0 (Table S6 in supplementary information), and universal primer of miRNAs was offered by miScript SYBR Green PCR kit. qPCR program was performed in a BIO-RAD CFX96 system (Bio-Rad Laboratories Inc., Hercules, CA, USA) as follows: 95 °C for 2 min; 40 cycles of 95 °C for 10 s, 56 °C for 30 s; 72 °C for 30 s and 72 °C for 1 min. The relative expression level of miRNA was calculated using the comparative 2−∆Ct (∆Ct = Cttarget geneCtU6). Fold change values were calculated using the comparative 2−∆∆Ct, in which ∆∆Ct = ∆Ct (target gene) − ∆Ct (reference gene). All reactions were run in triplicate and presented as means ± S.E.M. The Student’s t-test was used to compare expression levels among different groups.

4.9. pmirGLO Dual-Luciferase miRNA Target Expression Vector Construction and Dual-Luciferase Reporter Assay

The sequences of c-GHR were amplified from the chicken genome and cloned into the pmirGLO dual-luciferase reporter vector (Promega, Madison, WI, USA) using the Pme I and xho I restriction sites. The mutant c-GHR plasmids were generated through changing the miR-146b-3p binding site from ATCCAT to AAGACT (Figure 7C), and mutagenesis was performed by PCR amplification and DpnI digestion to remove the parental DNA. DF-1 cells were co-transfected with 100 ng of the wild-type, mutant 3′-UTR or no-insert control dual-luciferase reporter and 50 nM of the miR-146b-3p mimic using Lipofectamine 3000 reagent in 96-well plates. After transfection for 48 h, the activities of firefly and Renilla luciferase were analysed using a dual-luciferase reporter assay system (Promega) following the manufacturer’s instructions. The luminescent signal was quantified using a Fluorescence/Multi-Detection Microplate Reader (Synergy 2, Biotek, Winooski, VT, USA) and analyzed with Gene5 software (Biotek, Bad Friedichshall, Germany).

5. Conclusions

In the present study, we have characterized the miRNAs expression profile of breast muscle between fast- and slow-growing chickens for the first time. There were 80 and 110 shared differentially expressed miRNAs identified in within-breed comparisons (WRRh vs. WRRl, and XHh vs. XHl) and across-breed contrasts (WRRh vs. XHh, and WRRl vs. XHl), respectively. Moreover, there were 26 miRNAs significantly differentially expressed among all four comparisons. We focused on 22 highly differentially expressed miRNAs that also were abundantly expressed. To investigate the functional roles of these miRNAs, GO analysis and the interaction network of these miRNAs and their putative targets were constructed. These integrated analyses may predict several candidates for future studies concerning miRNAs-target function on regulation of chicken growth.

Supplementary Materials

Acknowledgments

This research was funded by the Program for New Century Excellent Talents in University (NCET-13-0803), the Natural Scientific Foundation of China (31172200; 31472090), and the Foundation for High-level Talents in Higher Education of Guangdong, China. The funders played no role in the study design, data collection and analysis, the decision to publish, or in the preparation of the manuscript.

Author Contributions

Hongjia Ouyang carried out the data analysis and drafted the manuscript. Xiaomei He and Guihuan Li performed the validation experiments. Haiping Xu and Xingzheng Jia helped to analyse and interpret data. Qinghua Nie conceived and designed the study and helped to draft the manuscript. Xiquan Zhang helped with the conception and design of the study. All authors read and approved the final manuscript.

Conflicts of Interest

The authors declare no conflict of interest.

References

  1. Scanes, C.G.; Harvey, S.; Marsh, J.A.; King, D.B. Hormones and growth in poultry. Poult. Sci. 1984, 63, 2062–2074. [Google Scholar] [CrossRef] [PubMed]
  2. Carlborg, O.; Kerje, S.; Schutz, K.; Jacobsson, L.; Jensen, P.; Andersson, L. A global search reveals epistatic interaction between QTL for early growth in the chicken. Genome Res. 2003, 13, 413. [Google Scholar] [CrossRef] [PubMed]
  3. Ankra-Badu, G.A.; Le Bihan-Duval, E.; Mignon-Grasteau, S.; Pitel, F.; Beaumont, C.; Duclos, M.J.; Simon, J.; Carré, W.; Porter, T.E.; Vignal, A.; et al. Mapping QTL for growth and shank traits in chickens divergently selected for high or low body weight. Anim. Genet. 2010, 41, 400–405. [Google Scholar] [CrossRef] [PubMed]
  4. Gao, Y.; Hu, X.X.; Du, Z.; Deng, X.M.; Huang, Y.H.; Fei, J.; Feng, J.D.; Liu, Z.L.; Da, Y.; Li, N. A genome scan for quantitative trait loci associated with body weight at different developmental stages in chickens. Anim. Genet. 2006, 37, 276–278. [Google Scholar] [CrossRef] [PubMed]
  5. Lei, M.; Peng, X.; Zhou, M.; Luo, C.; Nie, Q.; Zhang, X. Polymorphisms of the IGF1R gene and their genetic effects on chicken early growth and carcass traits. BMC Genet. 2008, 9, 70. [Google Scholar] [CrossRef] [PubMed]
  6. Darzi Niarami, M.; Masoudi, A.A.; Vaez Torshizi, R. Association of single nucleotide polymorphism of GHSR and TGFB2 genes with growth and body composition traits in sire and dam lines of a broiler chicken. Anim. Biotechnol. 2014, 25, 13–22. [Google Scholar] [CrossRef] [PubMed]
  7. Nie, Q.H.; Fang, M.X.; Xie, L.; Shen, X.; Liu, J.; Luo, Z.P.; Shi, J.J.; Zhang, X.Q. Associations of ATGL gene polymorphisms with chicken growth and fat traits. J. Appl. Genet. 2003, 51, 185–191. [Google Scholar] [CrossRef] [PubMed]
  8. Gu, X.; Feng, C.; Ma, L.; Song, C.; Wang, Y.; Da, Y.; Li, H.; Chen, K.; Ye, S.; Ge, C.; et al. Genome-wide association study of body weight in chicken F2 resource population. PLoS ONE 2011, 6, e21872. [Google Scholar] [CrossRef] [PubMed]
  9. Xie, L.; Luo, C.; Zhang, C.; Zhang, R.; Tang, J.; Nie, Q.; Ma, L.; Hu, X.; Li, N.; Da, Y.; et al. Genome-wide association study identified a narrow chromosome 1 region associated with chicken growth traits. PLoS ONE 2012, 7, e30910. [Google Scholar] [CrossRef] [PubMed]
  10. Ahsan, M.; Li, X.; Lundberg, A.E.; Kierczak, M.; Siegel, P.B.; Carlborg, O.; Marklund, S. Identification of candidate genes and mutations in QTL regions for chicken growth using bioinformatic analysis of NGS and SNP-chip data. Front. Genet. 2013, 4, 226. [Google Scholar] [CrossRef] [PubMed]
  11. Sheng, Z.; Pettersson, M.E.; Hu, X.; Luo, C.; Qu, H.; Shu, D.; Shen, X.; Carlborg, O.; Li, N. Genetic dissection of growth traits in a Chinese indigenous × commercial broiler chicken cross. BMC Genomics 2013, 14, 151. [Google Scholar] [CrossRef] [PubMed]
  12. Wang, H.; Misztal, I.; Aguilar, I.; Legarra, A.; Fernando, R.L.; Vitezica, Z.; Okimoto, R.; Wing, T.; Hawken, R.; Muir, W.M. Genome-wide association mapping including phenotypes from relatives without genotypes in a single-step (ssGWAS) for 6-week body weight in broiler chickens. Front. Genet. 2014, 5, 134. [Google Scholar] [CrossRef] [PubMed]
  13. Zhang, B.H.; Wang, Q.L.; Pan, X.P. MicroRNAs and their regulatory roles in animals and plants. J. Cell. Physiol. 2007, 210, 279–289. [Google Scholar] [CrossRef] [PubMed]
  14. Cullen, B.R. MicroRNAs as mediators of viral evasion of the immune system. Nat. Immunol. 2013, 14, 205–210. [Google Scholar] [CrossRef] [PubMed]
  15. Muers, M. Small RNA: Long-lived microRNA complexes. Nat. Rev. Genet. 2013, 14, 78. [Google Scholar] [CrossRef] [PubMed]
  16. Hitachi, K.; Tsuchida, K. Role of microRNAs in skeletal muscle hypertrophy. Front. Physiol. 2014, 4, 408. [Google Scholar] [CrossRef] [PubMed]
  17. Duan, R.; Pak, C.; Jin, P. Single nucleotide polymorphism associated with mature miR-125a alters the processing of pri-miRNA. Hum. Mol. Genet. 2007, 16, 1124–1131. [Google Scholar] [CrossRef] [PubMed]
  18. Wang, N.; Li, Y.; Zhou, R.M.; Wang, G.Y.; Wang, C.M.; Chen, Z.F.; Liu, W. Hsa-miR-196a2 functional SNP is associated with the risk of ESCC in individuals under 60 years old. Biomarkers 2014, 19, 43–48. [Google Scholar] [CrossRef] [PubMed]
  19. Cordes, K.R.; Srivastava, D.; Ivey, K.N. MicroRNAs in cardiac development. Pediatr. Cardiol. 2010, 31, 349–356. [Google Scholar] [CrossRef] [PubMed]
  20. Glazov, E.A.; Cottee, P.A.; Barris, W.C.; Moore, R.J.; Dalrymple, B.P.; Tizard, M.L. A microRNA catalog of the developing chicken embryo identified by a deep sequencing approach. Genome Res. 2008, 18, 957–964. [Google Scholar] [CrossRef] [PubMed]
  21. Hicks, J.A.; Tembhurne, P.; Liu, H.C. MicroRNA expression in chicken embryos. Poult. Sci. 2008, 87, 2335–2343. [Google Scholar] [CrossRef] [PubMed]
  22. Hicks, J.A.; Trakooljul, N.; Liu, H.C. Discovery of chicken microRNAs associated with lipogenesis and cell proliferation. Physiol. Genomics 2010, 41, 185–193. [Google Scholar] [CrossRef] [PubMed]
  23. Hicks, J.A.; Tembhurne, P.A.; Liu, H.C. Identification of microRNA in the developing chick immune organs. Immunogenetics 2009, 61, 231–240. [Google Scholar] [CrossRef] [PubMed]
  24. Lian, L.; Qu, L.; Chen, Y.; Lamont, S.J.; Yang, N. A systematic analysis of miRNA transcriptome in Marek’s disease virus-induced lymphoma reveals novel and differentially expressed miRNAs. PLoS ONE 2012, 7, e51003. [Google Scholar] [CrossRef] [PubMed]
  25. Tian, F.; Luo, J.; Zhang, H.; Chang, S.; Song, J. MiRNAs expression signatures induced by Marek’s disease virus infection in chickens. Genomics 2012, 99, 152–159. [Google Scholar] [CrossRef] [PubMed]
  26. Lin, S.; Li, H.; Mu, H.; Luo, W.; Li, Y.; Jia, X.; Wang, S.; Nie, Q.; Li, Y.; Zhang, X. Let-7b regulates the expression of the growth hormone receptor gene in deletion-type dwarf chickens. BMC Genomics 2012, 13, 306. [Google Scholar] [CrossRef] [PubMed]
  27. National Center for Biotechnology Information, Gene Expression Omnibus. Available online: http://0-www-ncbi-nlm-nih-gov.brum.beds.ac.uk/geo/query/acc.cgi?acc=GSE62971 (accessed on 5 November 2014).
  28. Friedländer, M.R.; Chen, W.; Adamidi, C.; Maaskola, J.; Einspanier, R.; Knespel, S.; Rajewsky, N. Discovering microRNAs from deep sequencing data using miRDeep. Nat. Biotechnol. 2008, 26, 407–415. [Google Scholar] [CrossRef] [PubMed]
  29. Kuchenbauer, F.; Morin, R.D.; Argiropoulos, B.; Petriv, O.I.; Griffith, M.; Heuser, M.; Yung, E.; Piper, J.; Delaney, A.; Prabhu, A.L.; et al. Humphries RK: In-depth characterization of the microRNA transcriptome in a leukemia progression model. Genome Res. 2009, 18, 1787–1797. [Google Scholar] [CrossRef] [PubMed]
  30. Betel, D.; Wilson, M.; Gabow, A.; Marks, D.S.; Sander, C. The microRNA.org resource: Targets and expression. Nucleic Acids Res. 2008, 36, D149–D153. [Google Scholar] [CrossRef] [PubMed]
  31. Rehmsmeier, M.; Steffen, P.; Hoechsmann, M.; Giegerich, R. Fast and effective prediction of microRNA/target duplexes RNA. RNA 2004, 10, 1507–1517. [Google Scholar] [CrossRef] [PubMed]
  32. Franceschini, A.; Szklarczyk, D.; Frankild, S.; Kuhn, M.; Simonovic, M.; Roth, A.; Lin, J.; Minguez, P.; Bork, P.; Jensen, L.J. STRING v9.1: Protein–protein interaction networks, with increased coverage and integration. Nucleic Acids Res. 2013, 41, D808–D815. [Google Scholar] [CrossRef] [PubMed]
  33. Xu, Z.; Nie, Q.; Zhang, X. Overview of genomic insights into chicken growth traits based on genome-wide association study and microRNA regulation. Curr. Genomics 2013, 14, 137–146. [Google Scholar] [CrossRef] [PubMed]
  34. Wang, X.; Gu, Z.; Jiang, H. MicroRNAs in farm animals. Animal 2013, 7, 1567–1575. [Google Scholar] [CrossRef] [PubMed]
  35. Zhao, S.; Zhang, J.; Hou, X.; Zan, L.; Wang, N.; Tang, Z.; Li, K. OLFML3 expression is decreased during prenatal muscle development and regulated by microRNA-155 in pigs. Int. J. Biol. Sci. 2012, 8, 459–469. [Google Scholar] [CrossRef] [PubMed]
  36. Li, T.; Wu, R.; Zhang, Y.; Zhu, D. A systematic analysis of the skeletal muscle miRNA transcriptome of chicken varieties with divergent skeletal muscle growth identifies novel miRNAs and differentially expressed miRNAs. BMC Genomics 2011, 12, 186. [Google Scholar] [CrossRef] [PubMed]
  37. Kang, L.; Cui, X.; Zhang, Y.; Yang, C.; Jiang, Y. Identification of miRNAs associated with sexual maturity in chicken ovary by Illumina small RNA deep sequencing. BMC Genomics 2013, 14, 352. [Google Scholar] [CrossRef] [PubMed]
  38. Chen, J.F.; Mandel, E.M.; Thomson, J.M.; Wu, Q.; Callis, T.E.; Hammond, S.M.; Conlon, F.L.; Wang, D.Z. The role of microRNA-1 and microRNA-133 in skeletal muscle proliferation and differentiation. Nat. Genet. 2006, 38, 228–233. [Google Scholar] [CrossRef] [PubMed]
  39. Huang, M.; Xu, H.; Xie, S.; Zhou, H.; Qu, L. Insulin-like growth factor-1 receptor is regulated by microRNA-133 during skeletal myogenesis. PLoS ONE 2011, 6, e29173. [Google Scholar] [CrossRef] [PubMed]
  40. Wang, X.; Yu, J.; Zhang, Y.; Gong, D.; Gu, Z. Identification and characterization of microRNA from chicken adipose tissue and skeletal muscle. Poult. Sci. 2012, 91, 139–149. [Google Scholar] [CrossRef] [PubMed]
  41. Rathjen, T.; Pais, H.; Sweetman, D.; Moulton, V.; Munsterberg, A.; Dalmay, T. High throughput sequencing of microRNAs in chicken somites. FEBS Lett. 2009, 583, 1422–1426. [Google Scholar] [CrossRef] [PubMed]
  42. Darnell, D.K.; Kaur, S.; Stanislaw, S.; Konieczka, J.K.; Yatskievych, T.A.; Antin, P.B. MicroRNA expression during chick embryo development. Dev. Dyn. 2006, 235, 3156–3165. [Google Scholar] [CrossRef] [PubMed]
  43. Goljanek-Whysall, K.; Sweetman, D.; Abu-Elmagd, M.; Chapnik, E.; Dalmay, T.; Hornstein, E.; Münsterberg, A. MicroRNA regulation of the paired-box transcription factor Pax3 confers robustness to developmental timing of myogenesis. Proc. Natl. Acad. Sci. USA 2011, 19, 11936–11941. [Google Scholar] [CrossRef] [PubMed] [Green Version]
  44. Thum, T.; Gross, C.; Fiedler, J.; Fischer, T.; Kissler, S.; Bussen, M.; Galuppo, P.; Just, S.; Rottbauer, W.; Frantz, S.; et al. MicroRNA-21 contributes to myocardial disease by stimulating MAP kinase signalling in fibroblasts. Nature 2008, 456, 980–984. [Google Scholar] [CrossRef] [PubMed]
  45. Papagiannakopoulos, T.; Shapiro, A.; Kosik, K.S. MicroRNA-21 targets a network of key tumor-suppressive pathways in glioblastoma cells. Cancer Res. 2008, 68, 8164–8172. [Google Scholar] [CrossRef] [PubMed]
  46. Lin, L.; Gan, H.; Zhang, H.; Tang, W.; Sun, Y.; Tang, X.; Kong, D.; Zhou, J.; Wang, Y.; Zhu, Y. MicroRNA-21 inhibits SMAD7 expression through a target sequence in the 3′ untranslated region and inhibits proliferation of renal tubular epithelial cells. Mol. Med. Rep. 2014, 10, 707–712. [Google Scholar] [CrossRef] [PubMed]
  47. Kuhn, E.R.; Geelissen, S.M.; van der, G.S.; Darras, V.M. The release of growth hormone (GH): Relation to the thyrotropic and corticotropic axis in the chicken. Domest. Anim. Endocrinol. 2006, 29, 43–51. [Google Scholar] [CrossRef] [PubMed]
  48. Nie, Q.; Sun, B.; Zhang, D.; Luo, C.; Ishag, N.A.; Lei, M.; Yang, G.; Zhang, X. High diversity of the chicken growth hormone gene and effects on growth and carcass traits. J. Hered. 2005, 96, 698–703. [Google Scholar] [CrossRef] [PubMed]
  49. Greco, S.; Perfetti, A.; Fasanaro, P.; Cardani, R.; Capogrossi, M.C.; Meola, G.; Martelli, F. Deregulated microRNAs in myotonic dystrophy type 2. PLoS ONE 2012, 7, e39732.46. [Google Scholar] [CrossRef] [PubMed]
  50. Khanna, N.; Ge, Y.; Chen, J. MicroRNA-146b promotes myogenic differentiation and modulates multiple gene targets in muscle cells. PLoS ONE 2014, 9, e100657. [Google Scholar] [CrossRef] [PubMed]
  51. Comer, B.S.; Camoretti-Mercado, B.; Kogut, P.C.; Halayko, A.J.; Solway, J.; Gerthoffer, W.T. MicroRNA-146a and microRNA-146b expression and anti-inflammatory function in human airway smooth muscle. Am. J. Physiol. Lung Cell. Mol. Physiol. 2014, 307, L727-34.48. [Google Scholar] [CrossRef] [PubMed]
  52. Tamiya, T.; Kashiwagi, I.; Takahashi, R.; Yasukawa, H.; Yoshimura, A. Suppressors of cytokine signaling (SOCS) proteins and JAK/STAT pathways: Regulation of T-cell inflammation by SOCS1 and SOCS3. Arterioscler. Thromb. Vasc. Biol. 2011, 31, 980–985. [Google Scholar] [CrossRef] [PubMed]
  53. Rui, L.; Yuan, M.; Frantz, D.; Shoelson, S.; White, M. SOCS-1 and SOCS-3 block insulin signaling by ubiquitin-mediated degradation of IRS1 and IRS2. J. Biol. Chem. 2002, 277, 42394–42398. [Google Scholar] [CrossRef] [PubMed]
  54. Ram, P.A.; Waxman, D.J. Role of the cytokine-inducible SH2 protein CIS in desensitization of STAT5b signaling by continuous growth hormone. J. Biol. Chem. 2000, 275, 39487–39496. [Google Scholar] [CrossRef] [PubMed]
  55. Elia, L.; Contu, R.; Quintavalle, M.; Varrone, F.; Chimenti, C.; Russo, M.A.; Cimino, V.; de Marinis, L.; Frustaci, A.; Condorelli, G. Reciprocal regulation of microRNA-1 and insulin-like growth factor-1 signal transduction cascade in cardiac and skeletal muscle in physiological and pathological conditions. Circulation 2009, 120, 2377–2385. [Google Scholar] [CrossRef] [PubMed]
  56. Taniguchi, C.M.; Emanuelli, B.; Kahn, C.R. Critical nodes in signalling pathways: Insights into insulin action. Nat. Rev. Mol. Cell Biol. 2006, 7, 85–96. [Google Scholar] [CrossRef] [PubMed]
  57. Lee, D.; Goldberg, A.L. SIRT1 protein; by blocking the activities of transcription factors FoxO1 and FoxO3; inhibits muscle atrophy and promotes muscle growth. J. Biol. Chem. 2013, 288, 30515–30526. [Google Scholar] [CrossRef] [PubMed]
  58. Hu, P.; Geles, K.G.; Paik, J.H.; DePinho, R.A.; Tjian, R. Codependent activators direct myoblast-specific MyoD transcription. Dev. Cell 2008, 15, 534–546. [Google Scholar] [CrossRef] [PubMed]
  59. Haneklaus, M.; Gerlic, M.; OʼNeill, L.A.; Masters, S.L. miR-223: Infection, inflammation and cancer. J. Intern. Med. 2013, 274, 215–226. [Google Scholar] [CrossRef] [PubMed]
  60. McGirt, L.Y.; Adams, C.M.; Baerenwald, D.A.; Zwerner, J.P.; Zic, J.A.; Eischen, C.M. miR-223 regulates cell growth and targets proto-oncogenes in mycosis fungoides/cutaneous T-cell lymphoma. J. Investig. Dermatol. 2013, 134, 1101–1107. [Google Scholar] [CrossRef] [PubMed]
  61. Shi, L.; Fisslthaler, B.; Zippel, N.; Frömel, T.; Hu, J.; Elgheznawy, A.; Heide, H.; Popp, R.; Fleming, I. MicroRNA-223 antagonizes angiogenesis by targeting β1 integrin and preventing growth factor signaling in endothelial cells. Circ. Res. 2013, 113, 1320–1330. [Google Scholar] [CrossRef] [PubMed]
  62. Wu, L.H.; Cai, Q.Q.; Dong, Y.W.; Wang, R.; He, B.M.; Qi, B.; Xu, C.J.; Wu, X.Z. Decoy oligonucleotide rescues IGF1R expression from microRNA-223 suppression. PLoS ONE 2013, 8, e82167. [Google Scholar] [CrossRef] [PubMed]
  63. Wu, L.; Li, H.; Jia, C.Y.; Cheng, W.; Yu, M.; Peng, M.; Zhu, Y.; Zhao, Q.; Dong, Y.W.; Shao, K.; et al. MicroRNA-223 regulates FOXO1 expression and cell proliferation. FEBS Lett. 2012, 586, 1038–1043. [Google Scholar] [CrossRef] [PubMed]
  64. Kee, H.J.; Park, S.; Kwon, J.S.; Choe, N.; Ahn, Y.; Kook, H.; Jeong, M.H. B cell translocation gene; a direct target of miR-142-5p; inhibits vascular smooth muscle cell proliferation by down-regulating cell cycle progression. FEBS Lett. 2013, 587, 2385–2392. [Google Scholar] [CrossRef] [PubMed]
  65. Su, Y.H.; Zhou, Z.; Yang, K.P.; Wang, X.G.; Zhu, Y.; Fa, X.E. miR-142-5p and miR-9 may be involved in squamous lung cancer by regulating cell cycle related genes. Eur. Rev. Med. Pharmacol. Sci. 2013, 17, 3213–3220. [Google Scholar] [PubMed]
  66. Wrana, J.L.; Attisano, L.; Carcamo, J. TGF-β signals through a heteromeric protein kinase receptor complex. Cell 1992, 71, 1003–1014. [Google Scholar] [CrossRef]
  67. Massague, J.; Chen, Y.G. Controlling TGF-β signaling. Genes Dev. 2000, 14, 627–644. [Google Scholar] [PubMed]
  68. Hu, Y.; Xu, H.; Li, Z.; Zheng, X.; Jia, X.; Nie, Q.; Zhang, X. Comparison of the genome-wide DNA methylation profiles between fast-growing and slow-growing broilers. PLoS ONE 2013, 8, e56411. [Google Scholar] [CrossRef] [PubMed]
  69. FASTX-Toolkit. Available online: http://hannonlab.cshl.edu/fastx_toolkit (accessed on 2 February 2010).
  70. Bowtie. Available online: http://bowtie-bio.sourceforge.net/index.shtml (accessed on 9 April 2013).
  71. Wang, L.; Feng, Z.; Wang, X.; Zhang, X. DEGSeq: An R package for identifying differentially expressed genes from RNA-Seq data. Bioinformatics 2010, 26, 136–138. [Google Scholar] [CrossRef] [PubMed]
  72. Huang, D.W.; Sherman, B.T.; Zheng, X.; Yang, J.; Imamichi, T. Extracting biological meaning from large gene lists with DAVID. Curr. Protoc. Bioinform. 2009. [Google Scholar] [CrossRef]
  73. Jansen, R.; Greenbaum, D.; Gerstein, M. Relating whole-genome expression data with protein–protein interactions. Genome Res. 2002, 12, 37–46. [Google Scholar] [CrossRef] [PubMed]

