
Changes of the Cytoplasmic Proteome in Response to Alcoholic Hepatotoxicity in Rats

Abstract
:1. Introduction
2. Results
2.1. Body Weight and Serum Biochemical Analyses

| Week | Control (mg) | Ethanol (mg) |
|---|---|---|
| 0 | 104 ± 2.3 | 102 ± 1.4 |
| 1 | 124 ± 10.8 | 117 ± 5.7 |
| 2 | 137 ± 8.7 | 127 ± 6.6 |
| 3 | 166 ± 8.3 | 156 ± 5.7 * |
| 4 | 198 ± 15.2 | 181 ± 5.2 * |
| Group | ALT (IU/L) | Cholesterol (mg/dL) | HDL (mg/dL) | LDL (mg/dL) | Phospholipid (mg/dL) | Triglyceride (mg/dL) |
|---|---|---|---|---|---|---|
| Control (2 weeks) | 36.6 ± 6.31 | 77.4 ± 12.5 | 30.4 ± 3.78 | 15.6 ± 5.94 | 142.6 ± 12.76 | 78.0 ± 46.50 |
| Control (4 weeks) | 35.0 ± 5.72 | 58.0 ± 2.94 | 26.0 ± 2.16 | 6.5 ± 1.29 | 102.5 ± 8.66 | 94.2 ± 25.75 |
| Ethanol (2 weeks) | 153.2 ± 42.38 ** | 114 ± 10.02 ** | 45.0 ± 3.74 ** | 21.8 ± 4.44 | 212.0 ± 19.34 ** | 37.5 ± 1.29 |
| Ethanol (4 weeks) | 81.2 ± 33.53 * | 98.4 ± 22.39 * | 41.8 ± 11.19 * | 15.4 ± 4.39 ** | 170.8 ± 43.13 * | 52.6 ± 33.16 |
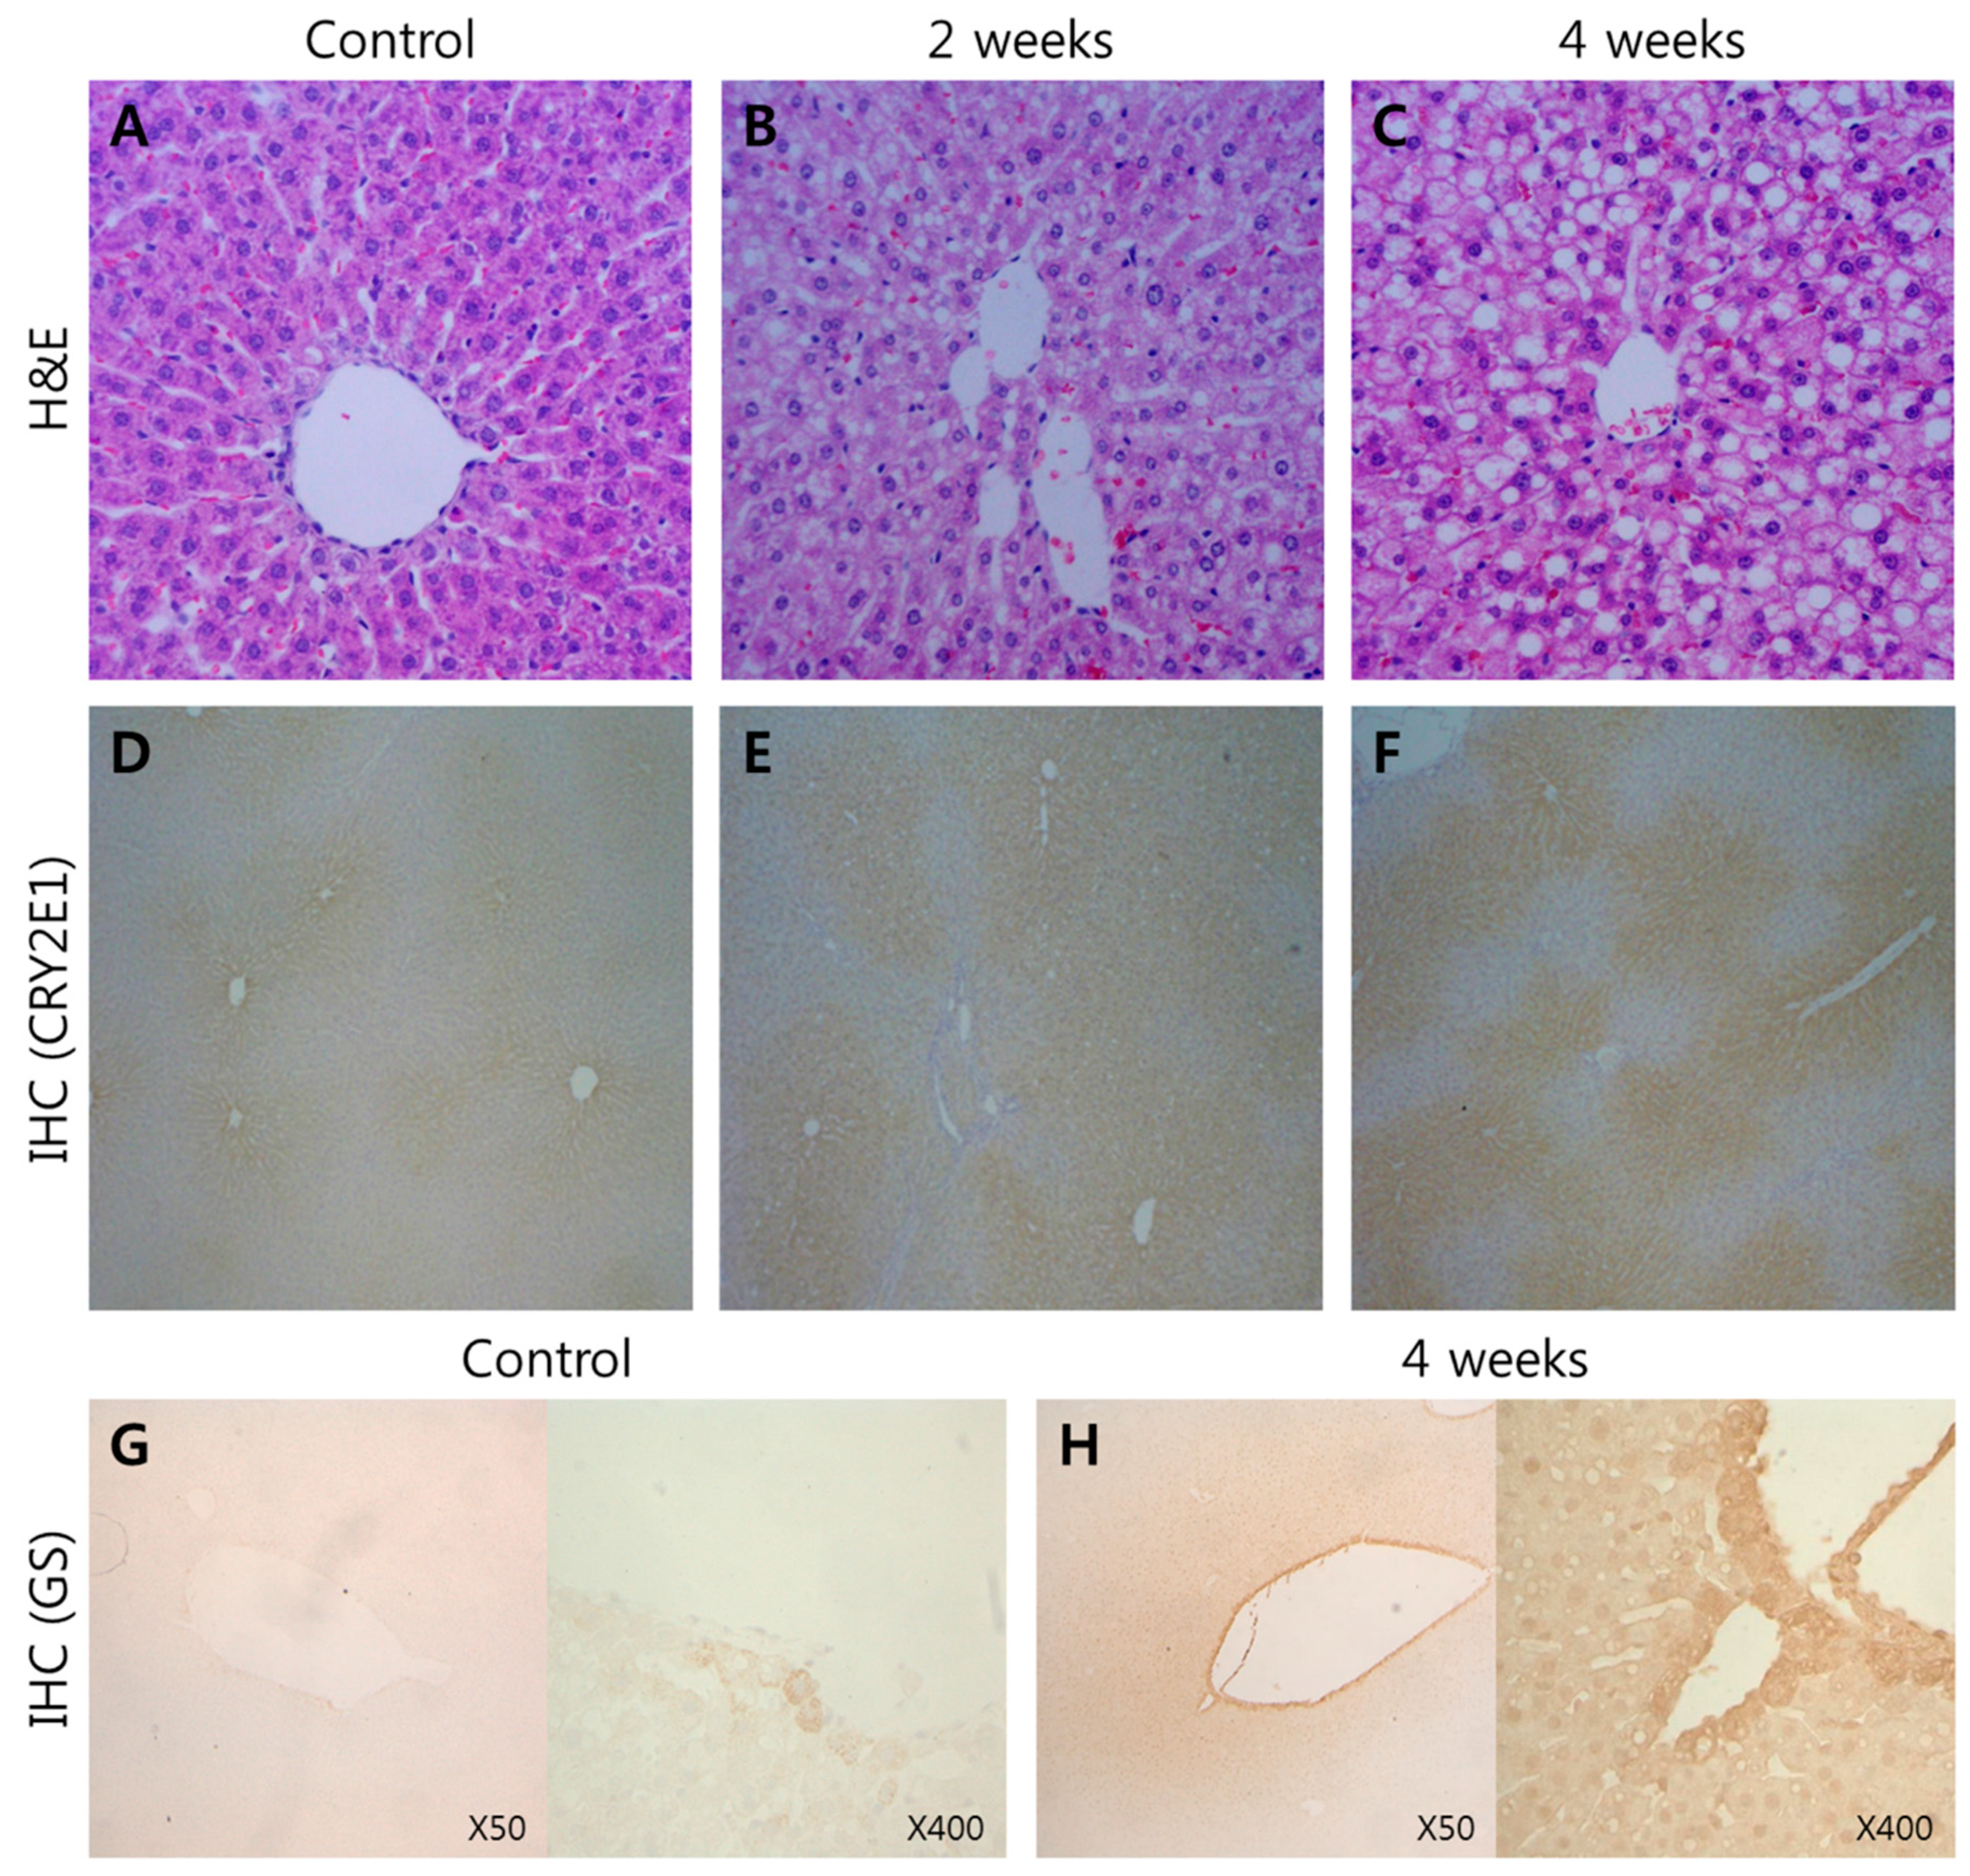
2.2. Histopathology and Immunohistochemistry (IHC)
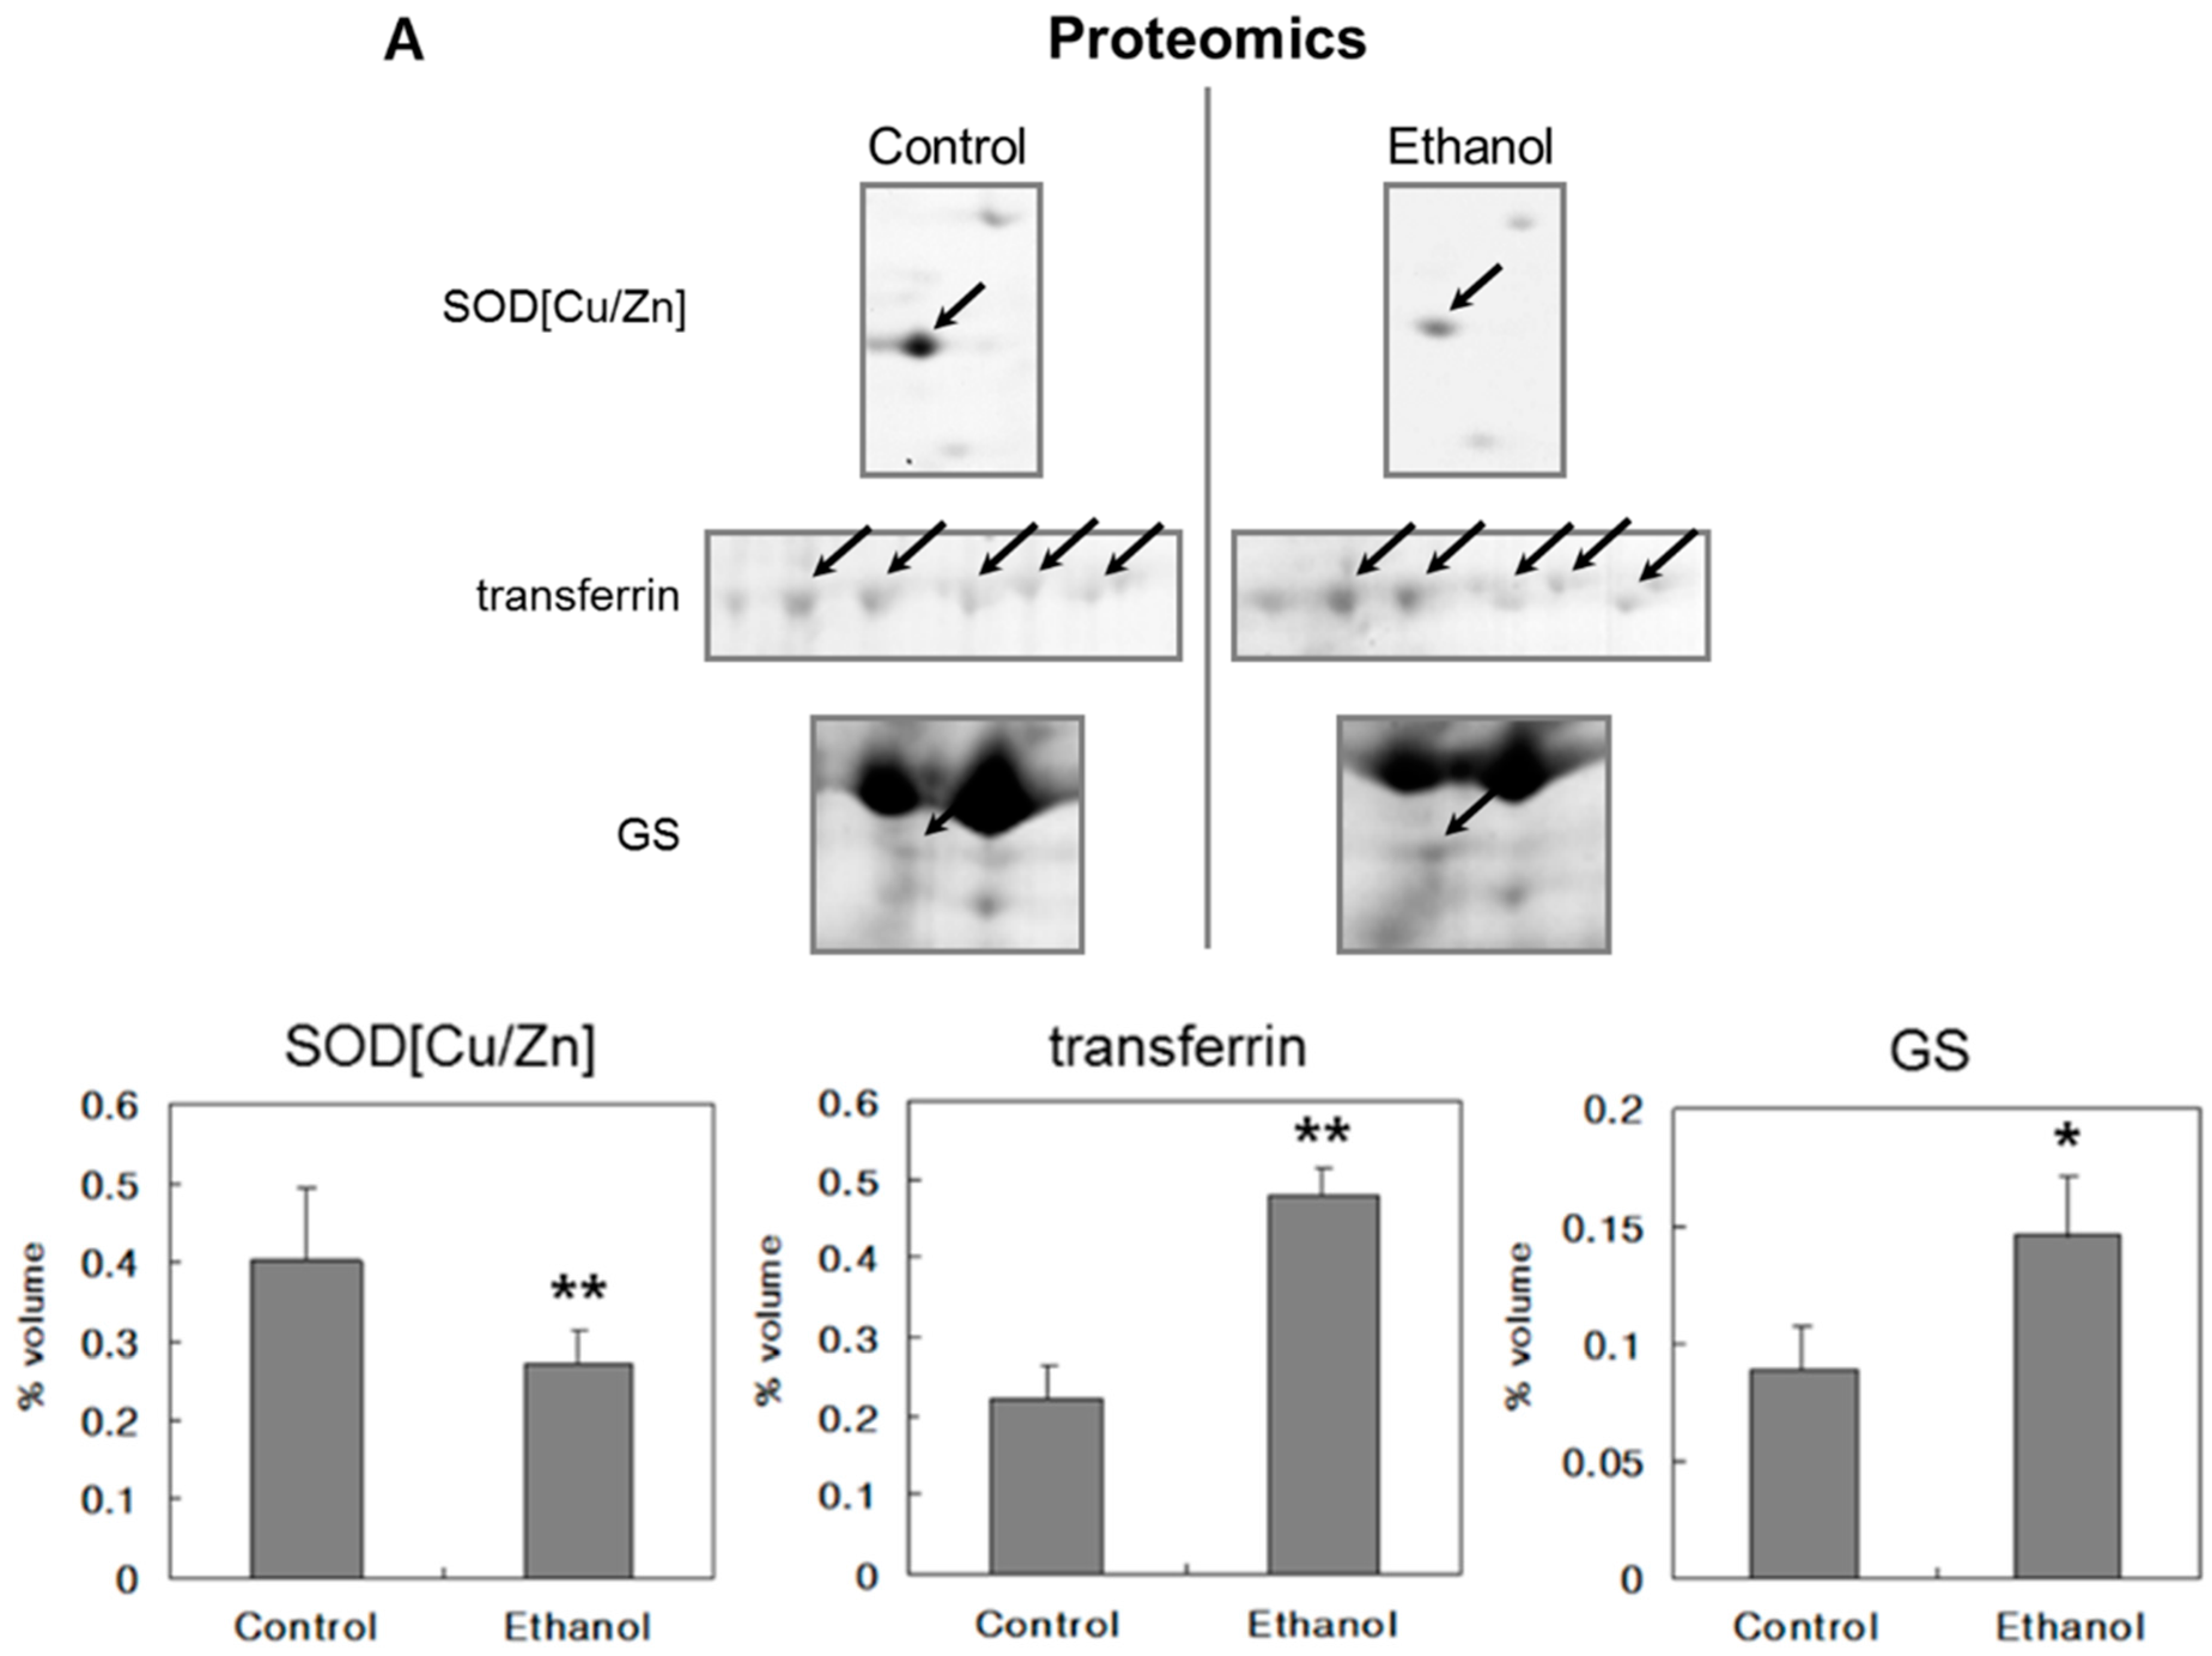
2.3. Proteomic Analysis


| Spot No. a | Protein Name | Mw (Da)/pI | MOWSE Score | Accession # | Control Mean %vol. | Ethanol Mean %vol. | Mean Fold b | p-Value c |
|---|---|---|---|---|---|---|---|---|
| 91 | NADH dehydrogenase (ubiquinone) | 79,413/5.6 | 3.08 × 10⁵ | Q66HF1 | 0.0460 | 0.0000 | 0.00 | 0.030 |
| 124 | Transketolase (TK) | 67,644/7.2 | 5.11 × 10⁴ | P50137 | 0.0705 | 0.0459 | 0.65 | 0.032 |
| 144 | Peroxisomal bifunctional enzyme (PBE) | 78,659/9.3 | 251 | P07896 | 0.0363 | 0.0143 | 0.39 | 0.048 |
| 300 | 40S ribosomal protein SA (p40) | 32,824/4.8 | 729 | P38983 | 0.0832 | 0.0406 | 0.49 | 0.028 |
| 318 | Sorbitol dehydrogenase | 42,835/6.8 | 9459 | P27867 | 0.1499 | 0.0766 | 0.51 | 0.002 |
| 361 | Sideroflexin1 (Tricarboxylate carrier protein, Sfx1) | 35,547/9.2 | 401 | Q63965 | 0.0550 | 0.0000 | 0.00 | 0.012 |
| 389 | Thiosulfate sulfurtransferase (Rhodanese) | 33,177/7.8 | 1537 | P24329 | 0.4404 | 0.3192 | 0.72 | 0.037 |
| 433 | Carbonic anhydrase III (CAIII) | 29,432/6.9 | 4.56 × 10⁵ | P14141 | 0.1277 | 0.0484 | 0.38 | 0.049 |
| 450 | 3-Hydroxyanthranilate 3,4-dioxygenase (3-HAO) | 32,582/5.6 | 1.78 × 10⁸ | P46953 | 0.1542 | 0.0968 | 0.63 | 0.001 |
| 477 | α-Tocopherol transfer protein (α-TTP) | 31,846/6.5 | 119 | P41034 | 0.4700 | 0.1147 | 0.24 | 0.001 |
| 484 | Protein kinase C inhibitor protein-1 (KCIP-1) | 27,771/4.7 | 488 | P63101M | 0.0493 | 0.0000 | 0.00 | 0.046 |
| 493 | Carbonic anhydrase III (CAIII) | 29,432/6.9 | 69.3 | P14141 | 0.0926 | 0.0000 | 0.00 | 0.047 |
| 496 | Carbonic anhydrase III (CAIII) | 29,432/6.9 | 1.07 × 10⁷ | P14141 | 1.0801 | 0.2330 | 0.22 | 0.002 |
| 542 | Peroxiredoxin 1 (Pxr1) | 22,110/8.3 | 3.47 × 10⁵ | Q63716 | 0.3207 | 0.1982 | 0.62 | 0.045 |
| 591 | 15.5 kDa fatty acid binding protein (FABP) | 20,737/5.8 | 1.09 × 10⁴ | P02761 | 0.1007 | 0.0040 | 0.04 | 0.030 |
| 602 | Superoxide dismutase [Cu-Zn] (Cu/Zn-SOD) | 15,912/5.9 | 2164 | P07632 | 0.3729 | 0.2699 | 0.72 | 0.021 |
| 603 | Superoxide dismutase [Cu-Zn] (Cu/Zn-SOD) | 15,912/5.9 | 1879 | P07632 | 0.0279 | 0.0021 | 0.08 | 0.041 |
| Spot No. a | Protein Name | Mw (Da)/pI | MOWSE Score | Accession # | Control Mean %vol. | Ethanol Mean %vol. | Mean Fold b | p-Value c |
|---|---|---|---|---|---|---|---|---|
| 77 | Protein-arginine deiminase type II (PADII) | 75,357/5.3 | 2552 | P20717 | 0.0238 | 0.0879 | 3.69 | 0.036 |
| 78 | Serotransferrin precursor (Transferrin) | 76,365/6.9 | 175 | P12346 | 0.0264 | 0.0726 | 2.75 | 0.001 |
| 79 | Serotransferrin precursor (Transferrin) | 76,365/6.9 | 182 | P12346 | 0.0408 | 0.0914 | 2.24 | 0.000 |
| 80 | Serotransferrin precursor (Transferrin) | 76,365/6.9 | 6461 | P12346 | 0.0710 | 0.1399 | 1.97 | 0.000 |
| 81 | Serotransferrin precursor (Transferrin) | 76,365/6.9 | 4.20 × 10⁵ | P12346 | 0.0775 | 0.1290 | 1.66 | 0.009 |
| 84 | Serotransferrin precursor (Transferrin) | 76,365/6.9 | 705 | P12346 | 0.0073 | 0.0459 | 6.27 | 0.048 |
| 91 | Long-chain acyl-CoA synthetase 2 (LACS2) | 78,179/6.6 | 5.53 × 10⁵ | P18163 | 0.0146 | 0.0545 | 3.74 | 0.039 |
| 204 | Glutamine synthetase (GS) | 42,268/6.6 | 256 | P09606 | 0.0535 | 0.1165 | 2.18 | 0.138 |
| 221 | Argininosuccinate synthase | 46,497/7.6 | 2.71 × 10⁴ | P09034 | 0.7412 | 1.0884 | 1.47 | 0.050 |
| 233 | Argininosuccinate synthase | 46,497/7.6 | 6.03 × 10⁴ | P09034 | 0.2361 | 0.3910 | 1.66 | 0.004 |
| 383 | Cell division control protein 2 homolog (CDC2) | 34,135/8.4 | 1015 | P39951 | 0.4508 | 0.8771 | 1.95 | 0.015 |
| 413 | Cytochrome P450 | 25,939/5.6 | 134 | Q64678 | 0.0530 | 0.1032 | 1.95 | 0.027 |
| 429 | Plasma retinol-binding protein precursor (PRBP) | 23,220/5.7 | 795 | P04916 | 0.0147 | 0.0251 | 1.71 | 0.049 |
| 441 | Cytochrome b5 | 15,355/4.9 | 2849 | gi11560046 | 0.2409 | 0.4508 | 1.87 | 0.027 |
| 447 | Transthyretin precursor (TBPA) | 15,720/5.8 | 1631 | P02767 | 0.0263 | 0.0608 | 2.32 | 0.017 |
| 463 | Hemoglobin beta chain (β-globin) | 15,980/7.9 | 5.81 × 10⁵ | P02091 | 0.6404 | 1.0725 | 1.67 | 0.044 |
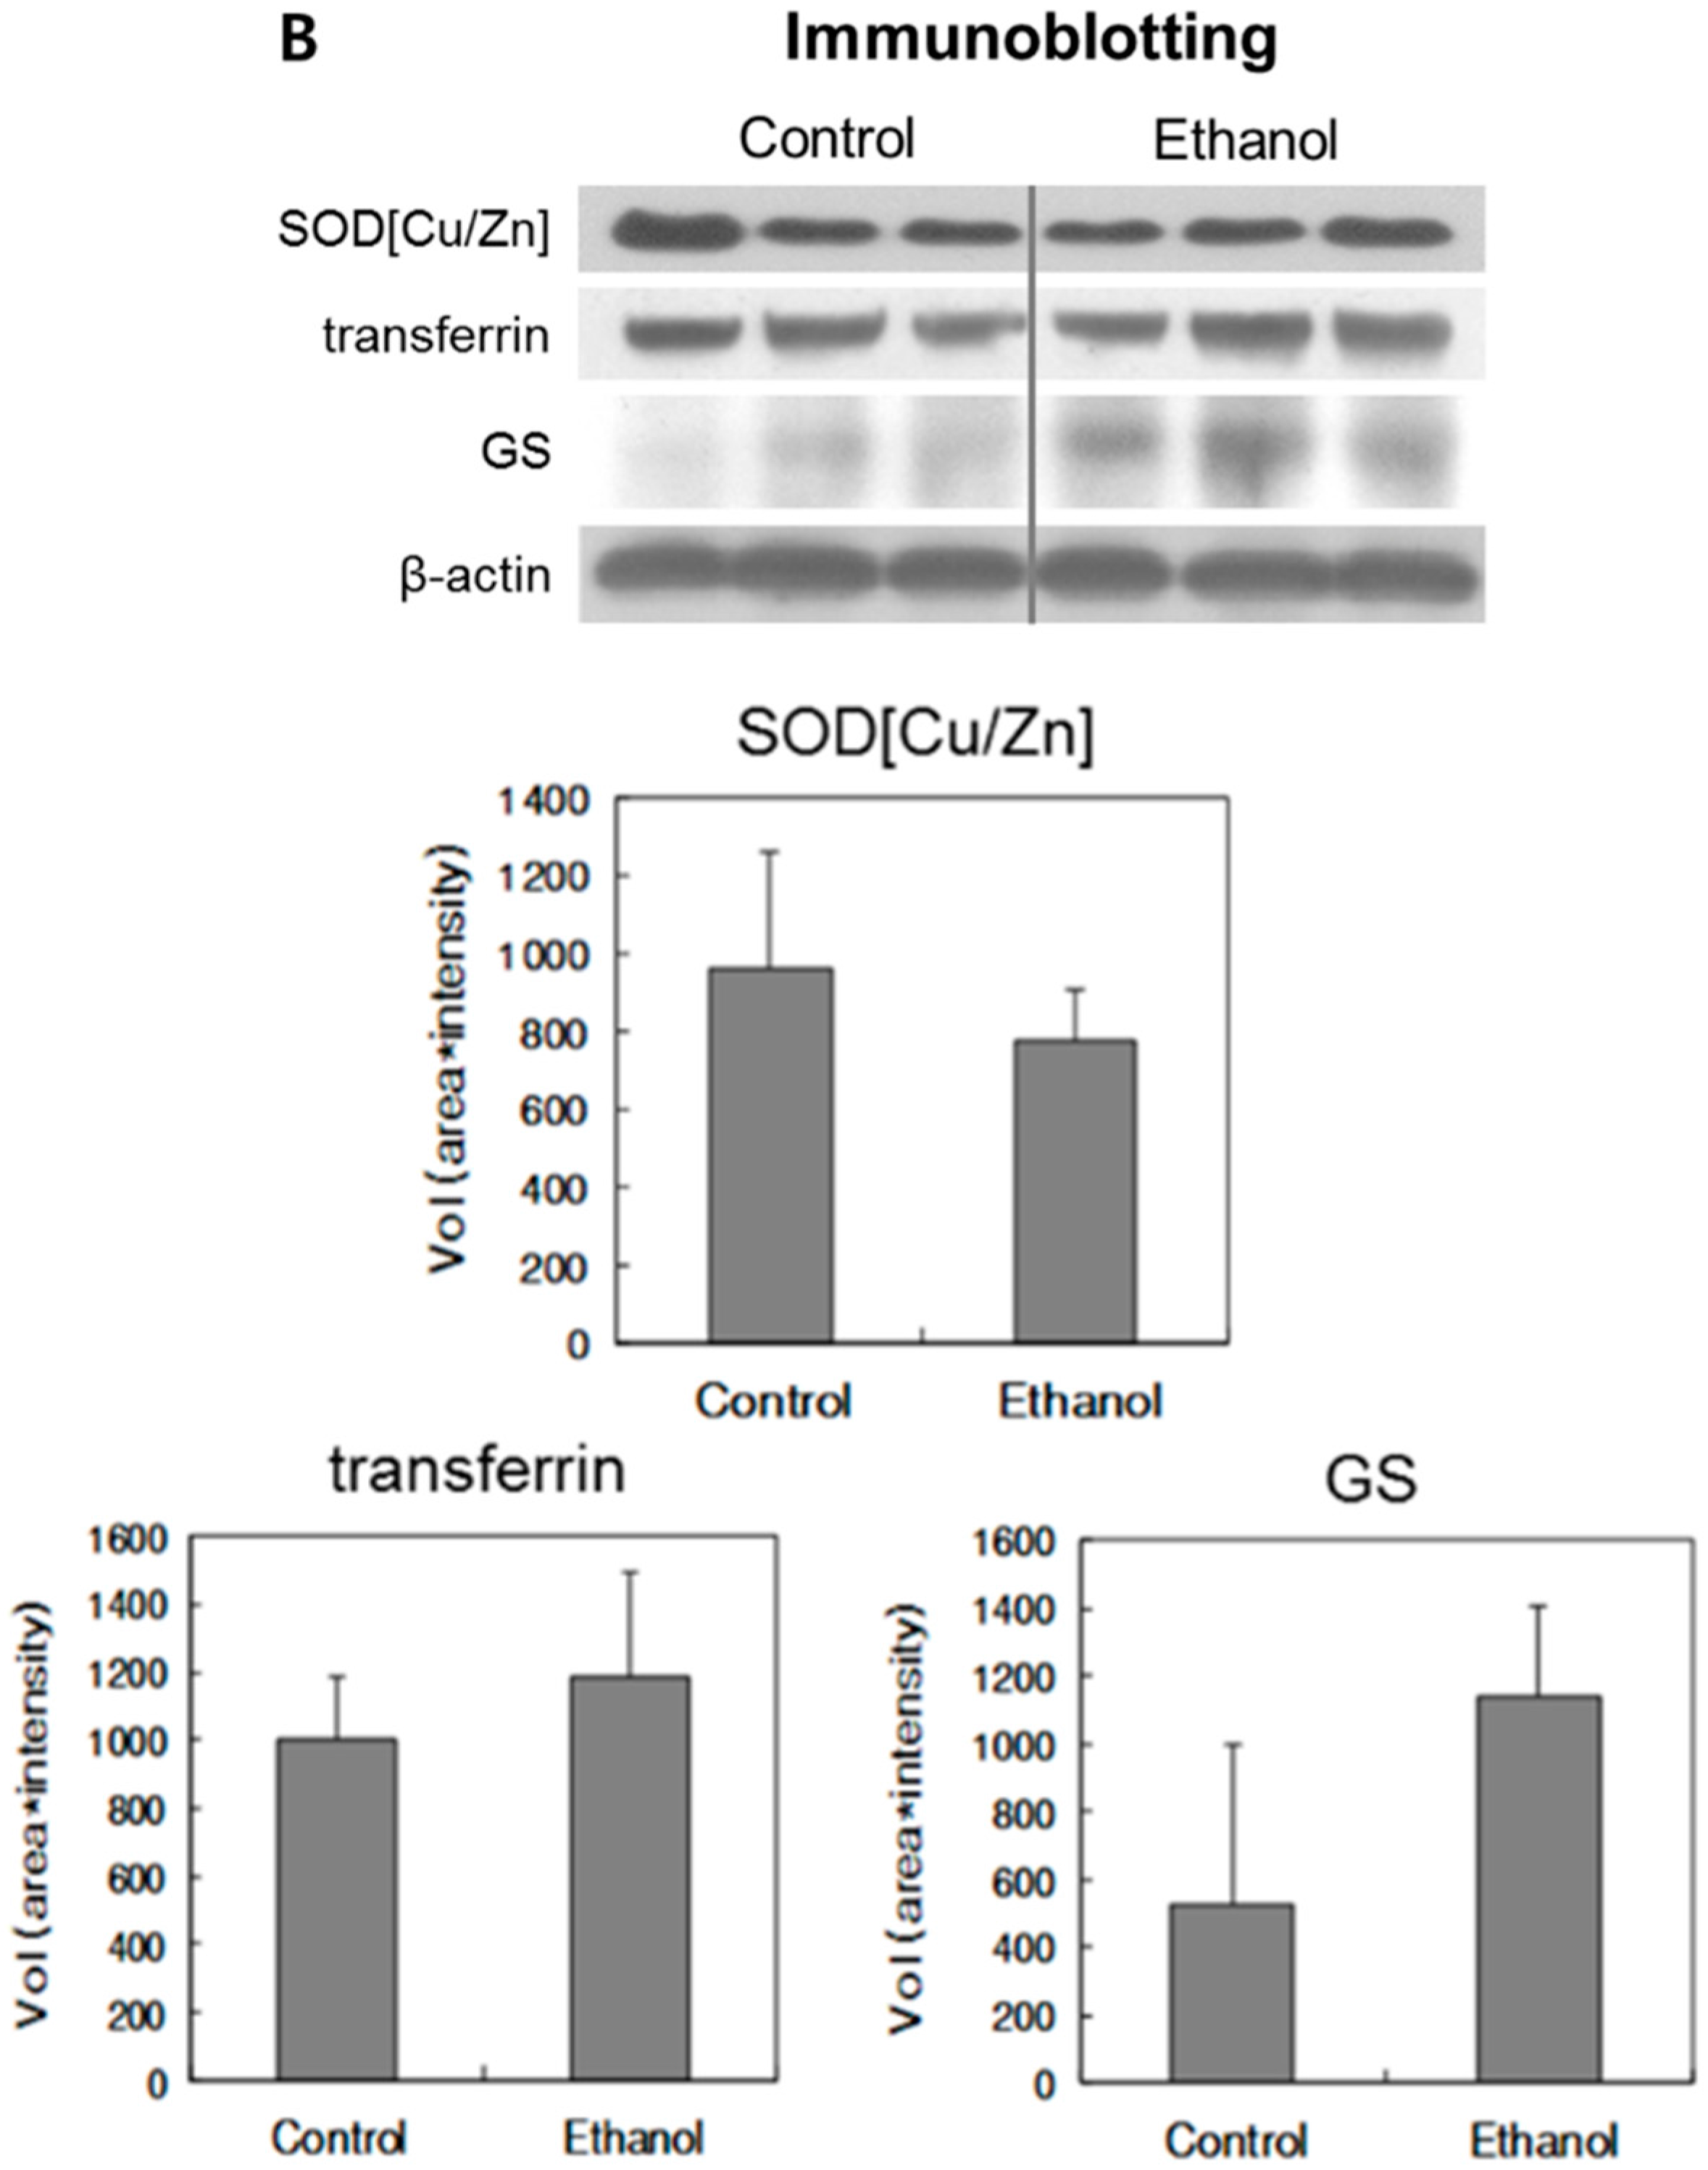
2.4. Immunoblotting Analysis
| Protein | Mean Volume in Control Group | Mean Volume in Ethanol Group | Mean Fold in Immunoblot | Mean Fold in Proteomics a |
|---|---|---|---|---|
| Cu/Zn-SOD | 959.88 | 778.53 | 0.81 | 0.68 |
| Transferrin | 999.96 | 1191.26 | 1.19 | 2.14 |
| GS | 530.19 | 1141.75 | 2.15 | 2.18 |


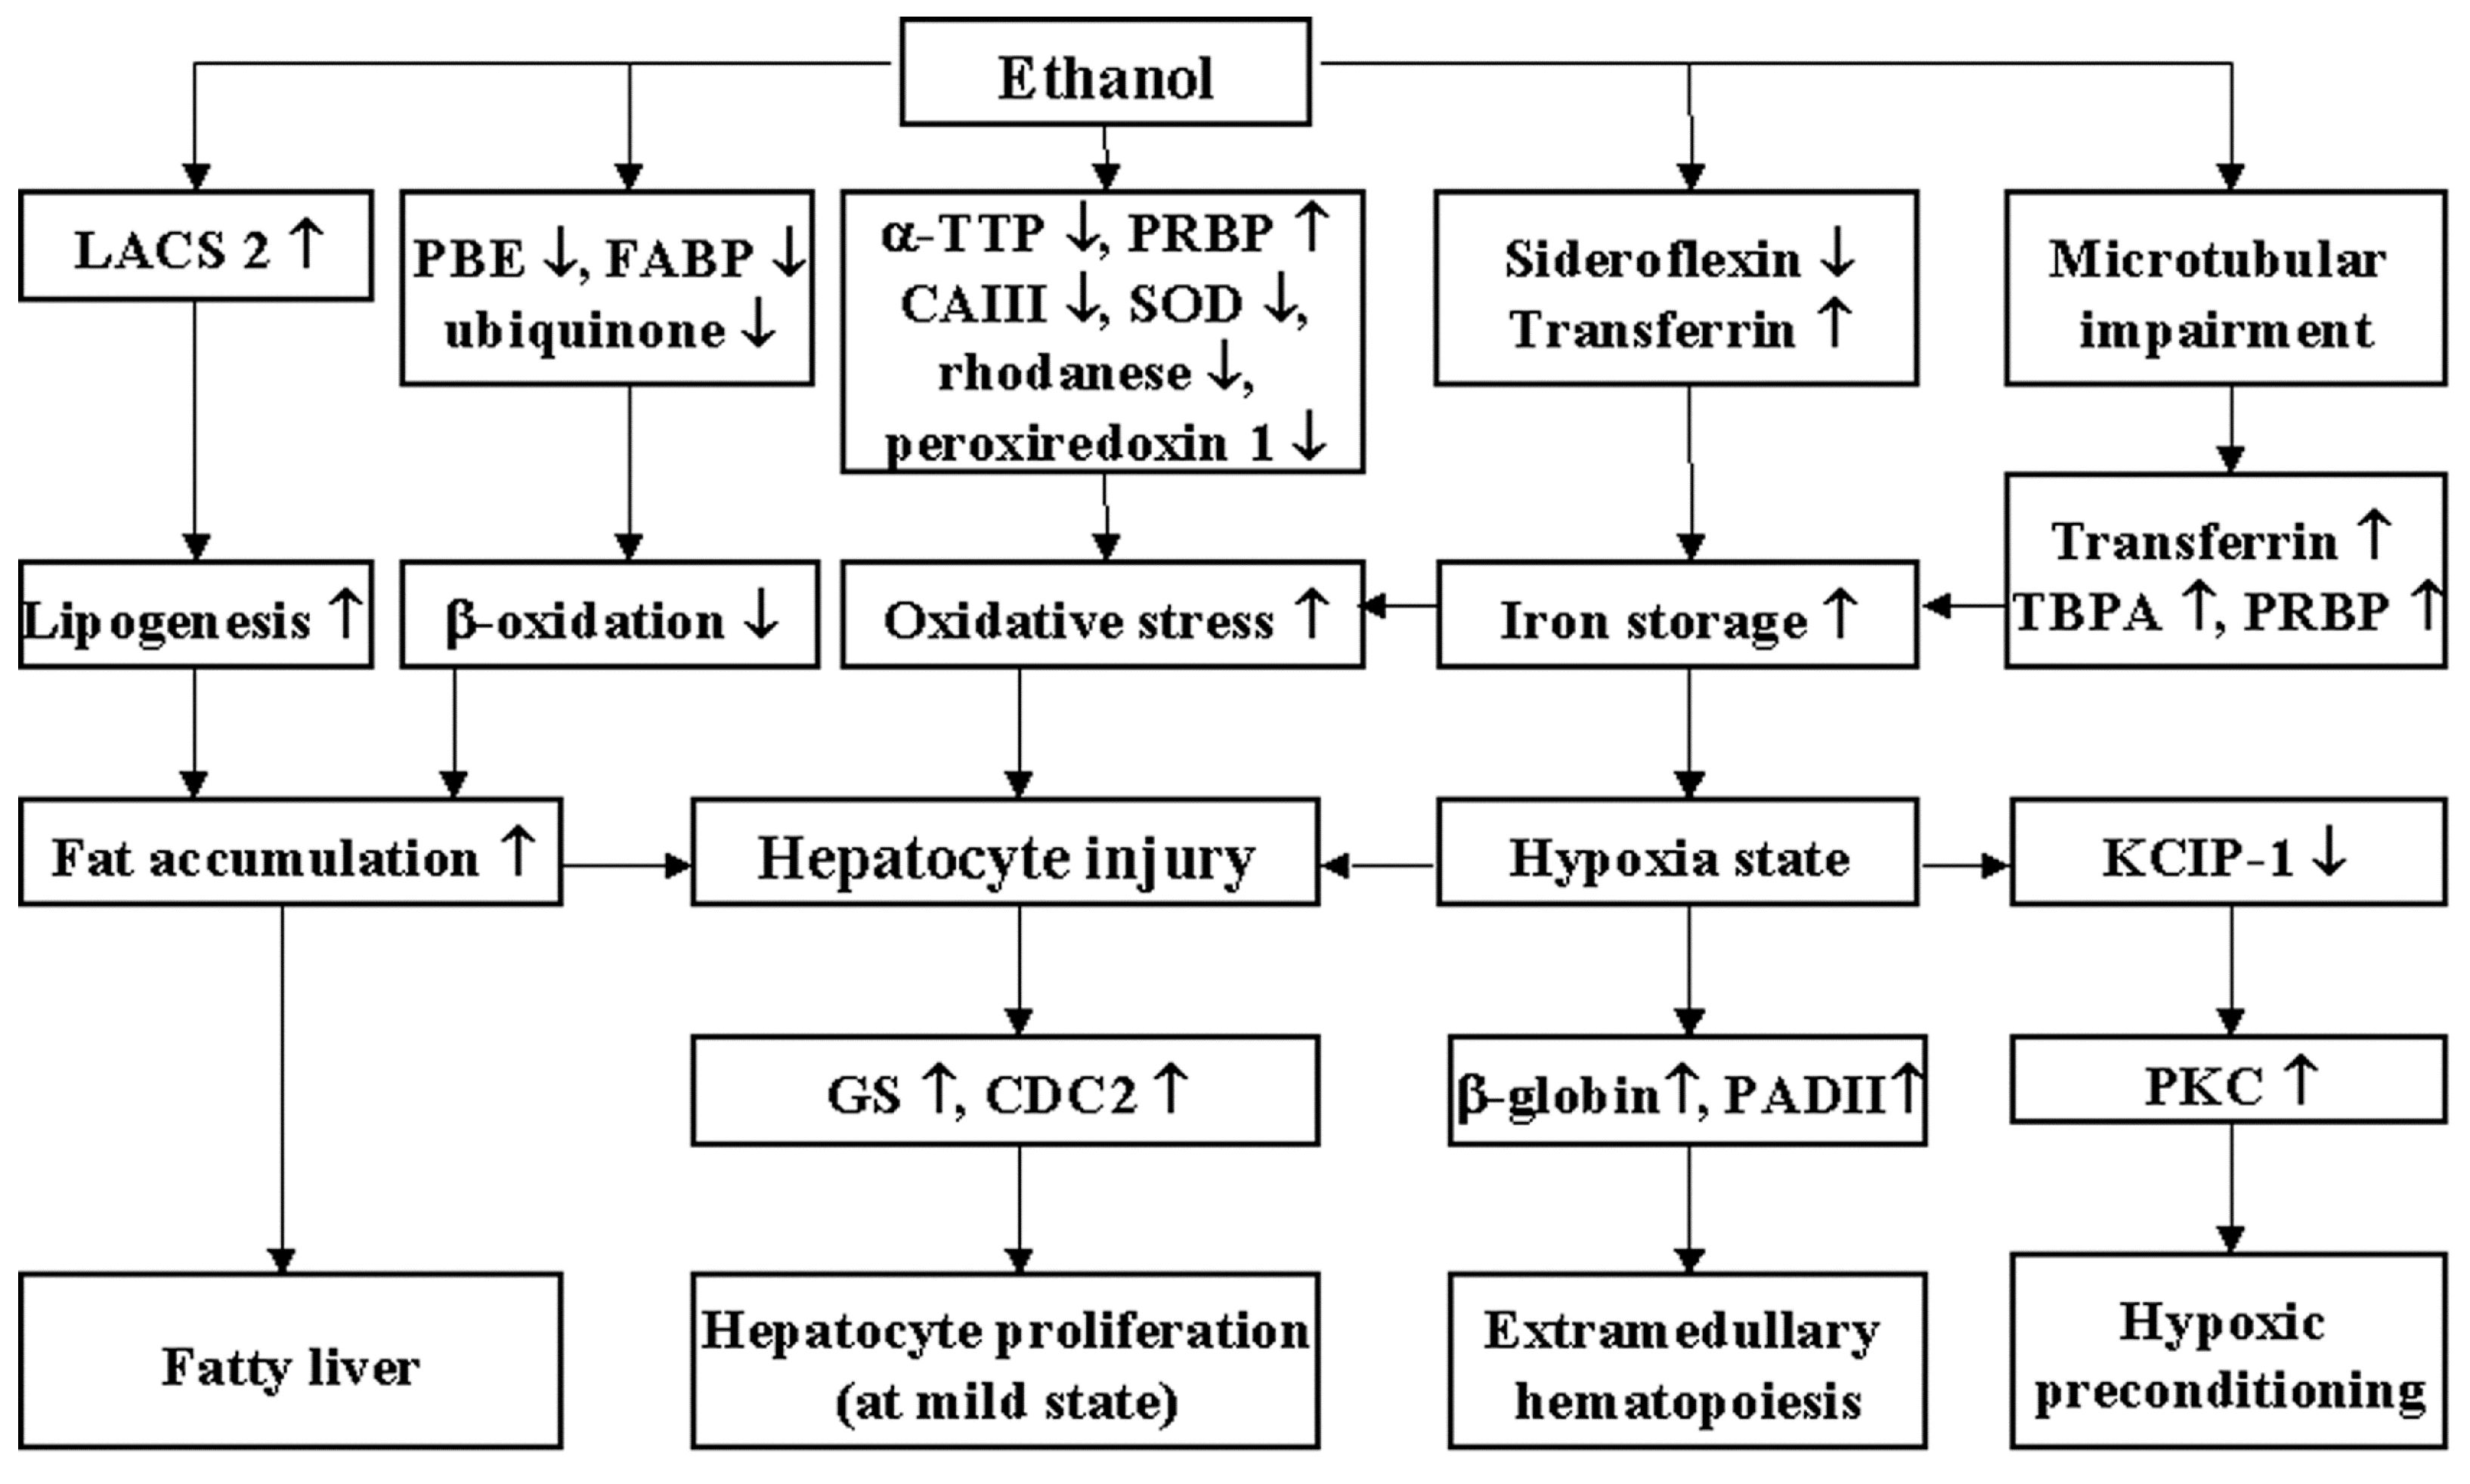
3. Discussion

4. Experimental Section
4.1. Animals
4.2. Body Weight Changes and Serum Biochemical Analyses
4.3. Histopathology and Immunohistochemistry
4.4. Proteomic Analysis
4.4.1. 2D PAGE Sample Preparation
4.4.2. First Dimension (IEF)
4.4.3. Two-Dimensional Gel Electrophoresis
4.4.4. MALDI-TOF MS
4.5. Immunoblotting
4.6. Statistical Analysis
5. Conclusions
Acknowledgments
Author Contributions
Conflicts of Interest
References
- Ramaiah, S.; Rivera, C.; Arteel, G. Early-Phase Alcoholic Liver Disease: An update on animal models, pathology, and pathogenesis. Int. J. Toxicol. 2004, 23, 217–231. [Google Scholar] [CrossRef] [PubMed]
- Levene, A.P.; Goldin, R.D. The Epidemiology, Pathogenesis and histopathology of fatty liver disease. Histopathology 2012, 61, 141–152. [Google Scholar] [CrossRef] [PubMed]
- Leung, T.M.; Nieto, N. CYP2E1 and oxidant stress in alcoholic and non-alcoholic fatty liver disease. J. Hepatol. 2013, 58, 395–398. [Google Scholar] [CrossRef] [PubMed]
- Lee, Y.A.; Wallace, M.C.; Friedman, S.L. Pathobiology of liver fibrosis: A translational success story. Gut 2015, 64, 830–841. [Google Scholar] [CrossRef] [PubMed]
- Singal, A.K.; Charlton, M.R. Nutrition in alcoholic liver disease. Clin. Liver Dis. 2012, 16, 805–826. [Google Scholar] [CrossRef] [PubMed]
- Arteel, G.E. Oxidants and antioxidants in alcohol-induced liver disease. Gastroenterology 2003, 124, 778–790. [Google Scholar] [CrossRef] [PubMed]
- Brunt, E.M.; Tiniakos, D.G. Pathology of steatohepatitis. Best Pract. Res. Clin. Gastroenterol. 2002, 16, 691–707. [Google Scholar] [CrossRef] [PubMed]
- Ishak, K.G.; Zimmerman, H.J.; Ray, M.B. Alcoholic liver disease: Pathologic, pathogenetic and clinical aspects. Alcohol. Clin. Exp. Res. 1991, 15, 45–66. [Google Scholar] [CrossRef] [PubMed]
- Fountoulakis, M. Proteomics: Current Technologies and applications in neurological disorders and toxicology. Amino Acids 2001, 21, 363–381. [Google Scholar] [CrossRef] [PubMed]
- Andringa, K.K.; King, A.L.; Eccleston, H.B.; Mantena, S.K.; Landar, A.; Jhala, N.C.; Dickinson, D.A.; Squadrito, G.L.; Bailey, S.M. Analysis of the liver mitochondrial proteome in response to ethanol and S-adenosylmethionine treatments: Novel molecular targets of disease and hepatoprotection. Am. J. Physiol. Gastrointest. Liver Physiol. 2010, 298, G732–G745. [Google Scholar] [CrossRef] [PubMed]
- Bailey, S.M.; Andringa, K.K.; Landar, A.; Darley-Usmar, V.M. Proteomic approaches to identify and characterize alterations to the mitochondrial proteome in alcoholic liver disease. Methods Mol. Biol. 2008, 447, 369–380. [Google Scholar] [PubMed]
- Venkatraman, A.; Landar, A.; Davis, A.J.; Chamlee, L.; Sanderson, T.; Kim, H.; Page, G.; Pompilius, M.; Ballinger, S.; Darley-Usmar, V.; et al. Modification of the mitochondrial proteome in response to the stress of ethanol-dependent hepatotoxicity. J. Biol. Chem. 2004, 279, 22092–22101. [Google Scholar] [CrossRef] [PubMed]
- Zhang, L.; Jia, X.; Feng, Y.; Peng, X.; Zhang, Z.; Zhou, W.; Zhang, Z.; Ma, F.; Liu, X.; Zheng, Y.; et al. Plasma membrane proteome analysis of the early effect of alcohol on liver: Implications for alcoholic liver disease. Acta Biochim. Biophys. Sin. 2011, 43, 19–29. [Google Scholar] [CrossRef] [PubMed]
- Newton, B.W.; Russell, W.K.; Russell, D.H.; Ramaiah, S.K.; Jayaraman, A. Liver proteome analysis in a rodent model of alcoholic steatosis. J. Proteome Res. 2009, 8, 1663–1671. [Google Scholar] [CrossRef] [PubMed]
- Matsuda, Y.; Takada, A.; Takase, S.; Sato, H. Accumulation of glycoprotein in the golgi apparatus of hepatocytes in alcoholic liver injuries. Am. J. Gastroenterol. 1991, 86, 854–860. [Google Scholar] [PubMed]
- Aleynik, M.K.; Lieber, C.S. Dilinoleoylphosphatidylcholine decreases ethanol-induced cytochrome P4502E1. Biochem. Biophys. Res. Commun. 2001, 288, 1047–1051. [Google Scholar] [CrossRef] [PubMed]
- Gao, Y.; Shan, Y.Q.; Pan, M.X.; Wang, Y.; Tang, L.J.; Li, H.; Zhang, Z. Protein kinase C-dependent activation of P44/42 mitogen-activated protein kinase and heat shock protein 70 in signal transduction during hepatocyte ischemic preconditioning. World J. Gastroenterol. 2004, 10, 1019–1027. [Google Scholar] [PubMed]
- Apte, U.M.; McRee, R.; Ramaiah, S.K. hepatocyte proliferation is the possible mechanism for the transient decrease in liver injury during steatosis stage of alcoholic liver disease. Toxicol. Pathol. 2004, 32, 567–576. [Google Scholar] [CrossRef] [PubMed]
- Eaton, S.; Record, C.O.; Bartlett, K. Multiple biochemical effects in the pathogenesis of alcoholic fatty liver. Eur. J. Clin. Investig. 1997, 27, 719–722. [Google Scholar] [CrossRef]
- Parkkila, S.; Halsted, C.H.; Villanueva, J.A.; Vaananen, H.K.; Niemela, O. Expression of testosterone-dependent enzyme, carbonic anhydrase III, and oxidative stress in experimental alcoholic liver disease. Dig. Dis. Sci. 1999, 44, 2205–2213. [Google Scholar] [CrossRef] [PubMed]
- Yamada, M.; Satoh, M.; Seimiya, M.; Sogawa, K.; Itoga, S.; Tomonaga, T.; Nomura, F. Combined proteomic analysis of liver tissue and serum in chronically alcohol-fed rats. Alcohol. Clin. Exp. Res. 2013, 37 (Suppl. 1), E79–E87. [Google Scholar] [CrossRef] [PubMed]
- Kharbanda, K.K.; Vigneswara, V.; McVicker, B.L.; Newlaczyl, A.U.; Bailey, K.; Tuma, D.; Ray, D.E.; Carter, W.G. Proteomics reveal a concerted upregulation of methionine metabolic pathway enzymes, and downregulation of carbonic anhydrase-III, in betaine supplemented ethanol-fed rats. Biochem. Biophys. Res. Commun. 2009, 381, 523–527. [Google Scholar] [CrossRef] [PubMed]
- Fernando, H.; Wiktorowicz, J.E.; Soman, K.V.; Kaphalia, B.S.; Khan, M.F.; Shakeel Ansari, G.A. Liver proteomics in progressive alcoholic steatosis. Toxicol. Appl. Pharmacol. 2013, 266, 470–480. [Google Scholar] [CrossRef] [PubMed]
- Witzmann, F.A.; Li, J.; Strother, W.N.; McBride, W.J.; Hunter, L.; Crabb, D.W.; Lumeng, L.; Li, T.K. Innate differences in protein expression in the nucleus accumbens and hippocampus of inbred alcohol-preferring and -nonpreferring rats. Proteomics 2003, 3, 1335–1344. [Google Scholar] [CrossRef] [PubMed]
- Cesaratto, L.; Vascotto, C.; D’Ambrosio, C.; Scaloni, A.; Baccarani, U.; Paron, I.; Damante, G.; Calligaris, S.; Quadrifoglio, F.; Tiribelli, C.; et al. Overoxidation of peroxiredoxins as an immediate and sensitive marker of oxidative stress in HepG2 cells and its application to the redox effects induced by ischemia/reperfusion in human liver. Free Radic. Res. 2005, 39, 255–268. [Google Scholar] [CrossRef] [PubMed]
- Smathers, R.L.; Galligan, J.J.; Stewart, B.J.; Petersen, D.R. Overview of lipid peroxidation products and hepatic protein modification in alcoholic liver disease. Chem. Biol. Interact. 2011, 192, 107–112. [Google Scholar] [CrossRef] [PubMed]
- Nanji, A.A.; Dannenberg, A.J.; Jokelainen, K.; Bass, N.M. Alcoholic liver injury in the rat is associated with reduced expression of peroxisome proliferator-α (PPARα)-regulated genes and is Ameliorated by PPARα activation. J. Pharmacol. Exp. Ther. 2004, 310, 417–424. [Google Scholar] [CrossRef] [PubMed]
- Balasubramaniyan, V.; Kalaivani Sailaja, J.; Nalini, N. Role of leptin on alcohol-induced oxidative stress in Swiss mice. Pharmacol. Res. 2003, 47, 211–216. [Google Scholar] [CrossRef]
- Levy, S.; Herve, C.; Delacoux, E.; Erlinger, S. Thiamine deficiency in hepatitis C virus and alcohol-related liver diseases. Dig. Dis. Sci. 2002, 47, 543–548. [Google Scholar] [CrossRef] [PubMed]
- Suto, K.; Kajihara-Kano, H.; Yokoyama, Y.; Hayakari, M.; Kimura, J.; Kumano, T.; Takahata, T.; Kudo, H.; Tsuchida, S. Decreased expression of the peroxisomal bifunctional enzyme and carbonyl reductase in human hepatocellular carcinomas. J. Cancer Res. Clin. Oncol. 1999, 125, 83–88. [Google Scholar] [CrossRef] [PubMed]
- Zheng, H.; Ji, C.; Zou, X.; Wu, M.; Jin, Z.; Yin, G.; Li, J.; Feng, C.; Cheng, H.; Gu, S.; et al. Molecular cloning and characterization of a novel human putative transmembrane protein homologous to mouse sideroflexin associated with sideroblastic anemia. DNA Seq. 2003, 14, 369–373. [Google Scholar] [CrossRef] [PubMed]
- Finazzi Agro, A.; Federici, G.; Giovagnoli, C.; Cannella, C.; Cavallini, D. Effect of sulfur bindng on rhodanese fluorescence. Eur. J. Biochem. 1972, 28, 89–93. [Google Scholar] [CrossRef] [PubMed]
- Nandi, D.L.; Horowitz, P.M.; Westley, J. Rhodanese as a thioredoxin oxidase. Int. J. Biochem. Cell Biol. 2000, 32, 465–473. [Google Scholar] [CrossRef]
- Bell, H.; Bjorneboe, A.; Eidsvoll, B.; Norum, K.R.; Raknerud, N.; Try, K.; Thomassen, Y.; Drevon, C.A. Reduced concentration of hepatic alpha-tocopherol in patients with alcoholic liver cirrhosis. Alcohol Alcohol. 1992, 27, 39–46. [Google Scholar] [PubMed]
- Bradford, B.U.; Enomoto, N.; Ikejima, K.; Rose, M.L.; Bojes, H.K.; Forman, D.T.; Thurman, R.G. Peroxisomes are involved in the swift increase in alcohol metabolism. J. Pharmacol. Exp. Ther. 1999, 288, 254–259. [Google Scholar] [PubMed]
- Matsuda, Y.; Takada, A.; Takase, S.; Yasuhara, M. Effects of ethanol on the secretion of hepatic secretory protein in rat alcoholic liver injury. Alcohol 1991, 8, 433–437. [Google Scholar] [CrossRef]
- Kouno, A.; Inoue, H.; Bajanowski, T.; Maeno, Y.; Iwasa, M.; Nakayama, M.; Nishi, K.; Brinkmann, B.; Matoba, R. Development of Haemoglobin subtypes and extramedullary haematopoiesis in young rats. Effects of hypercapnic and hypoxic environment. Int. J. Leg. Med. 2000, 114, 66–70. [Google Scholar] [CrossRef]
- Ueberham, E.; Arendt, E.; Starke, M.; Bittner, R.; Gebhardt, R. Reduction and expansion of the glutamine synthetase expressing zone in livers from tetracycline controlled TGF-β1 transgenic mice and multiple starved mice. J. Hepatol. 2004, 41, 75–81. [Google Scholar] [CrossRef] [PubMed]
- Sugimoto, T.; Yamashita, S.; Ishigami, M.; Sakai, N.; Hirano, K.; Tahara, M.; Matsumoto, K.; Nakamura, T.; Matsuzawa, Y. Decreased microsomal triglyceride transfer protein activity contributes to initiation of alcoholic liver steatosis in rats. J. Hepatol. 2002, 36, 157–162. [Google Scholar] [CrossRef]
- Bunout, D. Nutritional and Metabolic Effects of Alcoholism: Their relationship with alcoholic liver disease. Nutrition 1999, 15, 583–589. [Google Scholar] [CrossRef]
- Gorg, A.; Obermaier, C.; Boguth, G.; Harder, A.; Scheibe, B.; Wildgruber, R.; Weiss, W. The current state of two-dimensional electrophoresis with immobilized pH gradients. Electrophoresis 2000, 21, 1037–1053. [Google Scholar] [CrossRef]
© 2015 by the authors; licensee MDPI, Basel, Switzerland. This article is an open access article distributed under the terms and conditions of the Creative Commons Attribution license (http://creativecommons.org/licenses/by/4.0/).
Share and Cite
Kim, D.H.; Lee, E.-M.; Do, S.-H.; Jeong, D.-H.; Jeong, K.-S. Changes of the Cytoplasmic Proteome in Response to Alcoholic Hepatotoxicity in Rats. Int. J. Mol. Sci. 2015, 16, 18664-18682. https://0-doi-org.brum.beds.ac.uk/10.3390/ijms160818664
Kim DH, Lee E-M, Do S-H, Jeong D-H, Jeong K-S. Changes of the Cytoplasmic Proteome in Response to Alcoholic Hepatotoxicity in Rats. International Journal of Molecular Sciences. 2015; 16(8):18664-18682. https://0-doi-org.brum.beds.ac.uk/10.3390/ijms160818664
Chicago/Turabian StyleKim, Dong Hwan, Eun-Mi Lee, Sun-Hee Do, Da-Hee Jeong, and Kyu-Shik Jeong. 2015. "Changes of the Cytoplasmic Proteome in Response to Alcoholic Hepatotoxicity in Rats" International Journal of Molecular Sciences 16, no. 8: 18664-18682. https://0-doi-org.brum.beds.ac.uk/10.3390/ijms160818664