Article

Rat Aquaporin-5 Is pH-Gated Induced by Phosphorylation and Is Implicated in Oxidative Stress

by
Claudia Rodrigues
1,2,†,
Andreia Filipa Mósca
1,2,†,
Ana Paula Martins
1,2,
Tatiana Nobre
1,2,
Catarina Prista
3,
Fernando Antunes
4,
Ana Cipak Gasparovic
5 and
Graça Soveral
1,2,*
1
Research Institute for Medicines (iMed.ULisboa), Faculty of Pharmacy, Universidade de Lisboa, 1649-003 Lisboa, Portugal
2
Department of Biochemistry and Human Biology, Faculty of Pharmacy, Universidade de Lisboa, 1649-003 Lisboa, Portugal
3
Linking Landscape, Environment, Agriculture and Food, Instituto Superior de Agronomia, Universidade de Lisboa, 1349-017 Lisboa, Portugal
4
Centro de Química e Bioquímica e Departamento de Química e Bioquímica, Faculdade de Ciências, Universidade de Lisboa, 1749-016 Lisboa, Portugal
5
Rudjer Boskovic Institute, HR 10000 Zagreb, Croatia
*
Author to whom correspondence should be addressed.
These authors contributed equally to this work.
Int. J. Mol. Sci. 2016, 17(12), 2090; https://0-doi-org.brum.beds.ac.uk/10.3390/ijms17122090
Submission received: 28 September 2016 / Revised: 25 November 2016 / Accepted: 6 December 2016 / Published: 13 December 2016
(This article belongs to the Special Issue Aquaporin)

Abstract

:
Aquaporin-5 (AQP5) is a membrane water channel widely distributed in human tissues that was found up-regulated in different tumors and considered implicated in carcinogenesis in different organs and systems. Despite its wide distribution pattern and physiological importance, AQP5 short-term regulation was not reported and mechanisms underlying its involvement in cancer are not well defined. In this work, we expressed rat AQP5 in yeast and investigated mechanisms of gating, as well as AQP5’s ability to facilitate H2O2 plasma membrane diffusion. We found that AQP5 can be gated by extracellular pH in a phosphorylation-dependent manner, with higher activity at physiological pH 7.4. Moreover, similar to other mammalian AQPs, AQP5 is able to increase extracellular H2O2 influx and to affect oxidative cell response with dual effects: whereas in acute oxidative stress conditions AQP5 induces an initial higher sensitivity, in chronic stress AQP5 expressing cells show improved cell survival and resistance. Our findings support the involvement of AQP5 in oxidative stress and suggest AQP5 modulation by phosphorylation as a novel tool for therapeutics.

Graphical Abstract

1. Introduction

Aquaporins (AQPs) are a family of highly conserved transmembrane channels that transport water and, in some cases, small solutes such as glycerol, driven by osmotic or solute gradients [1,2]. The 13 known mammalian isoforms (AQP0–12) are differentially expressed in several tissues/organs and show different permeability, structural features, and cellular localization. Importantly, these proteins are involved in many biological functions including transepithelial fluid transport, brain edema, neuroexcitation, cell migration, adhesion, proliferation, differentiation, and metabolism [3,4]. Their numerous roles in physiology make these proteins essential for health, suggesting that modulation of AQP’s function or expression could have therapeutic potential in edema, cancer, obesity, brain injury, glaucoma, and several other conditions [5].
Besides being widely distributed among the human body, AQP5 was found expressed in salivary and lacrimal glands and showed to play a major role in saliva secretion [6]. AQP5 transport defect was also associated with Sjögren’s syndrome, a chronic autoimmune disease that destroys the salivary and lacrimal glands [6]. More recently, AQP5 gained attention due its potential implication in carcinogenesis in different organs and systems [7]. AQP5 was found overexpressed in cancer cells and tumor tissues, strongly suggesting that it may be implicated in tumor formation by contributing to cell differentiation and migration through mechanisms involving AQP5 interplay with intracellular signaling transduction pathways. In tumors, the cAMP-dependent phosphorylation of AQP5 by PKA activates the RAS/Mitogen-activated protein kinases (MAPK) pathway involved in cell proliferation and survival [8,9,10]. In addition to AQP5 interaction with oncogenes, its function as a water channel was proposed to be involved in cell migration, since AQP5 expression may facilitate changes in cell volume and shape that are crucial for migration [11].
Recently, permeation of hydrogen peroxide (H2O2) by some AQPs revealed that these channels could influence regulatory complex signaling pathways involved in pathological states. It is now well established that reactive oxygen species (ROS), particularly H2O2, participate in cell signaling transduction pathways affecting cellular growth and proliferation mechanisms involved in cancer development [12,13].
Although it is generally assumed that H2O2 is highly diffusible across the membrane lipid bilayer, it was shown that actually the membrane lipid bilayer slows down permeation of H2O2, leading to the formation of gradients [14]. This barrier, however, may be overcome by the presence of some AQPs recently shown to be capable of transporting extracellular H2O2 into the cells [15]. In mammalian cells, AQP3, AQP8, and AQP9 were shown to mediate H2O2 membrane transport [16,17,18], which may be used for intracellular signaling in cancer cells [19]. Consequently, due to its involvement in cancer progression, we anticipated that AQP5 might also be able to facilitate H2O2 permeation and have a role in cell oxidative stress response explaining, at least in part, its overexpression in cancer tissues.
Interestingly, a recent study showed that AQP5 membrane abundance is regulated by phosphorylation [20], and in fact, the contrasting phosphorylation status between cancer and normal tissues suggests that AQP5 role in tumorigenesis is related with its phosphorylation [7]. Furthermore, gating mechanisms that induce a change in the 3D-channel structure and consequently affect its transport activity [2] have been described for several eukaryotic AQPs [21,22,23,24], among which pH and phosphorylation represent a short-term regulatory mechanism commonly used by several AQP family members [24,25]. However, besides its post-translational modification by phosphorylation, gating mechanisms for AQP5 channel activity regulation have not been reported so far.
An important tool to investigate AQP’s function and regulation is the yeast heterologous expression system [2]. Yeast cells lacking endogenous AQPs have been used to detect water transport capacity of mammalian [26,27] and plant [28,29] aquaporins and recently we used this system to characterize the pH gating of AQP3 [27].
In the current work, we cloned rat AQP5 in the yeast Saccharomyces cerevisiae and investigated its channel activity regulation by external pH and phosphorylation. We observed that AQP5 does not change its activity by external acidification, but phosphorylation makes the AQP5 channel prone to pH sensing. Moreover, AQP5 is able to modulate H2O2 transport through the plasma membrane and this feature interferes with oxidative cell response with dual effects: acute oxidative stress induces an initial higher sensitivity while long-term exposure and chronic stress conditions increase cell survival and resistance to the oxidative stress insult.
Thus, the current findings support a direct role of AQP5 in cancer development by mediating H2O2 membrane permeation, affecting redox signaling, and influencing signaling transduction pathways involved in tumorigenesis.

2. Results

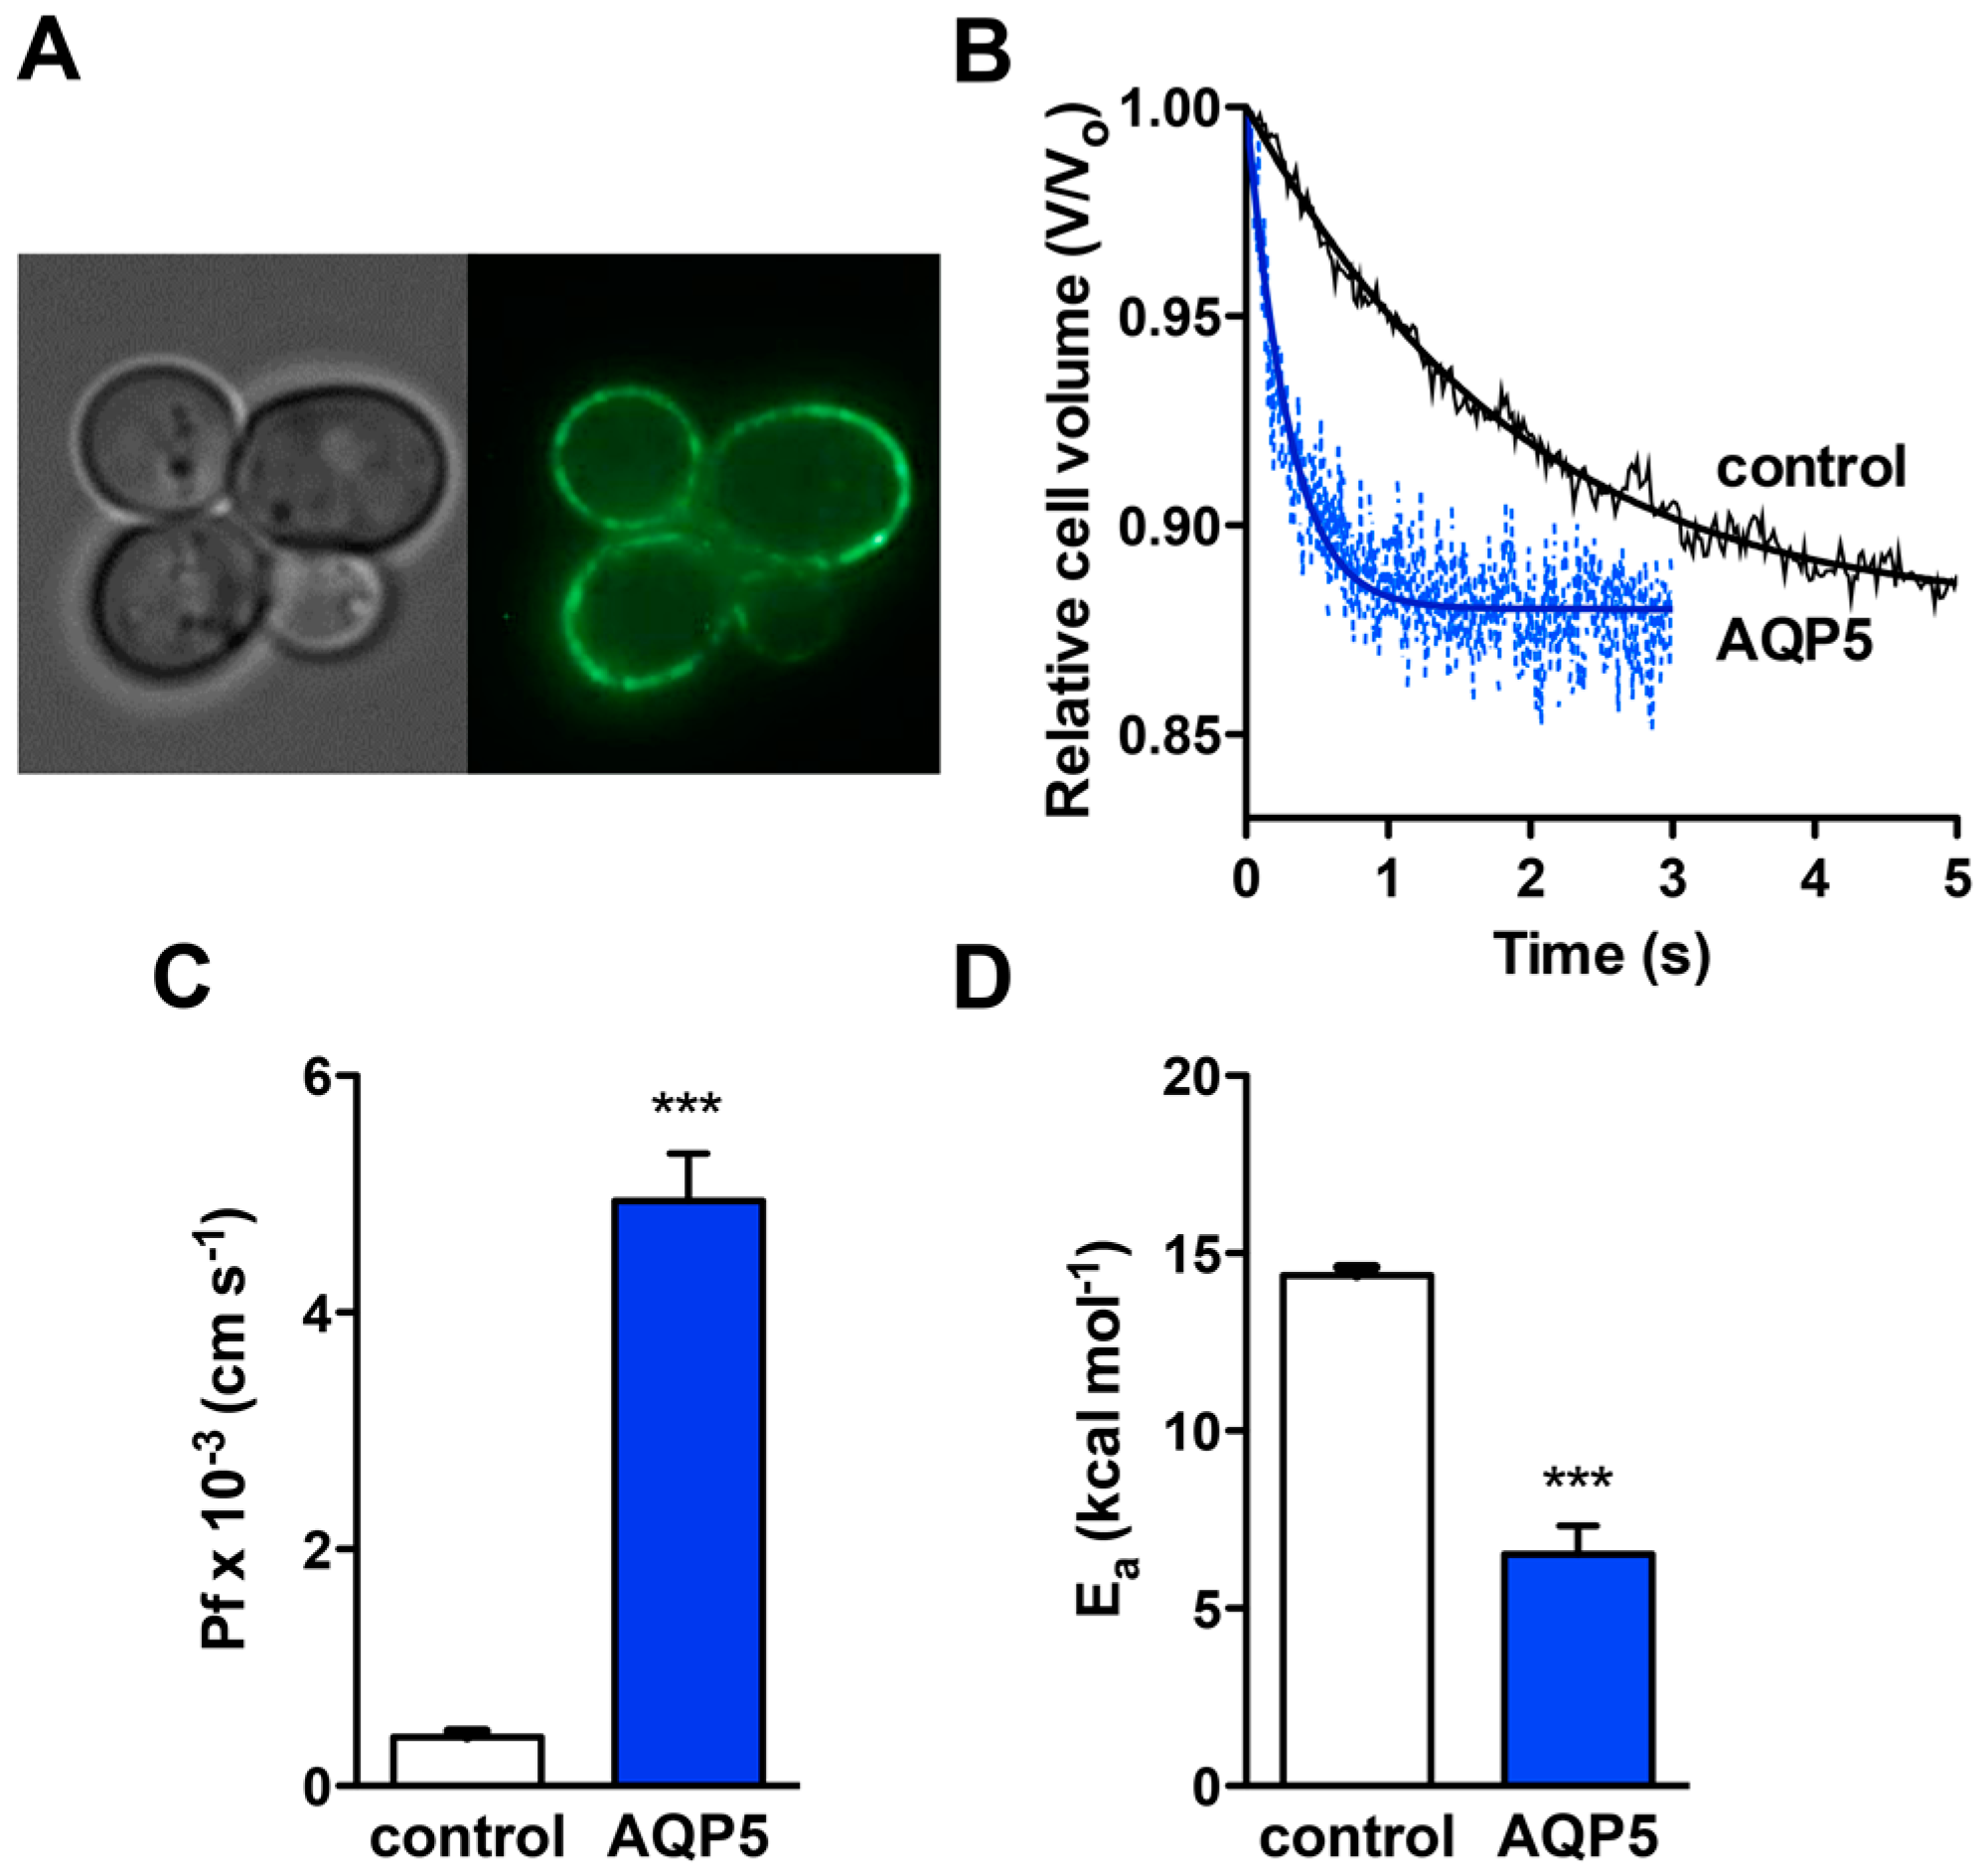
2.1. Subcellular Localization and Water Permeability of Rat AQP5 Expressed in Yeast

Yeast cells made devoid of endogenous aquaporins (aqy-null) were transformed with either the empty plasmid pUG35 (control cells) or the plasmid containing the rat AQP5 gene (mentioned as AQP5 cells, for clarity). The expression of AQP5 in the S. cerevisiae model was assessed by fluorescence microscopy, using GFP tagging. In transformed cells, AQP5–GFP is localized at the cellular membrane, as depicted in Figure 1A.
The permeability of yeast expressing AQP5 was evaluated by stopped-flow fluorescence after loading cells with the volume sensitive dye carboxifluorescein. When cells are exposed to hyperosmotic shock with impermeant solutes, water outflow induces cell shrinkage. Water permeability is then evaluated by monitoring the time course of fluorescence output that reflects the transient volume change.
As depicted in Figure 1B, cells expressing AQP5 show a much faster volume change after a hyperosmotic shock. The water permeability coefficient Pf was 12-fold higher for AQP5 cells ((4.94 ± 0.40) × 10−3 cm·s−1 and (0.41 ± 0.05) × 10−3 cm·s−1 for AQP5 and control, respectively) (Figure 1C). The activation energy for water transport Ea was concomitantly lower for AQP5 cells (6.52 ± 0.82 kcal·mol−1) compared to the control (15.16 ± 0.85 kcal·mol−1) (Figure 1D), corroborating the increase in membrane water permeability conferred by AQP5 expression. Although AQP5 behavior as a water channel is well known in the literature, these data validate the use of the yeast system to detect AQP5 function and further explore mechanisms of regulation.

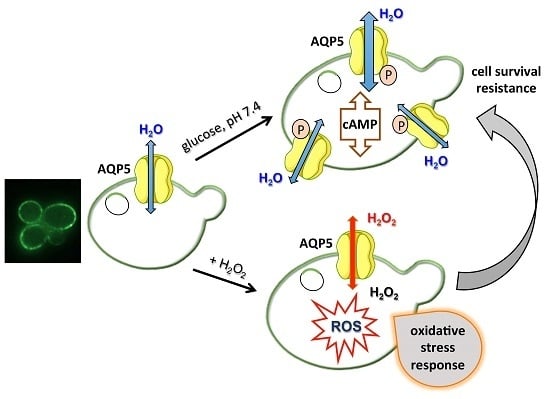
2.2. Effect of pH and Glucose-Stimulated Phosphorylation on Rat AQP5 Permeability

AQPs can be subjected to regulation via different mechanisms, among which pH regulation has been disclosed for plant [28] and for a few mammalian AQPs, such as AQP0, AQP3, and AQP6 [30,31,32]. It is also known that eukaryotic AQPs can be gated by phosphorylation [24].
A gating mechanism regulating human AQP5 activity has been proposed by molecular dynamics simulations [33]. This study revealed that the AQP5 channel could change between an open and closed state by a tap-like mechanism at the cytoplasmic end, induced by a translation of the His67 inside the pore, blocking the entrance of the channel. Moreover, when in the open state, the selectivity filter (SF) can regulate the flow rate of water molecules by exhibiting two different conformations (wide or narrow). These two conformations are decided by the side chain orientation of His173 and the proximity to Ser183—when His173 is close to Ser183, the SF is in the narrow conformation and the water passage is restricted. The trigger for this gating mechanism has not been described; in addition, this in silico approach has not been so far experimentally validated. A similar gating mechanism for human AQP4 was recently described [34], where two putative gate regions formed by two residues on the cytoplasmic side (His95 and Cys178) and the other two on the SF region (Arg216 and His201) modulate opening and closure of the AQP4 pore along four possible conformational states. The relative stability of the two resulting states, open and closed, may depend on small changes in the microenvironment, such as variations of pH. Indeed, a pH-dependent gating mechanism was recently obtained from in silico and in vitro studies [35], ascribing to His95 located in AQP4 cytoplasmic end the role of regulating channel permeability. Phosphorylation of AQP4 has also been demonstrated with opposed effects depending on the residue that is phosphorylated. AQP4 is inhibited when Ser180 is phosphorylated in loop D and is activated when Ser111 in loop B is phosphorylated [36]. These observations prompted us to investigate if AQP5 would be gated by pH or by phosphorylation.
Our group has recently characterized the pH dependence of AQP3 permeability using the yeast heterologous expression system [27]. Thus, we first decided to investigate the effect of external pH on AQP5 activity of rat AQP5-transformed yeasts. Although our yeast cells express rat AQP5, sequence alignment of human and rat AQP5 isoforms showed a sequence identity of 91% [37] (Figure S1). From the analyses of the amino acid sequences, we can infer that human and rat AQP5 may share the same gating mechanism.
Since the physiological pH of yeast’s natural environment is acidic (3.5–6.5) [38], and conditions at which cells show optimal growth and expression and trafficking mechanisms are expected to be fully active, we chose the external pH 5.1 to test yeast membrane water permeability. In addition, considering that a mammalian aquaporin is being expressed, permeability was also measured at the mammalian physiological pH 7.4. Permeability experiments with AQP5 and control cells incubated at pH 5.1 and 7.4 showed that, by changing external pH channel, activity was not altered (Figure 2A). At pH 5.1, Pf = (0.35 ± 0.01) × 10−3 cm·s−1 and Ea = 14.38 ± 0.22 kcal·mol−1 for control cells, and Pf = (4.77 ± 0.32) × 10−3 cm·s−1 and Ea = 7.69 ± 0.86 kcal·mol−1 for AQP5 cells, were not different from the respective values at pH 7.4 (detailed above, Figure 1). These results indicate that the acidic external pH does not affect AQP5 water permeability.
It is known that AQP5 expression and trafficking can be regulated by phosphorylation, but whether phosphorylation also regulates channel activity and contributes to gating still remains uncertain. Several studies reported AQP5 redistribution in plasma membrane of animal cells initiated by phosphorylation [20,39]. Post-transcriptional regulation of AQP5 function in response to stimuli such as neurotransmitters, hormones, and cyclic adenosine monophosphate (cAMP), has been reported (for a review see [7]). cAMP regulates aquaporin-5 expression at both transcriptional and post-transcriptional levels through a protein kinase A (PKA) pathway [40], increasing AQP5 abundance on the apical membrane of lung epithelial cells after long-term exposure [41]. Besides translocation to the plasma membrane, phosphorylation of AQP5 was shown to promote cell proliferation [8] and, interestingly, AQP5 Ser156 was found preferentially phosphorylated in tumor cells [42], supporting AQP5 phosphorylation involvement in cell proliferation.
In yeast S. cerevisiae, the basal intracellular cAMP concentration is low [43]. However, addition of glucose or related fermentable sugars after a period of glucose-starvation triggers the Ras/PKA pathway, creating a sudden and transient increase in intracellular cAMP levels that induce a protein phosphorylation cascade [44,45]. Activation of this pathway by glucose mimics the well-known hormonal-induced phosphorylation pathways that occur in animal cells [46]. Therefore, to examine the effect of phosphorylation on AQP5 water permeability, glucose starved yeast cells were incubated with 100 mM glucose for 5 min before Pf measurements. As shown in Figure 2B, glucose addition did not affect Pf of control or AQP5 cells at pH 5.1 (Figure 2B). However, at pH 7.4, glucose pulse resulted in a significantly two-fold increased Pf in AQP5 cells (Pf = (10.60 ± 0.53) × 10−3 cm·s−1) and a 30-fold increase compared with basal levels of control cells (Figure 2B).
In addition, we investigated the time course of AQP5 activation after glucose addition at pH 7.4 (Figure 2C). Following a glucose pulse, a transient strong increase of cAMP with peak values around 1–2 min that progressively decay to about their basal levels, was previously reported in yeast cells [47,48]. Our data show a significant increase of AQP5 water permeability after 1 min that was further increased at 5 min; after 15 min, glucose exposure no longer produces effect on AQP5 permeability, possibly due to the decay of cAMP synthesis. Yeast cells were subsequently incubated for 5 min simultaneously with glucose and HgCl2, a well-known aquaporin inhibitor (Figure 2C). In this case, the glucose-induced increase in Pf of AQP5 cells was partially abolished (Pf = (6.26 ± 1.23) × 10−3 cm·s−1. The inhibitor alone had no effect on Pf of control cells.
Afterwards, to determine whether cAMP-mediated increase in water permeability was due to AQP5 increased trafficking and abundance or to opening of the channel, we measured GFP-tagged AQP5 relative membrane expression (Figure 2D). Before glucose addition, the membrane abundance measured at pH 5.1 and pH 7.4 was not significantly different (0.37 ± 0.07 and 0.35 ± 0.07, respectively) (Figure 2E). Although membrane abundance was slightly increased after 5 min glucose pulse (implying that also trafficking is triggered by phosphorylation, as previously reported by Kitchen et al. [20]), this effect was only detected at extracellular pH 5.1 (0.49 ± 0.08 and 0.47 ± 0.12 at 5 and 15 min, respectively). Interestingly, at pH 7.4, no significant difference could be detected after 5 min (0.37 ± 0.07), and at both pHs the membrane abundance was kept stable at least for 15 min (Figure 2E).
Also to consider is the fact that, if a carbon source is available, external shifts in proton concentration in the pH range from 3.0 to 7.5 do not significantly affect yeast internal pH values due to ATPase activity [38]. However, a two-fold increase in Pf with concomitant reduction of Ea after glucose addition only happened at pH 7.4 (Figure 2B). No increase was seen at pH 5.1. Interestingly, pH 5.1 is in the range of yeast physiological pH at which the machineries for protein expression, transcription, and trafficking are expected to be in place. If the increase in Pf observed would be simply due to an increase in AQP5 membrane abundance, then it should also be detected at pH 5.1. Hence, since we observe differences in permeability mediated by phosphorylation when the external pH is changed, changes in the channel structure activity rather than in AQP5 membrane abundance might be responsible for the measured difference in permeability.
Figure 3A displays the structure of human AQP5 with several consensus phosphorylation sites at cytoplasmic loop D (Ser152 and Ser156) and at C-terminal (Ser231, Ser233, and Thr242) [49]. In Figure 3B the top view of the monomer is depicted, with His173 and Ser183 located in the selectivity filter (SF). The distance between these two residues (8.4 Å) was proposed to correspond to the pore wide conformation [33]. All these residues are conserved in rat AQP5 sequence (Figure S1) with the exception of Ser233. Phosphorylation of Ser156 was reported to play an important role in AQP5 translocation to the plasma membrane in HEK293 cells [20]. In contrast, another study observed that a mutation on Ser156 had no effect on membrane trafficking but instead affected cell proliferation [42].
Thr259 is not represented in Figure 3A due to the inexistent electron density beyond Pro245 in hAQP5 structure. However, this residue is also an interesting phosphorylation site due to the homology to Ser256 in hAQP2. It has been demonstrated that phosphorylation of Ser256, besides triggering AQP2 insertion at apical plasma membrane, is also essential to modulate AQP2 function, increasing water permeability of the individual channel [50,51]. In a recent study, extracellular acidic pH was shown to attenuate AQP2 hormone-induced phosphorylation and membrane apical trafficking, probably by inhibition of vasopressin V2 receptor-G protein-cAMP-PKA actions [52].
From a structural point of view, Ser152 and Ser156 are strong candidates prone to induce conformation changes at loop D with impact on the protein channel monomeric conformation. However, phosphomimetic mutations of Ser156 were able to increase membrane expression but did not cause any significant structural change [20]. It is thus reasonable to anticipate that more than one phosphorylation site is necessary to produce a measurable conformation change. Phosphorylated AQP5 (Ser and Thr residues facing the cytoplasmic region, Figure 3A) may induce a change in channel conformation, and in this new conformation de-protonation of His183 residue (facing the outer membrane) may occur at pH 7.4, with widening of the channel pore (Figure 3B). While at pH 7.4 the channel is wide open, at pH 5.1 the protonated residues and putative hydrogen-bond interactions hold the channel in the narrow open conformation, with lower permeability. Interestingly, the human AQP5 crystals were obtained at pH 7.0–7.6, the pH range where, in this study, phosphorylated AQP5 shows increased permeability.

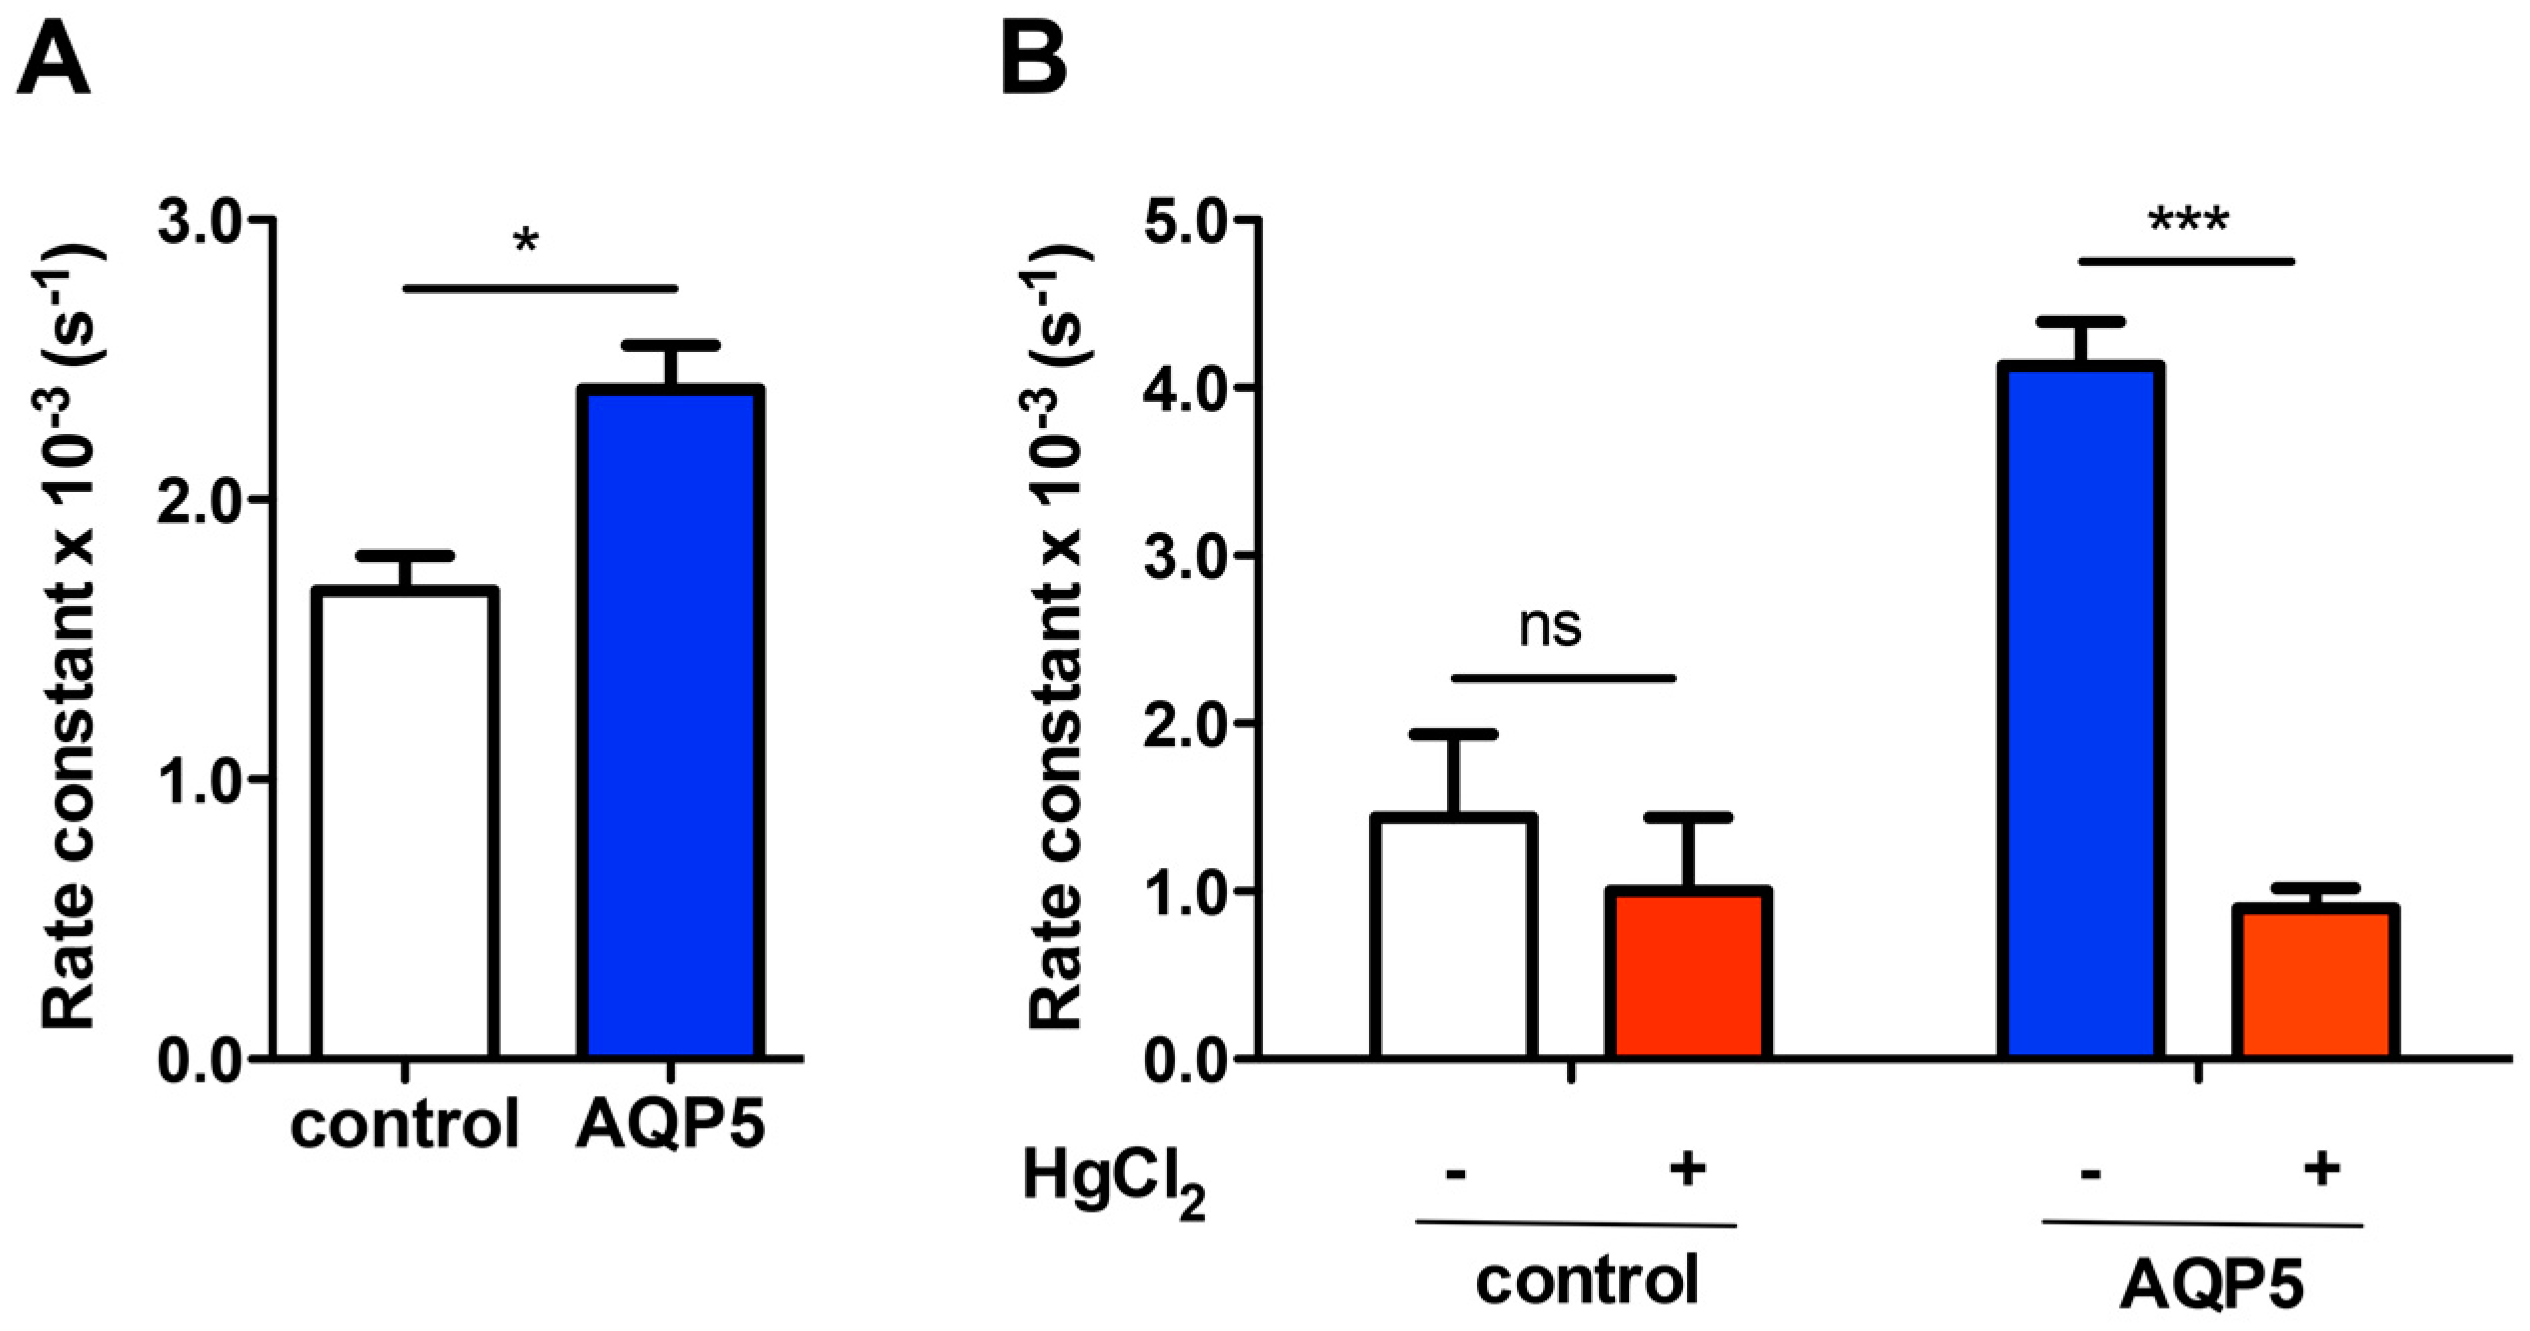
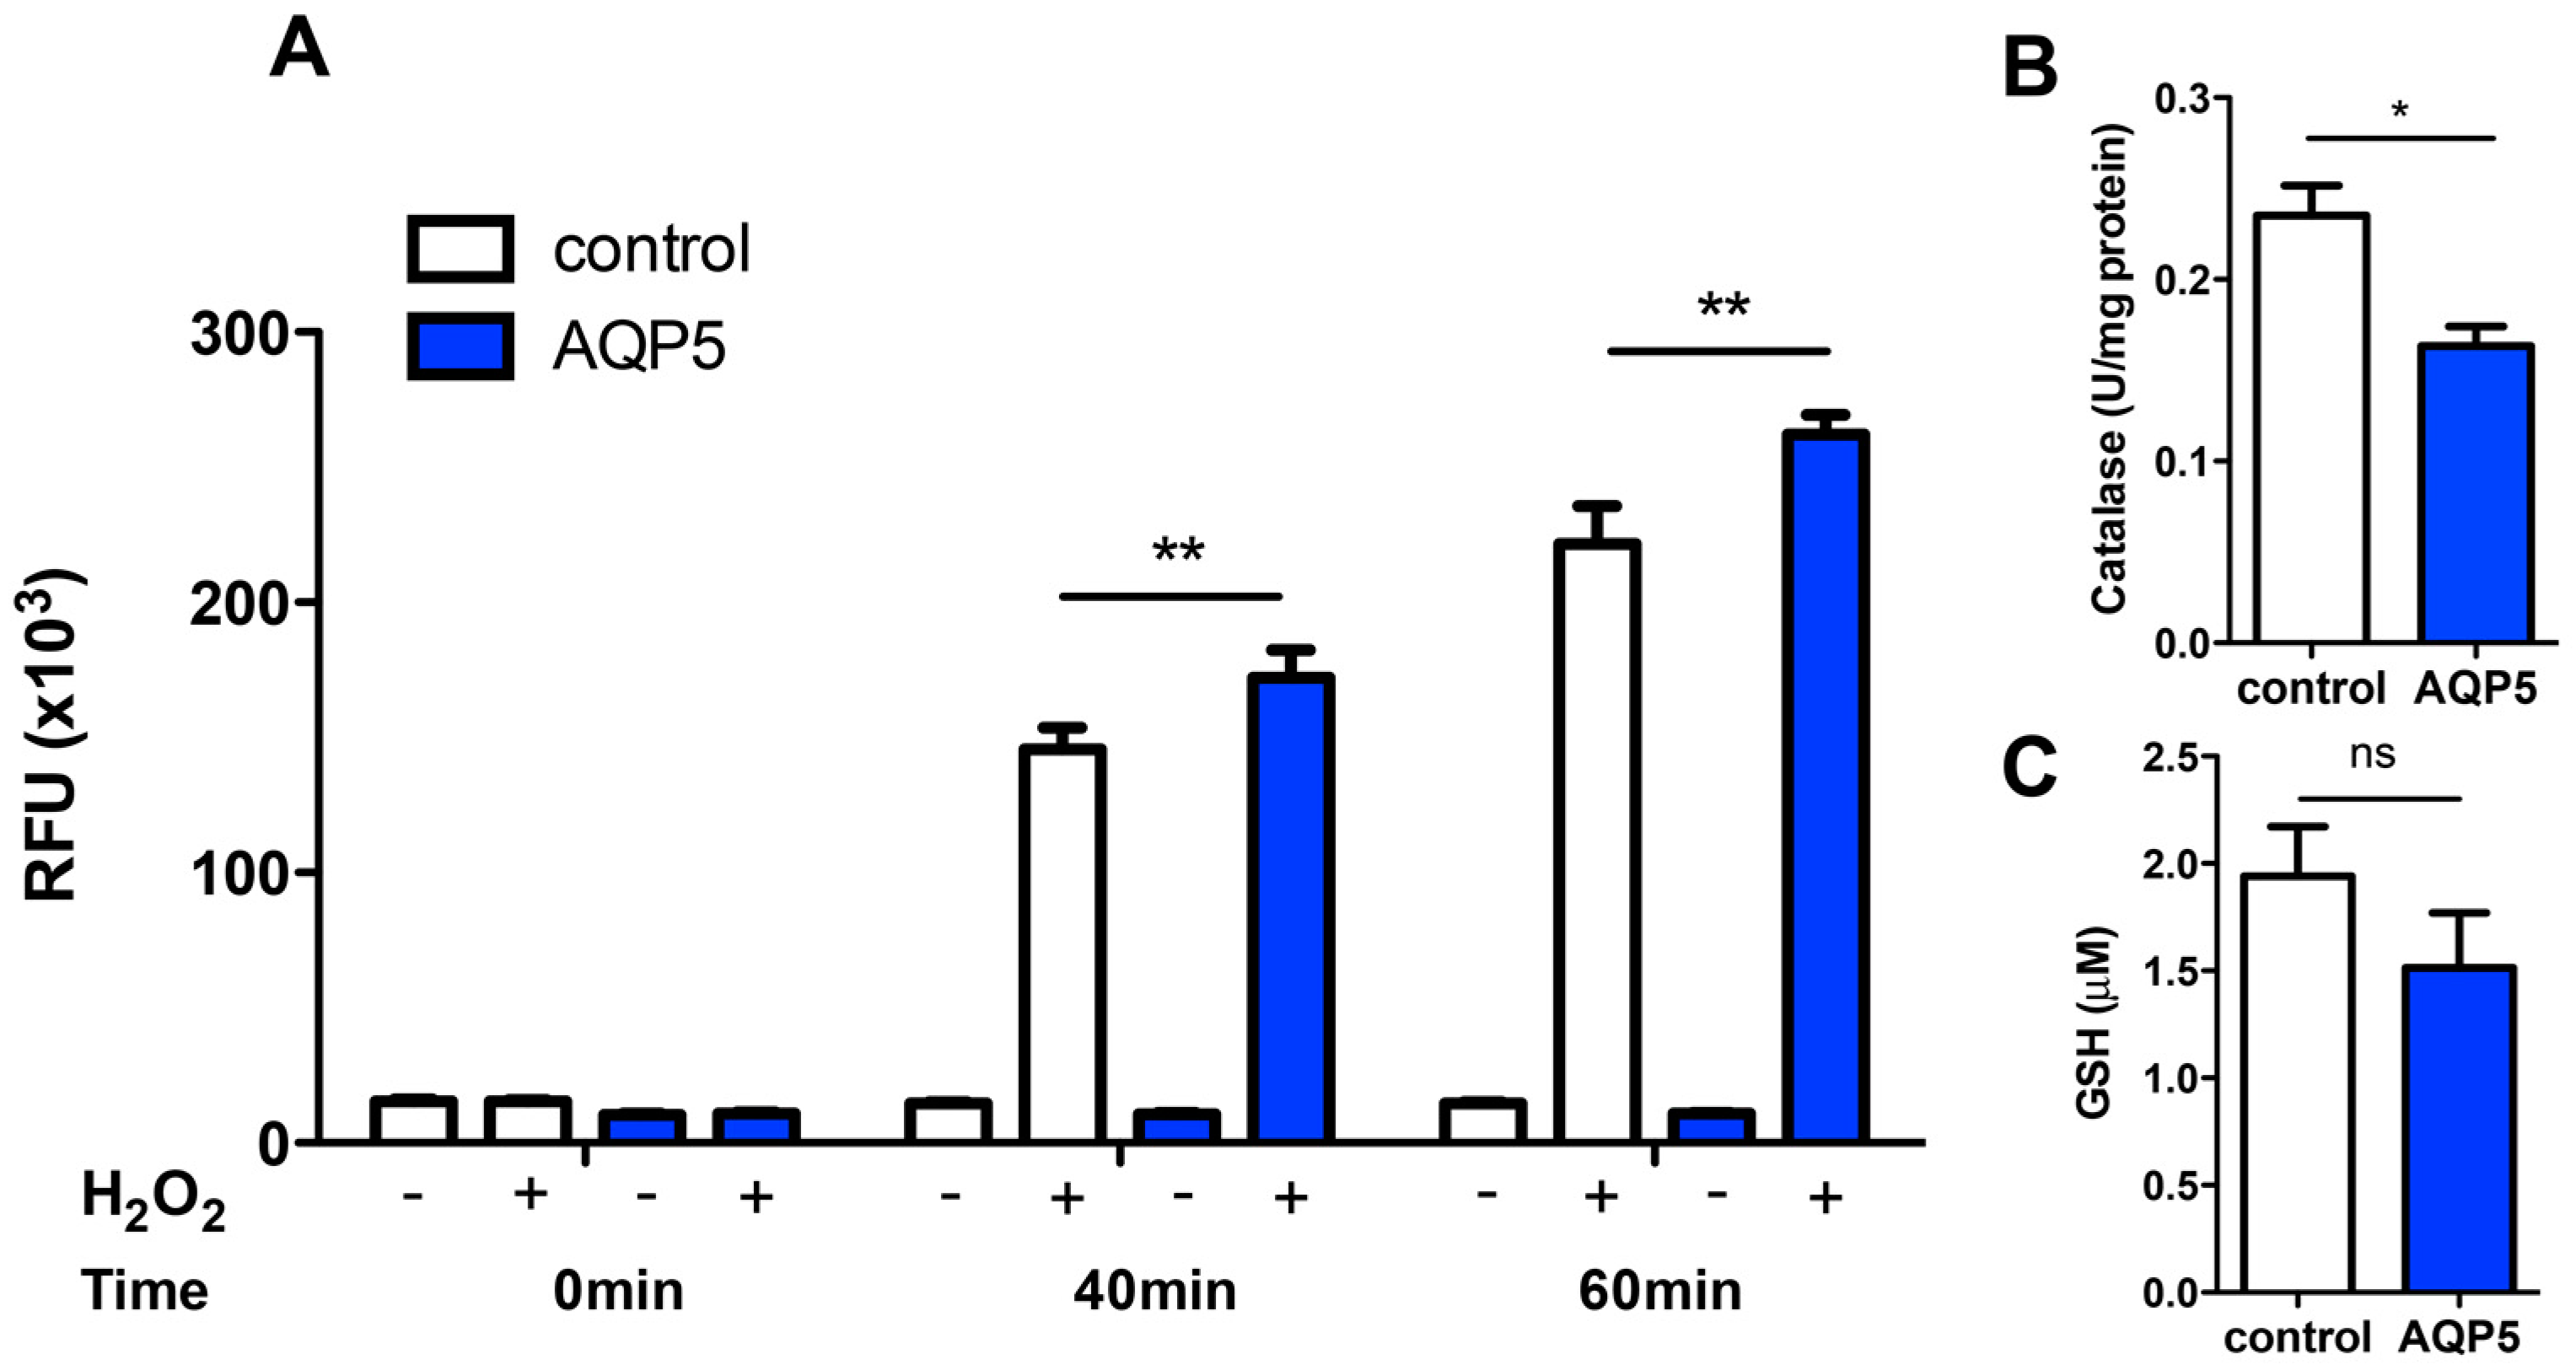
2.3. Hydrogen Peroxide Consumption

AQP5 has been implicated in carcinogenesis and its tissue expression might be associated with cancer aggressiveness [7]. The mechanisms underlying AQP5 involvement in cancer are still unclear, but in addition to participation in intracellular signaling transduction pathways and interaction with oncoproteins, AQP5 channel activity facilitating rapid changes in cell volume and subsequent changes in cell shape, was proposed to be crucial for cell migration [7,11]. Furthermore, AQP5 permeation of H2O2 and subsequent implication in cell oxidative stress would help explaining its participation in tumorigenesis.
To investigate if AQP5 expression increases the rate of H2O2 diffusion through membranes, we measured the consumption of external H2O2 in control and AQP5 expressing cells by electrochemical assays, using O2- and H2O2-specific electrodes. After the external addition of H2O2, the rate constant of O2 consumption by cells was 1.4-fold increased (p < 0.05) in AQP5 cells (kControl = (1.68 ± 0.12) × 10−3 s−1) compared to control (kAQP5 = (2.39 ± 0.15) × 10−3 s−1) (Figure 4A), indicating that AQP5 cell membranes possess a facilitated H2O2 diffusion pathway. To validate this result and further investigate if AQP5 would be mediating H2O2 permeation, we then followed H2O2 cell consumption using a specific H2O2 electrode and checked whether the aquaporin inhibitor HgCl2 quenches the uptake. The obtained results (kControl = (1.44 ± 0.49) × 10−3 s−1 and kAQP5 = (4.13 ± 0.26) × 10−3 s−1) corroborate the previous increased diffusion rate of H2O2 consumption by AQP5 cells (Figure 4B). In addition, HgCl2 showed a significant inhibitory effect, reducing aproximately five-fold the rate of consumprion (p < 0.001) and not affecting the control. Therefore, these data strongly suggest that AQP5 can mediate H2O2 diffusion through membranes.

2.4. AQP5 Implication on Cell Oxidative Status

In order to assure that the disappearance of extracellular H2O2 was due to cellular uptake rather than extracellular degradation, we measured the intracellular levels of ROS after acute stress induction with 20 mM H2O2. As expected, a higher intracellular level of ROS was detected for AQP5 cells (Figure 5A). Although control cells also respond to oxidative stress induction, which may be explained by basal H2O2 membrane lipid diffusion [53], ROS content was significantly increased in AQP5 cells after approximately 40 min of stress induction. Thus, the extracellular disappearance of H2O2 measured by electrodes is in agreement with intracellular ROS production, supporting AQP5-dependent H2O2 consumption.
To further confirm that the increase in external H2O2 consumption and concomitant intracellular ROS levels were mainly due to AQP5 expression and activity, we assessed the cells’ antioxidant defense system by measuring catalase activity and GSH level in basal conditions (before addition of H2O2). An increase in these scavengers could explain the previously obtained results without the influence of AQP5.
Catalase activity, as part of the antioxidative defense system, was 30% reduced (0.235 ± 0.012 and 0.163 ± 0.008 U/mg protein, for control and AQP5, respectively) (Figure 4B) and GSH level was also slightly diminished in AQP5 cells (1.94 ± 0.18 µM for control and 1.53 ± 0.20 µM for AQP5) (Figure 5C), indicating that these scavengers are not contributing for the observed higher H2O2 consumption and ROS production in AQP5 cells.

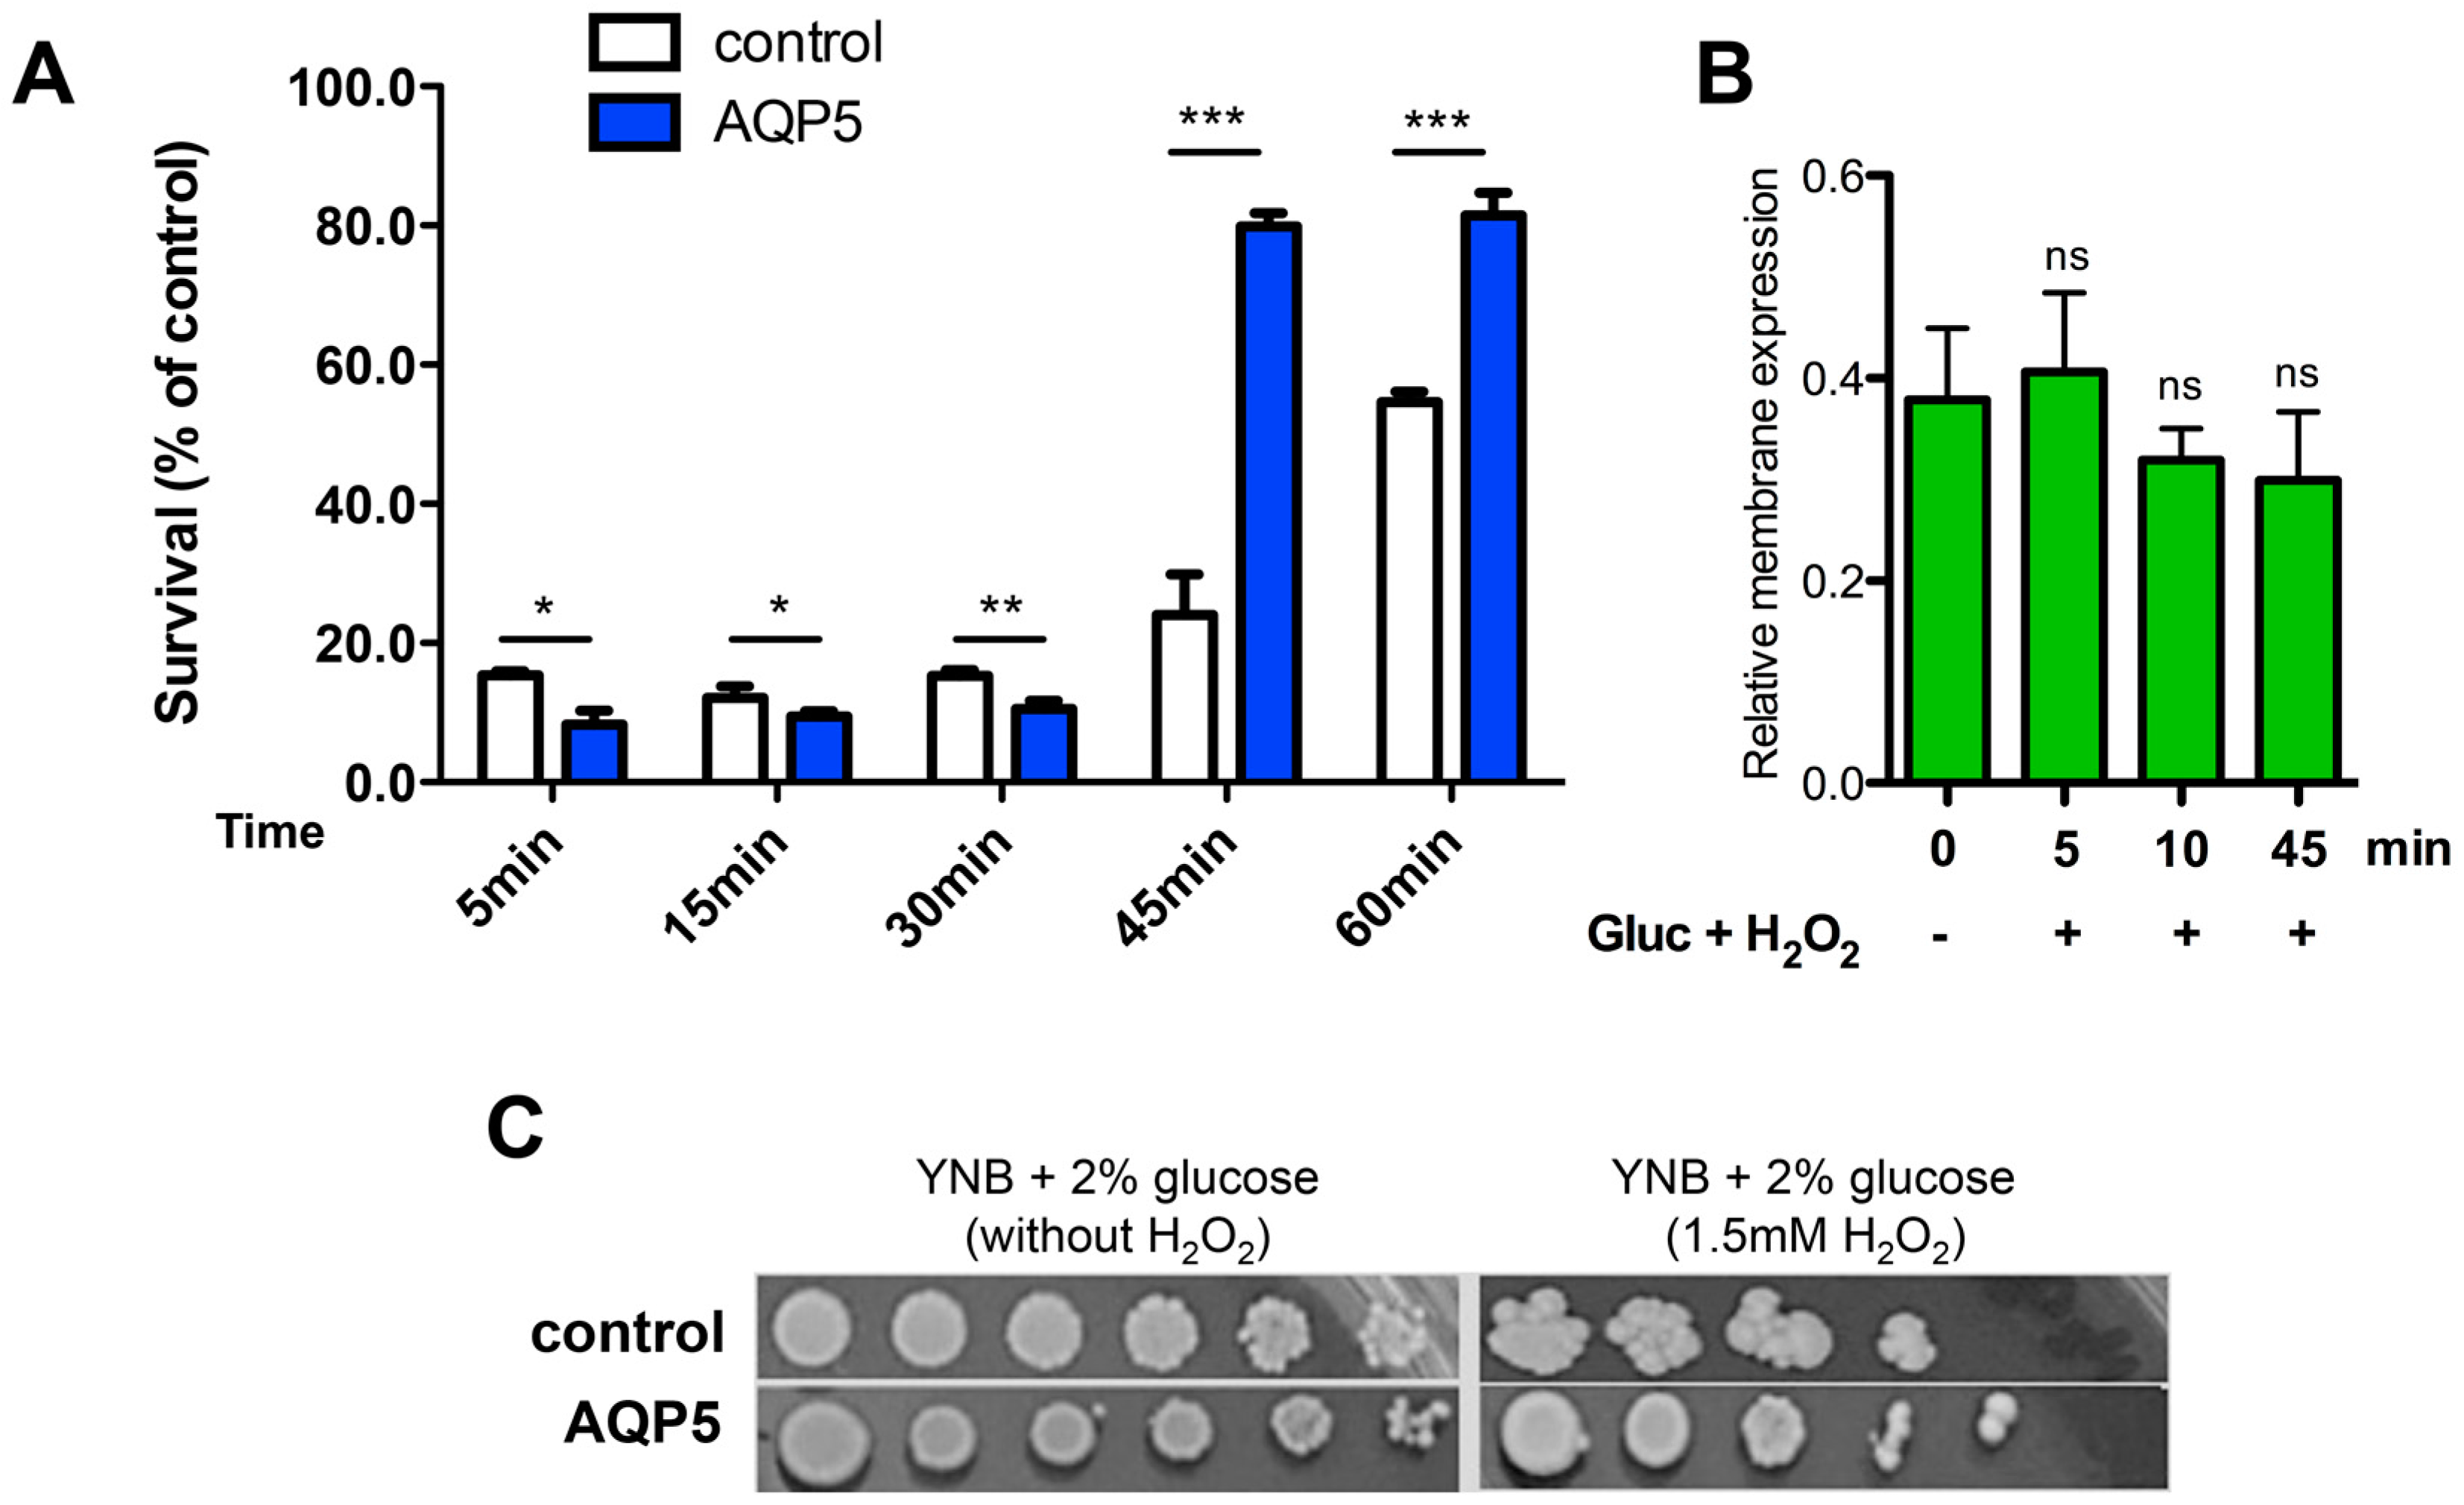
2.5. Yeast Sensitivity to Hydrogen Peroxide

ROS are no longer known only as purely harmful but instead they are described as important regulators of signaling pathways [54]. The increased intracellular levels of ROS in AQP5 cells after acute stress induction with H2O2 prompted us to investigate its outcome on yeast cell survival at shorter and longer periods after inducing the oxidative stress.
In a first approach, cells suspended in liquid medium were treated with 0.5 mM H2O2 and, after incubation for different time intervals, the ability of plated cells to survive and form colonies was evaluated. Interestingly, as depicted in Figure 6A, a different and opposed behavior was detected in a 60 min time range. While initially AQP5 cells were more sensitive to H2O2 than control, longer incubation periods, for more than 30 min, reveal that AQP5 cells survive better and are significantly more resistant to the oxidative stress insult. Thus, the initial H2O2-triggered harmful effects and lower cell survival for AQP5 cells (p < 0.05 and p < 0.01) are reversed after a while, showing that after 45 min incubation cells are able to survive significantly better than control (p < 0.001). It is worth mentioning that the initial sensitivity of AQP5 cells may be due to the cells’ lower antioxidant defense system, as suggested by catalase activity and GSH level, thus rendering AQP5 cells more prone to ROS effects. However, after 45 min of incubation with H2O2, it is clear that AQP5 cells are more resistant than control.
Measurements of membrane abundance showed that AQP5 expression was not affected after treatment with 0.5 mM H2O2 (Figure 6B). Indeed, these results are expected from the cloning method as the AQP5 gene was cloned under inducible MET25 promoter. MET25 promoter provides an inducible expression system in the absence of methionine, but renders the expression of AQP5 insensitive to stimuli or inhibition, which would normally occur, such as possible regulation by oxidative challenge.
These same conclusions can be drawn when cells were grown in solid media containing H2O2 (Figure 6C). In this assay, the long-term stress response given by the ability to grow under oxidative stress was evaluated after two weeks. A clear resistance of AQP5 cells can be observed.
Altogether, these results indicate that AQP5 expression contributes to activation of either the cell antioxidant defense response or the signaling transduction pathways triggered by H2O2. The increased resistance displayed by AQP5 cells might be the result of a faster metabolic adaptation to the oxidative cell status conferred by AQP5 expression.

3. Discussion

The present study provides experimental evidences for the direct regulation of AQP5 water permeability by pH dependent on phosphorylation and for AQP5 involvement in cell oxidative stress response.
Human AQP5 was the first aquaporin crystalized in full tetrameric assembly [49] and its trafficking and membrane expression are regulated by phosphorylation [20] through PKA and RAS signaling pathways that promote cell proliferation [8]. The fact that AQP5 was found preferentially phosphorylated in tumor cells strongly suggests that its regulation might be involved in tumorigenesis. In addition to trafficking, AQP5 channel activity may be crucial for cancer cell migration and proliferation [7,11]. Therefore, it is reasonable to hypothesize that AQP5 ability to permeate H2O2 in addition to water, could also contribute to its up-regulation in cancer tissues.
In this context, this study aimed at investigating two mechanisms supporting AQP5 involvement in tumorigenesis: (i) its ability to be short-term regulated or gated, either by acidic conditions or by phosphorylation; and (ii) its ability to permeate H2O2 in addition to water and consequent outcome in oxidative cell response.
Our data show that AQP5 can be gated by pH in a phosphorylation dependent manner. Glucose addition with consequent PKA pathway activation may simultaneously stimulate AQP5 trafficking and abundance at the plasma membrane and contribute to opening of the channel at physiological pH 7.4; the measured increase in water permeability in AQP5 cells may reflect the sum of the two processes, trafficking and gating.
In our assays, a small increase in AQP5 membrane expression 5 min after the glucose pulse was detected, but only for extracellular pH 5.1. At pH 7.4 the increase in membrane abundance was not observed and cannot explain the higher Pf measured. It is worth mentioning that, although at different extracellular pHs, yeasts are able to maintain the intracellular pH close to neutrality if a carbon source is available. Thus, the extracellular pH is not expected to greatly influence inner pH and is not likely to induce changes in membrane trafficking. In fact, the average membrane expression was similar at both pHs. Since phosphorylation occurs intracellularly, one may speculate that it is the direct AQP5-phosphorylation that alters protein conformation and, in this new conformation, channel widening results from de-protonation of residues at pH 7.4. Therefore, in addition to promoting membrane trafficking, phosphorylation may endorse an AQP5 channel with the ability of pH sensing.
At mammalian physiologic conditions (pH 7.4) phosphorylated AQP5 enables larger fluxes of water through membranes, which may contribute to rapid changes in cell volume and shape and thus facilitate cell migration. Extracellular pH shifts acidic conditions favors channel narrowing, allowing fine-tuning of cell volume. Notably, although natural for yeast cells, the low pH tested is far below the pH found in mammalian tissues, even in solid tumors where it can reach pH 6.5 [55]. There are, however, a few mammalian acidic physiological conditions where pH gets close to this value. For instance, sweat shows acidic pH levels, between 4.6 and 5.4 [56], and in the skin the protective sweat acid mantle acidity ranges from 4 to 5.5 [56]; the pH of human stomach is highly acidic, usually from 1 to 2; osteoclasts’ acidic microenvironment below pH 5.5 is critical for the bone resorption [57]; an acidic pH luminal fluid microenvironment is important for sperm maturation [58]. Interestingly, AQP5 was found expressed in sweat glands [59], gastric mucosa [60], bone cells [61], and in the epididymis [58]. In all these tissues, effective mechanisms of water flux regulation induced by pH fluctuations might be advantageous to prevent excessive water reabsorption and control cell volume and shape.
Furthermore, this study demonstrates that AQP5 is able to permeate H2O2. AQP5-transformed cells show a high rate of H2O2 consumption, indicating that AQP5 facilitates H2O2 membrane permeation. Data of H2O2 consumption, ROS intracellular levels, and resistance to H2O2 suggest that AQP5 is involved in cell oxidative stress response and point to a novel mechanism explaining AQP5 contribution to tumorigenesis.
Noteworthy, the initial higher sensitivity to H2O2 displayed by AQP5-expressing cells turned into higher resistance in chronic oxidative stress conditions. Yeast cells possess a limited pool of antioxidant enzymes that protect against ROS but are not sufficient to protect cells from sudden and high oxidative challenges. The onset of oxidative stress usually induces an early response, where the intracellular antioxidant system provides instant protection against the initial toxic accumulation of ROS. Stress signals such as H2O2 can activate transcription factors which upregulate the expression of many genes including the ones encoding enzymatic (e.g., catalases) and non-enzymatic antioxidants (e.g., GSH) [62]. The subsequent syntheses of antioxidant defenses promote ROS scavenging, repair oxidized biomolecules, and restore cellular redox balance [63,64]. These response mechanisms help ensure the survival of non-lethally damaged cells [54]. Additionally, exposure of cells to severe oxidative stress can elicit lethal response pathways such as autophagy, apoptosis, and necrosis [64]. We may speculate that AQP5-facilitated H2O2 permeation induces a faster activation of transcription factors and antioxidant system stimulation, contributing to the pro-survival cellular responses to oxidative stress.
The results obtained in this study with yeast cells can possibly be translated to mammalian cells. For instance, S. cerevisiae contains three conserved signaling modules that control transcriptional regulation triggered by oxidative stress, and two of them have homology to others species, including mammalian [65]. Furthermore, the activating protein-1 (AP-1) family of transcription factors that regulate cellular processes such as proliferation, differentiation, apoptosis, and stress response, exists in both mammalian and yeast cells and can be activated by H2O2 [66]. In yeast, the AP-1 homolog Yap1 functions as an oxidative stress sensor and regulates the expression of antioxidant genes in response to stress, including thioredoxin, thioredoxin reductase, glutathione reductase, and γ-glutamylcysteine synthase [65], and, interestingly, the AQP5 5’-flanking region has a consensus binding site for AP-1 [67]. Thus, a mechanism where H2O2 permeated by AQP5 contributes to activation of AP-1 transcription factor that in turn stimulates antioxidant genes expression and possibly AQP5 gene expression as well, cannot be disregarded. A major issue that remains to be resolved is the precise connection between AQP5 phosphorylation via the cAMP-PKA pathway and the oxidative stress cell resistance conferred by AQP5. Further experiments using mammalian cells and the human AQP5 gene will help to untangle the mechanisms underlying AQP5 involvement in oxidative stress response.

4. Materials and Methods

4.1. Yeast Strains and Growth Conditions

Plasmid (pcDNA3) with Rattus norvegicus AQP5 cDNA (pcDNA3-AQP5), kindly provided by Prof. Miriam Eschevarria, Virgen del Rocio University Hospital, Seville, Spain, was used for AQP5 cDNA amplification. The centromeric plasmid pUG35 was used for cloning AQP5, conferring C-terminal GFP tagging, MET25 promoter, and CYC1-T terminator [68].
For plasmids propagation, Escherichia coli DH5α was used as host [69]. E. coli transformants were maintained and grown in Luria-Bertani broth (LB) supplemented with ampicillin (100 µg·mL−1), at 37 °C [70]. Plasmid DNA was extracted from E. coli using a GenEluteTM Plasmid Miniprep Kit (Sigma-Aldrich, St. Louis, MO, USA).
Saccharomyces cerevisiae (10560-6B MATa leu2::hisG tpr1::hisG his3::hisG ura3-52 aqy1D::KanMX aqy2D::KanMX) from now on designated as aqy-null, was used as host strain for heterologous expression of AQP5. The aqy-null strain was grown and maintained in YPD medium (2% w/v peptone, 1% w/v yeast extract, 2% w/v glucose). Transformed yeast strain was grown in YNB medium (2% w/v glucose, 0.67% (DIFCO) Yeast Nitrogen Base) supplemented with the adequate requirements for prototrophic growth [71] and maintained in the same medium with 2% (w/v) agar. For stopped-flow assays, the same medium was used for yeast cell growth. For all experiments, cells were grown to mid exponential phase (OD600 1.0).

4.2. Cloning and Heterologous Expression of AQP5 in S. cerevisiae

This section was performed according to previously described methods [27]. Briefly, after propagation, isolation, and purification of pcDNA3_AQP5, AQP5-specific primers modified to incorporate restriction sites for SpeI (underlined) and ClaI (underlined) (5′-GGACTAGTCCT ATG AAA AAG GAG GTG TGC TCC CTT GC-3′ and 5′-CCATCGATGGA GTG TGC CGT CAG CTC GAT G-3′, respectively) were designed and used for PCR amplification of AQP5 cDNA (carried out in an Eppendorff thermocycler using Taq Change DNA polymerase from NZYTech, Lisbon, Portugal). The PCR product was digested with SpeI and ClaI restriction enzymes, purified (using a Wizard® SV Gel and the PCR Clean-Up System kit Promega) and cloned (using T4 DNA Ligase Roche) into the corresponding restriction sites of pUG35 digested with the same restriction enzymes, behind the MET25 promoter and in frame with the GFP sequence and CYC1-T terminator, according to standard protocols [70], to construct the expression plasmid pUG35-AQP5.
This plasmid was propagated in E. coli DH5α. After extraction and purification, fidelity of constructs and correct orientation of AQP5-cDNA were verified by PCR amplification and DNA sequencing. Transformation of the S. cerevisiae aqy-null strain with pUG35-AQP5 was performed using the lithium acetate method described in [72], from now on named AQP5 strain, for clarity. The same strain was also transformed using an empty pUG35 vector (which does not contain AQP5 cDNA) to be used as a control (further indicated as control strain). Transformants were selected on YNB medium without uracil as auxotrofic marker.

4.3. AQP5 Subcellular Location by Fluorescence Microscopy

For subcellular localization of GFP-tagged AQP5 in S. cerevisiae, yeast cells in the mid-exponential phase were observed using a Zeiss Axiovert 200 fluorescence microscope (Zeiss, Jena, Germany), at 495 nm excitation and 535 nm emission wavelengths. Fluorescence microscopy images were captured with a digital camera (CoolSNAP EZ, Photometrics, Tucson, AZ, USA) and using the Metafluor software (Molecular Devices, Sunyvale, CA, USA).
AQP5 membrane expression was measured by evaluating GFP-protein fluorescence intensity according to [20,73]. A linear profile that crosses the cell membrane was generated and analyzed using the software ImageJ (https://imagej.net). The intensity profile along the line path from at least 30 cells in each experimental condition (n = 3) was recorded (Figure 2D), and for each cell three profile lines were taken. The background intensity along the same distance was measured and subtracted from the peak fluorescence intensity over each line, and the obtained difference divided by the maximal fluorescence to calculate the relative membrane expression.

4.4. Cell Sampling and CFDA Loading

For water permeability assays, yeast transformants grown up to OD600 1, were harvested by centrifugation (5000× g; 5 min; 4 °C) (Allegra® 6 Series Centrifuges, Beckman Coulter®, Brea, CA, USA), washed 3 times and resuspended in ice cold sorbitol (1.4 M) K+-citrate (50 mM pH 5.1 or 7.8) buffer up to a concentration of 0.3 g·mL−1 wet weight and cells were incubated on ice for at least 90 min. Prior to permeability assays, cells were preloaded with the non-fluorescent precursor 5(6)-carboxyfluorescein diacetate (CFDA, 1 mM, 10 min at 30 °C), which is intracellularly hydrolyzed yielding the impermeable fluorescent form (CF). Cells were then diluted (1:10) in 1.4 M sorbitol buffer and immediately used for experiments.

4.5. Cell Volume Measurements

Equilibrium cell volumes (Vo) were obtained after loading the cells with CFDA under an epifluorescent microscope (Zeiss Axiovert, Zeiss, Jena, Germany) equipped with a digital camera. Cells were assumed to have a spherical shape with a diameter calculated as the average of the maximum and minimum dimensions of each cell.

4.6. Water Permeability Assays

Permeability assays were performed by stopped-flow fluorescence spectroscopy as previously described [74], using a HI-TECH Scientific PQ/SF-53 stopped-flow apparatus, which has a 2-ms dead time, controlled temperature, interfaced with a microcomputer.
Experiments were performed at temperatures ranging from 9 to 34 °C. Four runs were usually stored and analyzed in each experimental condition. In each run, 0.1 mL of cell suspension was mixed with an equal volume of hyperosmotic sorbitol buffer (2.1 M sorbitol, 50 mM K-citrate, pH 5.1 or 7.4) producing an inwardly directed gradient of the impermeant sorbitol solute that induces water outflow and cell shrinkage. Fluorescence was excited using a 470 nm interference filter and detected using a 530 nm cut-off filter. The time course of cell volume change was followed by fluorescence quenching of the entrapped fluorophore (CF). The recorded fluorescence signals were fitted to a single exponential from which the rate constant (k) was calculated.
The osmotic water permeability coefficient, Pf, was estimated from the linear relationship between Pf and k [74], Pf = k(Vo/A)(1/Vw(osmout)), where Vw is the molar volume of water, Vo/A is the initial volume to area ratio of the cell population, and (osmout) is the final medium osmolarity after the osmotic shock. The osmolarity of each solution was determined from freezing point depression by a semi-micro-osmometer (Knauer GmbH, Berlin, Germany). The activation energy (Ea) of water transport was evaluated from the slope of the Arrhenius plot (ln Pf as a function of 1/T) multiplied by the gas constant R.

4.7. External pH Dependence and In Vivo PKA Phosphorylation

Yeast cells were grown and prepared as above-described and incubated in isotonic sorbitol buffer (1.4 M sorbitol, 50 mM K-citrate) at two different pH (5.1 and 7.4) for at least 90 min. Deprived of a carbon source and incubated in ice for a long period, yeast cells are considered in starvation. The production of intracellular cAMP and phosphorylation was triggered immediately before water permeability measurements by the addition of 0.1 M glucose (adjusted to pH 5.1 or 7.4) to starved cells [44,45].

4.8. Hydrogen Peroxide Consumption

The consumption of H2O2 was measured in intact cells. Cells were harvested by centrifugation (5000× g; 10 min at RT) (Hettich Rotofix32, Tuttlingen, Germany), resuspended in fresh growth media and incubated at 30 °C with orbital shaking. Hydrogen peroxide (50 µM) was added to intact cells and the consumption of H2O2 was measured by following O2 release with an oxygen electrode (Hansatech Instruments Ltd., Norfolk, UK) after the addition of catalase [14]. O2 consumption is reported as a first order rate constant.
Direct consumption of H2O2 (18 µM) was measured in the same conditions using a H2O2 electrode (World Precision Instruments, Hertfordshire, UK). In both cases, H2O2 consumption was reported as a first order rate constant, obtained from the slope of a semi-logarithmic plot of H2O2 concentration versus time.

4.9. Yeast Sensitivity Assays

Acute stress—Yeast cells were grown overnight to mid exponential phase (OD600 1.0). Aliquots of 100 µL were taken from each culture, diluted to 10−4 and 100 µL was plated on agar plates. Cells were then treated with 0.5 mM H2O2 for 5, 15, 30, 45 and 60 min on an orbital shaker at 28 °C. After each incubation time, 100 µL aliquot was taken from each condition, diluted to 10−4 and 100 µL was plated on agar plates. As a control for maximum viability, aliquots of 100 µL cells without treatment were also plated. Agar plates were then incubated for 3 days at 28 °C, till visible growth was observed and colonies were then counted. Results are expressed as percentage of the time 0 (non-treated cells) colony number.
Chronic stress—Growth assays were performed on solid YNB medium, supplemented with 2% (w/v) glucose. Solid YNB medium with 1.5 mM H2O2 was freshly prepared at the time of inoculation for oxidative stress experiments. Yeast strains were grown in liquid YNB medium, with orbital shaking, at 28 °C up to OD600 ≈ 1.0 corresponding to 1 × 10⁷ cells/mL (Gallenkamp Cooled Orbital Incubator). Cells were harvested by centrifugation (4000× g; 10 min; 24 °C) (Centrifuge 5810 R Eppendorf, Wien, Austria), washed in sterile distilled water, and re-suspended to OD600 ≈ 10. Multi-well plates were prepared with serial 10-fold dilutions of the original concentrated culture up to 10−5, 3 µL suspensions were spotted with replica platter for 96-well plates device on plates containing YNB solid medium with and without H2O2 and incubated at 28 °C. Differences in growth phenotypes of yeast strains were recorded after 1 and 2 weeks of incubation.

4.10. Preparation of Cell Lysates for Colorimetric Assays

For antioxidant measurements, yeast strains cultivated to OD600 1.0, were harvested by centrifugation at 3000× g for 5 min, and washed with dH2O and dry pellets were stored at −80 °C until analysis. Dry pellet was dissolved in phosphate buffered saline (PBS) and disrupted mechanically by vigorous agitation with acid washed glass beads for 7 one-minute intervals with cooling intervals between each agitation cycle. After disruption, cell lysates were cleared by centrifugation at 16,000× g, 15 min, RT and the supernatants were used for assays. Prior to performing the assays, protein concentration of cell lysates was determined according to Bradford, using bovine serum albumin as a standard [75].

4.11. Catalase Activity Analysis

The catalase activity was measured by modified method of Goth [76]. This method is based on the measurement of H2O2 degradation in cell lysate, which occurs mostly by catalase activity as it has one of the highest turnover numbers among all the enzymes. For catalase activity assay, 40 μL of supernatant was mixed with 65 mM H2O2 for the start of the reaction. Different dilutions of hydrogen peroxide (0–75 mM) were used for standards. The reaction was stopped after 5 min by addition of 100 μL of 200 mM ammonium molybdate and color development was measured spectrophotometrically in a plate reader at 405 nm (Shimadzu UV-1601, Kyoto, Japan). One unit of catalase activity is defined as the amount of enzyme needed for degradation of 1 μmol of H2O2/min at 25 °C. Catalase activity was expressed as units of catalase per milligram of proteins in cell lysate (U·mg−1).

4.12. Determination of GSH Levels

The intracellular GSH content was measured by modification of the protocol described by Tietze [77]. Briefly, samples were diluted to 0.03 mg/mL protein and 150 μL of each was used for the assay. Reduced glutathione in serial dilutions (0–20 mg/mL) was used as a standard. Reaction was started by addition of freshly prepared reaction mix: 1.8 mM 5,5-dithio-bis-2-nitrobenzoic acid, 0.4 U GSH reductase, and 0.6 mM NADPH in phosphate buffer (100 mM NaH2PO4, 5 mM EDTA pH 7.4). The formation of 2-nitro-5-thiobenzoic acid was monitored spectrophotometrically in a plate reader at 405 nm (Shimadzu UV-1601, Kyoto, Japan). GSH concentration in cell lysates was expressed as µM of GSH per milligram of total protein (nmol·mg−1).

4.13. Intracellular ROS Analysis

To evaluate H2O2 influx, oxidation kinetics of non-fluorescent probe 2’,7’-dichlorodihydrofluorescein diacetate (DCFH-DA, Fluka, Saint Louis, MO, USA) to fluorescent 2,7-dichlorofluorescein was measured within 60 min from H2O2 administration. Briefly, yeast cells at OD600 1.0 were pre-incubated with 100 μM DCFH-DA at 28 °C for 60 min, centrifuged at 3000× g for 5 min. Pellet was washed once with dH2O, centrifuged at 3000× g for 5 min, and resuspended in media. Cells were then seeded in white microwell plates and treated with 10 mM H2O2. Fluorescence was measured before treatment and every 10 min after treatment for 60 min with a Cary Eclipse Fluorescence Spectrophotometer (Varian, CA, USA) with excitation at 500 nm and emission detection at 530 nm.

4.14. Statistical Analysis

All experiments and assays were carried out in triplicate. Mean values were compared using ANOVA followed by unpaired t-test. p-values < 0.05 were considered significantly different.

5. Conclusions

The present study provides experimental evidences for the direct regulation of AQP5 water permeability by phosphorylation at mammalian physiological pH. In addition to triggering AQP5 trafficking and increasing its membrane abundance, AQP5 phosphorylation promotes an increase in water permeability of cell membranes, which may be needed for rapid volume adaptation and for changes in cell shape crucial for cell migration and proliferation as seen in cancer cells.
AQP5 is also shown to participate in cell oxidative cell response after a stress insult, probably in a dual mechanism where AQP5–H2O2 permeation activates signal transduction cascades that stimulate antioxidants gene expression. While an initial acute stress induces cell sensitivity, under chronic stress conditions similar to tumor cell niches, AQP5 may facilitate metabolic adaptation, cell survival, and resistance. In this context, AQP5 modulation by phosphorylation may represent a novel strategy with potential application in cancer treatment.

Supplementary Materials

Supplementary materials can be found at www.mdpi.com/1422-0067/17/12/2090/s1.

Acknowledgments

We thank financial support from Fundação para a Ciência e Tecnologia (FCT), Portugal, through individual fellowship to Claudia Rodrigues (PD/BD/106085/2015), Andreia F. Mósca (SFRH/BD/52384/2013) and from MSES (Croatia). Authors acknowledge EU COST action BM1406 for funding and fruitful discussion with participants of the networks. The work was partially funded by iMed.ULisboa (UID/DTP/04138/2013), LEAF (UID/AGR/04129/2013) and PEst-OE/QUI/UI0612/2013, FCT, Portugal.

Author Contributions

Graça Soveral, Ana Cipak Gasparovic, Catarina Prista and Fernando Antunes conceived and designed the experiments; Andreia Filipa Mósca, Ana Paula Martins, Claudia Rodrigues and Tatiana Nobre performed the experiments and analyzed the data; Graça Soveral, Ana Cipak Gasparovic, Catarina Prista and Fernando Antunes contributed reagents/materials/analysis tools; Graça Soveral, Andreia Filipa Mósca and Claudia Rodrigues wrote the paper; Graça Soveral, Catarina Prista, Ana Cipak Gasparovic and Fernando Antunes reviewed and edited the manuscript. All authors read and approved the manuscript.

Conflicts of Interest

The authors declare no conflict of interest.

Abbreviations:

AQPAquaporin
cAMPCyclic adenosine monophosphate
GSHGlutathione
EaActivation energy
PfOsmotic permeability coefficient
PKAProtein kinase A
ROSReactive oxygen species

References

  1. Carbrey, J.M.; Agre, P. Discovery of the aquaporins and development of the field. In Handbook of Experimental Pharmacology; Beitz, E., Ed.; Springer: Berlin/Heidelberg, Gemany, 2009; Volume 190, pp. 3–28. [Google Scholar]
  2. Madeira, A.; Moura, T.F.; Soveral, G. Detecting aquaporin function and regulation. Front. Chem. 2016, 4, 3. [Google Scholar] [CrossRef] [PubMed]
  3. Verkman, A.S. Aquaporins in clinical medicine. Annu. Rev. Med. 2012, 63, 303–316. [Google Scholar] [CrossRef] [PubMed]
  4. Soveral, G.; Nielsen, S.; Casini, A. Aquaporins in Health and Disease: New Molecular Targets for Drug Discovery; CRC Press, Taylor & Francis Group: Boca Raton, FL, USA, 2016. [Google Scholar]
  5. Verkman, A.S.; Anderson, M.O.; Papadopoulos, M.C. Aquaporins: Important but elusive drug targets. Nat. Rev. Drug Discov. 2014, 13, 259–277. [Google Scholar] [CrossRef] [PubMed]
  6. Delporte, C.; Bryla, A.; Perret, J. Aquaporins in salivary glands: From basic research to clinical applications. Int. J. Mol. Sci. 2016, 17, 166. [Google Scholar] [CrossRef] [PubMed]
  7. Direito, I.; Madeira, A.; Brito, M.A.; Soveral, G. Aquaporin-5: From structure to function and dysfunction in cancer. Cell. Mol. Life Sci. 2016, 73, 1623–1640. [Google Scholar] [CrossRef] [PubMed]
  8. Woo, J.; Lee, J.; Kim, M.S.; Jang, S.J.; Sidransky, D.; Moon, C. The effect of aquaporin 5 overexpression on the RAS signaling pathway. Biochem. Biophys. Res. Commun. 2008, 367, 291–298. [Google Scholar] [CrossRef] [PubMed]
  9. Chae, Y.K.; Woo, J.; Kim, M.J.; Kang, S.K.; Kim, M.S.; Lee, J.; Lee, S.K.; Gong, G.; Kim, Y.H.; Soria, J.C.; et al. Expression of aquaporin 5 (AQP5) promotes tumor invasion in human non-small cell lung cancer. PLoS ONE 2008, 3, e2162. [Google Scholar] [CrossRef]
  10. Kang, S.K.; Chae, Y.K.; Woo, J.; Kim, M.S.; Park, J.C.; Lee, J.; Soria, J.C.; Jang, S.J.; Sidransky, D.; Moon, C. Role of human aquaporin 5 in colorectal carcinogenesis. Am. J. Pathol. 2008, 173, 518–525. [Google Scholar] [CrossRef] [PubMed]
  11. Papadopoulos, M.C.; Saadoun, S. Key roles of aquaporins in tumor biology. Biochim. Biophys. Acta 2015, 1848, 2576–2583. [Google Scholar] [CrossRef] [PubMed]
  12. Rhee, S.G. Cell signaling. H2O2, a necessary evil for cell signaling. Science 2006, 312, 1882–1883. [Google Scholar] [CrossRef] [PubMed]
  13. Dickinson, B.C.; Chang, C.J. Chemistry and biology of reactive oxygen species in signaling or stress responses. Nat. Chem. Biol. 2011, 7, 504–511. [Google Scholar] [CrossRef] [PubMed]
  14. Antunes, F.; Cadenas, E. Estimation of H2O2 gradients across biomembranes. FEBS Lett. 2000, 475, 121–126. [Google Scholar] [CrossRef]
  15. Bienert, G.P.; Chaumont, F. Aquaporin-facilitated transmembrane diffusion of hydrogen peroxide. Biochim. Biophys. Acta 2014, 1840, 1596–1604. [Google Scholar] [CrossRef] [PubMed]
  16. Miller, E.W.; Dickinson, B.C.; Chang, C.J. Aquaporin-3 mediates hydrogen peroxide uptake to regulate downstream intracellular signaling. Proc. Natl. Acad. Sci. USA 2010, 107, 15681–15686. [Google Scholar] [CrossRef] [PubMed]
  17. Vieceli Dalla Sega, F.; Zambonin, L.; Fiorentini, D.; Rizzo, B.; Caliceti, C.; Landi, L.; Hrelia, S.; Prata, C. Specific aquaporins facilitate NOX-produced hydrogen peroxide transport through plasma membrane in leukaemia cells. Biochim. Biophys. Acta 2014, 1843, 806–814. [Google Scholar] [CrossRef] [PubMed]
  18. Watanabe, S.; Moniaga, C.S.; Nielsen, S.; Hara-Chikuma, M. Aquaporin-9 facilitates membrane transport of hydrogen peroxide in mammalian cells. Biochem. Biophys. Res. Commun. 2016, 471, 191–197. [Google Scholar] [CrossRef] [PubMed]
  19. Satooka, H.; Hara-Chikuma, M. Aquaporin-3 controls breast cancer cell migration by regulating hydrogen peroxide transport and its downstream cell signaling. Mol. Cell. Biol. 2016, 36, 1206–1218. [Google Scholar] [CrossRef] [PubMed]
  20. Kitchen, P.; Oberg, F.; Sjohamn, J.; Hedfalk, K.; Bill, R.M.; Conner, A.C.; Conner, M.T.; Tornroth-Horsefield, S. Plasma membrane abundance of human aquaporin 5 is dynamically regulated by multiple pathways. PLoS ONE 2015, 10, e0143027. [Google Scholar] [CrossRef] [PubMed]
  21. Soveral, G.; Madeira, A.; Loureiro-Dias, M.C.; Moura, T.F. Membrane tension regulates water transport in yeast. Biochim. Biophys. Acta 2008, 1778, 2573–2579. [Google Scholar] [CrossRef] [PubMed]
  22. Ozu, M.; Dorr, R.A.; Gutierrez, F.; Politi, M.T.; Toriano, R. Human AQP1 is a constitutively open channel that closes by a membrane-tension-mediated mechanism. Biophys. J. 2013, 104, 85–95. [Google Scholar] [CrossRef] [PubMed]
  23. Leitao, L.; Prista, C.; Loureiro-Dias, M.C.; Moura, T.F.; Soveral, G. The grapevine tonoplast aquaporin TIP2;1 is a pressure gated water channel. Biochem. Biophys. Res. Commun. 2014, 450, 289–294. [Google Scholar] [CrossRef] [PubMed]
  24. Tornroth-Horsefield, S.; Hedfalk, K.; Fischer, G.; Lindkvist-Petersson, K.; Neutze, R. Structural insights into eukaryotic aquaporin regulation. FEBS Lett. 2010, 584, 2580–2588. [Google Scholar] [CrossRef] [PubMed]
  25. Fischer, G.; Kosinska-Eriksson, U.; Aponte-Santamaria, C.; Palmgren, M.; Geijer, C.; Hedfalk, K.; Hohmann, S.; de Groot, B.L.; Neutze, R.; Lindkvist-Petersson, K. Crystal structure of a yeast aquaporin at 1.15 angstrom reveals a novel gating mechanism. PLoS Biol. 2009, 7, e1000130. [Google Scholar] [CrossRef] [PubMed]
  26. Pettersson, N.; Hagstrom, J.; Bill, R.M.; Hohmann, S. Expression of heterologous aquaporins for functional analysis in Saccharomyces cerevisiae. Curr. Genet. 2006, 50, 247–255. [Google Scholar] [CrossRef] [PubMed]
  27. De Almeida, A.; Martins, A.P.; Mosca, A.F.; Wijma, H.J.; Prista, C.; Soveral, G.; Casini, A. Exploring the gating mechanisms of aquaporin-3: New clues for the design of inhibitors? Mol. Biosyst. 2016, 12, 1564–1573. [Google Scholar] [CrossRef] [PubMed]
  28. Leitao, L.; Prista, C.; Moura, T.F.; Loureiro-Dias, M.C.; Soveral, G. Grapevine aquaporins: Gating of a tonoplast intrinsic protein (TIP2;1) by cytosolic ph. PLoS ONE 2012, 7, e33219. [Google Scholar] [CrossRef] [PubMed]
  29. Sabir, F.; Leandro, M.J.; Martins, A.P.; Loureiro-Dias, M.C.; Moura, T.F.; Soveral, G.; Prista, C. Exploring three pips and three tips of grapevine for transport of water and atypical substrates through heterologous expression in aqy-null yeast. PLoS ONE 2014, 9, e102087. [Google Scholar] [CrossRef] [PubMed]
  30. Yasui, M.; Hazama, A.; Kwon, T.H.; Nielsen, S.; Guggino, W.B.; Agre, P. Rapid gating and anion permeability of an intracellular aquaporin. Nature 1999, 402, 184–187. [Google Scholar] [PubMed]
  31. Zelenina, M.; Bondar, A.A.; Zelenin, S.; Aperia, A. Nickel and extracellular acidification inhibit the water permeability of human aquaporin-3 in lung epithelial cells. J. Biol. Chem. 2003, 278, 30037–30043. [Google Scholar] [CrossRef] [PubMed]
  32. Nemeth-Cahalan, K.L.; Hall, J.E. Ph and calcium regulate the water permeability of aquaporin 0. J. Biol. Chem. 2000, 275, 6777–6782. [Google Scholar] [CrossRef] [PubMed]
  33. Janosi, L.; Ceccarelli, M. The gating mechanism of the human aquaporin 5 revealed by molecular dynamics simulations. PLoS ONE 2013, 8, e59897. [Google Scholar] [CrossRef] [PubMed]
  34. Alberga, D.; Nicolotti, O.; Lattanzi, G.; Nicchia, G.P.; Frigeri, A.; Pisani, F.; Benfenati, V.; Mangiatordi, G.F. A new gating site in human aquaporin-4: Insights from molecular dynamics simulations. BBA-Biomembranes 2014, 1838, 3052–3060. [Google Scholar] [CrossRef] [PubMed]
  35. Kaptan, S.; Assentoft, M.; Schneider, H.P.; Fenton, R.A.; Deitmer, J.W.; MacAulay, N.; de Groot, B.L. H95 is a pH-dependent gate in aquaporin 4. Structure 2015, 23, 2309–2318. [Google Scholar] [CrossRef] [PubMed]
  36. Yukutake, Y.; Yasui, M. Regulation of water permeability through aquaporin-4. Neuroscience 2010, 168, 885–891. [Google Scholar] [CrossRef] [PubMed]
  37. Altschul, S.F.; Madden, T.L.; Schaffer, A.A.; Zhang, J.; Zhang, Z.; Miller, W.; Lipman, D.J. Gapped blast and PSI-blast: A new generation of protein database search programs. Nucleic Acids Res. 1997, 25, 3389–3402. [Google Scholar] [CrossRef] [PubMed]
  38. Orij, R.; Postmus, J.; Ter Beek, A.; Brul, S.; Smits, G.J. In vivo measurement of cytosolic and mitochondrial pH using a pH-sensitive GFP derivative in Saccharomyces cerevisiae reveals a relation between intracellular pH and growth. Microbiology 2009, 155, 268–278. [Google Scholar] [CrossRef] [PubMed]
  39. Kosugi-Tanaka, C.; Li, X.; Yao, C.; Akamatsu, T.; Kanamori, N.; Hosoi, K. Protein kinase a-regulated membrane trafficking of a green fluorescent protein-aquaporin 5 chimera in MDCK cells. Biochim. Biophys Acta 2006, 1763, 337–344. [Google Scholar] [CrossRef] [PubMed]
  40. Yang, F.; Kawedia, J.D.; Menon, A.G. Cyclic AMP regulates aquaporin 5 expression at both transcriptional and post-transcriptional levels through a protein kinase a pathway. J. Biol. Chem. 2003, 278, 32173–32180. [Google Scholar] [CrossRef] [PubMed]
  41. Sidhaye, V.; Hoffert, J.D.; King, L.S. Camp has distinct acute and chronic effects on aquaporin-5 in lung epithelial cells. J. Biol. Chem. 2005, 280, 3590–3596. [Google Scholar] [CrossRef] [PubMed]
  42. Woo, J.; Lee, J.; Chae, Y.K.; Kim, M.S.; Baek, J.H.; Park, J.C.; Park, M.J.; Smith, I.M.; Trink, B.; Ratovitski, E.; et al. Overexpression of AQP5, a putative oncogene, promotes cell growth and transformation. Cancer Lett. 2008, 264, 54–62. [Google Scholar] [CrossRef] [PubMed]
  43. Van Wijk, R.; Konijn, T.M. Cyclic 3’,5’-AMP in Saccharomyces carlsbergensis under various conditions of catabolite repression. FEBS Lett. 1971, 13, 184–186. [Google Scholar] [CrossRef]
  44. Mbonyi, K.; van Aelst, L.; Arguelles, J.C.; Jans, A.W.; Thevelein, J.M. Glucose-induced hyperaccumulation of cyclic AMP and defective glucose repression in yeast strains with reduced activity of cyclic AMP-dependent protein kinase. Mol. Cell. Biol. 1990, 10, 4518–4523. [Google Scholar] [CrossRef] [PubMed]
  45. Thevelein, J.M.; de Winde, J.H. Novel sensing mechanisms and targets for the CAMP-protein kinase a pathway in the yeast Saccharomyces cerevisiae. Mol. Microbial. 1999, 33, 904–918. [Google Scholar] [CrossRef]
  46. Johnston, M.; Kim, J.H. Glucose as a hormone: Receptor-mediated glucose sensing in the yeast Saccharomyces cerevisiae. Biochem. Soc. Trans. 2005, 33, 247–252. [Google Scholar] [CrossRef] [PubMed]
  47. Van der Plaat, J.B. Cyclic 3’,5’-adenosine monophosphate stimulates trehalose degradation in baker’s yeast. Biochem. Biophys. Res. Commun. 1974, 56, 580–587. [Google Scholar] [CrossRef]
  48. Rolland, F.; Wanke, V.; Cauwenberg, L.; Ma, P.; Boles, E.; Vanoni, M.; de Winde, J.H.; Thevelein, J.M.; Winderickx, J. The role of hexose transport and phosphorylation in CAMP signalling in the yeast Saccharomyces cerevisiae. FEMS Yeast Res. 2001, 1, 33–45. [Google Scholar] [PubMed]
  49. Horsefield, R.; Norden, K.; Fellert, M.; Backmark, A.; Tornroth-Horsefield, S.; Terwisscha van Scheltinga, A.C.; Kvassman, J.; Kjellbom, P.; Johanson, U.; Neutze, R. High-resolution X-ray structure of human aquaporin 5. Proc. Natl. Acad. Sci. USA 2008, 105, 13327–13332. [Google Scholar] [CrossRef] [PubMed]
  50. Eto, K.; Noda, Y.; Horikawa, S.; Uchida, S.; Sasaki, S. Phosphorylation of aquaporin-2 regulates its water permeability. J. Biol. Chem. 2010, 285, 40777–40784. [Google Scholar] [CrossRef] [PubMed]
  51. Kuwahara, M.; Fushimi, K.; Terada, Y.; Bai, L.; Marumo, F.; Sasaki, S. cAMP-dependent phosphorylation stimulates water permeability of aquaporin-collecting duct water channel protein expressed in xenopus oocytes. J. Biol. Chem. 1995, 270, 10384–10387. [Google Scholar] [PubMed]
  52. Choi, H.J.; Jung, H.J.; Kwon, T.H. Extracellular pH affects phosphorylation and intracellular trafficking of AQP2 in inner medullary collecting duct cells. Am. J. Physiol. Ren. Physiol. 2015, 308, F737–F748. [Google Scholar] [CrossRef] [PubMed]
  53. Branco, M.R.; Marinho, H.S.; Cyrne, L.; Antunes, F. Decrease of H2O2 plasma membrane permeability during adaptation to H2O2 in Saccharomyces cerevisiae. J. Biol. Chem. 2004, 279, 6501–6506. [Google Scholar] [CrossRef] [PubMed]
  54. Finkel, T. Signal transduction by reactive oxygen species. J. Cell Biol. 2011, 194, 7–15. [Google Scholar] [CrossRef] [PubMed]
  55. Estrella, V.; Chen, T.; Lloyd, M.; Wojtkowiak, J.; Cornnell, H.H.; Ibrahim-Hashim, A.; Bailey, K.; Balagurunathan, Y.; Rothberg, J.M.; Sloane, B.F.; et al. Acidity generated by the tumor microenvironment drives local invasion. Cancer Res. 2013, 73, 1524–1535. [Google Scholar] [CrossRef] [PubMed]
  56. Herrmann, F.; Mandol, L. Studies of pH of sweat produced by different forms of stimulation. J. Investig. Dermatol. 1955, 24, 225–246. [Google Scholar] [CrossRef] [PubMed]
  57. Kato, Y.; Ozawa, S.; Miyamoto, C.; Maehata, Y.; Suzuki, A.; Maeda, T.; Baba, Y. Acidic extracellular microenvironment and cancer. Cancer Cell Int. 2013, 13, 89. [Google Scholar] [CrossRef] [PubMed]
  58. Da Silva, N.; Pietrement, C.; Brown, D.; Breton, S. Segmental and cellular expression of aquaporins in the male excurrent duct. Biochim. Biophys. Acta 2006, 1758, 1025–1033. [Google Scholar] [CrossRef] [PubMed]
  59. Du, Q.; Lin, M.; Yang, J.H.; Chen, J.F.; Tu, Y.R. Overexpression of AQP5 was detected in axillary sweat glands of primary focal hyperhidrosis patients. Dermatology 2016, 232, 150–155. [Google Scholar] [CrossRef] [PubMed]
  60. Parvin, M.N.; Tsumura, K.; Akamatsu, T.; Kanamori, N.; Hosoi, K. Expression and localization of AQP5 in the stomach and duodenum of the rat. Biochim. Biophys. Acta 2002, 1542, 116–124. [Google Scholar] [CrossRef]
  61. Yi, F.; Khan, M.; Gao, H.; Hao, F.; Sun, M.; Zhong, L.; Lu, C.; Feng, X.; Ma, T. Increased differentiation capacity of bone marrow-derived mesenchymal stem cells in aquaporin-5 deficiency. Stem Cells Dev. 2012, 21, 2495–2507. [Google Scholar] [CrossRef] [PubMed]
  62. Marinho, H.S.; Real, C.; Cyrne, L.; Soares, H.; Antunes, F. Hydrogen peroxide sensing, signaling and regulation of transcription factors. Redox Biol. 2014, 2, 535–562. [Google Scholar] [CrossRef] [PubMed]
  63. Costa, V.; Moradas-Ferreira, P. Oxidative stress and signal transduction in Saccharomyces cerevisiae: Insights into ageing, apoptosis and diseases. Mol. Asp. Med. 2001, 22, 217–246. [Google Scholar] [CrossRef]
  64. Farrugia, G.; Balzan, R. Oxidative stress and programmed cell death in yeast. Front. Oncol. 2012, 2, 64. [Google Scholar] [CrossRef] [PubMed]
  65. Ikner, A.; Shiozaki, K. Yeast signaling pathways in the oxidative stress response. Mutat. Res. 2005, 569, 13–27. [Google Scholar] [CrossRef] [PubMed]
  66. Vollgraf, U.; Wegner, M.; Richter-Landsberg, C. Activation of AP-1 and nuclear factor-κB transcription factors is involved in hydrogen peroxide-induced apoptotic cell death of oligodendrocytes. J. Neurochem. 1999, 73, 2501–2509. [Google Scholar] [CrossRef] [PubMed]
  67. Krane, C.M.; Towne, J.E.; Menon, A.G. Cloning and characterization of murine AQP5: Evidence for a conserved aquaporin gene cluster. Mamm. Genome 1999, 10, 498–505. [Google Scholar] [CrossRef] [PubMed]
  68. Guldener, U.; Heck, S.; Fielder, T.; Beinhauer, J.; Hegemann, J.H. A new efficient gene disruption cassette for repeated use in budding yeast. Nucleic Acids Res. 1996, 24, 2519–2524. [Google Scholar] [CrossRef] [PubMed]
  69. Hanahan, D. Techniques for Transformation of Escherichia coli; IRL Press: Oxford, UK, 1985. [Google Scholar]
  70. Sambrook, J.; Fritsch, E.F.; Maniatis, T. Molecular Cloning: A Laboratory Manual, 2nd ed.; Cold Spring Harbor: New York, NY, USA, 1989. [Google Scholar]
  71. Pronk, J.T. Auxotrophic yeast strains in fundamental and applied research. Appl. Environ. Microbiol. 2002, 68, 2095–2100. [Google Scholar] [CrossRef] [PubMed]
  72. Geitz, R.D.; Schiestl, R.H. Transforming yeast with DNA. Methods Mol. Cell. Biol. 1995, 5, 255–269. [Google Scholar]
  73. Joshi, S.D.; Davidson, L.A. Live-cell imaging and quantitative analysis of embryonic epithelial cells in Xenopus laevis. J. Vis. Exp. 2010. [Google Scholar] [CrossRef] [PubMed]
  74. Soveral, G.; Madeira, A.; Loureiro-Dias, M.C.; Moura, T.F. Water transport in intact yeast cells as assessed by fluorescence self-quenching. Appl. Environ. Microbiol. 2007, 73, 2341–2343. [Google Scholar] [CrossRef] [PubMed]
  75. Bradford, M.M. A rapid and sensitive method for the quantitation of microgram quantities of protein utilizing the principle of protein-dye binding. Anal. Biochem. 1976, 72, 248–254. [Google Scholar] [CrossRef]
  76. Goth, L. A simple method for determination of serum catalase activity and revision of reference range. Clin. Chim. Acta 1991, 196, 143–151. [Google Scholar] [CrossRef]
  77. Tietze, F. Enzymic method for quantitative determination of nanogram amounts of total and oxidized glutathione: Applications to mammalian blood and other tissues. Anal. Biochem. 1969, 27, 502–522. [Google Scholar] [CrossRef]
Figure 1. Expression and function of rat AQP5 (Aquaporin-5) in yeast. (A) Epifluorescence images of GFP-tagged AQP5 localization (green) in yeast cells (100× objective); (B) Representative time course of the relative cell volume (V/V0) changes after a hyperosmotic shock inducing cell shrinkage (pH 7.4); (C) Water permeability coefficients of control (Pf = (0.41 ± 0.05) × 10−3 cm·s−1) and cells expressing AQP5 (Pf = (4.94 ± 0.40) × 10−3 cm·s−1), measured at 23 °C and pH 7.4. Data are mean ± SD of 10 measurements; (D) Activation energies (Ea) for water permeation of control and AQP5 cells (15.16 ± 0.85 and 6.52 ± 0.82 kcal·mol−1, respectively). Data are mean ± SD. *** p < 0.001.
Ijms 17 02090 g001
Figure 2. Regulation of AQP5 water permeability. (A) Water permeability Pf at pH 5.1 and pH 7.4 of control cells (Pf = (0.35 ± 0.01) × 10−3 and (0.41 ± 0.05) × 10−3 cm·s−1, respectively) and yeast cells expressing AQP5 (Pf = (4.77 ± 0.32) × 10−3 and (4.94 ± 0.40) × 10−3 cm·s−1, respectively); (B) Water permeability Pf at pH 5.1 and pH 7.4 upon an external glucose pulse (C) Time course of glucose-induced phosphorylation (1, 5 and 15 min, pH 7.4) and inhibition of AQP5 by HgCl2 0.05 mM. Data are mean ± SD of 10 measurements; (D) Representative epifluorescence images of GFP-tagged AQP5 localization in yeast cells (100× objective); linear intensity profiles are indicated (yellow lines); and (E) Relative membrane expression of AQP5 calculated from fluorescence intensity profiles (30 cells in each experimental condition, 3 profiles for each cell, from at 3 independent experiments). ns, non significant, * p < 0.5, *** p < 0.001.
Ijms 17 02090 g002
Figure 3. Structure of human AQP5 monomer. (A) Side view of the monomer with several phosphorylation consensus sites in the cytoplasmic region (Ser152, Ser156, Ser231, Ser233, and Thr242) shown in licorice representation. Thr259, also a phosphorylation site, is not represented due to the inexistent electron density beyond Pro245 for hAQP5 structure [49]; (B) Top view of the monomer with His173 and Ser183 in the selectivity filter (SF) shown in licorice representation. The distance between these two residues (8.4 Å) corresponds to the proposed distance for the SF wide conformation [33]. Water molecules are shown as red spheres along the channel pore. Structures were generated with Chimera (http://www.cgl.ucsf.edu/chimera) and are based on AQP5 X-ray structure (PDB databank code 3D9S).
Ijms 17 02090 g003
Figure 4. AQP5-dependent H2O2 consumption of yeast cells. (A) First-order kinetic rate constant (s−1) of H2O2 consumption measured with the Clark electrode (O2 measurement); (B) First-order kinetic rate constant (s−1) of the H2O2 consumption measured with the H2O2 electrode, before (white and blue bars) and after incubation with 0.5mM HgCl2, 5min at RT (red bars). Values are mean ± SD of triplicates. ns, non significant, * p < 0.05, *** p < 0.001.
Ijms 17 02090 g004
Figure 5. Cellular levels of ROS (oxidant), GSH and catalase (antioxidants). (A) Time course of Intracellular ROS production after acute stress induction with 20 mM H2O2; (B) Catalase activity and (C) total intracellular GSH content of yeast strains. Values are means ± SD of triplicates, ns, non significant, * p < 0.05, ** p < 0.01.
Ijms 17 02090 g005
Figure 6. Stress response of yeast strains to H2O2. (A) Acute stress response. Time course of cell survival of yeast cells in liquid culture after treatment with 0.5 mM H2O2. Percentage survival is expressed relative to untreated controls. Values are means ± SD of triplicates. * p < 0.05, ** p < 0.01, *** p < 0.001; (B) Relative membrane expression of AQP5 calculated from fluorescence intensity profiles (30 cells in each experimental condition, 3 profiles for each cell, from 3 independent experiments). ns, non significant; (C) Chronic stress response. Growth assay of yeast cells under oxidative stress. Yeast suspensions were spotted in 10-fold dilution on solid YNB plates without or with 1.5 mM H2O2. Growth was recorded after two weeks at 28 °C. Photographs shown are representative of three independent experiments with consistent results.
Ijms 17 02090 g006

