Article

Decreased Expression of BNC1 and BNC2 Is Associated with Genetic or Epigenetic Regulation in Hepatocellular Carcinoma

Department of Microbiology & Infectious Disease Center, School of Basic Medical Science, Peking University Health Science Center, Beijing 100191, China
*
Author to whom correspondence should be addressed.
Int. J. Mol. Sci. 2016, 17(2), 153; https://0-doi-org.brum.beds.ac.uk/10.3390/ijms17020153
Submission received: 16 December 2015 / Revised: 8 January 2016 / Accepted: 19 January 2016 / Published: 25 January 2016

Abstract

:
The aberrant expression of transcription factor Basonuclin (BNC) had been reported in different kinds of tumors. Here, we investigated the expression and methylation status of two Basonuclin homologs, BNC1 and BNC2 in hepatocellular carcinoma (HCC). We found that the expression levels of both BNC1 and BNC2 were down-regulated in HCC cell lines and primary HCC tissues. The frequency and intensity of BNC1 promoter hypermethylation in tumor tissues was significantly higher than that in adjacent non-tumor tissues. 5-Aza-2’-Deoxycytidine treatment could significantly increase the BNC1 expression in the methylated HCC cell lines, which implicated that epigenetic modification contributed to the down-regulation of BNC1. In addition, BNC1 hypermethylation in tumor tissues was more likely to happen in female patients. No methylation of the BNC2 promoter was found in HCC tumor tissues. However, a frequent deletion of the BNC2 gene was observed, which indicated that the chromosomal loss of the BNC2 gene might be one important reason for its lower expression level in HCC. Our results suggested that BNC1 and BNC2 were down-regulated in HCC which may provide new insight into the tumorigenesis of HCC.

Graphical Abstract

1. Introduction

Hepatocellular carcinoma (HCC) is the second leading cause of cancer-related deaths worldwide and China alone accounts for 50% of the total number of deaths [1]. There is growing evidence that the aberrant expression of cellular genes in liver cells, due to genetic and/or epigenetic alterations, may contribute to the development of HCC [2,3]. Therefore, identifying new molecular carcinogenic events will help us to further understand the mechanisms of HCC and give guidance for the development of novel clinical treatment.
Basonuclin (BNC) is a cell-type-specific zinc finger protein which is quite conserved in evolution. Basonuclin 1 (BNC1) was firstly identified in cultured human epidermal keratinocytes and was highly expressed in skin keratinocytes and germ cells of the testis and ovary [4,5]. The human BNC1 gene is located on chromosome 15 and possesses three separated pairs of zinc fingers, a nuclear localization signal and a serine strip [4,6]. It has been reported that BNC1 may function as a transcription factor which could interact with a subset of genes that are transcribed by both RNA polymerase I (Pol I) and polymerase II (Pol II) and also has a role in maintaining ribosome production and regulating the expression of genes involved in cellular differentiation and proliferation [7,8]. Recently, another Basonuclin gene (BNC2) was reported [5], which had a common evolutionary origin with BNC1. Although the amino acid sequence of BNC2 differs extensively from that of BNC1, BNC2 possesses all of the characteristic features of BNC1 described above, and has a wider distribution than BNC1. Since BNC2 might co-localize with serine/arginine-rich splicing factor 2 (SRSF2/SC35), a splicing factor in keratinocytes, its function was considered likely to be related to mRNA splicing or other forms of mRNA processing [8].
Numerous lines of investigation have demonstrated that the aberrant expression of BNC1 and BNC2 contribute to tumor progression. BNC1 has been shown to be silenced by promoter methylation in a wide variety of tumors, including pancreatic cancer, renal cell carcinoma, lung cancer, lymphocytic leukemia and the metastatic brain tumors originating from primary breast tumors [9,10,11,12,13]. Over-expression of BNC1 in pancreatic cancer cell lines inhibited colony formation and cell proliferation in vitro [9]. Thus, BNC1 was thought to be a potential tumor suppressor gene in these tumors. However, in breast cancer and squamous cell carcinoma of the head and neck [7,14], BNC1 expression was elevated with increased invasive and metastatic capacity. In line with this, loss of BNC1 expression resulted in a reduced epithelial-mesenchymal transition (EMT) phenotype, suggesting that the expression of BNC1 would enhance the process of metastasis via EMT [13]. These findings suggested that BNC1 might play diverse roles in tumor progression depending on cellular context and disease stage. Little is known about the expression and function of BNC2 in tumor progression. According to reports, BNC2 was associated with skin color variation and skin cancer risk [15]. Moreover, deletion of the BNC2 gene and decreased expression of BNC2 mRNA have been detected in Barrett’s esophagus tumor tissues. In esophageal adenocarcinoma cells, stable expression of BNC2 caused the growth arrest of tumor cells [16], suggesting that BNC2 might also be a tumor suppressor gene. To date, the roles of the BNC1 and BNC2 genes in hepatocarcinogenesis have not been addressed.
In this study, the expression levels and methylation statuses of BNC1 and BNC2 were investigated in primary HCC tissues and their corresponding adjacent non-tumor liver tissues, in order to investigate the potential roles of BNC1 and BNC2 genes in HCC.

2. Results

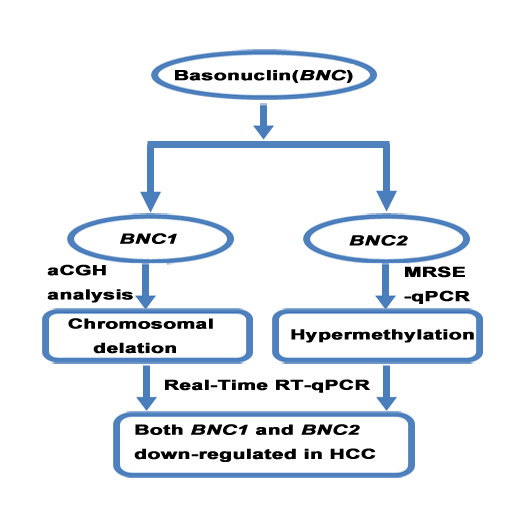
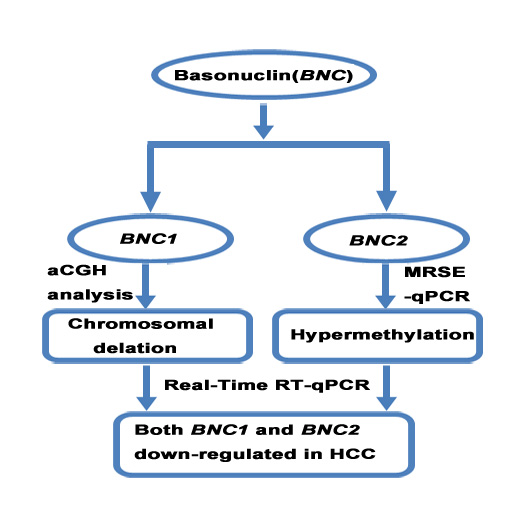
2.1. The Expression of Basonuclin 1 (BNC1) and Basonuclin 2 (BNC2) Genes Were Down-Regulated in Hepatocellular Carcinoma (HCC) Cell Lines and Primary HCC Tissues

Firstly, real-time RT-qPCR was used to detect the mRNA expression levels of BNC1 and BNC2 in five HCC cell lines (HepG2, Huh-7, SMMC7721, Hep3B, and SNU449) and one liver adenocarcinoma cell line (SK-Hep-1). As shown in Figure 1A, much lower mRNA expression levels of BNC1 was observed in all five HCC cell lines than that in normal liver tissues. Similar to BNC1, BNC2 mRNA expression levels were decreased in four HCC cell lines including HepG2, Huh-7, SMMC7721 and Hep3B cells. Both BNC1 and BNC2 mRNA expression levels were higher in the liver adenocarcinoma cell line SK-Hep-1 than in normal tissue. Next, we tested the expression levels of BNC1 and BNC2 in 30 pairs of matched tumor and their adjacent non-tumor tissues. Consistent with the results in HCC cell lines, both BNC1 and BNC2 mRNA expression levels in tumor tissues were statistically lower than that in corresponding non-tumor tissues (p < 0.0001 and p = 0.0315, respectively), as well as that in normal liver tissues (p = 0.0039 and p = 0.0299, respectively) (Figure 1B).

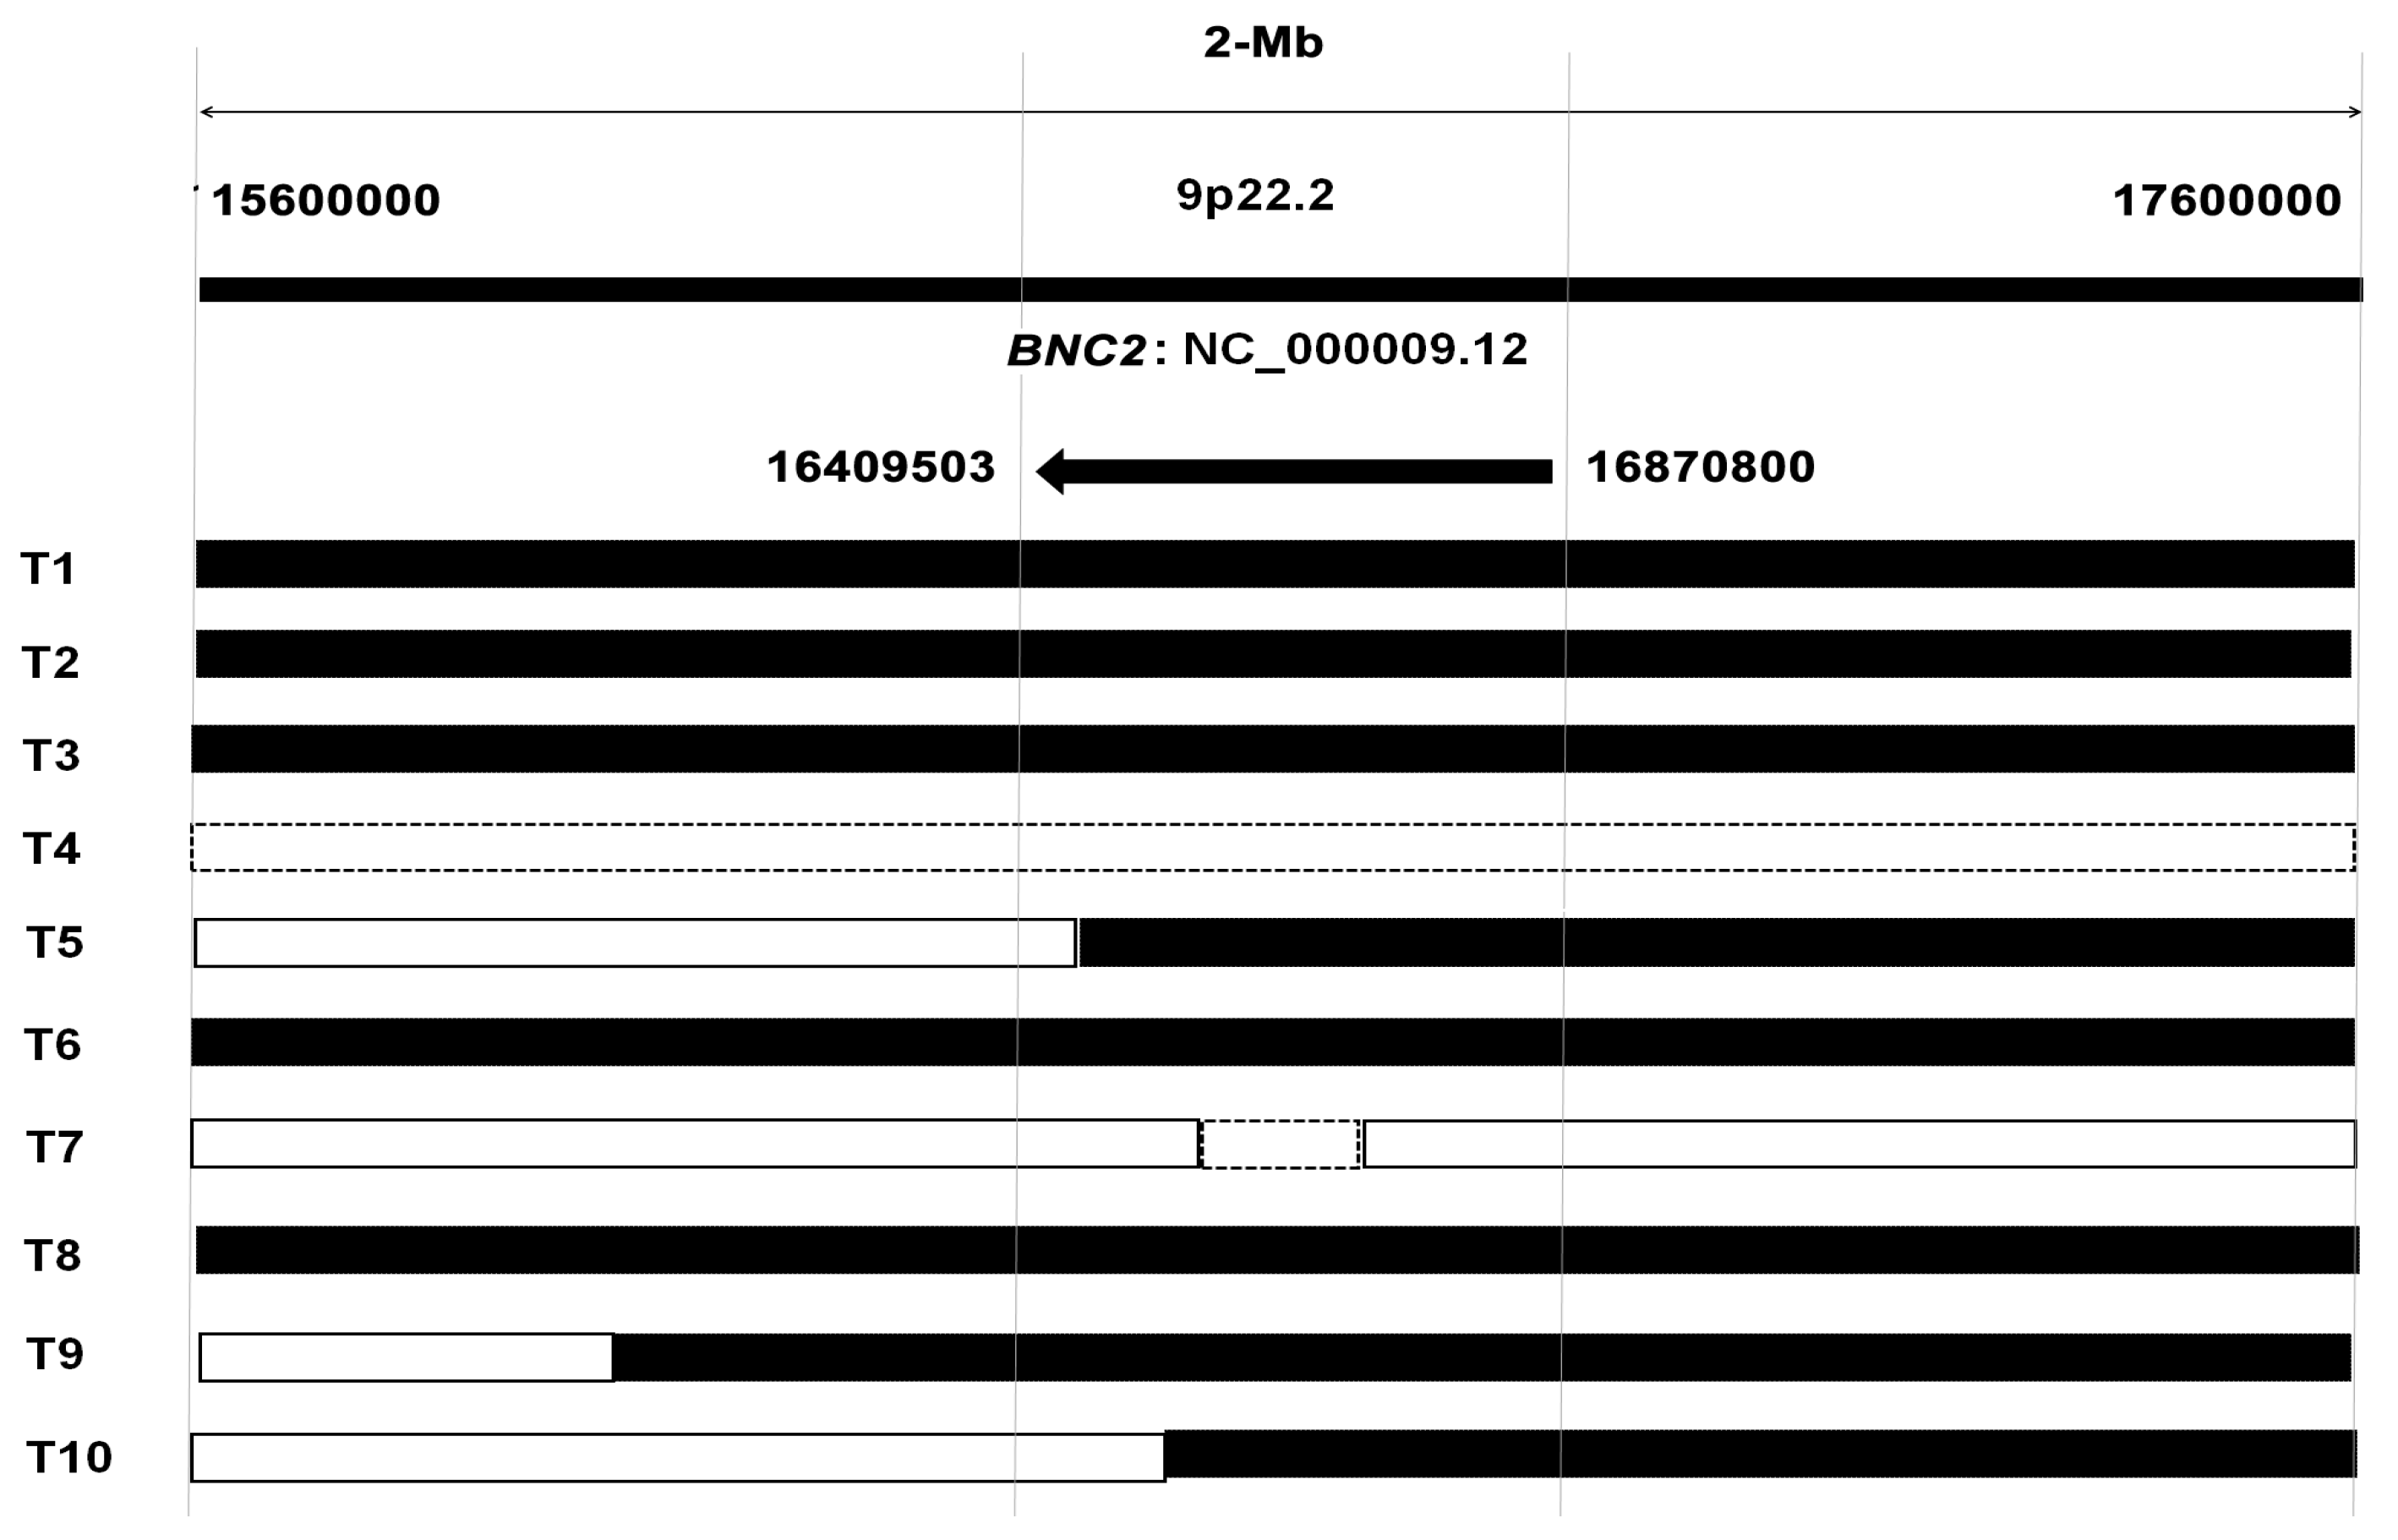
2.2. Chromosomal Loss of BNC1 and BNC2 Genes in Primary HCC Tumor Tissues

To detect the copy number aberrations of genes in HCC tissues, we have previously performed a 2-Megabase (2-Mb) array-based comparative genomic hybridization (aCGH) analysis in 25 pairs of HCC tissues and their corresponding non-tumor tissues [17]. The result revealed that the BNC2 gene was deleted in eight HCC tissues, partially amplified in one case, and the whole gene was amplified in one case (Figure 2). Since partial amplification of the BNC2 gene could also lead to expression silence, the rate of chromosomal loss in the BNC2 gene was (9/25; 36%). As for the BNC1 gene, the deletion rate was only 8% (2/25). These results indicate that the frequent loss of the BNC2 gene might be an important reason for its low mRNA expression in HCC; while for the BNC1 gene, mechanisms other than chromosome loss might lead to its down-regulation in HCC.
Figure 1. The mRNA expression levels of Basonuclin (BNC) genes in liver cancer cell lines and primary hepatocellular carcinoma (HCC) tissues detected by real-time RT-qPCR. (A) Expression of Basonuclin 1 (BNC1) and Basonuclin 2 (BNC2) in liver cancer cell lines; (B) Expression of BNC1 and BNC2 in 30 pairs of HCC tumor tissues and adjacent non-tumor tissues and 10 normal liver tissues. CTBP1: C-terminal binding protein 1.
Ijms 17 00153 g001
Figure 2. Chromosomal aberrance of BNC2 gene in HCC tissues. “T” represents tumor tissue; Black lines represent Chromosome deletion; the dotted lines represent Chromosome amplification and real lines represent normal status. 2-Mb: 2-Megabase.
Ijms 17 00153 g002

2.3. Promoter Methylation of BNC1 and BNC2 in HCC Cell Lines

Promoter CpG island (CGI) hypermethylation is an important mechanism for the inactivation of tumor suppressor gene in HCC. To detect whether the promoter CGI region of BNC1 or BNC2 was hypermethylated in HCC, methylation-sensitive restriction enzymes-based quantitative PCR (MSRE-qPCR) was performed in five HCC cell lines and the liver adenocarcinoma cell line SK-Hep-1. With threshold value of methylation intensity set at 10% [18], a strong hypermethylation status of BNC1 was detected in all five HCC cell lines (Figure 3A). A further bisulfite sequencing assay also confirmed the hypermethylation status of the BNC1 promoter region in Hep3B cells (Figure 3B,C). No methylation was found in SK-Hep1 cells which showed higher expression of BNC1 mRNA. Unlike BNC1, BNC2 methylation was only found in Huh7 cells (Figure 3A).
To further test whether DNA methylation suppressed BNC1 expression, we treated SNU449, SMMC7721 and Hep3B cells with DNA methyltransferase inhibitor 5-Aza-2′-Deoxycytidine, and analyzed the changes of BNC1 expression by real-time RT-qPCR. As shown in Figure 3D, treatment with 5-Aza-2′-Deoxycytidine significantly enhanced BNC1 expression in these cells. Additionally, treatment of the SMMC7721 and Hep3B cells with only the histone deacetylation inhibitor trichostatin A (TSA), or together with 5-Aza-2′-Deoxycytidine also resulted in reactivation of BNC1 expression. These results implicated that epigenetic modification in the promoter CGI region might modulate BNC1 expression in HCC cells.
Figure 3. Promoter methylation status of BNC1 and BNC2 in liver cancer cell lines. (A) The methylation status of BNC1 and BNC2 genes in five HCC cell lines and liver adenocarcinoma cell line SK-Hep-1 detected by methylation-sensitive restriction enzymes-based quantitative PCR (MSRE-qPCR). The dotted line represents the 10% cut off value; (B) Bisulfite sequencing analysis of the BNC1 CpG island in Hep3B cells. Short vertical bars represent CG sites; black circles represent methylated CG sites; white circles represent unmethylated CG sites; (C) A representative bisulfite sequencing chromatogram of BNC1 CpG island in Hep3B cells. The green lines represent adenine “A”, blue lines represent cytosine “C”, black lines represent guanine “G” and red lines represent thymine “T”; (D) BNC1 expression in three HCC cell lines after treatment with 5-Aza-2′-Deoxycytidine, trichostatin A (TSA) or both. The mock group was normalized as 1.
Ijms 17 00153 g003

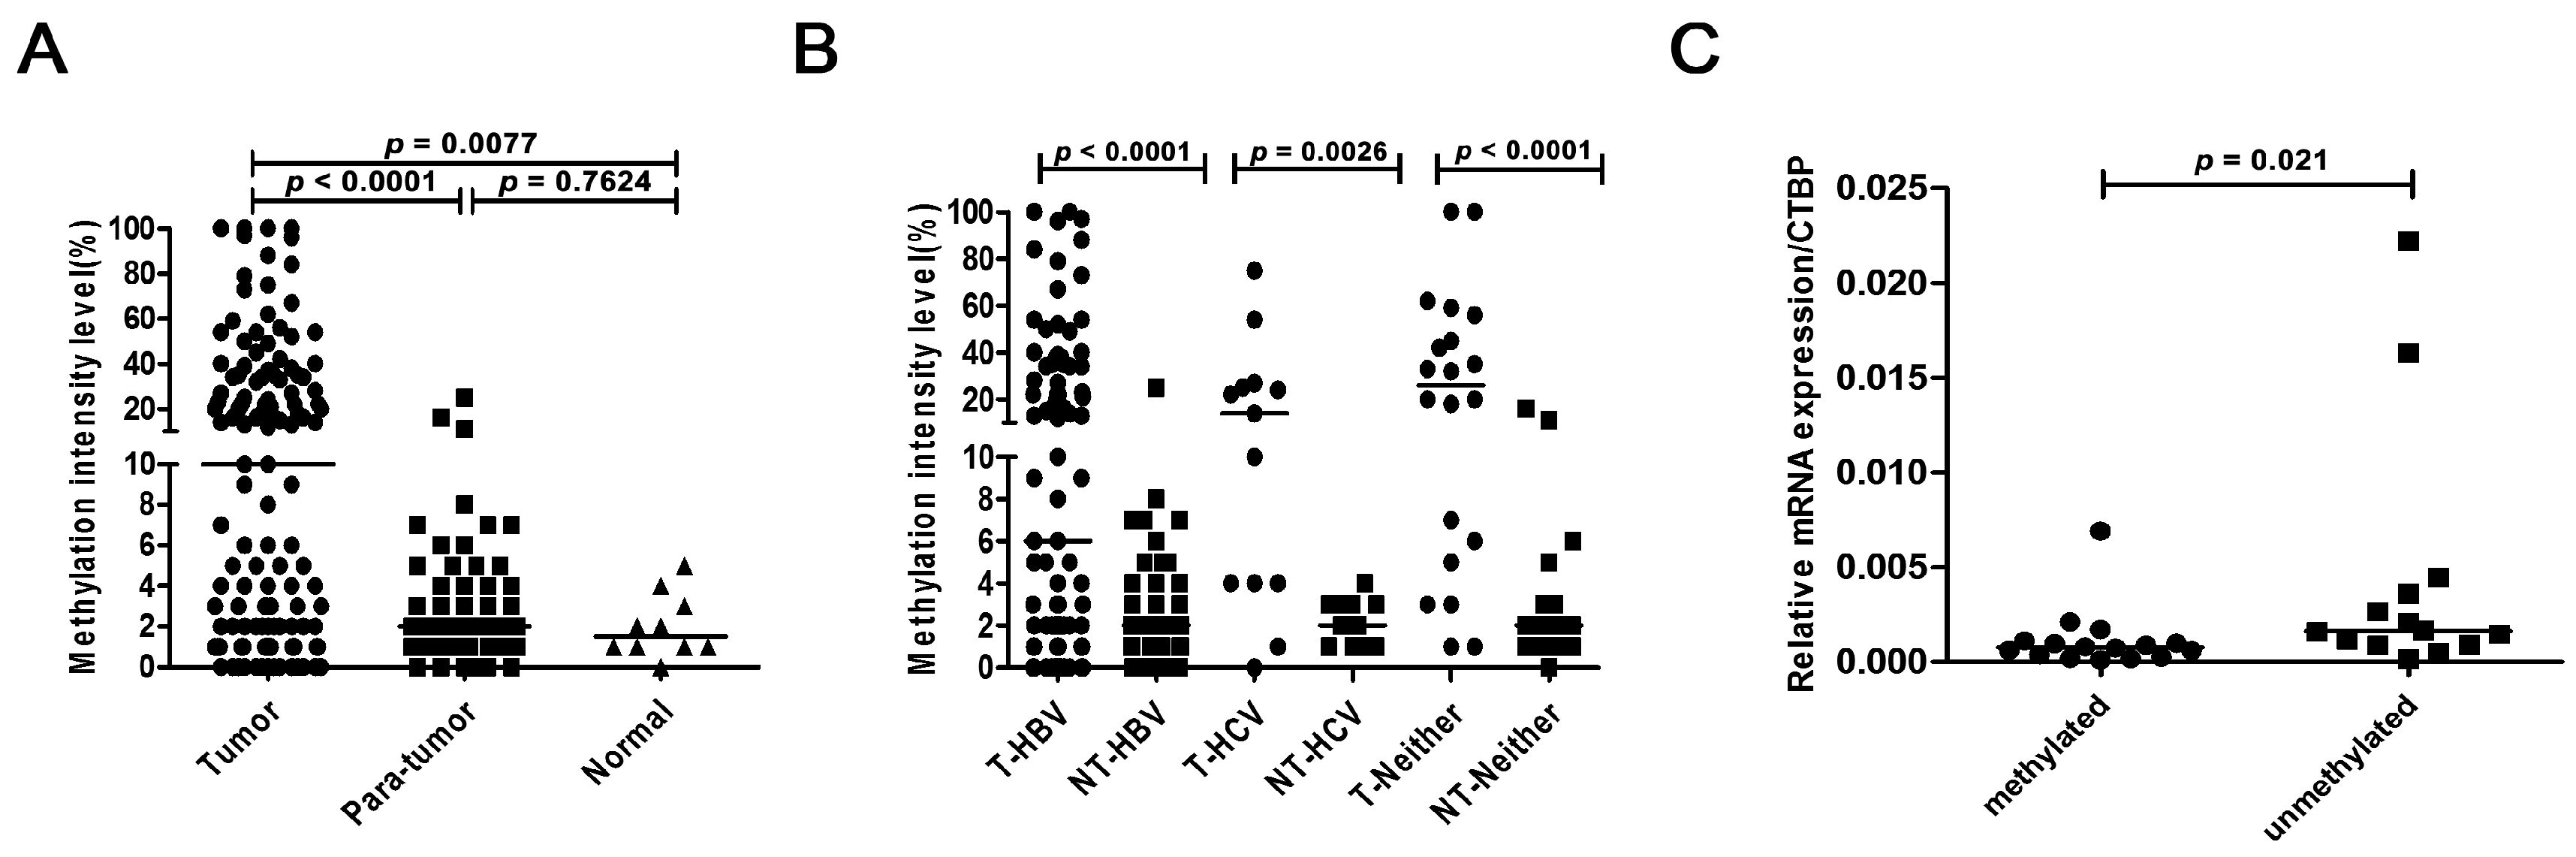
2.4. Methylation Status of BNC1 in Primary HCC Tissues

Because of the higher frequency of the BNC1 methylation detected in HCC cell lines, we then tested the methylation status of BNC1 in tumor and adjacent non-tumor tissues derived from 127 primary HCC patients and 10 normal liver tissues. With threshold value of methylation intensity set at 10%, the high frequency of BNC1 hypermethylation was found in tumor tissues (49.6%, 63/127), but not in the adjacent non-tumor tissues (3/127, 2.36%). No hypermethylation of BNC1 was found in normal liver tissues. Moreover, the hypermethylation intensity in HCC tumor tissues was significantly higher than that in the adjacent non-tumor tissues (p < 0.0001) and normal liver tissues (p = 0.0077) (Figure 4A). Further stratified statistic analysis was conducted to test if the intensity of BNC1 promoter hypermethylation was different in HCC patients with different etiology. It revealed no differences of BNC1 promoter hypermethylation intensity in tumor tissues among patients with chronic hepatitis B virus (HBV) infection, with chronic hepatitis C virus (HCV) infection, and those without evidence of hepatitis viral infection. But the BNC1 promoter hypermethylation intensity in tumor tissues with different infection backgrounds was higher than that in each group of corresponding non-tumor tissues (Figure 4B). In addition, we also detected the methylation status of BNC2 in 16 pairs of tumor and adjacent non-tumor tissues (Figure S1). In line with the results in liver cancer cell lines, no methylation of the BNC2 gene was identified in HCC tumor tissues.
To further demonstrate the correlation between methylation and BNC1 expression, we divided the 30 tumor samples with BNC1 expression tested into two groups according to BNC1 methylation status [18], with the methylated group (methylation intensity ≥ 10%) and the unmethylated group (methylation intensity < 10%). Then we compared the BNC1 expression in the two groups. As shown in Figure 4C, the expression level of the BNC1 gene in the methylated group was significantly lower than that in the unmethylated group (p = 0.021), suggesting that the increase of BNC1 methylation intensity in HCC might contribute to the down-regulation of BNC1 expression.
Figure 4. Methylation status of BNC1 in HCC tissues. (A) The methylation intensity of BNC1 in 127 pairs of HCC tumor tissues and adjacent non-tumor tissues and 10 normal liver tissues; (B) The methylation intensity of BNC1 in paired tumor tissues with different infection background. “T” represents tumor tissue; “NT” represents non-tumor tissue; “−HBV” represents with hepatitis B virus (HBV) infection; “−HCV” represents with hepatitis C virus (HCV) infection; “−Neither” represents without evidence of hepatitis viral infection; (C) The expression level of BNC1 mRNA in methylated HCC tissues (methylation intensity ≥ 10%) and unmethylated tissues (methylation intensity <10%).The horizontal black lines in the picture represent mean values.
Ijms 17 00153 g004

2.5. Correlation between BNC1 Hypermethylation and Clinicopathological Features

To investigate the clinical significance of BNC1 promoter CGI methylation, Chi-square test and Fisher’s exact test were used to analyze the relationship between BNC1 methylation and patients’ clinicopathological variables. The number of patients for the association study ranged from 120 to 127, because of missing clinical data of some patients. The results showed that the hypermethylation of BNC1 did not correlate to patients’ age, tumor size, tumor number, portal vein invasion and Barcelona Clinic Liver Cancer (BCLC) stage. But an increase of BNC1 CGI hypermethylation happened more frequently in female patients in this cohort (p = 0.019) (Table 1). To understand the prognostic significance of aberrantly BNC1 methylation in HCC, we also analyzed the correlation between BNC1 methylation and patients’ overall post-surgery survival period. However, no prognostic significance of BNC1 methylation was found in our current study (data not shown).
Table 1. Basonuclin 1 (BNC1) CpG island (CGI) hypermethylation and clinicopathological correlations in hepatocellularcarcinoma (HCC).
FeatureHypermethylated (n = 63)Unmethylated (n = 64)p-Value
GenderMale37500.019
Female2614
Age (years)≥5045480.649
<501816
AFP (μg/L)≥40031240.180
<4003139
Tumor diameter≥5cm48470.721
<5cm1517
Tumor number150450.240
≥21319
Portal Vein Invasionyes7150.072
no5448
BCLC stageA31350.536
B or C3229
AFP: α Fetal Protein; BCLC: Barcelona Clinic Liver Cancer ; A: early stage; B: intermediate stage; C: advanced stage.

3. Discussion

Basonuclin, a cell-type-specific zinc finger protein, is thought to be a transcription factor which maintains the proliferative capacity of keratinocytes and prevents their terminal differentiation [19]. However, the involvement of Basonuclin in the carcinogenesis of HCC remains unclear. In this study, we analyzed the expression and methylation statuses of two Basonuclin homologs, BNC1 and BNC2 in HCC.
Aberrant BNC1 silence induced by promoter hypermethylation has been reported in several types of human tumors, including pancreatic cancer, renal cell carcinoma, lung cancer, lymphocytic leukemia and the metastatic brain tumors [9,10,11,12,13]. Consistent with these results, we found that BNC1 was hypermethylated in HCC cell lines. Moreover, BNC1 was down-regulated in mRNA level in HCC cells. The down-regulation of BNC1 could be reversed by DNA methyltransferase inhibitor treatment, indicating that promoter methylation is one of the mechanisms for BNC1 inactivation in HCC cell lines. By using a HCC patient cohort, we further demonstrated that BNC1 was remarkably down-regulated in HCC tissues, which was largely contributed by DNA methylation of BNC1. In addition, we noticed that histone deacetylation inhibitor TSA also could increase the BNC1 expression in HCC cell lines, suggesting that other mechanisms including the histone deacetylation modulation may lead to the reduced expression of BNC1 in HCC. Unlike HCC cell lines, SK-Hep-1 cell was of endothelial origin which was derived from the ascitic fluid of a patient with adenocarcinoma of the liver [20]. In this study, we found that SK-Hep-1 had a relatively high level of BNC1 expression. Concordantly, no methylation was found in BNC promoter region in SK-Hep-1 cells. These results further demonstrated that the methylation and expression patterns of BNC1 in tumors appeared to be tissue and context-specific.
HBV or HCV infection is a major risk factor for the development of HCC in China. It has been reported that hepatitis B virus x protein (HBx) played an important role in DNA methylation by up-regulating DNA methyltransferases (DNMT) [21]. In this study, we compared the hypermethyaltion intensity of the BNC1 promoter in HCC tissues with different infection backgrounds. We found that the hypermethylation intensity in tumor tissues was significantly higher than that in non-tumor tissues, whether with or without hepatitis virus infection. Thus, we concluded that the hypermethylation of BNC1 might be a common mechanism in HCC tissues.
We also analyzed the clinical significance of the BNC1 promoter in our current study. Unfortunately, no correlation between BNC1 methylation and patients’ overall post-surgery survival period was found in our cohort. However, we observed a higher rate of BNC1 methylation in female patients. Our previous studies have shown that the hypermethylation of p16INK4a [18] and suppressor of cytokine signaling 1 (SOCS1) [22] were more likely to happen in male gender patients. One possible reason for the different distribution of gene methylation between males and females might be the influence of specific sex hormones. Further studies should be performed in a larger cohort to confirm the potential correlation between BNC1 methylation and the patient’s gender. In addition, previous studies have shown that over-expression of BNC1 in pancreatic cancer cell lines could inhibit colony formation and cell proliferation, suggesting that BNC1 might function as a tumor suppressor gene and its down-regulation in pancreatic cancer might contribute to tumor development and progression. Since BNC1 was silenced by hypermethylation in HCC, functional assays should be performed in vitro and in vivo to investigate whether BNC1 also exhibits anti-tumor function in the development of HCC in the future.
The BNC2 gene is located on human chromosome 9. Although the amino acid sequence of BNC2 differs extensively from that of BNC1, the two proteins share some essential features. BNC2 was found in virtually every cell type and the extreme conservation of the BNC2 amino acid sequence across vertebrates suggested that BNC2 might play an important role, presumably as a regulatory protein of DNA transcription [6]. However, little is known about the roles of BNC2 in tumorigenesis. In this study, we found that the expression of BNC2 was also down-regulated in HCC cell lines and HCC tissues. Unlike BNC1, the promoter region of BNC2 was seldom hypermethylated in both liver cancer cell lines and HCC tissues. But the BNC2 gene was frequently deleted in HCC tissues, indicating that chromosomal loss of the BNC2 gene might be one important reason for its low mRNA expression in HCC.
In summary, this study has shown for the first time that both BNC1 and BNC2 are down-regulated in HCC tissues and HCC cell lines through epigenetic silencing or gene deletion. The identification of the epigenetic inactivation of BNC1 gene may provide insight into HCC tumorigenesis and provide a basis for developing novel biomarkers for HCC prognosis and therapy.

4. Materials and Methods

4.1. Tissue Samples and HCC Cell Lines

With the ethics committee approval (1 January 2013, IRB00001052-12088) and patients’ informed consent, 127 pairs of primary HCC tissues and the adjacent non-tumor tissues from Henan Oncology Hospital (Zhengzhou, China) (from 2010 to 2012) were enrolled in our study. All the patients were diagnosed with HCC and confirmed by liver biopsy. The clinicopathological characteristics of the HCC patients are shown in Table 2. Normal liver tissues (n = 10) were obtained from liver donors in the same hospital.
Human liver cancer cell lines (HepG2, Huh-7, SK-Hep-1, Hep3B and SNU-449) were purchased from ATCC (Manassas, VA, USA) and Cell Resources Center of Peking Union Medical College (Beijing, China) (SMMC7721). HepG2, Huh-7, SK-Hep-1 and Hep3B were cultured in DMEM (Gibco, Carlsbad, CA, USA); SNU-449 and SMMC7721 were maintained in RPMI 1640 (Gibco).

4.2. Gene Expression Analysis

Real-Time RT-qPCR was performed to measure the expression level of BNC1 and BNC2 gene using a Roche light cycle 480 sequence detection system (Roche, Mannheim, Germany). Primers used for detection of BNC1 expression were forward primer: 5′-GGCCGAGGCTATCAGCTGTACT-3′ and reverse primer: 5′-GCCTGGGTCCCATAGAGCAT-3′. Primers used for detection of BNC2 expression were forward primer: 5′-TGACAACCAGCATGCCGAGA-3′ and reverse primer: 5′-ATCAACCCCACAACATGGGA-3′. C-terminal binding protein 1 (CTBP1) was included as a house keeping gene control to normalize expression levels. Primers used for detection of CTBP1 expression were forward primer: 5′-TTCACCGTCAAGCAGATGAGAC-3′ and reverse primer: 5′-CTGGCTAAAGCTGAAGGGTTCC-3′. Each experiment was done in duplicate and the expression levels of BNC1 and BNC2 were determined by the comparative Ct method (2−ΔCt) after normalization to the CTBP1 [18].
Table 2. Clinicopathological parameters of 127 patients with HCC.
Clinicopathological Parameters VariablesCases n (%) n = 127
AgeMedian (Range)57 (11–80)
GenderMale87 (68.50)
Female40 (31.50)
Liver cirrhosisYes115 (90.55)
No10 (7.87)
N/A2 (1.58)
Portal vein tumor thrombosisPresent22 (17.32)
Absent102 (80.32)
N/A3 (2.36)
Tumor size≥5 cm96 (75.59)
<5 cm31 (24.41)
Infection backgroundHBV94 (70.02)
HCV13 (10.24)
Without HBV or HCV20 (15.75)
Tumor encapsulationComplete104 (81.89)
Uncomplete16 (12.60)
BCLC stageN/A7 (5.51)
A66(51.97)
B17(13.39)
C44(34.64)
D0
N/A: Not available; HBV: hepatitis B virus; HCV: hepatitis C virus; BCLC: Barcelona Clinic Liver Cancer; A: early stage; B: intermediate stage; C: advanced stage; D: terminal stage.

4.3. High-Density Oligonucleotide aCGH Analysis

Chromosome aberration was comprehensively analyzed by using the Aiglent Human Genome 244K CGH microarray (Shanghai Bio corporation, Shanghai, China) in 25 pairs of HCC tissues and adjacent non-tumor tissues [17].

4.4. CpG Island (CGI) Methylation Assay

The quantificational methylated DNA analysis was performed by methylation-sensitive restriction enzymes-based quantitative PCR (MSRE-qPCR) as described previously [18].The CGI region of BNC1 gene starts from −462 and ends at +1488 nt predicted using online program CpG Island Searcher. The chosen target region for quantificational methylation analysis of BNC1 CGI region covered 75 bp in the CGI region which contains 4 HhaI cutting sites (from +166 to +241 of transcriptionstart site) (Figure S2A). The primer sequences of BNC1were as follows: forward: 5′-AGCGGTCGCAGGATGGCCGAGGT-3′, reverse: 5′-CCGCCTGCTCCGCGCACAGAGAATC-3′. The CGI region of BNC2 gene starts from −1234 and ends at +663 nt. The chosen target region for quantificational methylation analysis of BNC2 CGI region covered 114 bp which also contains 4 HhaI cutting sites (from −96 to +18 of transcriptionstart site) (Figure S2B). The primer sequences of BNC2 were as follows: forward: 5′-GCGACCCCGGCGCGAGTGTAAATCA-3′, reverse: 5′-CGAGTTCCTCCGGGCCTCCGCTCTC-3′. In accordance to our previous reports, 10% was used as a cut-off value to differentiate hypermethylation and unmethylation [18].

4.5. Bisulfite Sequencing

Genomic DNA extracted from hepatocellular cell lines was treated with sodium bisulfite as reported previously [18,23]. 2 μg DNA was dissolved into 50 μL distilled water and 2 M NaOH was added at 37 °C for 10 min. To this, 10 mM hydroquinone and 3 M sodium bisulfite was added and incubated at 50 °C for 16 h. Then the DNA was purified with the Wizard DNA Clean-Up System (Promega, Madison, WI, USA). Next, the DNA was precipitated with ammoniumacetate and ethanol, washed with 70% ethanol, the pellet was dried, and then resuspended in 20 μL of distilled water. The bisulfite-modified DNA was amplified by PCR using the BNC1 forward primer: 5′-GGTCGTAGGATGGTCGAGGTAAG-3′ and reverse primer: 5′-AACTAACCCTCGAAAAATAACCCTC-3′. Then the PCR product was purified and sequenced. The sequences were analyzed using BIOEDIT.

4.6. 5-Aza-2′-deoxycytidine Treatment in HCC Cell Lines

Human HCC cell lines SNU449, SMMC7721 and Hep3B were seeded in 6-well plates at a concentration of 2 × 10⁵ to 2.5 × 10⁵ cells per well. After 24 h, the medium was changed and cells were treated with 2 μM of 5-Aza-2′-deoxycytidine for 3 days and/or 500 nM of trichostatin A for the last 24 h. Then cells were collected for RNA extraction.

4.7. Statistical Analyses

Student’s t-test was used to compare the difference between two groups. Chi-square test or Fisher’s exact test was used to analyze the relationship between BNC1 CGI methylation status and the patients’ clinicopathological features. Log-rank test was used for prognostic significance analysis. All statistical analyses were performed using the Statistical Analysis System SPSS Statistics 17.0 (SPSS, Inc., Chicago, IL, USA). In all cases, p < 0.05 indicated that the difference was statistically significant.

5. Conclusions

Our study indicated that both BNC1 and BNC2 were down-regulated in HCC. The identification of the epigenetically inactivated BNC1 gene may provide insight into HCC tumorigenesis and provide a basis for developing novel biomarkers for prognosis and therapy.

Supplementary Materials

Supplementary materials can be found at https://0-www-mdpi-com.brum.beds.ac.uk/1422-0067/17/2/153/s1.

Acknowledgments

This work was supported by the National Science and Technology Major Project for Infectious Diseases (Grant nos. 2012ZX10004-904, 2012ZX10002-007), the Natural Science Foundation of China (No. 81372679), and the 111 project of Ministry of Education of China (B07001).

Author Contributions

Xiangmei Chen and Xiaolei Zhang conceived and designed the experiments; Yali Wu performed the experiments; Yali Wu and Yongzhen Liu analyzed the data; Xiangmei Chen and Fengmin Lu helped to revise the article critically for important intellectual content; Yali Wu wrote the paper. All authors read and approved the manuscript.

Conflicts of Interest

The authors declare no conflict of interest.

Abbreviations

BNC1: Basonuclin1, BNC2: Basonuclin2, HCC: Hepatocellular carcinoma MSRE-qPCR: Methylation-sensitive restriction enzymes-based quantitative PCR, CGI: CpG island, TSA: trichostatin A.

References

  1. Torre, L.A.; Bray, F.; Siegel, R.L.; Ferlay, J.; Lortet-Tieulent, J.; Jemal, A. Global cancer statistics, 2012. CA Cancer J. Clin. 2015, 65, 87–108. [Google Scholar] [CrossRef] [PubMed]
  2. Liu, M.; Jiang, L.; Guan, X.Y. The genetic and epigenetic alterations in human hepatocellular carcinoma: A recent update. Protein Cell 2014, 5, 673–691. [Google Scholar] [CrossRef] [PubMed] [Green Version]
  3. Momparler, R.L. Cancer epigenetics. Oncogene 2003, 22, 6479–6483. [Google Scholar] [CrossRef] [PubMed]
  4. Tseng, H.; Green, H. Basonuclin: A keratinocyte protein with multiple paired zinc fingers. Proc. Natl. Acad. Sci. USA 1992, 89, 10311–10315. [Google Scholar] [CrossRef] [PubMed]
  5. Romano, R.A.; Li, H.; Tummala, R.; Maul, R.; Sinha, S. Identification of Basonuclin2, a DNA-binding zinc-finger protein expressed in germ tissues and skin keratinocytes. Genomics 2004, 83, 821–833. [Google Scholar] [CrossRef] [PubMed]
  6. Vanhoutteghem, A.; Djian, P. Basonuclin 2: An extremely conserved homolog of the zinc finger protein basonuclin. Proc. Natl. Acad. Sci. USA 2004, 101, 3468–3473. [Google Scholar] [CrossRef] [PubMed]
  7. Boldrup, L.; Coates, P.J.; Laurell, G.; Nylander, K. P63 Transcriptionally regulates BNC1, a Pol I and Pol II transcription factor that regulates ribosomal biogenesis and epithelial differentiation. Eur. J. Cancer 2012, 48, 1401–1406. [Google Scholar] [CrossRef] [PubMed]
  8. Vanhoutteghem, A.; Djian, P. Basonuclins 1 and 2, whose genes share a common origin, are proteins with widely different properties and functions. Proc. Natl. Acad. Sci. USA 2006, 103, 12423–12428. [Google Scholar] [CrossRef] [PubMed]
  9. Yi, J.M.; Guzzetta, A.A.; Bailey, V.J.; Downing, S.R.; van Neste, L.; Chiappinelli, K.B.; Keeley, B.P.; Stark, A.; Herrera, A.; Wolfgang, C.; et al. Novel methylation biomarker panel for the early detection of pancreatic cancer. Clin. Cancer Res. 2013, 19, 6544–6555. [Google Scholar] [CrossRef] [PubMed]
  10. Morris, M.R.; Ricketts, C.; Gentle, D.; Abdulrahman, M.; Clarke, N.; Brown, M.; Kishida, T.; Yao, M.; Latif, F.; Maher, E.R. Identification of candidate tumour suppressor genes frequently methylated in renal cell carcinoma. Oncogene 2010, 29, 2104–2117. [Google Scholar] [CrossRef] [PubMed]
  11. Shames, D.S.; Girard, L.; Gao, B.; Sato, M.; Lewis, C.M.; Shivapurkar, N.; Jiang, A.; Perou, C.M.; Kim, Y.H.; Pollack, J.R.; et al. A genome-wide screen for promoter methylation in lung cancer identifies novel methylation markers for multiple malignancies. PLoS Med. 2006, 3, e486. [Google Scholar] [CrossRef] [PubMed] [Green Version]
  12. Tong, W.G.; Wierda, W.G.; Lin, E.; Kuang, S.Q.; Bekele, B.N.; Estrov, Z.; Wei, Y.; Yang, H.; Keating, M.J.; Garcia-Manero, G. Genome-wide DNA methylation profiling of chronic lymphocytic leukemia allows identification of epigenetically repressed molecular pathways with clinical impact. Epigenetics 2010, 5, 499–508. [Google Scholar] [CrossRef] [PubMed]
  13. Pangeni, R.P.; Channathodiyil, P.; Huen, D.S.; Eagles, L.W.; Johal, B.K.; Pasha, D.; Hadjistephanou, N.; Nevell, O.; Davies, C.L.; Adewumi, A.I.; et al. The GALNT9, BNC1 and CCDC8 genes are frequently epigenetically dysregulated in breast tumours that metastasise to the brain. Clin. Epigenet. 2015, 7. [Google Scholar] [CrossRef] [PubMed]
  14. Guo, L.; Fan, D.; Zhang, F.; Price, J.E.; Lee, J.S.; Marchetti, D.; Fidler, I.J.; Langley, R.R. Selection of brain metastasis-initiating breast cancer cells determined by growth on hard agar. Am. J. Pathol. 2011, 178, 2357–2366. [Google Scholar] [CrossRef] [PubMed]
  15. Jacobs, L.C.; Hamer, M.A.; Gunn, D.A.; Deelen, J.; Lall, J.S.; van Heemst, D.; Uh, H.W.; Hofman, A.; Uitterlinden, A.G.; Griffiths, C.E.; et al. A Genome-Wide association study identifies the skin color genes IRF4, MC1R, ASIP, and BNC2 influencing facial pigmented spots. J. Investig. Dermatol. 2015, 135, 1735–1742. [Google Scholar] [CrossRef] [PubMed]
  16. Akagi, T.; Ito, T.; Kato, M.; Jin, Z.; Cheng, Y.; Kan, T.; Yamamoto, G.; Olaru, A.; Kawamata, N.; Boult, J.; et al. Chromosomal abnormalities and novel disease-related regions in progression from Barrett’s esophagus to esophageal adenocarcinoma. Int. J. Cancer. 2009, 125, 2349–2359. [Google Scholar] [CrossRef] [PubMed]
  17. Jiang, S.; Yang, Z.; Li, W.; Li, X.; Wang, Y.; Zhang, J.; Xu, C.; Chen, P.J.; Hou, J.; Mccrae, M.A.; et al. Re-evaluation of the carcinogenic significance of hepatitis B virus integration in hepatocarcinogenesis. PLoS ONE 2012, 7, e40363. [Google Scholar] [CrossRef] [PubMed]
  18. Wang, Y.; Cheng, J.; Xu, C.; Liu, S.; Jiang, S.; Xu, Q.; Chen, X.; Zhuang, H.; Lu, F. Quantitative methylation analysis reveals gender and age differences in p16INK4a hypermethylation in hepatitis B virus-related hepatocellular carcinoma. Liver Int. 2012, 32, 420–428. [Google Scholar] [CrossRef] [PubMed]
  19. Tseng, H.; Green, H. Association of basonuclin with ability of keratinocytes to multiply and with absence of terminal differentiation. J. Cell Biol. 1994, 126, 495–506. [Google Scholar] [CrossRef] [PubMed]
  20. Heffelfinger, S.C.; Hawkins, H.H.; Barrish, J.; Taylor, L.; Darlington, G.J. SK HEP-1: A human cell line of endothelial origin. Vitro Cell Dev. Biol. 1992, 28A, 136–142. [Google Scholar] [CrossRef]
  21. Tarocchi, M.; Polvani, S.; Marroncini, G.; Galli, A. Molecular mechanism of hepatitis B virus-induced hepatocarcinogenesis. World J. Gastroenterol. 2014, 20, 11630–11640. [Google Scholar] [CrossRef] [PubMed]
  22. Zhang, X.; Wang, J.; Cheng, J.; Ding, S.; Li, M.; Sun, S.; Zhang, L.; Liu, S.; Chen, X.; Zhuang, H.; et al. An integrated analysis of SOCS1 down-regulation in HBV infection-related hepatocellular carcinoma. J. Viral Hepat. 2014, 21, 264–271. [Google Scholar] [CrossRef] [PubMed]
  23. Luo, L.; Lu, F.M.; Hart, S.; Foroni, L.; Rabbani, H.; Hammarstrom, L.; Yuille, M.R.; Catovsky, D.; Webster, A.D.; Vorechovsky, I. Ataxia-telangiectasia and T-cell leukemias: No evidence for somatic ATM mutation in sporadic T-ALL or for hypermethylation of the ATM-NPAT/E14 bidirectional promoter in T-PLL. Cancer Res. 1998, 58, 2293–2297. [Google Scholar] [PubMed]

