
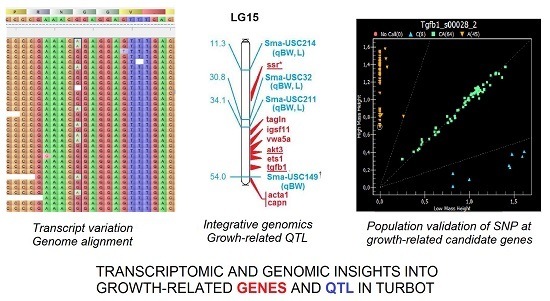
Integrative Transcriptome, Genome and Quantitative Trait Loci Resources Identify Single Nucleotide Polymorphisms in Candidate Genes for Growth Traits in Turbot

Abstract
:
1. Introduction
2. Results and Discussion
2.1. RNA-Seq and SNP Calling
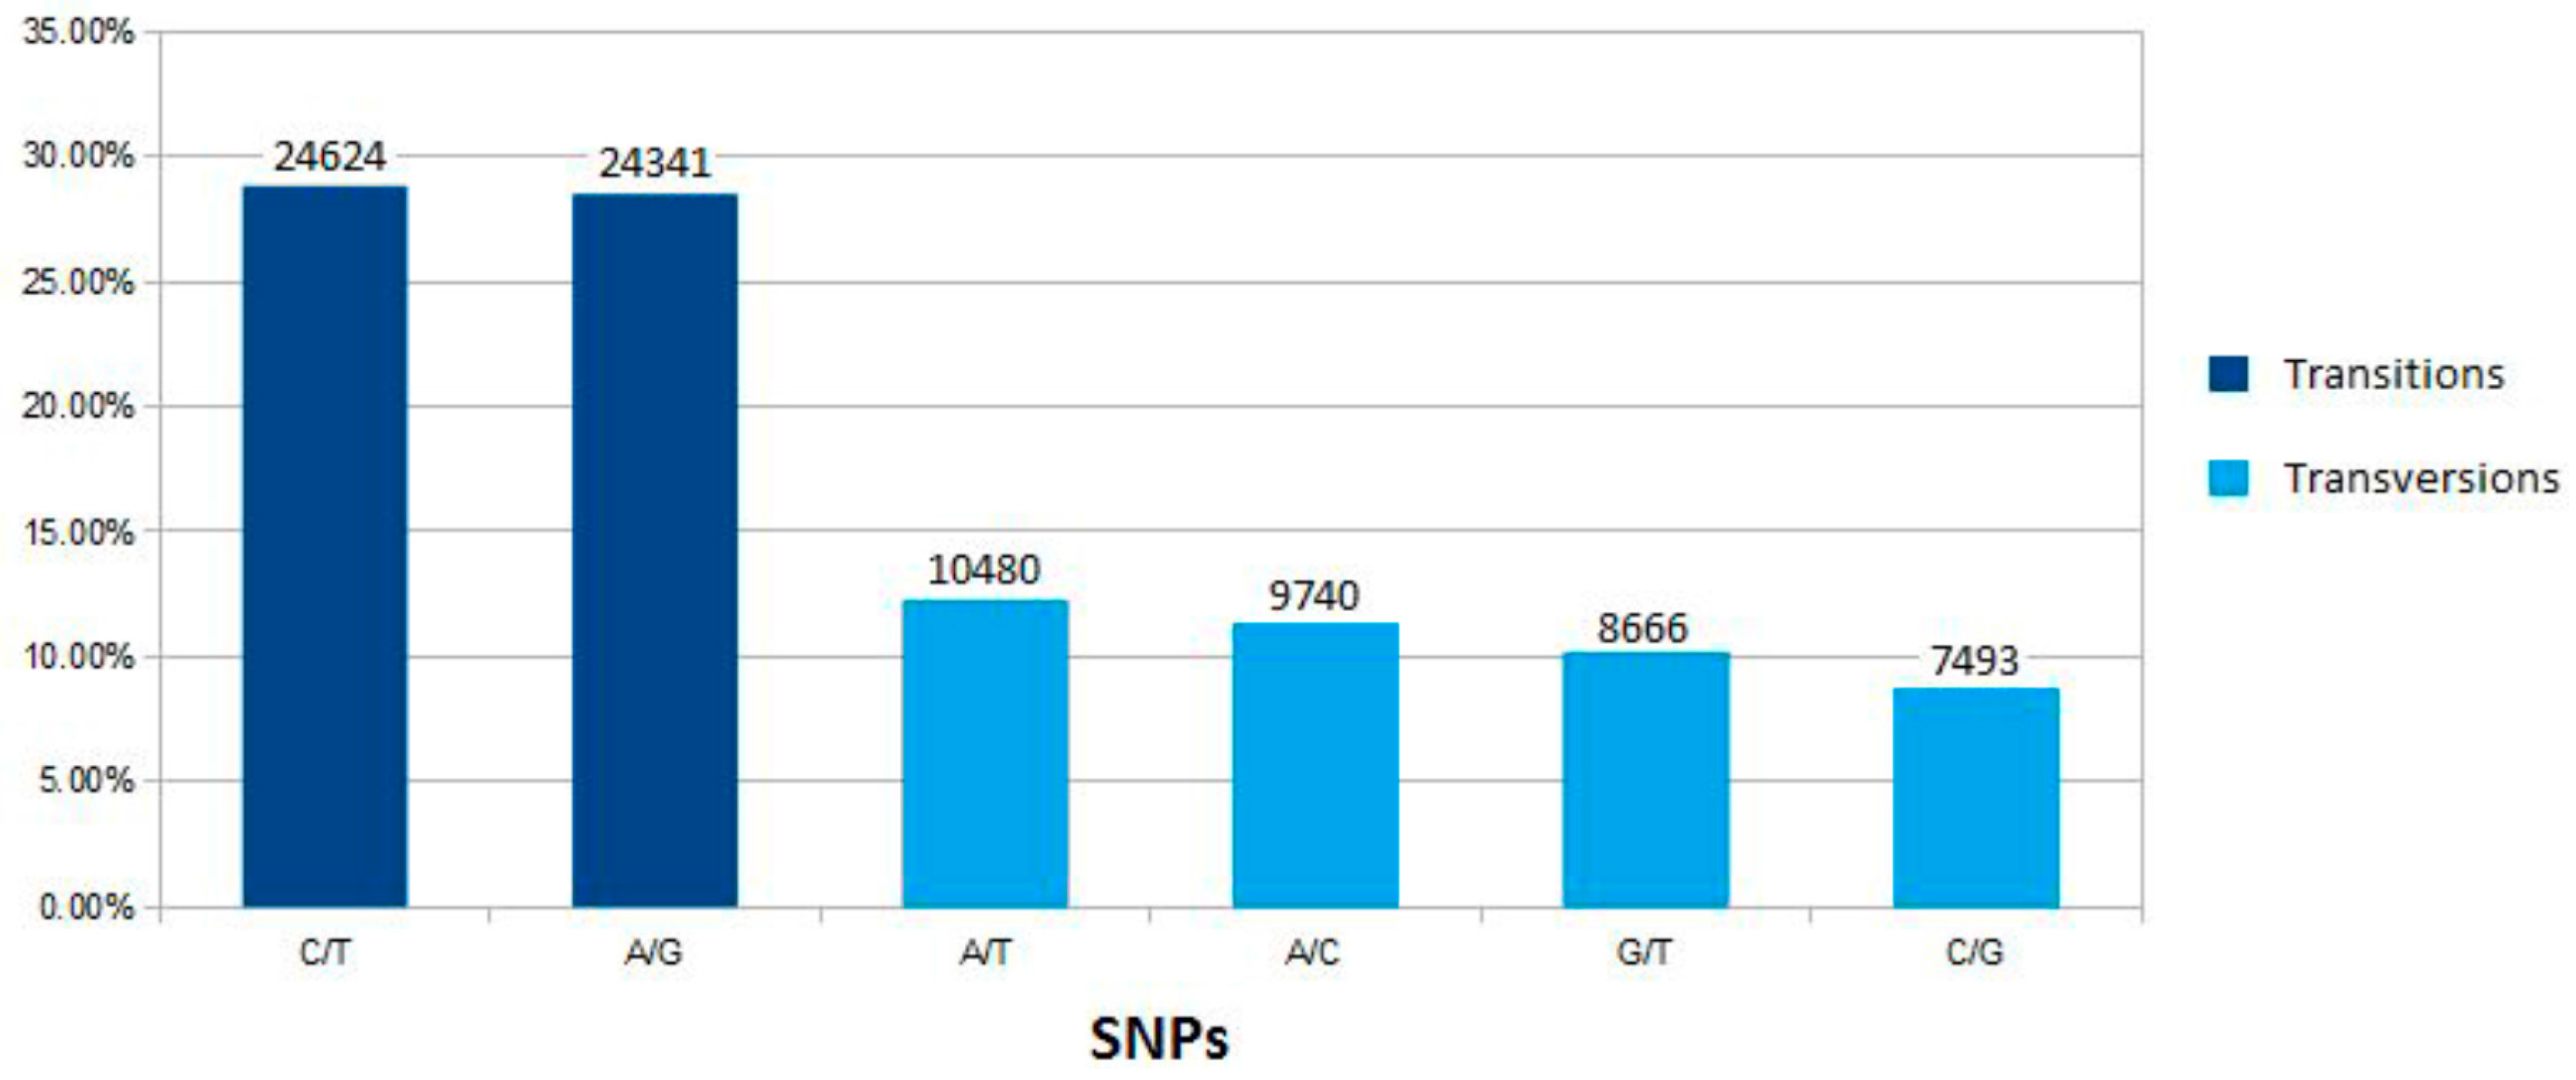
2.2. SNP Variation
2.3. Towards a High Density SNP Array in Turbot
3. Experimental Section
3.1. Sampling for RNA Sequencing
3.2. RNA Sequencing
3.3. Growth-Related Turbot Sequences
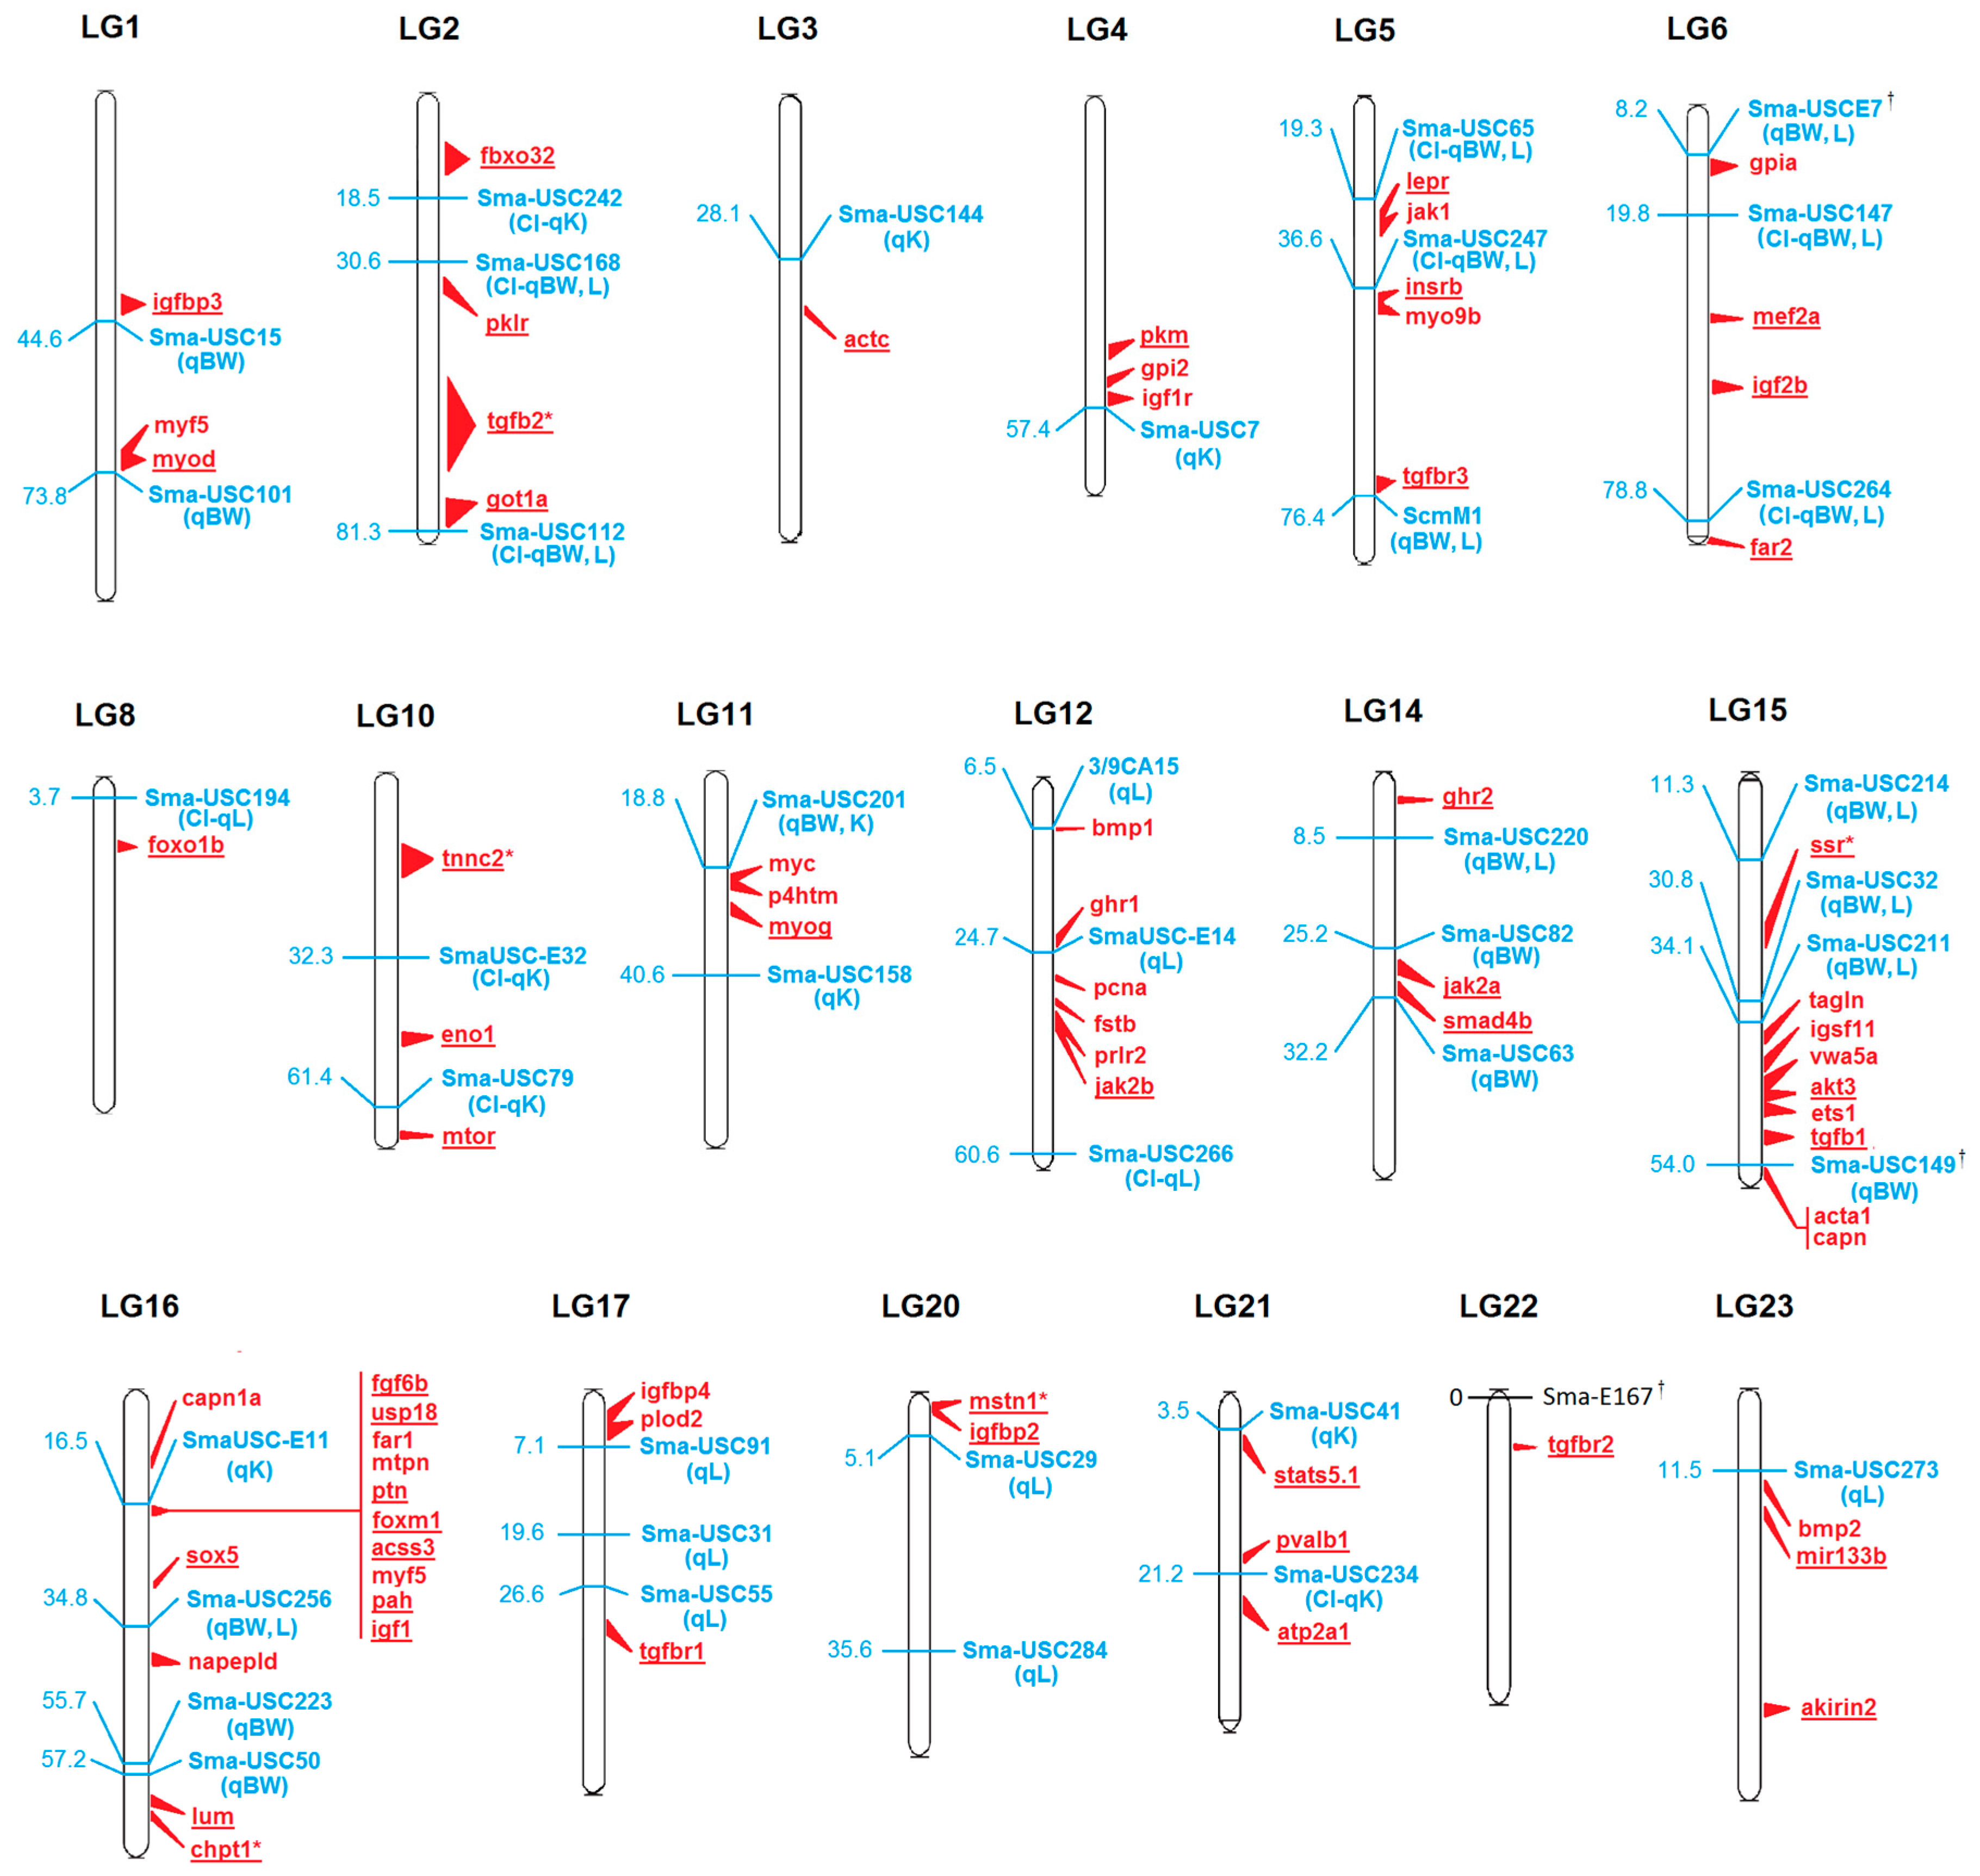
3.4. Co-Localization of Candidate Genes with Growth QTLs
3.5. SNP Calling
3.6. SNP Genotyping and Validation
3.7. Data Accessibility
4. Conclusions
Supplementary Materials
Acknowledgments
Author Contributions
Conflicts of Interest
References
- Havenstein, G.B.; Ferket, P.R.; Qureshi, M.A. Carcass composition and yield of 1957 versus 2001 broilers when fed representative 1957 and 2001 broiler diets. Poult. Sci. 2003, 82, 1509–1518. [Google Scholar] [CrossRef] [PubMed]
- Bonin, A. Population genomics: A new generation of genome scans to bridge the gap with functional genomics. Mol. Ecol. 2008, 17, 3583–3584. [Google Scholar] [CrossRef] [PubMed]
- Nie, Q.; Sun, B.; Zhang, D.; Luo, C.; Ishag, N.A.; Lei, M.; Yang, G.; Zhang, X. High diversity of the chicken growth hormone gene and effects on growth and carcass traits. J. Hered. 2005, 96, 698–703. [Google Scholar] [CrossRef] [PubMed]
- Hale, C.S.; Herring, W.O.; Shibuya, H.; Lucy, M.C.; Lubahn, D.B.; Keisler, D.H.; Johnson, G.S. Decreased growth in Angus steers with a short TG-microsatellite allele in the P1 promoter of the growth hormone receptor gene. J. Anim. Sci. 2000, 78, 2099–2104. [Google Scholar] [PubMed]
- Nielsen, E.E.; Cariani, A.; Mac Aoidh, E.; Maes, G.E.; Milano, I.; Ogden, R.; Taylor, M.; Hemmer-Hansen, J.; Babbucci, M.; Bargelloni, L.; et al. Gene-associated markers provide tools for tackling illegal fishing and false eco-certification. Nat. Commun. 2012, 3. [Google Scholar] [CrossRef] [PubMed]
- Bekkevold, D.; Helyar, S.J.; Limborg, M.T.; Nielsen, E.E.; Hemmer-Hansen, J.; Clausen, L.A.; Carvalho, G.R.; FishPopTrace Consortium. Gene-associated markers can assign origin in a weakly structured fish, Atlantic herring. ICES J. Mar. Sci. 2015, 72. [Google Scholar] [CrossRef]
- Hemmer-Hansen, J.; Nielsen, E.E.G.; Meldrup, D.; Mittelholzer, C. Identification of single nucleotide polymorphisms in candidate genes for growth and reproduction in a nonmodel organism; the Atlantic cod, Gadus morhua. Mol. Ecol. Resour. 2011, 11, 71–80. [Google Scholar] [CrossRef] [PubMed]
- Diopere, E.; Hellemans, B.; Volckaert, F.A.; Maes, G.E. Identification and validation of single nucleotide polymorphisms in growth- and maturation-related candidate genes in sole (Solea solea L.). Mar. Genom. 2013, 9, 33–38. [Google Scholar] [CrossRef] [PubMed]
- Salem, M.; Vallejo, R.L.; Leeds, T.D.; Palti, Y.; Liu, S.; Sabbagh, A.; Rexroad III, C.E.; Yao, J. RNA-Seq identifies SNP markers for growth traits in rainbow trout. PLoS ONE 2012, 7, e36264. [Google Scholar] [CrossRef] [PubMed]
- Schunter, C.; Garza, J.C.; Macpherson, E.; Pascual, M. SNP development from RNA-seq data in a nonmodel fish: How many individuals are needed for accurate allele frequency prediction? Mol. Ecol. Resour. 2014, 14, 157–165. [Google Scholar] [CrossRef] [PubMed]
- He, C.; Chen, L.; Simmons, M.; Li, P.; Kim, S.; Liu, Z.J. Putative SNP discovery in interspecific hybrids of catfish by comparative EST analysis. Anim. Genet. 2003, 34, 445–448. [Google Scholar] [CrossRef] [PubMed]
- Soller, M. Pre-messenger RNA processing and its regulation: A genomic perspective. Cell. Mol. Life Sci. 2006, 63, 796–819. [Google Scholar] [CrossRef] [PubMed]
- Gjedrem, T.; Baranski, M. Selective Breeding in Aquaculture: An Introduction; Springer Netherlands: Dordrecht, The Netherlands, 2010. [Google Scholar]
- Gjedrem, T.; Robinson, N.; Rye, M. The importance of selective breeding in aquaculture to meet future demands for animal protein: A review. Aquaculture 2012, 350–353, 117–129. [Google Scholar] [CrossRef]
- Garcia de la Serrana, D.; Estévez, A.; Andree, K.; Johnston, I.A. Fast skeletal muscle transcriptome of the gilthead sea bream (Sparus aurata) determined by next generation sequencing. BMC Genom. 2012, 13. [Google Scholar] [CrossRef] [PubMed] [Green Version]
- De-Santis, C.; Jerry, D.R. Candidate growth genes in finfish—Where should we be looking? Aquaculture 2007, 272, 22–38. [Google Scholar] [CrossRef]
- Wringe, B.F.; Devlin, R.H.; Ferguson, M.M.; Moghadam, H.K.; Sakhrani, D.; Danzmann, R.G. Growth-related quantitative trait loci in domestic and wild rainbow trout (Oncorhynchus mykiss). BMC Genet. 2010, 11. [Google Scholar] [CrossRef]
- Valente, L.M.P.; Moutou, K.A.; Conceição, L.E.C.; Engrola, S.; Fernandes, J.M.O.; Johnston, I.A. What determines growth potential and juvenile quality of farmed fish species? Rev. Aquac. 2013, 5, S168–S193. [Google Scholar] [CrossRef] [Green Version]
- Yue, G.H. Recent advances of genome mapping and marker-assisted selection in aquaculture. Fish Fish. 2014, 15, 376–396. [Google Scholar] [CrossRef]
- Tsai, H.Y.; Hamilton, A.; Guy, D.R.; Houston, R.D. Single nucleotide polymorphisms in the insulin-like growth factor 1 (IGF1) gene are associated with growth-related traits in farmed Atlantic salmon. Anim. Genet. 2014, 45, 709–715. [Google Scholar] [CrossRef] [PubMed]
- Kocmarek, A.L.; Ferguson, M.M.; Danzmann, R.G. Co-localization of growth QTL with differentially expressed candidate genes in rainbow trout. Genome 2015, 58, 393–403. [Google Scholar] [CrossRef] [PubMed]
- Johnston, I.A.; Bower, N.I.; Macqueen, D.J. Growth and the regulation of myotomal muscle mass in teleost fish. J. Exp. Biol. 2011, 214, 1617–1628. [Google Scholar] [CrossRef] [PubMed]
- Liu, F.; Sun, F.; Xia, J.H.; Li, J.; Fu, G.H.; Lin, G.; Tu, R.J.; Wan, Z.Y.; Quek, D.; Yue, G.H. A genome scan revealed significant associations of growth traits with a major QTL and GHR2 in tilapia. Sci. Rep. 2014, 4. [Google Scholar] [CrossRef] [PubMed]
- FAO: Food and Agriculture Organization of the United Nations. The State of World Fisheries and Aquaculture 2014. Available online: http://www.fao.org/3/a-i3720e.pdf (accessed on 21 May 2015).
- APROMAR. La Acuicultura en España 2014. Available online: http://www.apromar.es/content/informes-anuales (accessed on 21 May 2015).
- Bouza, C.; Hermida, M.; Pardo, B.G.; Vera, M.; Fernández, C.; de la Herrán, R.; Navajas-Pérez, R.; Álvarez-Dios, J.A.; Gómez-Tato, A.; Martínez, P. An expressed sequence tag (EST)-enriched genetic map of turbot (Scophthalmus maximus): A useful framework for comparative genomics across model and farmed teleosts. BMC Genet. 2012, 13. [Google Scholar] [CrossRef] [PubMed]
- Hermida, M.; Bouza, C.; Fernández, C.; Sciara, A.A.; Rodríguez-Ramilo, S.T.; Fernández, J.; Martínez, P. Compilation of mapping resources in turbot (Scophthalmus maximus): A new integrated consensus genetic map. Aquaculture 2013, 414–415, 19–25. [Google Scholar] [CrossRef]
- Figueras, A.; Corvelo, A.; Robledo, D.; Hermida, M.; Pereiro, P.; Gómez, J.; Carreté, L.; Bello, X.; Marcet-Houben, M.; Forn-Cuní, G.; et al. Genome sequencing of the turbot (Scophthalmus maximus; Pleuronectiformes) a flatfish of high aquaculture value. In Proceedings of the ISGA XII-The International Symposium on Genetics in Aquaculture XII, Santiago de Compostela, Spain, June 2015; p. 91.
- Sánchez-Molano, E.; Cerna, A.; Toro, M.A.; Bouza, C.; Hermida, M.; Pardo, B.G.; Cabaleiro, S.; Fernández, J.; Martínez, P. Detection of growth-related QTL in turbot (Scophthalmus maximus). BMC Genom. 2011, 12. [Google Scholar] [CrossRef] [PubMed]
- Rodríguez-Ramilo, S.T.; de la Herrán, R.; Ruiz-Rejón, C.; Hermida, M.; Fernández, C.; Pereiro, P.; Figueras, A.; Bouza, C.; Toro, M.A.; Martínez, P.; et al. Identification of quantitative trait loci associated with resistance to viral haemorrhagic septicaemia (VHS) in turbot (Scopthalmus maximus): A comparison between bacterium, parasite and virus diseases. Mar. Biotechnol. 2014, 16, 265–276. [Google Scholar] [CrossRef] [PubMed]
- Vilas, R.; Bouza, C.; Vera, M.; Millán, A.; Martínez, P. Variation in anonymous and EST-microsatellites suggests adaptive population divergence in turbot. Mar. Ecol. Prog. Ser. 2010, 420, 231–239. [Google Scholar] [CrossRef]
- Vilas, R.; Vandamme, S.G.; Vera, M.; Bouza, C.; Maes, G.E.; Volckaert, F.A.M.; Martínez, P. A genome scan for candidate genes involved in the adaptation of turbot (Scophthalmus maximus). Mar. Genom. 2015, 23, 77–86. [Google Scholar] [CrossRef] [PubMed]
- Cui, J.; Liu, S.; Zhang, B.; Wang, H.; Sun, H.; Song, S.; Qiu, X.; Liu, Y.; Wang, X.; Jiang, Z.; et al. Transcriptome analysis of the gill and swimbladder of Takifugu rubripes by RNA-Seq. PLoS ONE. 2014, 9, e85505. [Google Scholar]
- Du, F.; Xu, G.; Nie, Z.; Xu, P.; Gu, R. Transcriptome analysis gene expression in the liver of Coilia nasus during the stress response. BMC Genom. 2014, 15. [Google Scholar] [CrossRef] [PubMed]
- Brookes, A.J. Single Nucleotide Polymorphism (SNP). In Encyclopedia of Life Sciences; John Wiley & Sons, Ltd.: Chichester, UK, 2007. [Google Scholar]
- Guryev, V.; Koudijs, M.J.; Berezikov, E.; Johnson, S.L.; Plasterk, R.H.A.; van Eeden, F.J.M.; Cuppen, E. Genetic variation in the zebrafish. Genome Res. 2006, 16, 491–497. [Google Scholar] [CrossRef] [PubMed]
- Liu, S.; Zhou, Z.; Lu, J.; Sun, F.; Wang, S.; Liu, H.; Jiang, Y.; Kucuktas, H.; Kaltenboeck, L.; Peatman, E.; et al. Generation of genome-scale gene-associated SNPs in catfish for the construction of a high-density SNP array. BMC Genom. 2011, 12. [Google Scholar] [CrossRef] [PubMed]
- Vera Rodríguez, M.; Álvarez-Dios, J.A.; Fernández, C.; Bouza da Costa, C.; Vilas, R.; Martínez, P. Development and validation of Single Nucleotide Polymorphisms (SNPs) markers from two transcriptome 454-runs of turbot (Scophthalmus maximus) using high-throughput genotyping. Int. J. Mol. Sci. 2013, 14, 5694–5711. [Google Scholar] [CrossRef] [PubMed]
- Zhu, C.; Cheng, L.; Tong, J.; Yu, X. Development and characterization of new single nucleotide polymorphism markers from expressed sequence tags in common carp (Cyprinus carpio). Int. J. Mol. Sci. 2012, 13, 7343–7353. [Google Scholar] [CrossRef] [PubMed]
- Cenadelli, S.; Maran, V.; Bongioni, G.; Fusetti, L.; Parma, P.; Aleandri, R. Identification of nuclear SNPs in gilthead seabream. J. Fish Biol. 2007, 70, 399–405. [Google Scholar] [CrossRef]
- Smith, C.T.; Elfstrom, C.M.; Seeb, L.W.; Seeb, J.E. Use of sequence data from rainbow trout and Atlantic salmon for SNP detection in Pacific salmon. Mol. Ecol. 2005, 14, 4193–4203. [Google Scholar] [CrossRef]
- DePristo, M.A.; Banks, E.; Poplin, R.; Garimella, K.V.; Maguire, J.R.; Hartl, C.; Philippakis, A.A.; del Angel, G.; Rivas, M.A.; Hanna, M.; et al. A framework for variation discovery and genotyping using next-generation DNA sequencing data. Nat. Genet. 2011, 43, 491–498. [Google Scholar] [CrossRef] [PubMed]
- Lam, H.Y.; Pan, C.; Clark, M.J.; Lacroute, P.; Chen, R.; Haraksingh, R.; O’Huallachain, M.; Gerstein, M.B.; Kidd, J.M.; Bustamante, C.D.; et al. Detecting and annotating genetic variations using the HugeSeq pipeline. Nat. Biotechnol. 2012, 30, 226–229. [Google Scholar] [CrossRef] [PubMed]
- Dong, H.; Zeng, L.; Duan, D.; Zhang, H.; Wang, Y.; Li, W.; Lin, H. Growth hormone and two forms of insulin-like growth factors I in the giant grouper (Epinephelus lanceolatus): Molecular cloning and characterization of tissue distribution. Fish Physiol. Biochem. 2010, 36, 201–212. [Google Scholar] [CrossRef] [PubMed]
- MacDonald, E.; Volkoff, H. Neuropeptide Y (NPY), cocaine- and amphetamine-regulated transcript (CART) and cholecystokinin (CCK) in winter skate (Raja ocellata): cDNA cloning, tissue distribution and mRNA expression responses to fasting. Gen. Comp. Endocrinol. 2009, 161, 252–261. [Google Scholar] [CrossRef] [PubMed]
- Lee, K.M.; Kaneko, T.; Aida, K. Prolactin and prolactin receptor expressions in a marine teleost, pufferfish Takifugu rubripes. Gen. Comp. Endocrinol. 2006, 146, 318–328. [Google Scholar] [CrossRef] [PubMed]
- Bouza, C.; Hermida, M.; Pardo, B.G.; Fernández, C.; Fortes, G.G.; Castro, J.; Sánchez, L.; Presa, P.; Pérez, M.; Sanjuán, A.; et al. A microsatellite genetic map of the turbot (Scophthalmus maximus). Genetics 2007, 177, 2457–2467. [Google Scholar] [CrossRef] [PubMed]
- Muñoz, G.; Ovilo, C.; Silió, L.; Tomás, A.; Noguera, J.L.; Rodríguez, M.C. Single- and joint-population analyses of two experimental pig crosses to confirm quantitative trait loci on Sus scrofa chromosome 6 and leptin receptor effects on fatness and growth traits. J. Anim. Sci. 2009, 87, 459–468. [Google Scholar] [CrossRef] [PubMed]
- Rimbault, M.; Beale, H.C.; Schoenebeck, J.J.; Hoopes, B.C.; Allen, J.J.; Kilroy-Glynn, P.; Wayne, R.K.; Sutter, N.B.; Ostranderm, E.A. Derived variants at six genes explain nearly half of size reduction in dog breeds. Genome Res. 2013, 23, 1985–1995. [Google Scholar] [CrossRef]
- Feng, X.; Xu, X.; Tong, J. Novel single nucleotide polymorphisms of the insulin-like growth factor-I gene and their associations with growth traits in common carp (Cyprinus carpio L.). Int. J. Mol. Sci. 2014, 15, 22471–22482. [Google Scholar] [CrossRef] [PubMed]
- Te Pas, M.F.; Soumillion, A.; Harders, F.L.; Verburg, F.J.; van den Bosch, T.J.; Galesloot, P.; Meuwissen, T.H. Influences of myogenin genotypes on birth weight, growth rate, carcass weight, backfat thickness, and lean weight of pigs. J. Anim. Sci. 1999, 77, 2352–2356. [Google Scholar] [PubMed]
- Genxi, Z.; Ying, T.; Tao, Z.; Jinyu, W.; Yongjuan, W. Expression profiles and association analysis with growth traits of the MyoG and Myf5 genes in the Jinghai yellow chicken. Mol. Biol. Rep. 2014, 41, 7331–7338. [Google Scholar] [CrossRef] [PubMed]
- Froehlich, J.M.; Galt, N.J.; Charging, M.J.; Meyer, B.M.; Biga, P.R. In vitro indeterminate teleost myogenesis appears to be dependent on Pax3. In Vitro Cell. Dev. Biol. Anim. 2013, 49, 371–385. [Google Scholar] [CrossRef] [PubMed]
- Massagué, J. How cells read TGF-beta signals. Nat. Rev. Mol. Cell Biol. 2000, 1, 169–178. [Google Scholar] [CrossRef] [PubMed]
- Ten Dijke, P.; Goumans, M.J.; Itoh, F.; Itoh, S. Regulation of cell proliferation by Smad proteins. J. Cell. Physiol. 2002, 191, 1–16. [Google Scholar] [CrossRef]
- Li, H.; Deeb, N.; Zhou, H.; Mitchell, A.D.; Ashwell, C.M.; Lamont, S.J. Chicken quantitative trait loci for growth and body composition associated with transforming growth factor-β genes. Poult. Sci. 2003, 82, 347–356. [Google Scholar] [CrossRef] [PubMed]
- Chen, K.; Hawken, R.; Flickinger, G.H.; Rodriguez-Zas, S.L.; Rund, L.A.; Wheeler, M.B.; Abrahamsen, M.; Rutherford, M.S.; Beever, J.E.; Schook, L.B. Association of the porcine transforming growth factor beta type I receptor (TGFBR1) gene with growth and carcass traits. Anim. Biotechnol. 2012, 23, 43–63. [Google Scholar] [CrossRef] [PubMed]
- Kambadur, R.; Sharma, M.; Smith, T.P.L.; Bass, J.J. Mutations in myostatin (GDF8) in double-muscled Belgian Blue and Piedmontese cattle. Genome Res. 1997, 7, 910–916. [Google Scholar] [PubMed]
- McPherron, A.C.; Lee, S.J. Double muscling in cattle due to mutations in the myostatin gene. Proc. Natl. Acad. Sci. USA 1997, 94, 12457–12461. [Google Scholar] [CrossRef]
- Liu, L.; Yu, X.; Tong, J. Molecular characterization of myostatin (MSTN) gene and association analysis with growth traits in the bighead carp (Aristichthys nobilis). Mol. Biol. Rep. 2012, 39, 9211–9221. [Google Scholar] [CrossRef] [PubMed]
- Peñazola, C.; Hamilton, A.; Guy, D.R.; Bishop, S.C.; Houston, R.D. A SNP in the 5′ flanking region of the myostatin-1b gene is associated with harvest traits in Atlantic salmon (Salmo salar). BMC Genet. 2013, 14. [Google Scholar] [CrossRef]
- Xu, Y.X.; Zhu, Z.Y.; Lo, L.C.; Wang, C.M.; Lin, G.; Feng, F.; Yue, G.H. Characterization of two parvalbumin genes and their association with growth traits in Asian seabass (Lates calcarifer). Anim. Genet. 2006, 37, 266–268. [Google Scholar] [CrossRef]
- Huang, N.; Cogburn, L.A.; Agarwal, S.K.; Marks, H.L.; Burnside, J. Overexpression of a truncated growth hormone receptor in the sex-linked dwarf chicken: Evidence for a splice mutation. Mol. Endocrinol. 1993, 7, 1391–1398. [Google Scholar] [PubMed]
- Wong, J.J.; Ritchie, W.; Ebner, O.A.; Selbach, M.; Wong, J.W.H.; Huang, Y.; Gao, D.; Pinello, N.; Gonzalez, M.; Baidya, K.; et al. Orchestrated intron retention regulates normal granulocyte differentiation. Cell 2013, 154, 583–595. [Google Scholar] [CrossRef] [PubMed]
- Barrett, L.W.; Fletcher, S.; Wilton, S.D. Regulation of eukaryotic gene expression by the untranslated gene regions and other non-coding elements. Cell. Mol. Life Sci. 2012, 69, 3613–3634. [Google Scholar] [CrossRef]
- Ying, S.Y.; Lin, S.L. Current perspectives in intronic micro RNAs (miRNAs). J. Biomed. Sci. 2006, 13, 5–15. [Google Scholar] [CrossRef] [PubMed]
- Tao, W.J.; Boulding, E.G. Associations between single nucleotide polymorphisms in candidate genes and growth rate in Arctic charr (Salvelinus alpinus L.). Heredity 2003, 91, 60–69. [Google Scholar] [CrossRef]
- Vera, M.; Álvarez-Dios, J.A.; Millán, A.; Pardo, B.G.; Bouza, C.; Hermida, M.; Fernández, C.; de la Herrán, R.; Molina-Luzón, M.J.; Martínez, P. Validation of single nucleotide polymorphism (SNP) markers from an immune Expressed Sequence Tag (EST) turbot, Scophthalmus maximus, database. Aquaculture 2011, 313, 31–41. [Google Scholar] [CrossRef]
- Campbell, N.R.; Amish, S.J.; Pritchard, V.L.; McKelvey, K.S.; Young, M.K.; Schwartz, M.K.; Garza, J.C.; Luikart, G.; Narum, S.R. Development and evaluation of 200 novel SNP assays for population genetic studies of westslope cutthroat trout and genetic identification of related taxa. Mol. Ecol. Resour. 2012, 12, 942–949. [Google Scholar] [CrossRef] [PubMed]
- Robledo, D.; Ronza, P.; Harrison, P.W.; Losada, A.P.; Bermúdez, R.; Pardo, B.G.; Redondo, M.J.; Sitjà-Bobadilla, A.; Quiroga, M.I.; Martínez, P. RNA-seq analysis reveals significant transcriptome changes in turbot (Scophthalmus maximus) suffering severe enteromyxosis. BMC Genom. 2014, 15. [Google Scholar] [CrossRef]
- Geng, X.; Sha, J.; Liu, S.; Bao, L.; Zhang, J.; Wang, R.; Yao, J.; Li, C.; Feng, J.; Sun, F.; et al. A genome-wide association study in catfish reveals the presence of functional hubs of related genes within QTLs for columnaris disease resistance. BMC Genom. 2015, 16. [Google Scholar] [CrossRef] [PubMed]
- Barson, N.J.; Aykanat, T.; Hindar, K.; Baranski, M.; Bolstad, G.H.; Fiske, P.; Jacq, C.; Jensen, A.J.; Johnston, S.E.; Karlsson, S.; et al. Sex-dependent dominance at a single locus maintains variation in age at maturity in salmon. Nature 2015, 528, 405–408. [Google Scholar] [CrossRef] [PubMed]
- Tsai, H.Y.; Hamilton, A.; Guy, D.R.; Tinch, A.E.; Bishop, S.C.; Houston, R.D. Verification of SNPs associated with growth traits in 2 populations of farmed Atlantic salmon. Int. J. Mol. Sci. 2015, 17. [Google Scholar] [CrossRef] [PubMed]
- Lapègue, S.; Harrang, E.; Heurtebise, S.; Flahauw, E.; Donnadieu, C.; Gayral, P.; Ballenghien, M.; Genestout, L.; Barbotte, L.; Mahla, R.; et al. Development of SNP-genotyping arrays in two shellfish species. Mol. Ecol. Resour. 2014, 14, 820–830. [Google Scholar] [CrossRef]
- Houston, R.D.; Taggart, J.B.; Cézard, T.; Bekaert, M.; Lowe, N.R.; Downing, A.; Talbot, R.; Bishop, S.C.; Archibald, A.L.; Bron, J.E.; et al. Development and validation of a high density SNP genotyping array for Atlantic salmon (Salmo salar). BMC Genom. 2014, 15. [Google Scholar] [CrossRef] [PubMed]
- Liu, S.; Sun, L.; Li, Y.; Sun, F.; Jiang, Y.; Zhang, Y.; Zhang, J.; Feng, J.; Kaltenboeck, L.; Kucuktas, H.; et al. Development of the catfish 250K SNP array for genome-wide association studies. BMC Res. Notes 2014, 7. [Google Scholar] [CrossRef]
- Xu, J.; Zhao, Z.; Zhang, X.; Zheng, X.; Li, J.; Jiang, Y.; Kuang, Y.; Zhang, Y.; Feng, J.; Li, C.; et al. Development and evaluation of the first high-throughput SNP array for common carp (Cyprinus carpio). BMC Genom. 2014, 15. [Google Scholar] [CrossRef] [PubMed]
- Palti, Y.; Gao, G.; Liu, S.; Kent, M.P.; Lien, S.; Miller, M.R.; Rexroad, C.E., III; Moen, T. The development and characterization of a 57K single nucleotide polymorphism array for rainbow trout. Mol. Ecol. Resour. 2015, 15, 662–672. [Google Scholar] [CrossRef] [PubMed]
- Won, E.T.; Borski, R.J. Endocrine regulation of compensatory growth in fish. Front. Endocrinol. 2013, 4. [Google Scholar] [CrossRef] [PubMed]
- Andrews, S. FastQC: A quality control tool for high throughput sequence data. Ref. Source 2010. Available online: http://www.bioinformatics.babraham.ac.uk/projects/fastqc/ (accessed on 21 May 2015). [Google Scholar]
- Bolger, A.M.; Lohse, M.; Usadel, B. Trimmomatic: A flexible trimmer for Illumina Sequence Data. Bioinformatics 2014, 30, 2114–2120. [Google Scholar] [CrossRef]
- Kim, D.; Pertea, G.; Trapnell, C.; Pimentel, H.; Kelley, R.; Salzberg, S.L. TopHat2: Accurate alignment of transcriptomes in the presence of insertions, deletions and gene fusions. Genome Biol. 2013, 14, R36. [Google Scholar] [CrossRef]
- Langmead, B.; Salzberg, S.L. Fast gapped-read alignment with Bowtie 2. Nat. Methods 2012, 9, 357–359. [Google Scholar] [CrossRef] [PubMed]
- Trapnell, C.; Williams, B.A.; Pertea, G.; Mortazavi, A.; Kwan, G.; van Baren, M.J.; Salzberg, S.L.; Wold, B.J.; Pachter, L. Transcript assembly and quantification by RNA-Seq reveals unannotated transcripts and isoform switching during cell differentiation. Nat. Biotechnol. 2010, 28, 511–515. [Google Scholar] [CrossRef] [PubMed]
- Conesa, A.; Götz, S.; García-Gómez, J.M.; Terol, J.; Talón, M.; Robles, M. Blast2GO: A universal tool for annotation, visualization and analysis in functional genomics research. Bioinformatics 2005, 21, 3674–3676. [Google Scholar] [CrossRef] [PubMed]
- Flicek, P.; Amode, M.R.; Barrell, D.; Beal, K.; Billis, K.; Brent, S.; Carvalho-Silva, D.; Clapham, P.; Coates, G.; Fitzgerald, S.; et al. Ensembl 2014. Nucleic Acids Res. 2014, 42, D749–D755. [Google Scholar] [CrossRef] [PubMed]
- Geer, L.Y.; Marchler-Bauer, A.; Geer, R.C.; Han, L.; He, L.; He, S.; Liu, C.; Shi, W.; Bryant, S.H. The NCBI BioSystems database. Nucleic Acids Res. 2010, 38, D492–D496. [Google Scholar] [CrossRef] [PubMed]
- Altschul, S.F.; Madden, T.L.; Schäffer, A.A.; Zhang, J.; Zhang, Z.; Miller, W.; Lipman, D.J. Gapped BLAST and PSI-BLAST: A new generation of protein database search programs. Nucleic Acids Res. 1997, 25, 3389–3402. [Google Scholar] [CrossRef] [PubMed]
- Li, H.; Handsaker, B.; Wysoker, A.; Fennell, T.; Ruan, J.; Homer, N.; Marth, G.; Abecasis, G.; Durbin, R.; 1000 Genome Project Data Processing Subgroup. The sequence alignment/map format and SAMtools. Bioinformatics 2009, 25, 2078–2079. [Google Scholar] [CrossRef] [PubMed]
- Milne, I.; Stephen, G.; Bayer, M.; Cock, P.J.; Pritchard, L.; Cardle, L.; Shaw, P.D.; Marshall, D. Using Tablet for visual exploration of second-generation sequencing data. Brief. Bioinform. 2013, 14, 193–202. [Google Scholar] [CrossRef] [PubMed]
- Sambrook, J.; Fritsch, E.F.; Maniatis, T. Molecular Cloning: A Laboratory Manual, 1st ed.; Cold Spring Harbor Laboratory Press: New York, NY, USA, 1989. [Google Scholar]
- Buetow, K.H.; Edmonson, M.; MacDonald, R.; Clifford, R.; Yip, P.; Kelley, J.; Little, D.P.; Strausberg, R.; Koester, H.; Cantor, C.R.; et al. High-throughput development and characterization of a genomewide collection of gene-based single nucleotide polymorphism markers by chip-based matrix-assisted laser desorption/ionization time-of-flight mass spectrometry. Proc. Natl. Acad. Sci. USA 2001, 98, 581–584. [Google Scholar] [CrossRef] [PubMed]
- Oeth, P.; del Mistro, G.; Marnellos, G.; Shi, T.; van den Boom, D. Qualitative and quantitative genotyping using single base primer extension coupled with matrix-assisted laser desorption/ionization time-of-flight mass spectrometry (MassARRAY). Methods Mol. Biol. 2009, 578, 307–343. [Google Scholar] [PubMed]
- Goudet, J. FSTAT (version 1.2): A computer program to calculate F-statistics. J. Hered. 1995, 86, 485–486. [Google Scholar]
- Raymond, M.; Rousset, F. GENEPOP (Version 1.2): Population genetics software for exact tests and ecumenicism. J. Hered. 1995, 86, 248–249. [Google Scholar]
- Rousset, F. GENEPOP’007: A complete re-implementation of the GENEPOP software for Windows and Linux. Mol. Ecol. Resour. 2008, 8, 103–106. [Google Scholar] [CrossRef] [PubMed]
- Rice, W.R. Analyzing tables of statistical tests. Evolution 1989, 43, 223–225. [Google Scholar] [CrossRef]


| Statistic | Muscle | Liver | Total |
|---|---|---|---|
| Raw reads | 19,326,140 | 17,466,901 | 36,793,041 |
| Trimmed reads | 17,596,236 (91.0%) | 16,398,082 (93.9%) | 33,994,318 (92.4%) |
| Concordant aligned reads | 15,570,568 (88.5%) | 14,805,040 (90.3%) | 30,375,608 (89.4%) |
| Number of genes | 19,147 | 15,928 | 20,447 |
| Number of transcripts | 27,664 | 22,061 | 33,795 |
| Minimum transcript size | 62 | 78 | 62 |
| Maximum transcript size | 67,989 | 17,880 | 67,989 |
| Transcripts over 500 bp | 26,659 | 21,319 | 32,650 |
| Mean transcript length (bp) | 2594.66 | 2428.24 | 2819.60 |
| N50 | 3411 | 3154 | 3691 |
| N90 | 1381 | 1293 | 1531 |
| Gene 1 | Annotation | Organ 2 | LG 3 | QTL Marker 4 | Distance 5 (kbp) | QTL Information 6 (VPE) † |
|---|---|---|---|---|---|---|
| acss3 | Acyl-CoA synthetase 3 | M&L | 16 | SmaUSC-E11 | 909 | BW-QTL (13%) |
| actc | Actin, alpha cardiac muscle 1 | M | 3 | Sma-USC144 | 1995 | K-QTL (12%) |
| akirin2 | Akirin2 | M&L | 23 | nd | nd | L-QTL interval |
| akt3 | Ser/Thr-protein kinase | M&L | 15 | Sma-USC211 | 1621 | BW, L-QTL (13%) |
| atp2a1 | Calcium transporting ATPase1 | M | 21 | Sma-USC234 | 4364 | K-QTL interval |
| chpt1 | Choline phosphotransferase 1 | M&L | 16 * | nd | nd | BW-QTL (13%) |
| eno1 | Alpha-enolase | M&L | 10 | SmaUSC-E32 | 5651 | K-QTL interval |
| far2 | Fatty acyl CoA reductase 2 | M&L | 6 | Sma-USC264 | 823 | BW, L-QTL interval |
| fbxo32 | F-box protein 32 | M&L | 2 | Sma-USC242 | 1924 | K-QTL interval |
| fgf6b | Fibrobalst growth factor 6b | M | 16 | SmaUSC-E11 | 34 | K-QTL (25%) |
| foxm1 | Forkhead box M1 | M&L | 16 | SmaUSC-E11 | 762 | BW-QTL (13%) |
| foxo1b | Forkhead Box O1b | M&L | 8 | Sma-USC194 | 1843 | L-QTL interval |
| ghr2 | Growth hormone receptor 2 | M&L | 14 | nd | nd | BW, L-QTL interval |
| got1a | Glu-oxaloacetic transaminase 1a | M&L | 2 | Sma-USC112 | 622 | BW, L-QTL interval |
| igf1 | Insulin-like growth factor 1 | L | 16 | SmaUSC-E11 | 1453 | K-QTL (25%) |
| igf2b | Insulin-like growth factor 2b | M&L | 6 | nd | nd | BW, L-QTL interval |
| igfbp2 | Igf binding protein 2 | L | 20 | Sma-USC29 | 7275 | L-QTL (8%) |
| igfbp3 | Igf binding protein 3 | M | 1 | Sma-USC15 | 413 | BW-QTL (14%) |
| insrb | Insulin Receptor | M&L | 5 | Sma-USC247 | 2321 | BW, L-QTL interval |
| jak2a | Janus kinase 2a | M&L | 14 | Sma-USC82 | 152 | BW-QTL (11%) |
| jak2b | Janus kinase 2b | M&L | 12 | SmaUSC-E14 | 2037 | L-QTL (13%) |
| lepr | Leptin receptor | M&L | 5 | Sma-USC65 | 488 | BW, L-QTL interval |
| lum | Lumican | M&L | 16 | Sma-USC223 | 504 | BW-QTL (13%) |
| mef2a | Myocite enhancer factor a | M&L | 6 | nd | nd | BW, L-QTL interval |
| mir133b | Mir133b | M | 23 | Sma-USC273 | 5066 | BW, L-QTL (11%) |
| mstn1 | Myostatin 1 | M | 20 * | nd | nd | L-QTL interval |
| mtor | Ser/Thr-protein kinase mTOR | M&L | 10 | nd | nd | F-QTL interval |
| myod | Myoblast determination protein | M | 1 | Sma-USC101 | 351 | BW-QTL (8%) |
| myog | Myogenin | M | 11 | Sma-USC158 | 3209 | K-QTL (10%) |
| pah | Phenylalanine hydroxylase | M&L | 16 | SmaUSC-E11 | 1511 | BW-QTL (13%) |
| pklr | Pyruvate kinase | M&L | 2 | Sma-USC168 | 443 | K-QTL interval |
| pkm | Pyruvate kinase a, muscle | M&L | 4 | Sma-USC7 | 2610 | K-QTL (10%) |
| ptn | Pleiotrpophin. | L | 16 | SmaUSC-E11 | 693 | BW-QTL (13%) |
| pvalb1 | Parvalbumin 1 | M | 21 | Sma-USC234 | 1911 | K-QTL interval |
| smad4b | Mothers- decapentaplegic 4 | M&L | 14 | Sma-USC63 | 589 | BW-QTL (11%) |
| sox5 | SRY-box 5 | M&L | 16 | Sma-USC256 | 560 | BW, L-QTL (8%) |
| ssr3 | Translocon protein gamma | M&L | 15 * | nd | nd | BW, L-QTL interal |
| stat5.1 | Activator of transcription 5 | M&L | 21 | Sma-USC41 | 125 | K-QTL (4%) |
| tgfb1 | Transforming growth factor β1 | M&L | 15 | nd | nd | BW-QTL interval |
| tgfb2 | Transforming growth factor β2 | M&L | 2 * | nd | nd | BW, L-QTL inteval |
| tgfbr1 | Tgf β1 receptor | M&L | 17 | Sma-USC55 | 1569 | L-QTL (9%) |
| tgfbr2 | Tgf β2 receptor | M&L | 22 | nd | nd | Gene function † |
| tgfbr3 | Tgf β3 receptor | M&L | 5 | ScmM1 | 265 | BW, L-QTL (11%) |
| tnnc2 | Troponin C, skeletal muscle | M | 10 * | nd | nd | K-QTL interval |
| usp18 | Ubiquitin specific peptidase | M&L | 16 | SmaUSC-E11 | 84 | BW-QTL (13%) |
| SNP | Variant | Genomic Position 1 | Gene Region 2 | MAF 3 | p (HW) 4 | He 5 | Fis 6 |
|---|---|---|---|---|---|---|---|
| actc | T/C | Sm_46: 2,118,151 | Exon syn | T = 0.368 | 1 | 0.471 | −0.06 |
| akirin2 | C/G | Sm_26: 4,028,782 | 3’ UTR | G = 0.324 | 0.7061 | 0.445 | 0.074 |
| akt3 | C/T | Sm_31: 2,270,529 | 3’ UTR | T = 0.118 | 1 | 0.21 | −0.119 |
| atp2a1 | A/T | Sm_11: 7,019,041 | 3’ UTR | A = 0.485 | 1 | 0.507 | 0.014 |
| chpt1 | G/A | Sm_183: 505,467 | Exon syn | T = 0.338 | 0.2538 | 0.453 | −0.234 |
| eno1 | C/G | Sm_4: 2,026,813 | 5’ UTR | C = 0.25 | 1 | 0.381 | −0.005 |
| far2 | G/A | Sm_100: 790,917 | Exon syn | A = 0.088 | 1 | 0.163 | −0.082 |
| fgf6b | G/A | Sm_49: 505,467 | Exon R-Q | G = 1 | - | - | - |
| foxm1 | C/G | Sm_49: 1,237,830 | 5’ UTR | C = 0.344 | 0.1129 | 0.461 | 0.322 |
| foxo1b | C/G | Sm_14: 4,371,288 | Exon A-G | C = 0.353 | 1 | 0.463 | −0.015 |
| ghr2 | G/A | Sm_67: 9082 | Exon syn | G = 1 | - | - | - |
| got1a | C/A | Sm_35: 2,520,843 | 3’ UTR | C = 1 | - | - | - |
| igf1 | G/T | Sm_49: 1,922,714 | Intron | T = 0.029 | 1 | 0.058 | −0.015 |
| igf2b | G/A | Sm_15: 9,070,308 | 3’ UTR | A = 0.265 | 1 | 0.395 | −0.043 |
| igfbp2 | A/G | Sm_2: 14,079,242 | 3’ UTR | G = 0.324 | 0.7061 | 0.445 | 0.074 |
| igfbp3 | C/A | Sm_1: 12,956,648 | 3’ UTR | A = 0.103 | 1 | 0.187 | −0.1 |
| insrb | G/A | Sm_5: 4,670,818 | Exon syn | A = 0.132 | 1 | 0.233 | −0.138 |
| jak2a | C/G | Sm_38: 2,890,626 | Intron | G = 0.441 | 0.7412 | 0.501 | 0.06 |
| jak2b | A/T | Sm_18: 4,376,249 | 3’ UTR | A = 0.044 | 1 | 0.086 | −0.031 |
| lepr | A/G | Sm_5: 10,530,481 | Exon V-A | A = G = 0.5 | 0.7387 | 0.508 | 0.074 |
| lum | T/C | Sm_36: 3,958,348 | 5’ UTR | C = 0.029 | 1 | 0.058 | −0.015 |
| mef2a | C/G | Sm_15: 4,752,470 | 3’ UTR | G = 0.044 | 1 | 0.086 | −0.031 |
| mir133b | C/A | Sm_47: 179,652 | 5’ UTR | A = 0.059 | 1 | 0.112 | −0.048 |
| mstn1 | A/T | Sm_275: 53,874 | 3’ UTR | A = 0.176 | 0.249 | 0.296 | 0.205 |
| mtor | C/A | Sm_21: 2,840,205 | Exon syn | A = 0.103 | 1 | 0.187 | −0.1 |
| myod | G/T | Sm_84: 1,867,326 | Exon syn | G = 1 | - | - | - |
| myog | A/T | Sm_9: 6,475,591 | 3’ UTR | T = 0.059 | 1 | 0.112 | −0.048 |
| pah | G/C | Sm_49: 1,912,258 | 5’ UTR | C = 0.162 | 1 | 0.275 | 0.039 |
| pklr | C/T | Sm_6: 7,978,133 | 3’ UTR | C = 0.029 | 1 | 0.058 | −0.015 |
| pkm | A/C | Sm_32: 2,688,948 | Intron | A = 0.439 | 0.7262 | 0.501 | 0.093 |
| ptn | T/G | Sm_49: 1,163,341 | 3’ UTR | T = 0.25 | 0.0814 | 0.379 | −0.32 |
| pvalb1 | C/T | Sm_11: 4,556,367 | 5’ UTR | T = 0.044 | 1 | 0.086 | −0.031 |
| smad4b | C/T | Sm_38: 1,262,602 | 5’ UTR | T = 0.074 | 1 | 0.138 | −0.065 |
| sox5 | C/T | Sm_40: 1,284,941 | Exon syn | C = 0.426 | 0.5019 | 0.496 | −0.128 |
| ssr3 | C/T | Sm_55: 538,312 | 3’ UTR | T = 0.176 | 1 | 0.295 | 0.003 |
| stats5.1 | G/C | Sm_85: 414,378 | 3’ UTR | C = 0.309 | 0.686 | 0.434 | 0.119 |
| tgfb1 | A/C | Sm_28: 3,438,353 | 5’ UTR | C = 0.426 | 1 | 0.496 | −0.007 |
| tgfb2 | A/C | Sm_58: 12,144 | 3’ UTR | C = 0.132 | 1 | 0.233 | −0.138 |
| tgfbr1 | C/T | Sm_3: 2,957,935 | 3’ UTR | T = 0.029 | 1 | 0.058 | −0.015 |
| tgfbr2 | T/A | Sm_10: 2,181,357 | 3’ UTR | T = 0.235 | 0.6469 | 0.365 | −0.13 |
| tgfbr3 | T/C | Sm_34: 1,743,526 | Intron | C = 0.338 | 0.7061 | 0.454 | −0.102 |
| tnnc2 | T/C | Sm_174: 11,856 | Exon syn | T = 0.368 | 1 | 0.471 | −0.06 |
| usp18 | G/A | Sm_49: 555,569 | Exon S-L | A = 0.191 | 0.3136 | 0.313 | −0.222 |
© 2016 by the authors; licensee MDPI, Basel, Switzerland. This article is an open access article distributed under the terms and conditions of the Creative Commons by Attribution (CC-BY) license (http://creativecommons.org/licenses/by/4.0/).
Share and Cite
Robledo, D.; Fernández, C.; Hermida, M.; Sciara, A.; Álvarez-Dios, J.A.; Cabaleiro, S.; Caamaño, R.; Martínez, P.; Bouza, C. Integrative Transcriptome, Genome and Quantitative Trait Loci Resources Identify Single Nucleotide Polymorphisms in Candidate Genes for Growth Traits in Turbot. Int. J. Mol. Sci. 2016, 17, 243. https://0-doi-org.brum.beds.ac.uk/10.3390/ijms17020243
Robledo D, Fernández C, Hermida M, Sciara A, Álvarez-Dios JA, Cabaleiro S, Caamaño R, Martínez P, Bouza C. Integrative Transcriptome, Genome and Quantitative Trait Loci Resources Identify Single Nucleotide Polymorphisms in Candidate Genes for Growth Traits in Turbot. International Journal of Molecular Sciences. 2016; 17(2):243. https://0-doi-org.brum.beds.ac.uk/10.3390/ijms17020243
Chicago/Turabian StyleRobledo, Diego, Carlos Fernández, Miguel Hermida, Andrés Sciara, José Antonio Álvarez-Dios, Santiago Cabaleiro, Rubén Caamaño, Paulino Martínez, and Carmen Bouza. 2016. "Integrative Transcriptome, Genome and Quantitative Trait Loci Resources Identify Single Nucleotide Polymorphisms in Candidate Genes for Growth Traits in Turbot" International Journal of Molecular Sciences 17, no. 2: 243. https://0-doi-org.brum.beds.ac.uk/10.3390/ijms17020243