Article

Molecular Characterization and Expression Analyses of the Complement Component C8α, C8β and C9 Genes in Yellow Catfish (Pelteobagrus fulvidraco) after the Aeromonas hydrophila Challenge

1
Key Laboratory of Freshwater Animal Breeding, Ministry of Agriculture, College of Fisheries, Huazhong Agricultural University, Wuhan 430070, China
2
Freshwater Aquaculture Collaborative Innovation Center of Hubei Province, Wuhan 430070, China
3
Key Laboratory of Freshwater Biodiversity Conservation, Ministry of Agriculture, Yangtze River Fisheries Research Institute, Chinese Academy of Fishery Sciences, Wuhan 430070, China
4
School of Biological Sciences, Victoria University of Wellington, P O Box 600, Wellington 6140, New Zealand
*
Author to whom correspondence should be addressed.
These authors contributed equally to this work.
Int. J. Mol. Sci. 2016, 17(3), 345; https://0-doi-org.brum.beds.ac.uk/10.3390/ijms17030345
Submission received: 29 January 2016 / Revised: 26 February 2016 / Accepted: 29 February 2016 / Published: 8 March 2016
(This article belongs to the Special Issue Fish Molecular Biology)

Abstract

:
The complement components C8α, C8β and C9 have important roles in the innate immune system against invading microorganisms. Partial cDNA sequences of the Pf_C8α, Pf_C8β and Pf_C9 genes (Pf: abbreviation of Pelteobagrus fulvidraco) were cloned from yellow catfish. The Pf_C8α, Pf_C8β and Pf_C9 genes showed the greatest amino acid similarity to C8α (54%) and C8β (62%) of zebrafish and to C9 (52%) of grass carp, respectively. Ontogenetic expression analyses using real-time quantitative PCR suggested that the three genes may play crucial roles during embryonic and early larval development. The mRNA expressions of the three genes were all at the highest levels in liver tissue, and at lower or much lower levels in 16 other tissues, demonstrating that the liver is the primary site for the protein synthesis of Pf_C8α, Pf_C8β and Pf_C9. Injection of Aeromonas hydrophila led to up-regulation of the three genes in the spleen, head kidney, kidney, liver and blood tissues, indicating that the three genes may contribute to the host’s defense against invading pathogenic microbes. An increased understanding of the functions of the Pf_C8α, Pf_C8β and Pf_C9 genes in the innate immunity of yellow catfish will help enhance production of this valuable freshwater species.

Graphical Abstract

1. Introduction

The complement system, which is made up of a series of distinct serum proteins and cell surface receptors [1], is an essential link between innate and adaptive immune responses that allows the host defense against bacterial invasion and inflammatory response [2,3,4]. There are three pathways initiated by different triggers to activate the complement system: the classical, the alternative and the lectin [5]. All three pathways lead to the formation of the membrane attack complex (MAC), which is made up of the terminal complement component (TCC) plasma proteins C5b, C6, C7, C8, and multiple C9 [6]. The MAC, formed on cell membranes, is effective in causing lysis of a variety of target cells through a multi-hit process in innate immune response [2].
The C5b-C9 TCCs are a group of structurally related plasma proteins, but varied somewhat in complexity and size. They belong to the membrane attack complex and perforin (MACPF) super family [7]. Specifically, the TCCs have some common structural motifs, including the thrombospondin domain (TSP), the low-density lipoprotein receptor class A domain (LDLR-A), the unique membrane attack complex/perforin-like domain (MACPF) and the epidermal growth factor-like domain (EGF) [8].
The complement C8 has three genetically distinct subunits, including C8 alpha (C8α), C8 beta (C8β) and C8 gamma (C8γ) [9], which are encoded by three different genes [10]. C8α and C8β belong to the same family and have close homology to the C6, C7 and C9 proteins. C8γ belongs to the lipocalin family, but it is not essential for the MAC-mediated cytolytic activity [11]. C8α is required for lysis because it provides a binding site for C9 [11]. It traverses the lipid bilayer as the first protein, leading to the formation of membrane-penetrating “pores” [12]. C8β is required for cell lysis, as it mediates C8 to bind to C5b-7, a precursor of the MAC [13]. C8β deficiency is strongly associated with neisserial infections, and may lead to deficiency of the complement cytolytic activities [14]. Therefore, C8β plays important roles in the immune defense system [15]. In addition, C9 is known to be the major component for the formation of a pore-like structure that is characteristic of the fully formed MAC [16].
The innate immune system is a fundamental defense system in fish and the only defense system in invertebrates. It is more critical for immunity in teleosts than in mammals [17]. Accumulating evidence indicates that a primitive complement system is identified in cnidarians [18], arthropods [19], mollusks [20], sea urchins [21] and ascidians [22], whereas cartilaginous and bony fishes possess a modern complement system [23]. In teleosts, several genes in the lytic pathway have been cloned and characterized at molecular levels. The complement C9, C7, C8α and C8β in rock bream (Oplegnathus fasciatus), and C9 and C7 in grass carp (Ctenopharyngodon idella) were identified and characterized at the genomic level [24,25,26,27,28]. In zebrafish (Danio rerio), the differential infected versus non-infected expression of C6, C8α and C9 transcripts in fins, head kidney, spleen and liver were studied shortly after infection-by-immersion with viral hemorrhagic septicemia virus (VHSV) [29]. In addition, the complement C9, C6, C7, C8α and C8β genes in rainbow trout (Oncorhynchus mykiss) [30,31,32,33,34], C6 gene in grass carp [35], and C8α, C8β and C9 genes in carp (Cyprinus carpio) [36,37] have been cloned and characterized. These studies indicate that TCC genes are essential for the fish immune defense system. Recent studies have shown that the complement activation pathways in bony fishes are fully developed, and that they play crucial roles in innate immunity [38].
Yellow catfish (Pelteobagrus fulvidraco Richardson) (Teleostei: Bagridae) is an important commercial fish in the aquaculture industry of China due to its excellent meat quality [39]. In recent years, artificial aquaculture of yellow catfish has been seriously affected by several kinds of bacterial diseases, including ascites disease [40], ulcerative syndrome [41], and red-head disease [42], all of which have led to substantial economic losses. In the innate immune response, complement-mediated killing of invading pathogenic microbes through the lytic pathway is one of the major effector mechanisms [27]. The final MAC assembly disrupts the target cell by forming a membrane-penetrating “pore” in the lipid bilayer [43,44]. Therefore, it is extremely important to understand the expression behavior of TCC genes when exploiting the fish immunity system to prevent diseases. In this study, sequences of the Pf_C8α, Pf_C8β, and Pf_C9 genes (Pf: abbreviation of Pelteobagrus fulvidraco) from yellow catfish were identified using rapid amplification of cDNA ends (RACE) based on transcriptome data. We investigated the tissue distributions of Pf_C8α, Pf_C8β and Pf_C9 genes in adults and their expression profiles during the early larval developmental stages using real-time quantitative PCR (qPCR). Furthermore, tissue-specific expressions were carried out to determine the responses of Pf_C8α, Pf_C8β and Pf_C9 genes to challenges of Aeromonas hydrophila.

2. Results

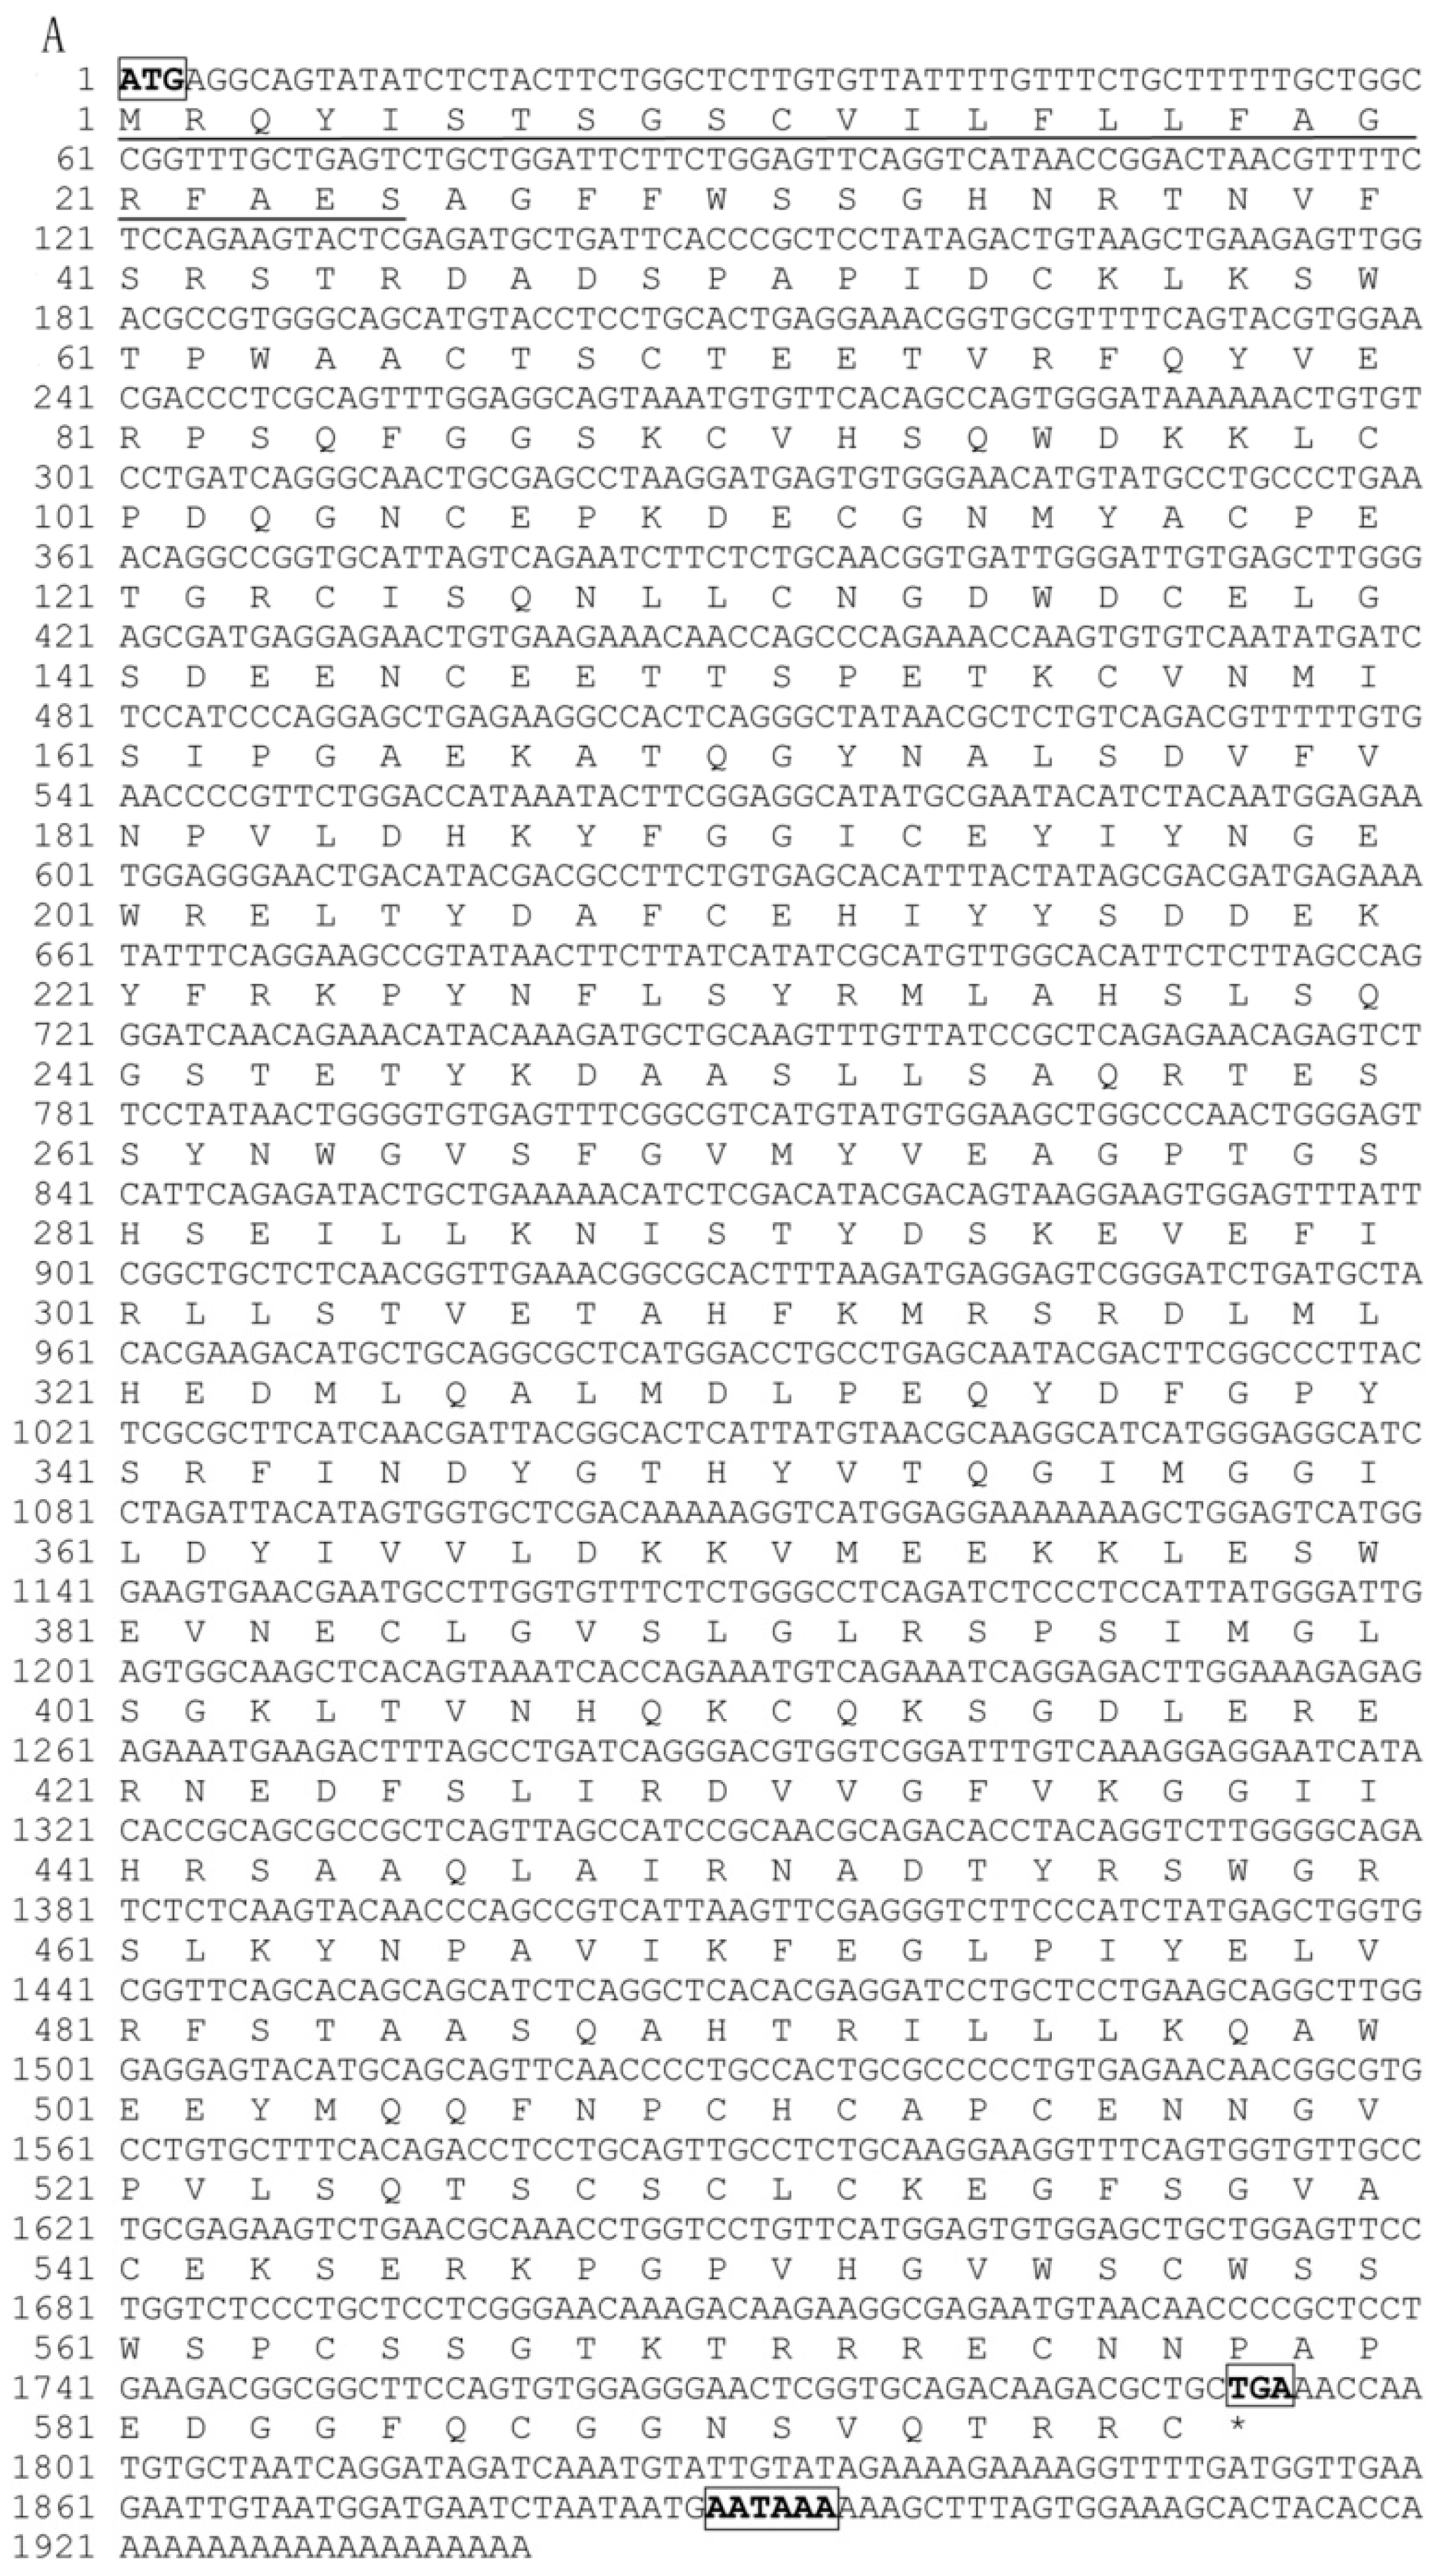
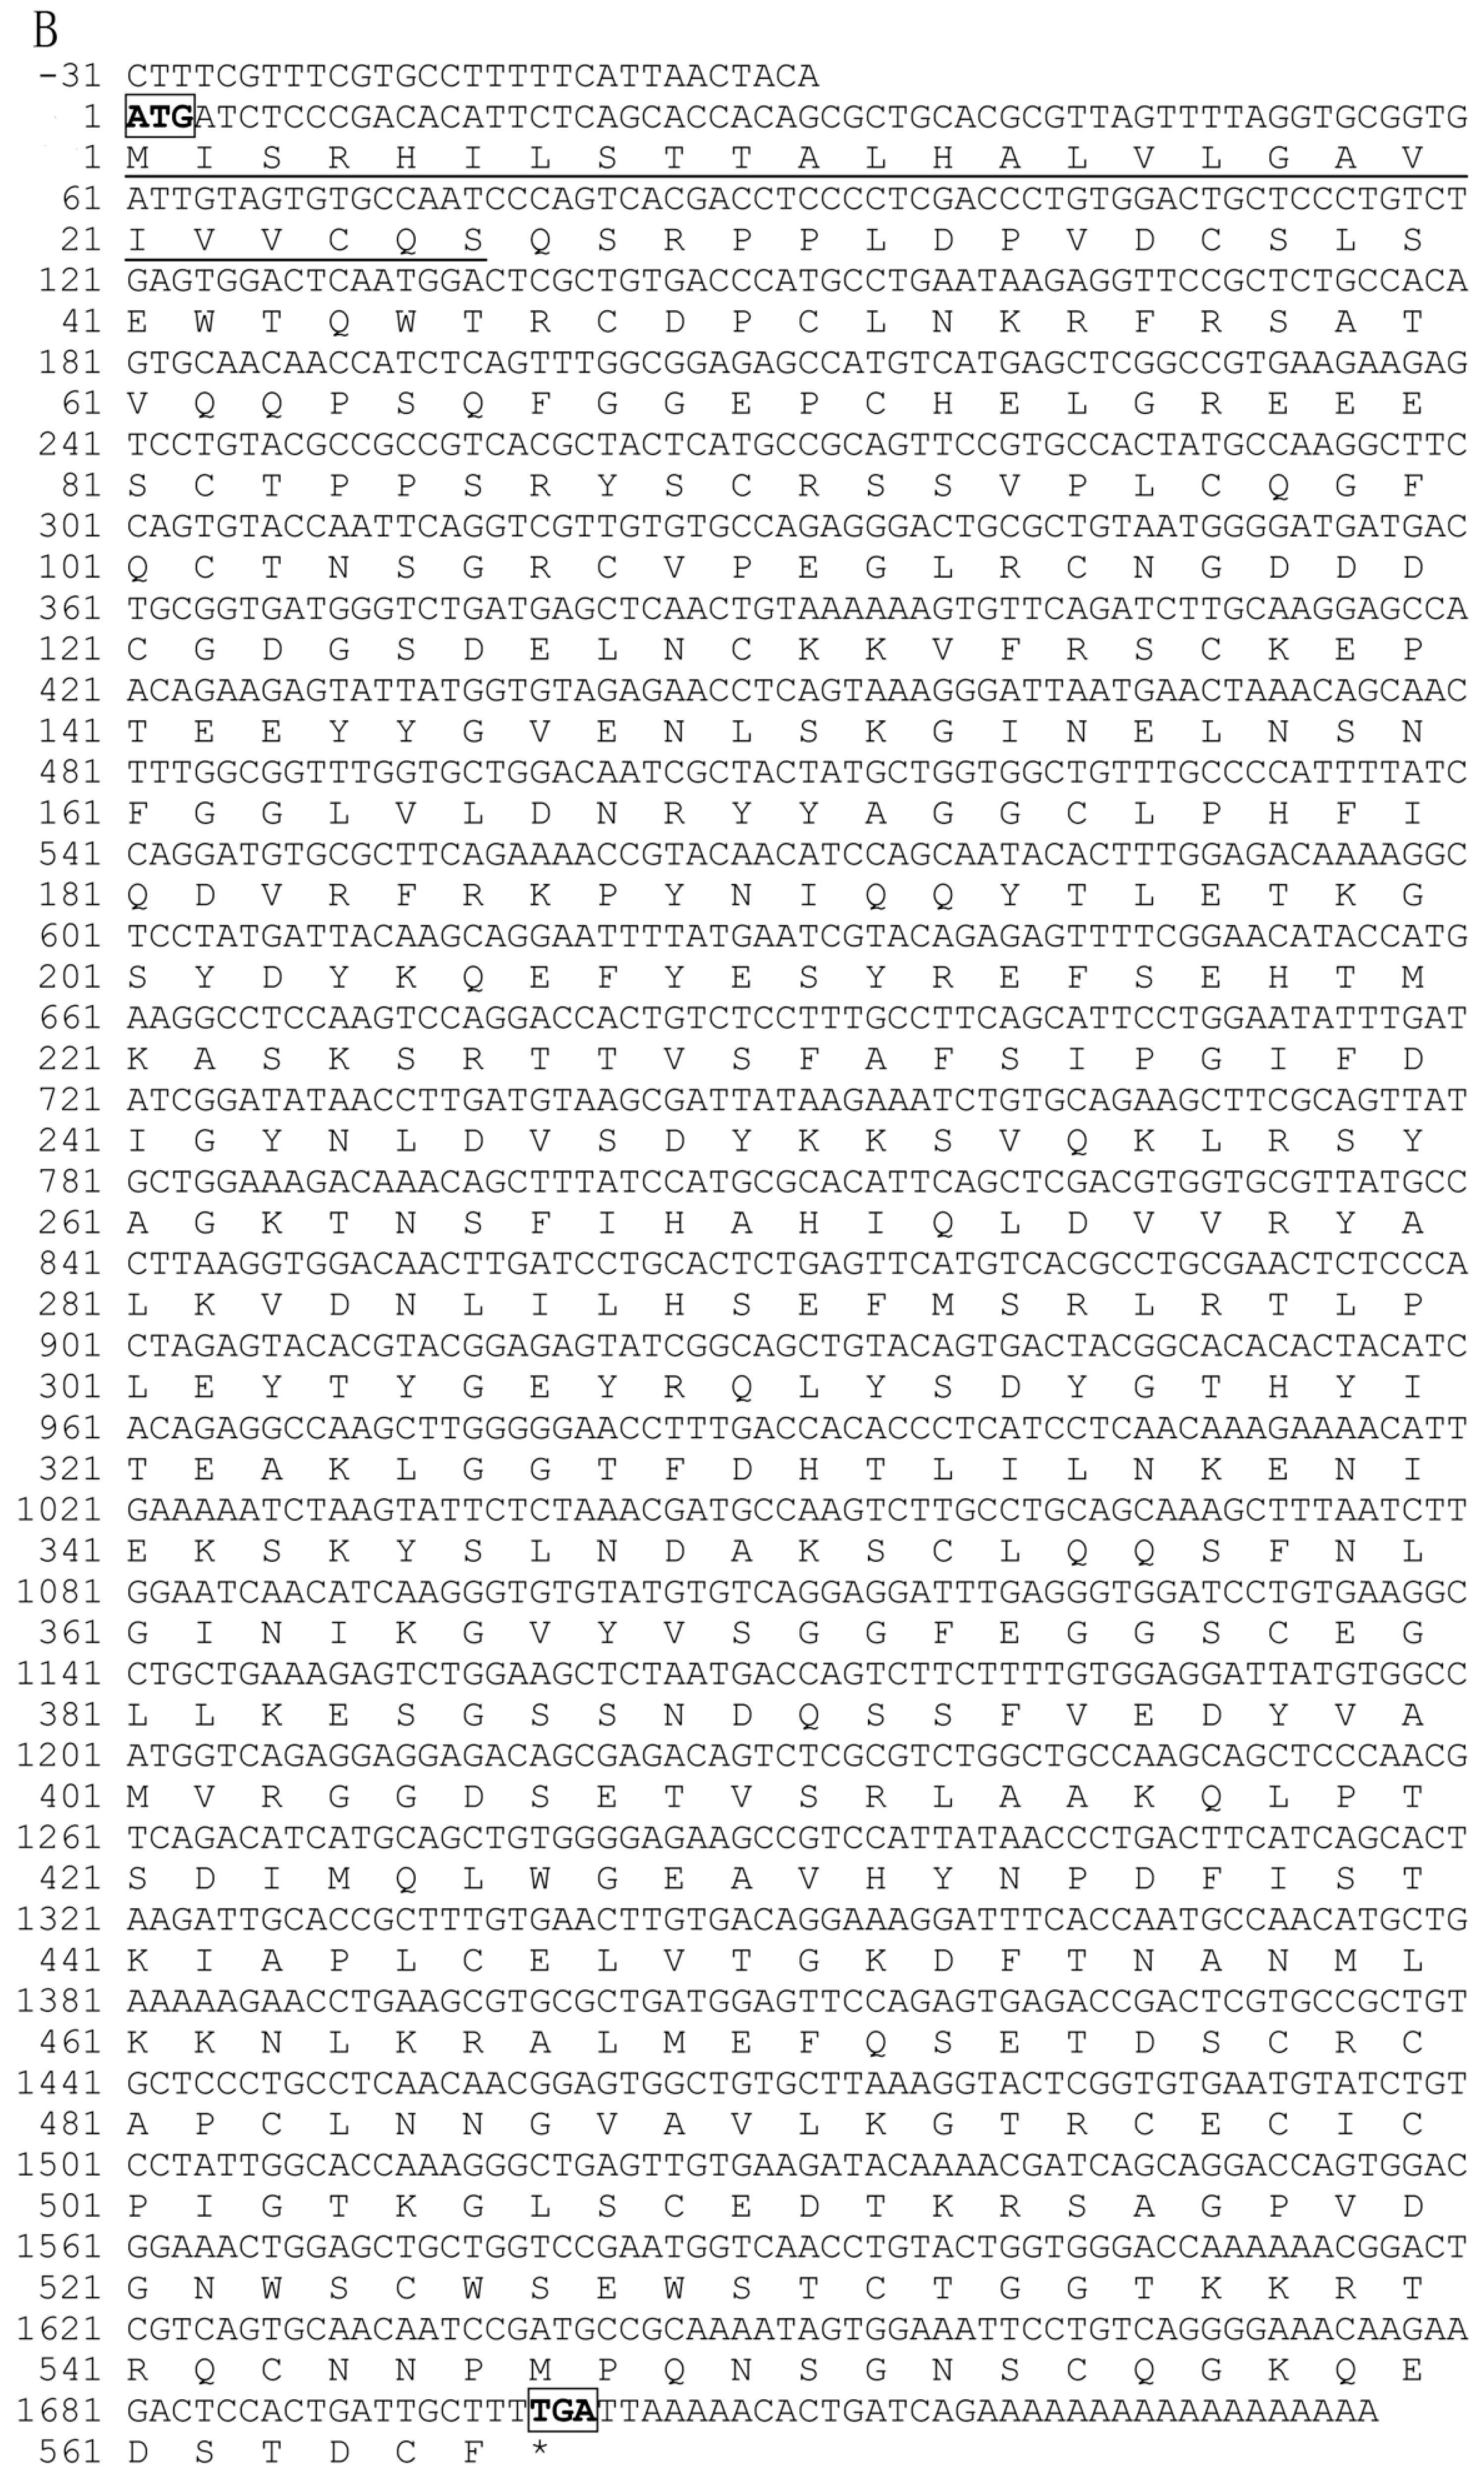
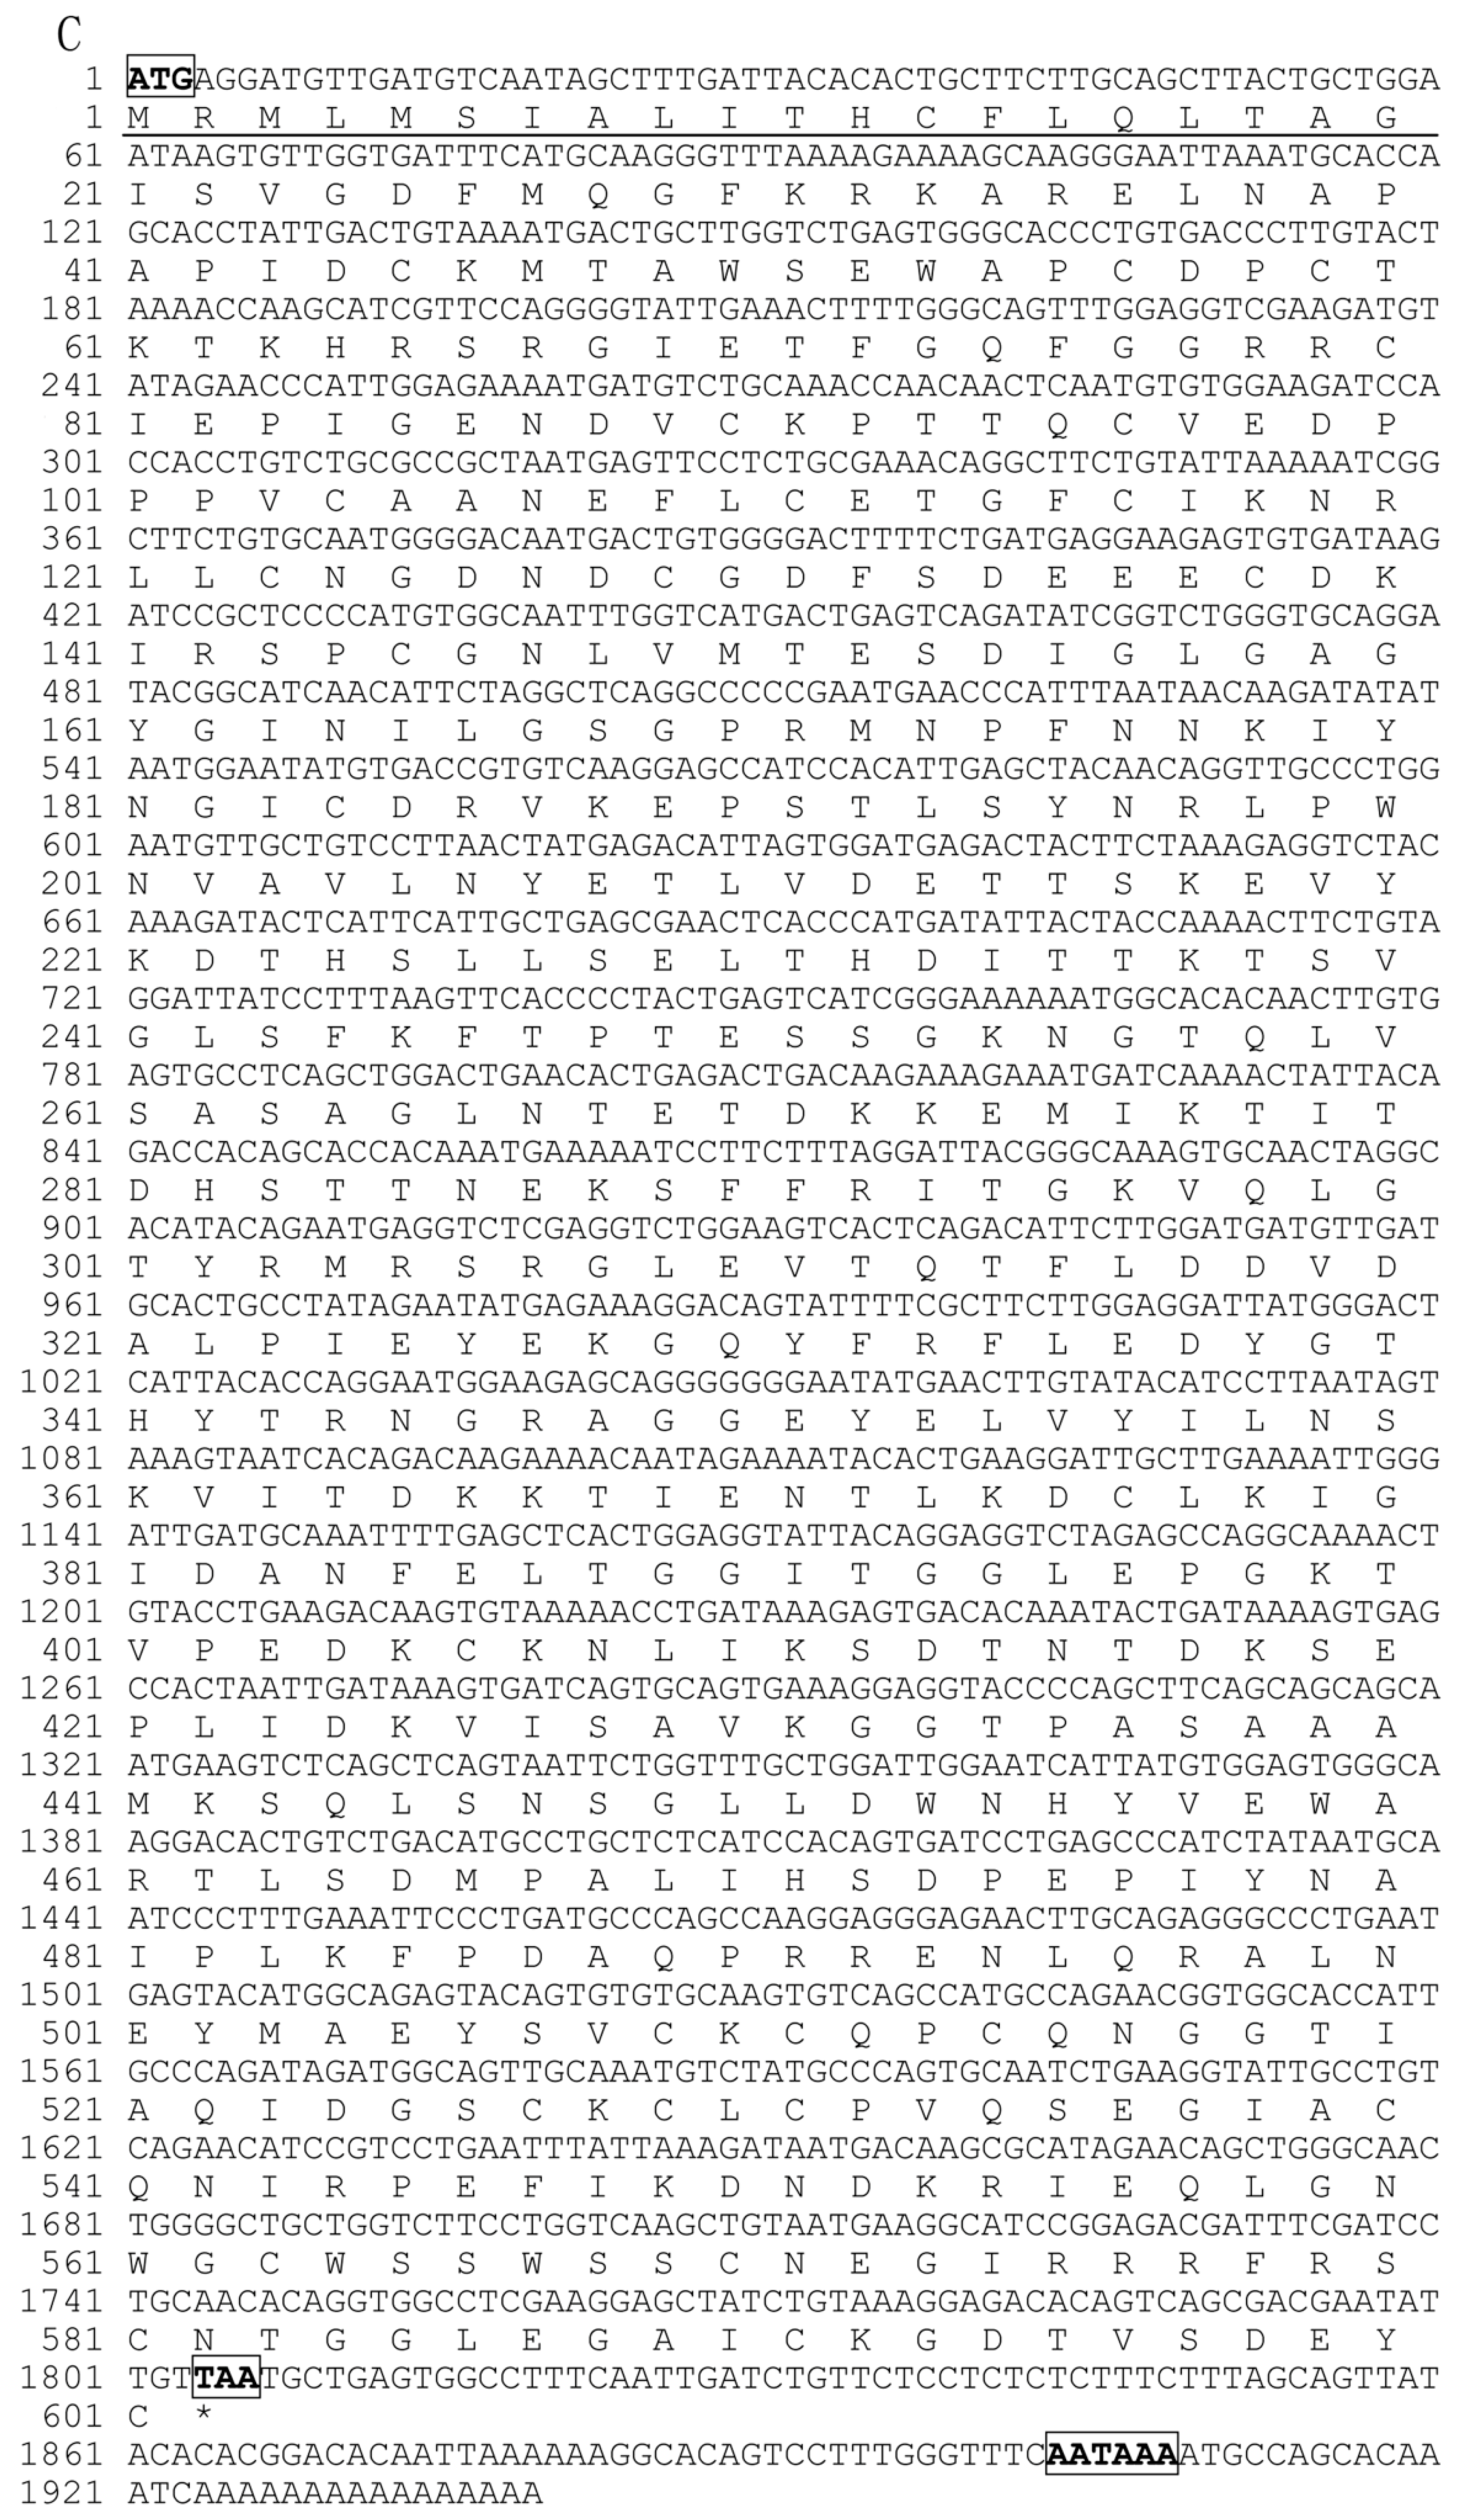
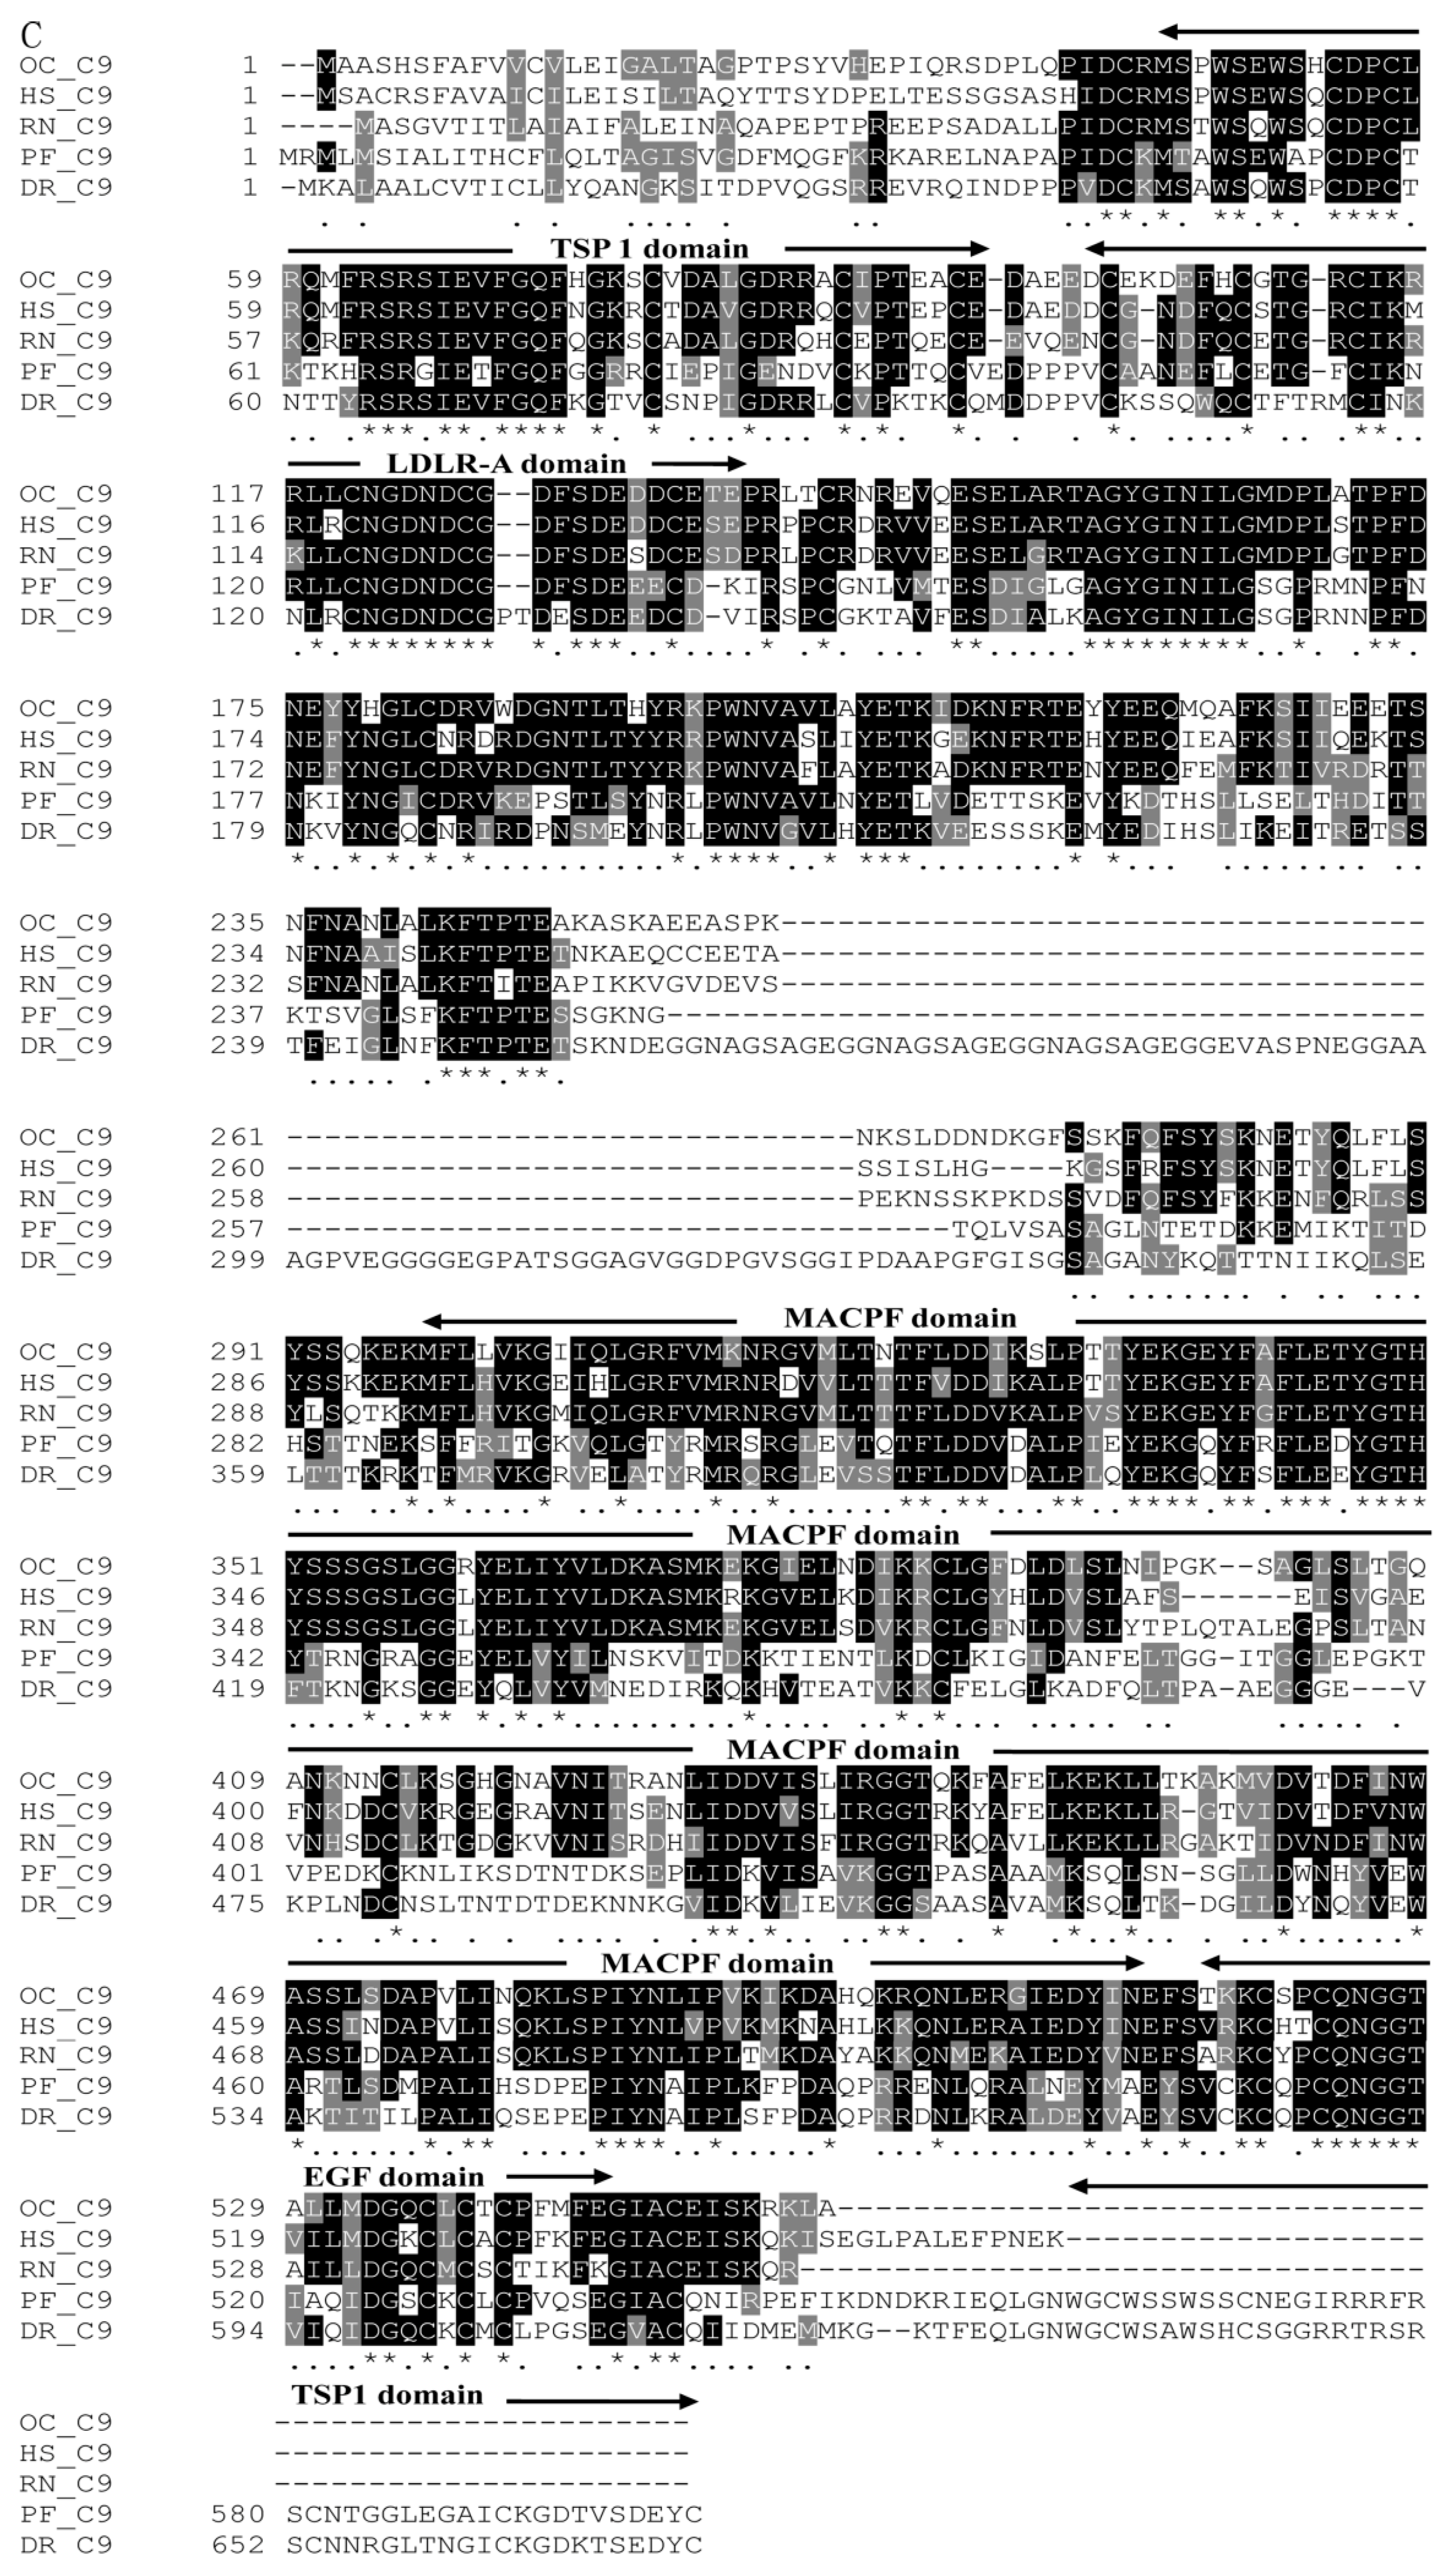
2.1. Characterization of Pf_C8α, Pf_C8β and Pf_C9 cDNA Sequences

The partial cDNA sequences of Pf_C8α, Pf_C8β and Pf_C9 genes were cloned from yellow catfish by RACE-PCR (Figure 1). The partial cDNA of the Pf_C8α gene (GenBank accession no. KT588317) was 1939 bp, and contains a 1794 bp open reading frame (ORF) and a 145 bp 3′-untranslated region (UTR), with a 20 bp poly (A) tail and a polyadenylation signal (AATAAA) (Figure 1A). The ORF of the Pf_C8α gene encoded 597 amino acids, of which the first 25 residues were predicted to be a signal peptide. The molecular mass and isoelectric point (pI) of the amino acids were estimated to be 67.25 kDa and 5.858, respectively.
The partial cDNA of the Pf_C8β gene (GenBank accession no. KT588318) was 1767 bp, and contains a 31 bp 5′-UTR, a 1701 bp ORF, and a 35 bp 3′-UTR, with an 18 bp poly (A) tail (Figure 1B). The ORF of the Pf_C8β gene encoded 566 amino acids, of which the first 26 residues were predicted to be a signal peptide. The estimated molecular mass and pI of the amino acids were 63.24 kDa and 6.534, respectively.
The partial cDNA of the Pf_C9 gene (GenBank accession no. KT454382) was 1939 bp, and contains an 1806 bp ORF and a 133 bp 3′-UTR, with a 16 bp poly (A) tail and a polyadenylation signal (AATAAA) (Figure 1C). The ORF of the Pf_C9 gene encoded 601 amino acids, of which the first 20 residues were predicted to be a signal peptide. The estimated molecular mass and pI of the amino acids were 66.59 kDa and 5.478, respectively.

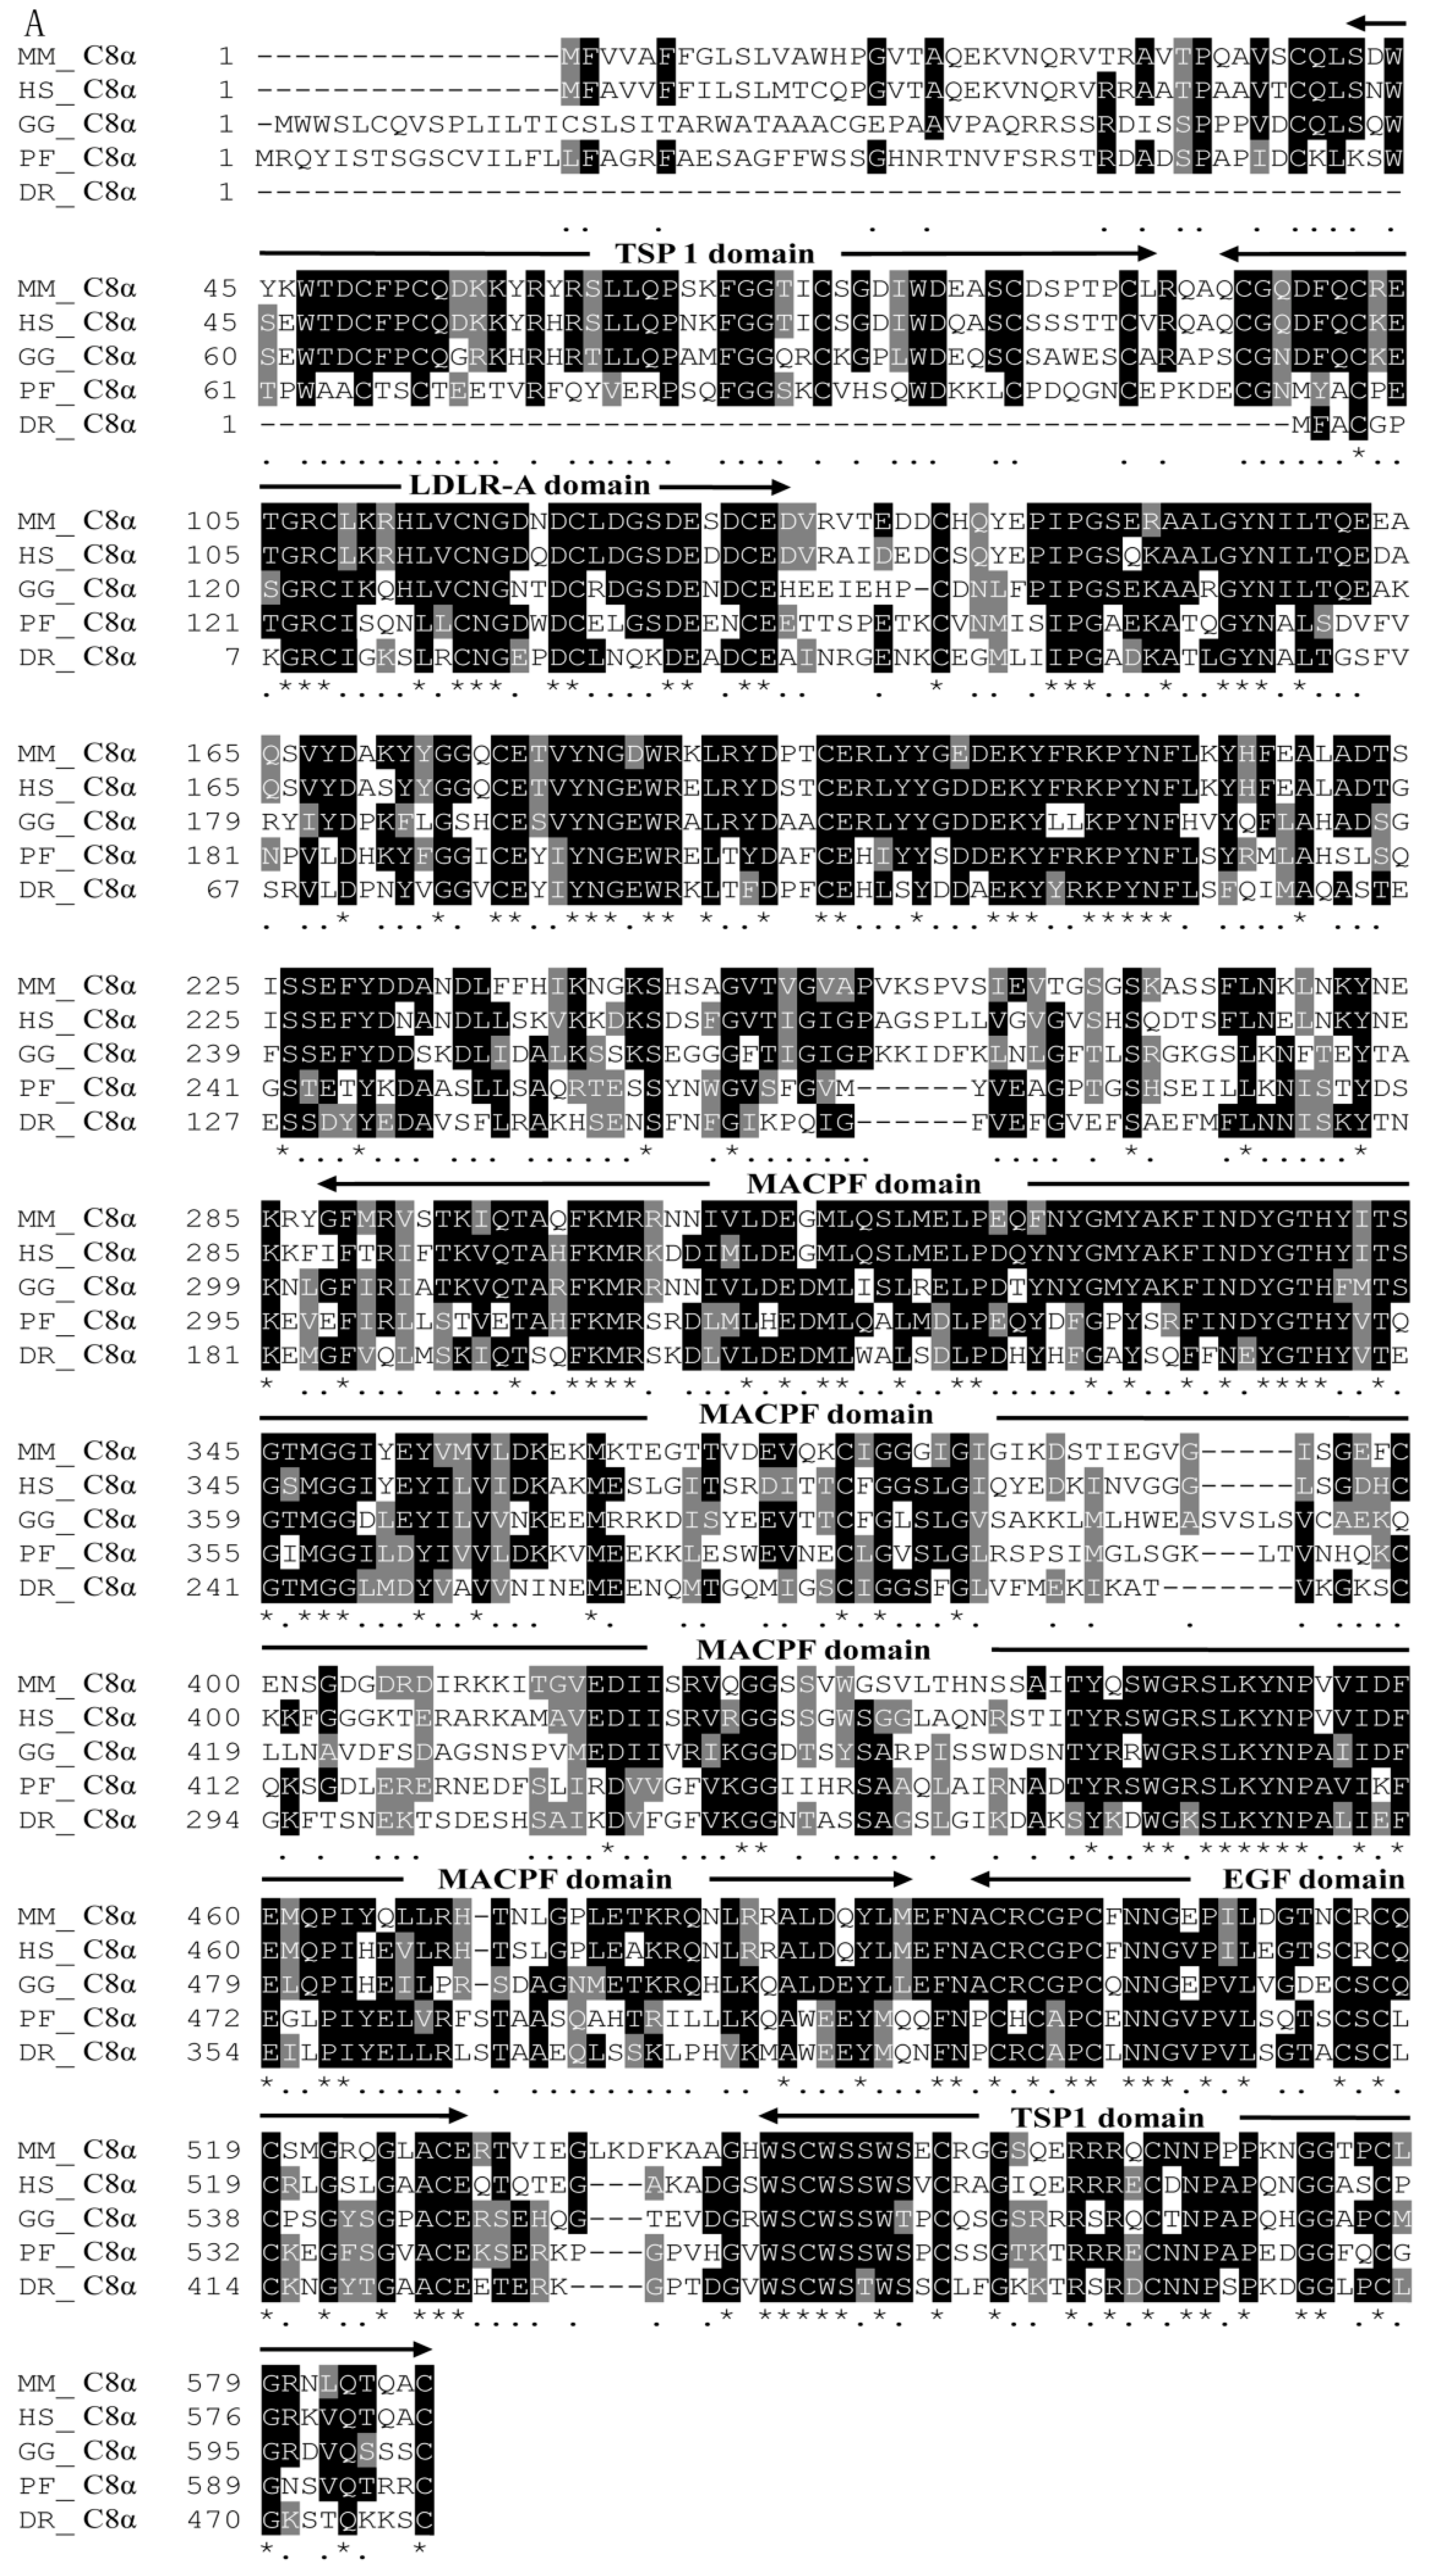
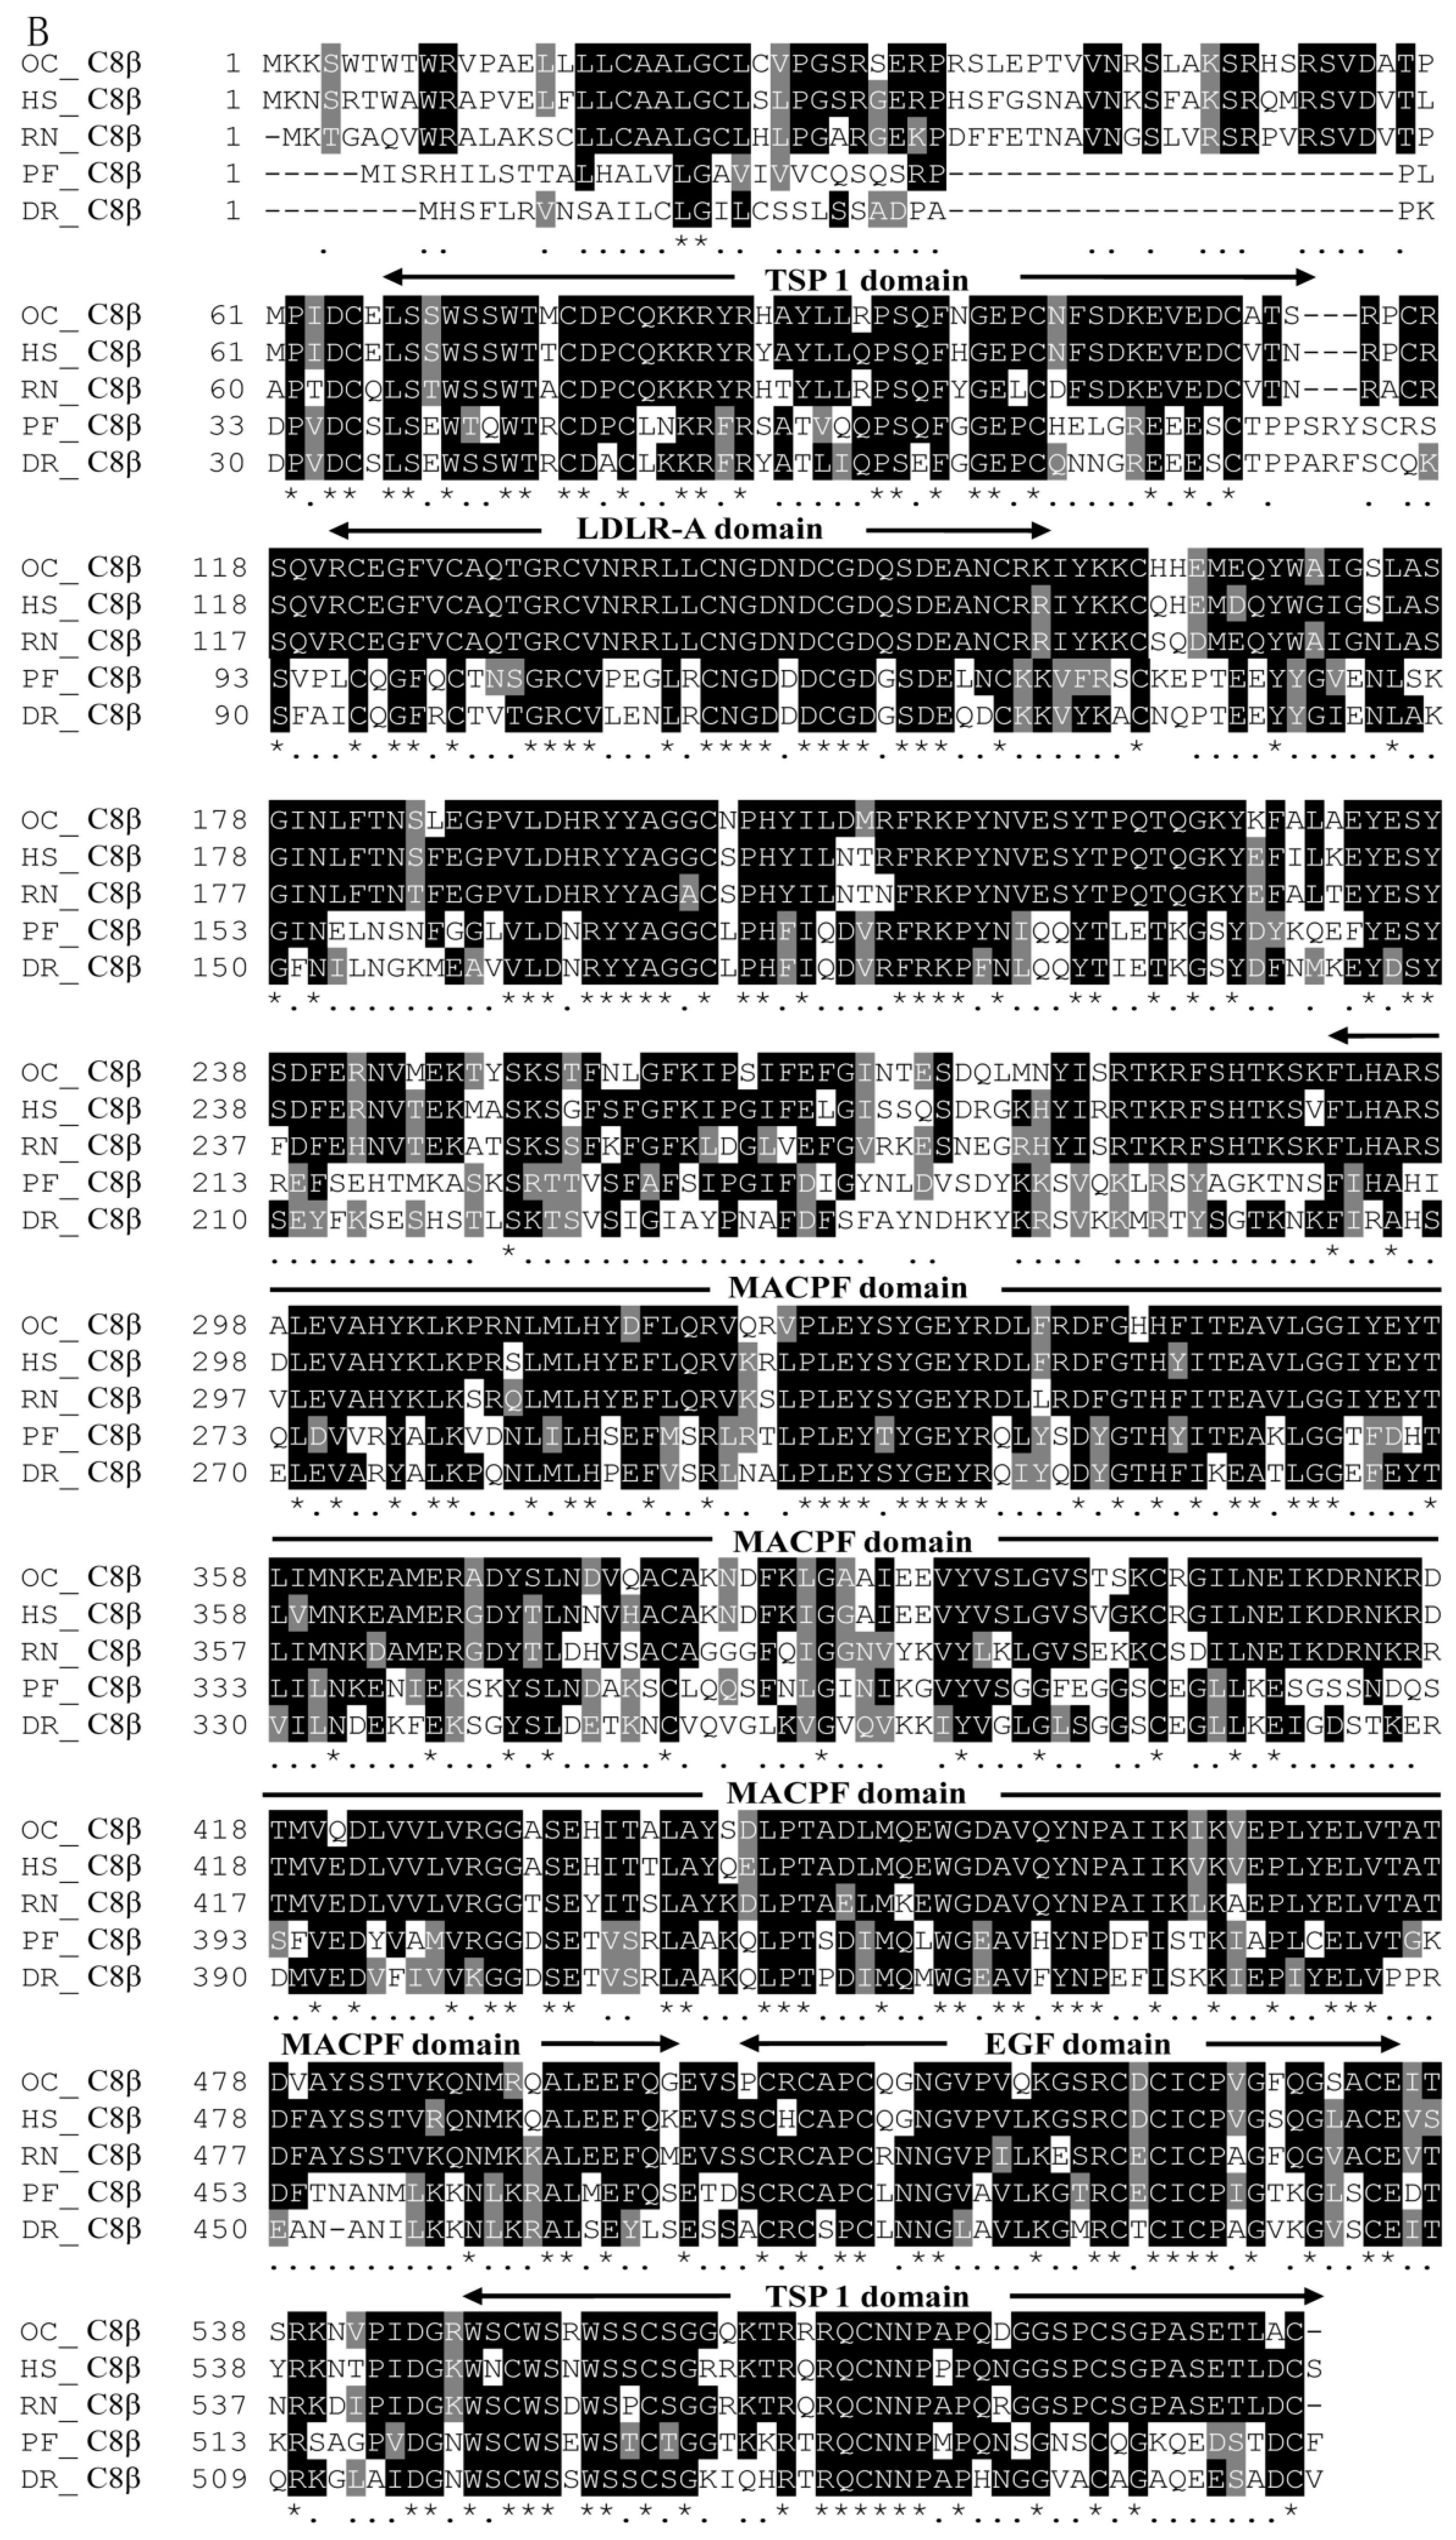
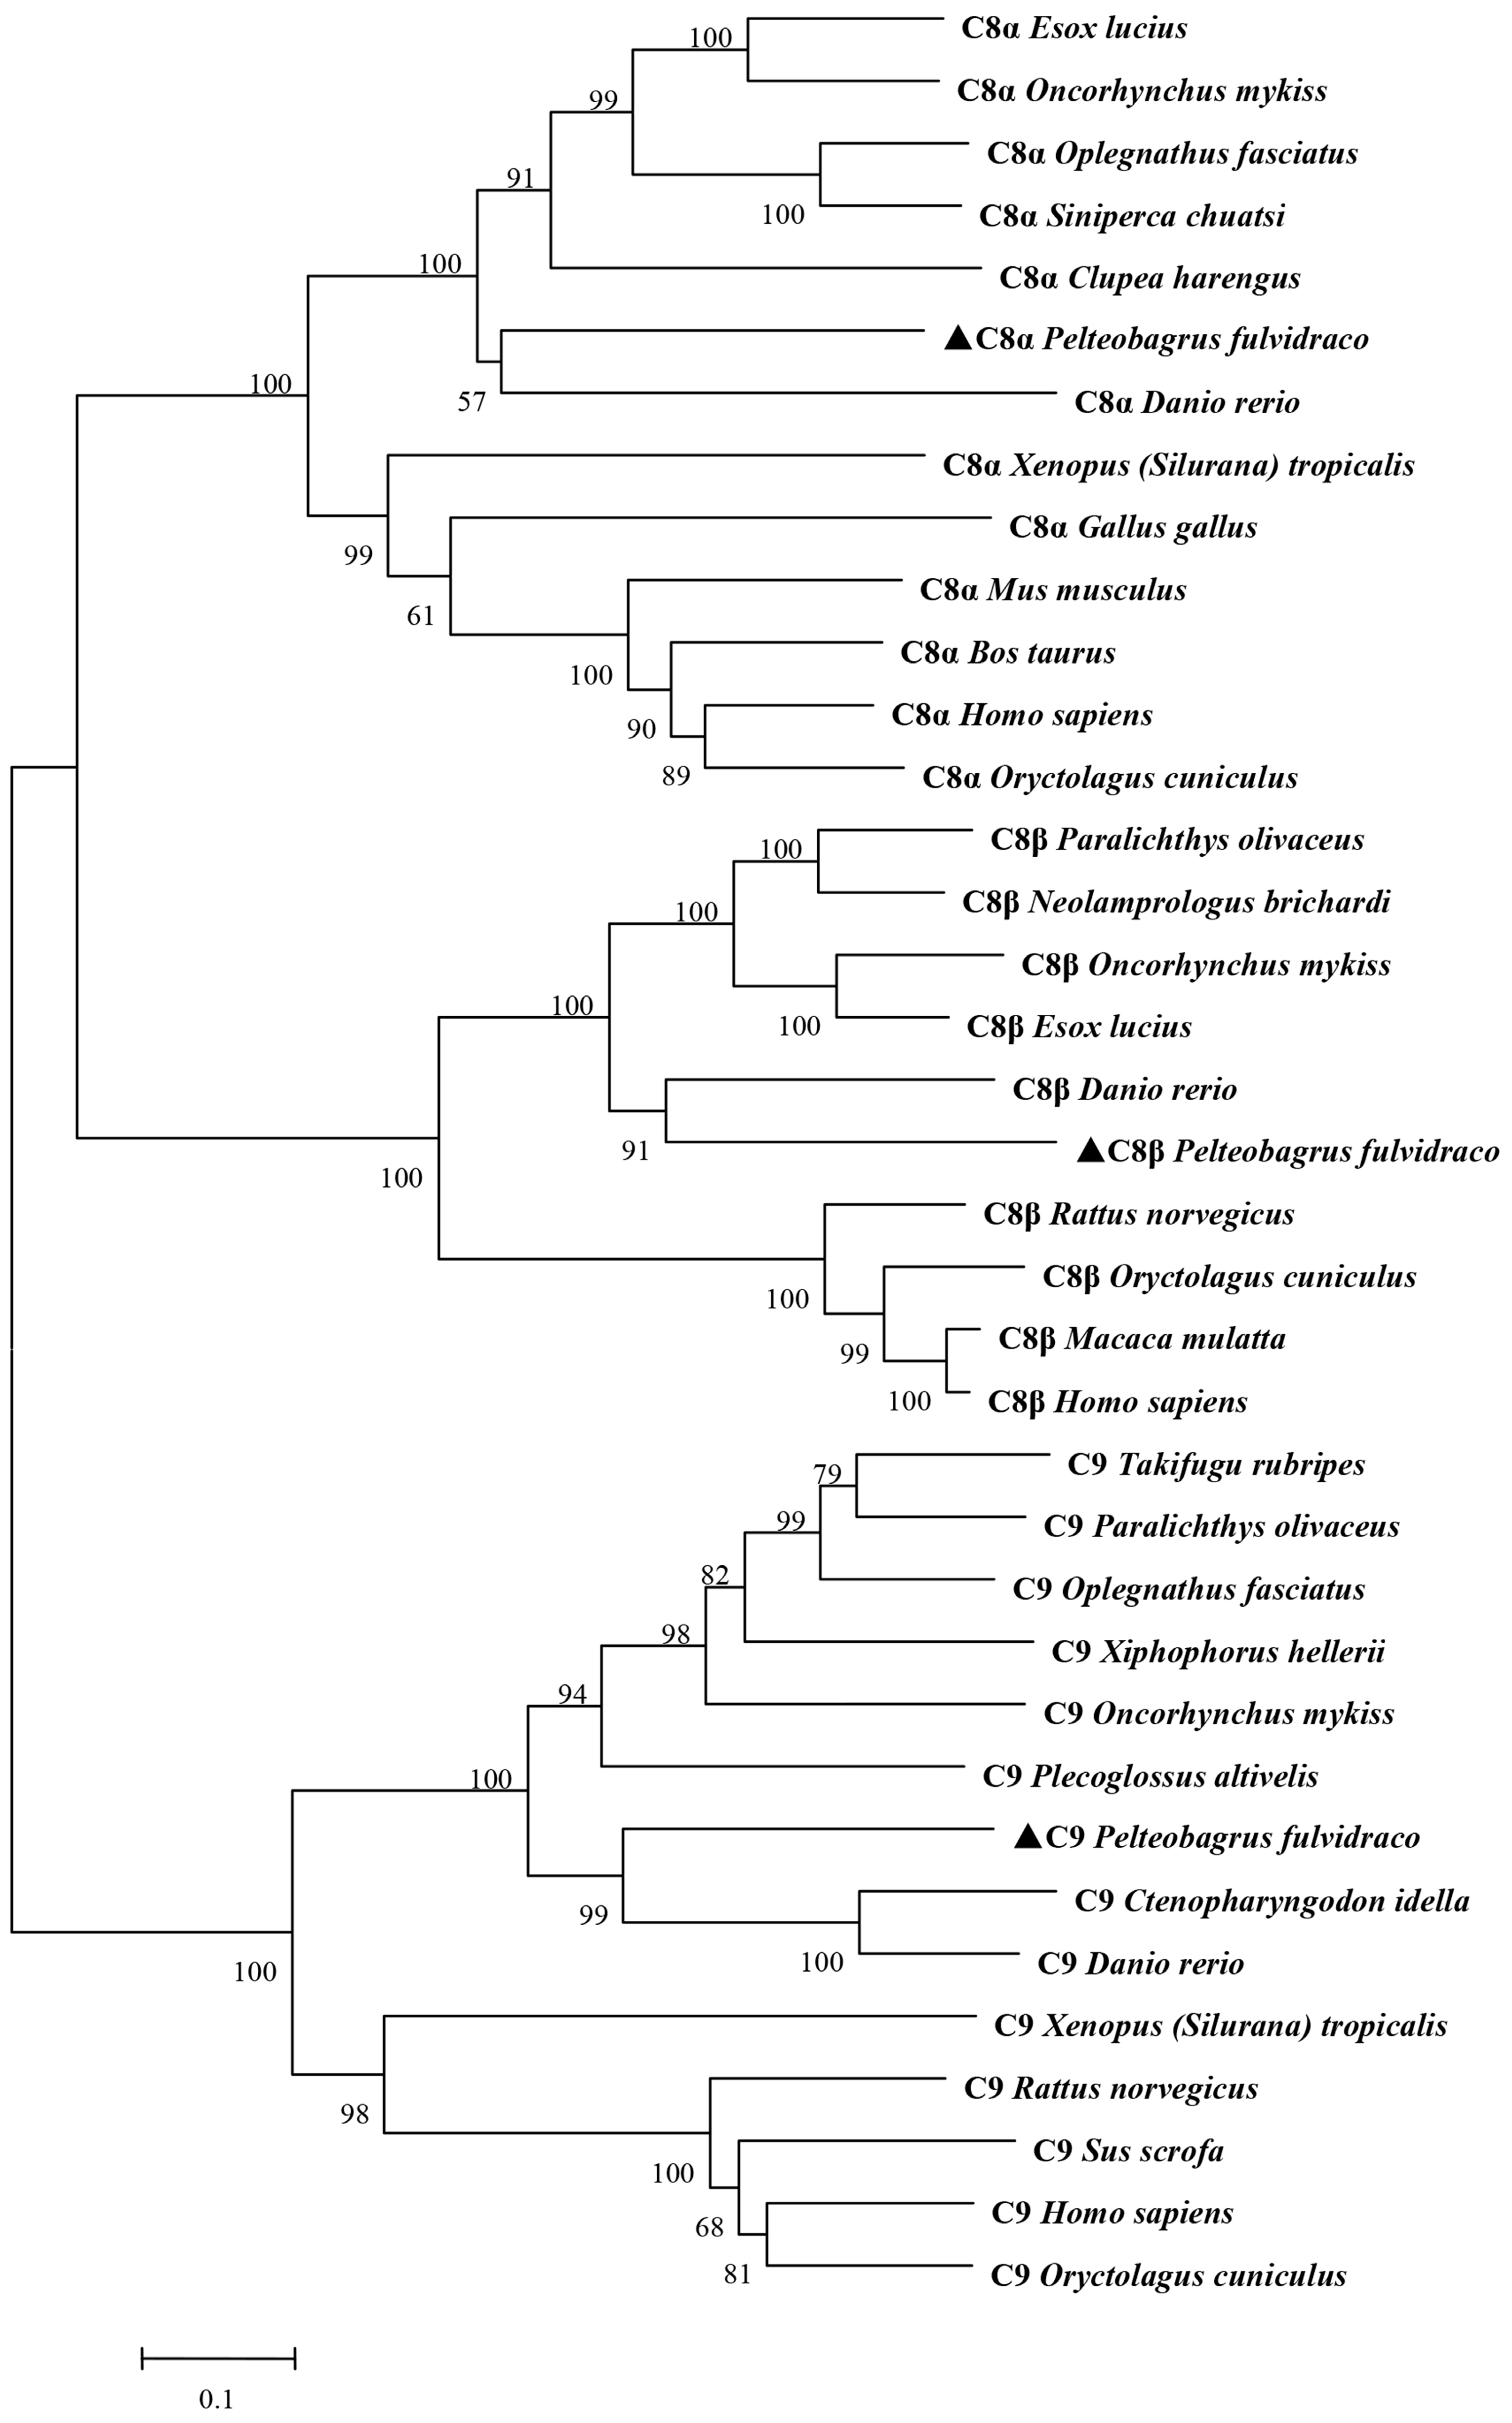
2.2. Homology Comparison and Phylogenetic Analyses of Pf_C8α, Pf_C8β and Pf_C9

BLAST (Basic Local Alignment Search Tool) analysis in GenBank showed that the Pf_C8α amino acid sequence had the highest homology (54%) to that of D. rerio (Accession No. AAH78409.1), followed by Siniperca chuatsi (Accession No. AKA66305.1) (52%) and O. mykiss (Accession No. NP_001118096.1) (51%). Motif Scan analysis identified four potential functional domains in the Pf_C8α amino acid sequence: TSP 1 (57–107 amino acids and 555–597 amino acids), LDLR-A (111–148 amino acids), MACPF (298–505 amino acids) and EGF (509–542 amino acids) (Figure 2A).
BLAST analysis revealed that the Pf_C8β amino acid sequence had the highest homology (62%) to that of D. rerio (Accession No. NP_001243652.1), followed by Esox lucius (Accession No. XP_010885201.1) (61%) and O. mykiss (Accession No. AAL16647.1) (60%). The Motif Scan analysis revealed four potential functional domains in the Pf_C8β amino acid sequence of yellow catfish: TSP 1 (39–86 amino acids and 523–566 amino acids), LDLR-A (96–132 amino acids), MACPF (266–473 amino acids) and EGF (477–510 amino acids) (Figure 2B).
BLAST analysis showed that the Pf_C9 amino acid sequence had the highest homology (52%) to that of C. idella (Accession No. ABN49522.1), followed by O. mykiss (Accession No. NP_001117898.1) (50%) and O. fasciatus (Accession AFU81223.1) (49%). The motif scan analysis identified four potential functional domains in the Pf_C9 amino acid sequence: TSP 1 (47–97 amino acids and 561–597 amino acids), LDLR-A (103–140 amino acids), MACPF (289–504 amino acids) and EGF (508–541 amino acids) (Figure 2C).
To understand the evolutionary relationship of the Pf_C8α, Pf_C8β, Pf_C9 genes with those of other vertebrates, a neighbor-joining (NJ) phylogenetic tree (Figure 3) was constructed based on deduced amino acid sequences. C8α, C8β and C9 clustered into two branches, one branch including teleost species and the other branch including mammalians and other vertebrates, respectively. The yellow catfish shared the greatest homology of C8α and C8β with zebrafish. Pf_C9 was clustered with those of zebrafish and grass carp, and they shared high homology (Figure 3).

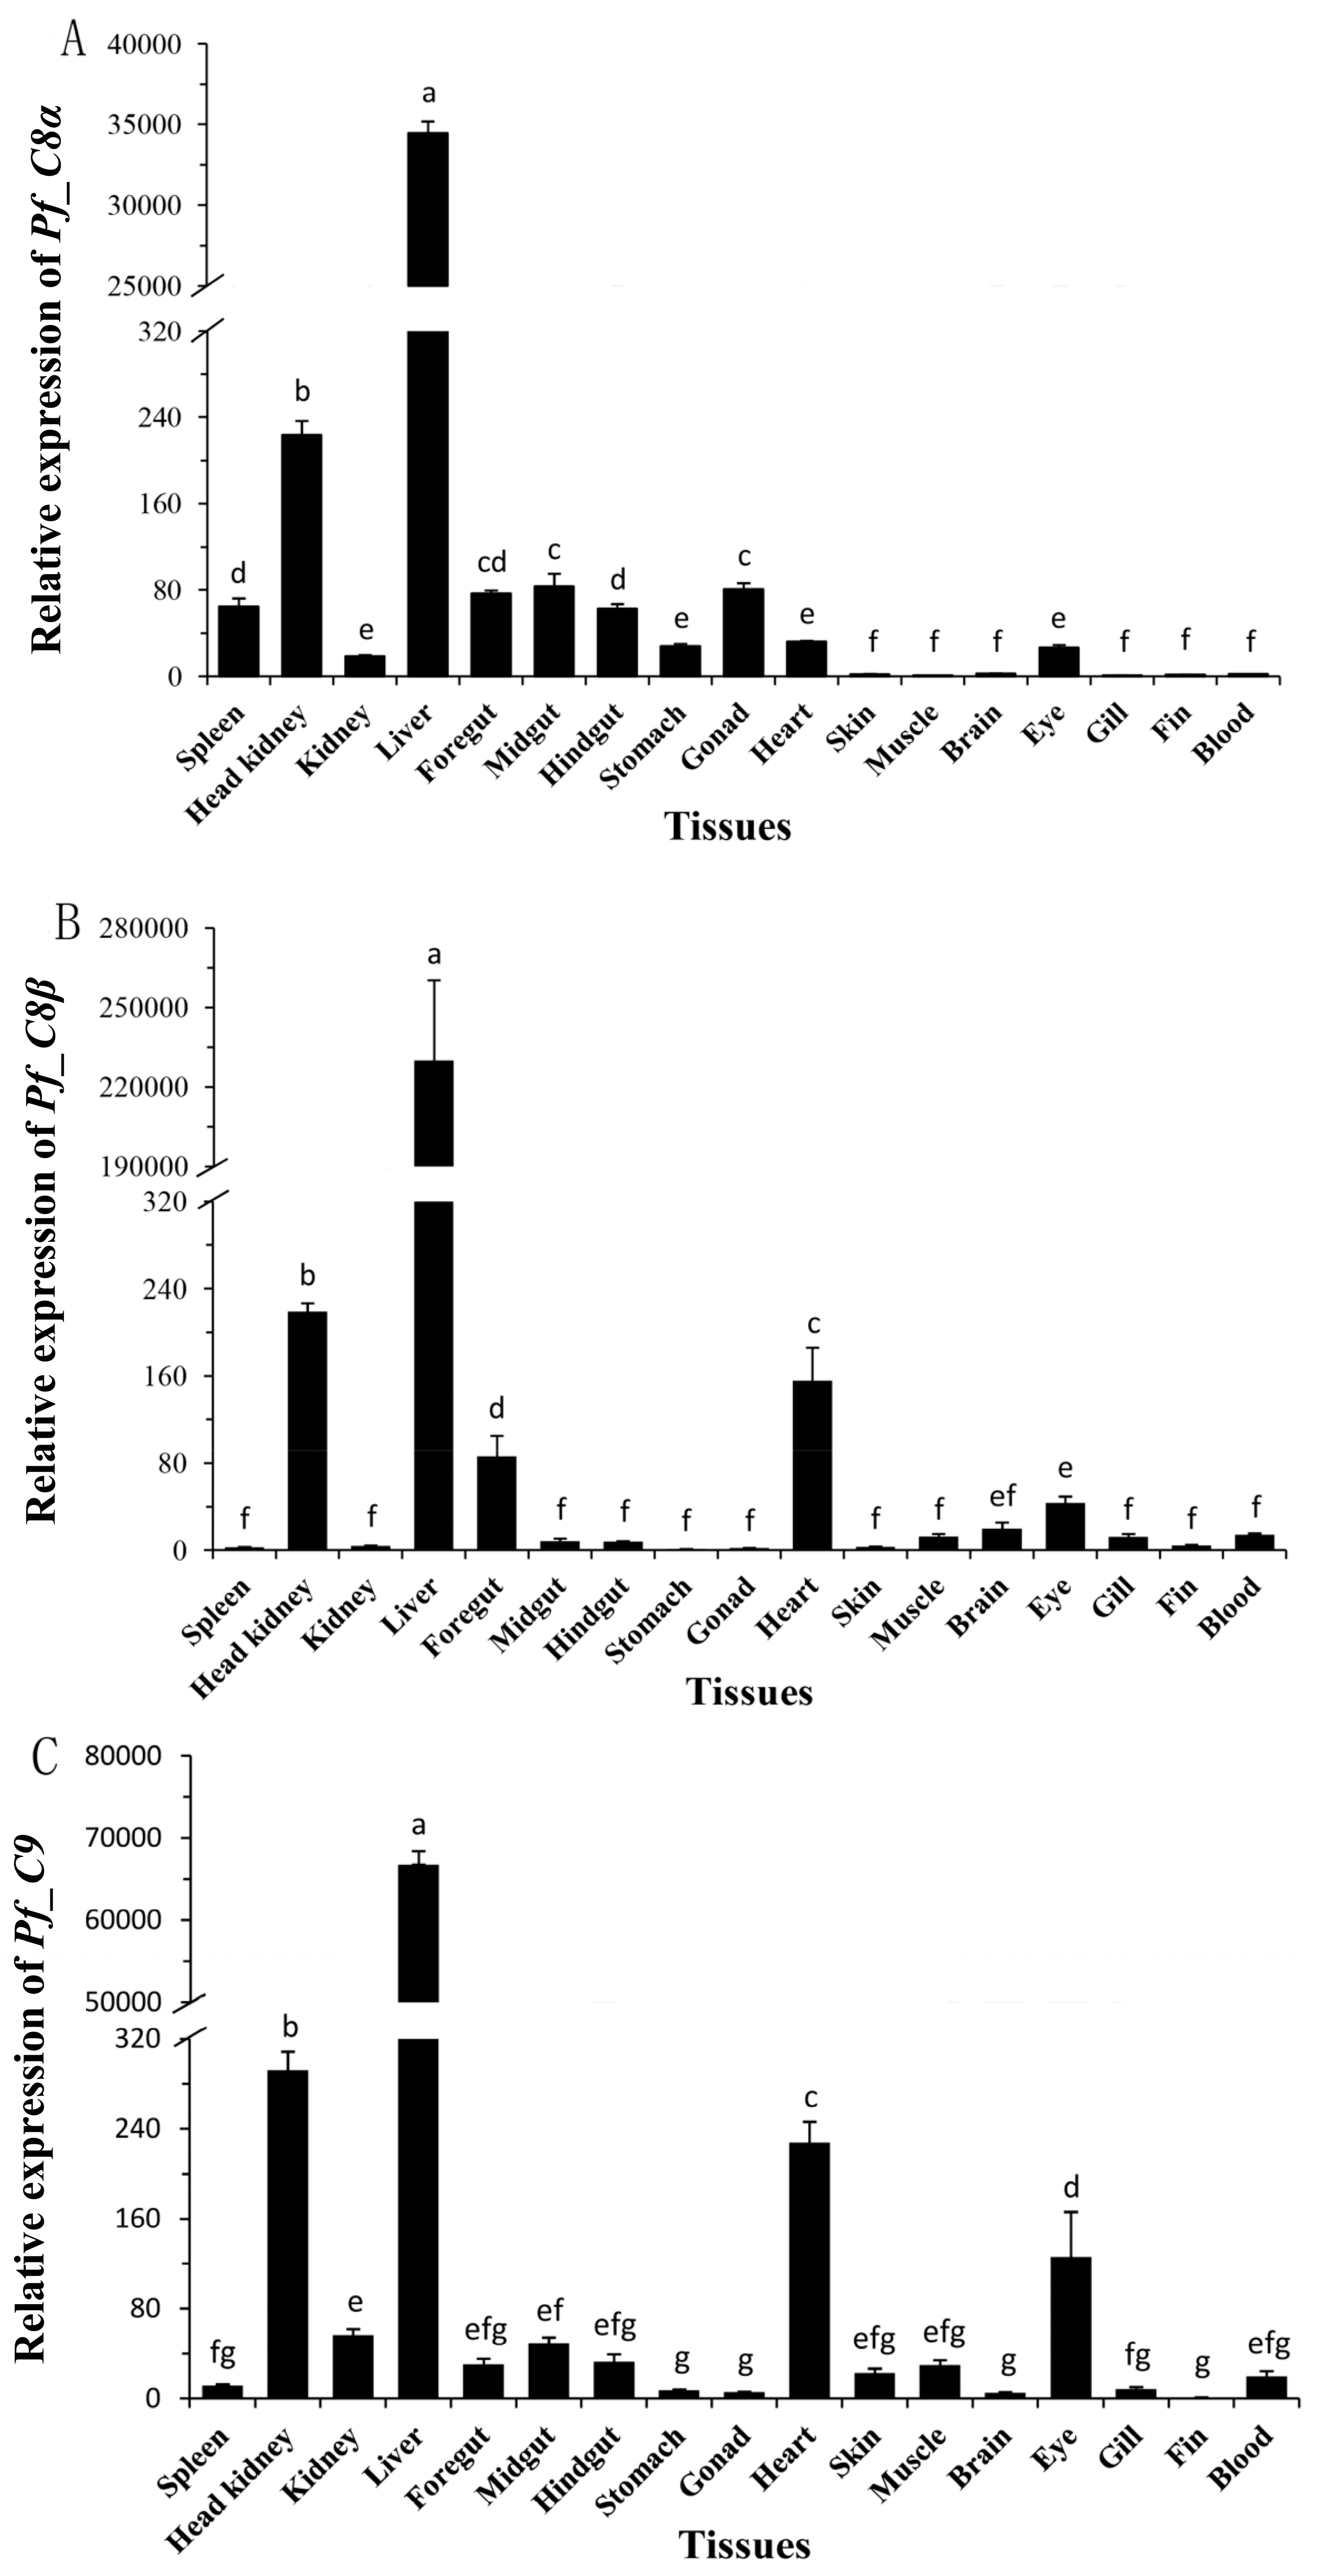
2.3. Quantitative Analyses of Pf_C8α, Pf_C8β and Pf_C9 mRNA Expression Levels in Adult Tissues

The tissue distributions of Pf_C8α, Pf_C8β and Pf_C9 mRNA expressions were detected by qPCR, and calibrated by β-actin mRNA expressions in the corresponding tissues, including blood, liver, spleen, brain, head kidney, kidney, foregut, midgut, hindgut, stomach, heart, gill, muscle, skin, fin, eye, and gonad. Expression levels of all three genes were greatest in the liver, followed by a relatively low level in the head kidney, foregut, midgut, hindgut, kidney, heart, and spleen, and a lower level still in the other tissues (p < 0.05) (Figure 4).

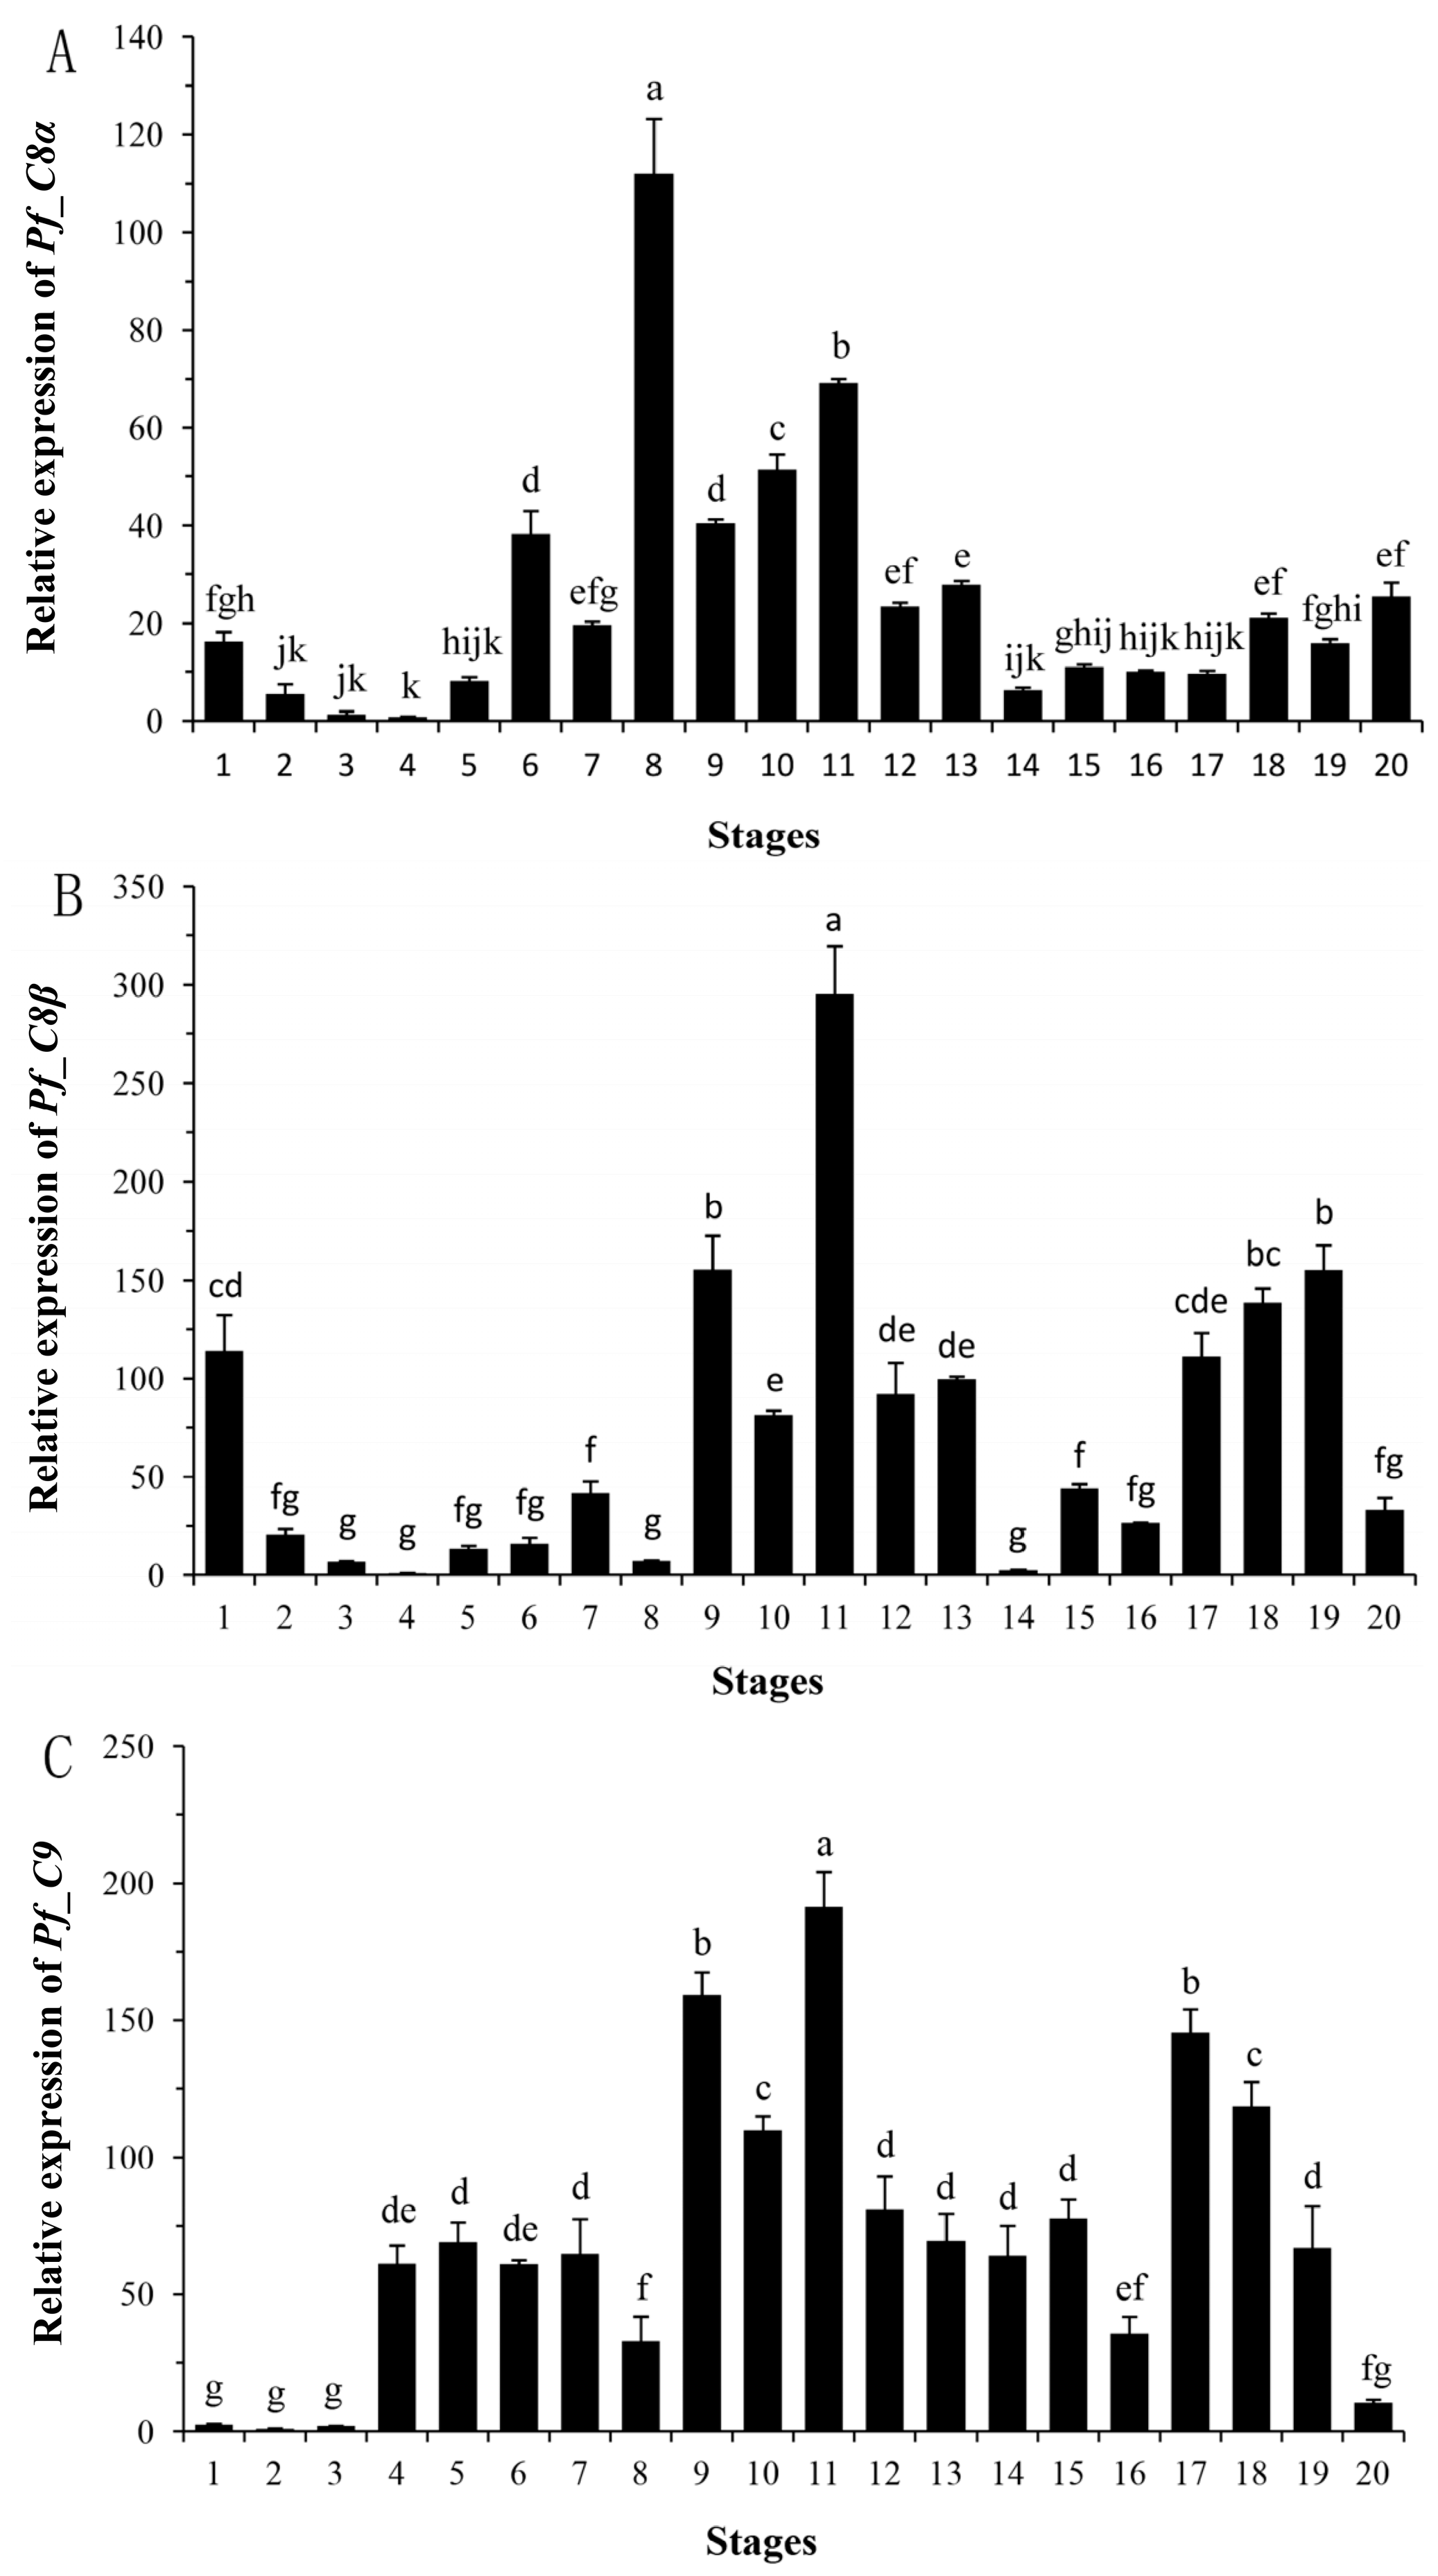
2.4. Quantitative Analyses of Pf_C8α, Pf_C8β and Pf_C9 mRNA Expression Levels during Early Developmental Stages

The relative expression levels of Pf_C8α, Pf_C8β and Pf_C9 mRNA were detected during the early developmental stages from fertilized eggs to 30 days post-hatching (dph) larvae (Figure 5). The expression of Pf_C8α mRNA was low until the neurula stage (Figure 5A, no. 5), and then increased to a moderate level at the somite appearance stage (Figure 5A, no. 6). It increased significantly to the highest value at the heart beat stage (Figure 5A, no. 8), then significantly decreased to a moderate level at the blood circulation stage (Figure 5A, no. 9) and was maintained in the newly hatched larval stage (Figure 5A, no. 11). The expression of Pf_C8α mRNA decreased significantly at 1–3 dph (Figure 5A, nos. 12, 13), and further decreased to a low level at 5 dph (Figure 5A, no. 14), and then fluctuated until 30 dph (Figure 5A, no. 20).
The gene expression of Pf_C8β was moderate at the fertilized egg stage (Figure 5B, no. 1). It then significantly decreased to a low level at the cleavage stage (Figure 5B, no. 2) and was maintained until the heart beat stage (Figure 5B, no. 8). It increased significantly to a moderate level at the blood circulation stage (Figure 5B, no. 9), and further increased significantly to its highest level at the newly hatched larval stage (Figure 5B, no. 11). After hatching, the expression of Pf_C8β mRNA decreased significantly to a moderate level at 1–3 dph (Figure 5B, nos. 12, 13), further decreased to a low level at 5 dph (Figure 5B, no. 14) and was maintained until 11 dph (Figure 5B, no. 16). Subsequently, the mRNA expression increased significantly to a moderate level at 15 dph (Figure 5B, no. 17), was maintained until 25 dph (Figure 5B, no. 19), and finally decreased to a low level at 30 dph (Figure 5B, no. 20).
The gene expression of Pf_C9 was low during the early embryonic period from the fertilized egg to the blastula stage (Figure 5C, nos. 1–3). It then increased to a moderate level at the gastrula stage (Figure 5C, no. 4), and was maintained until the muscular effect stage (Figure 5C, no. 7). After a significant decrease at the heart beat stage (Figure 5C, no. 8), the mRNA expression increased significantly to a high level at the blood circulation stage (Figure 5C, no. 9), and reached its highest value at the newly hatched larval stage (Figure 5C, no. 11). After hatching, the expression of Pf_C9 mRNA decreased significantly to a moderate level at 1–7 dph (Figure 5C, nos. 12–15), and further decreased to a low level at 11 dph (Figure 5C, no. 16). Subsequently, the mRNA expression increased significantly to a high level at 15 dph (Figure 5C, no. 17), and then decreased gradually to a low level at 30 dph (Figure 5C, no. 20).

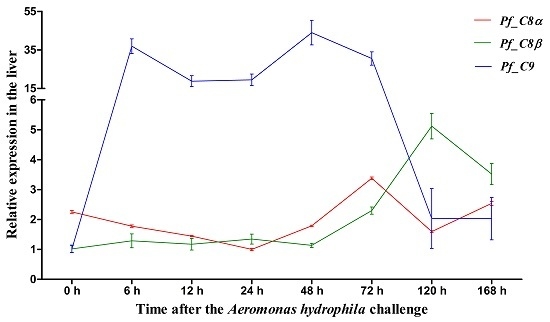
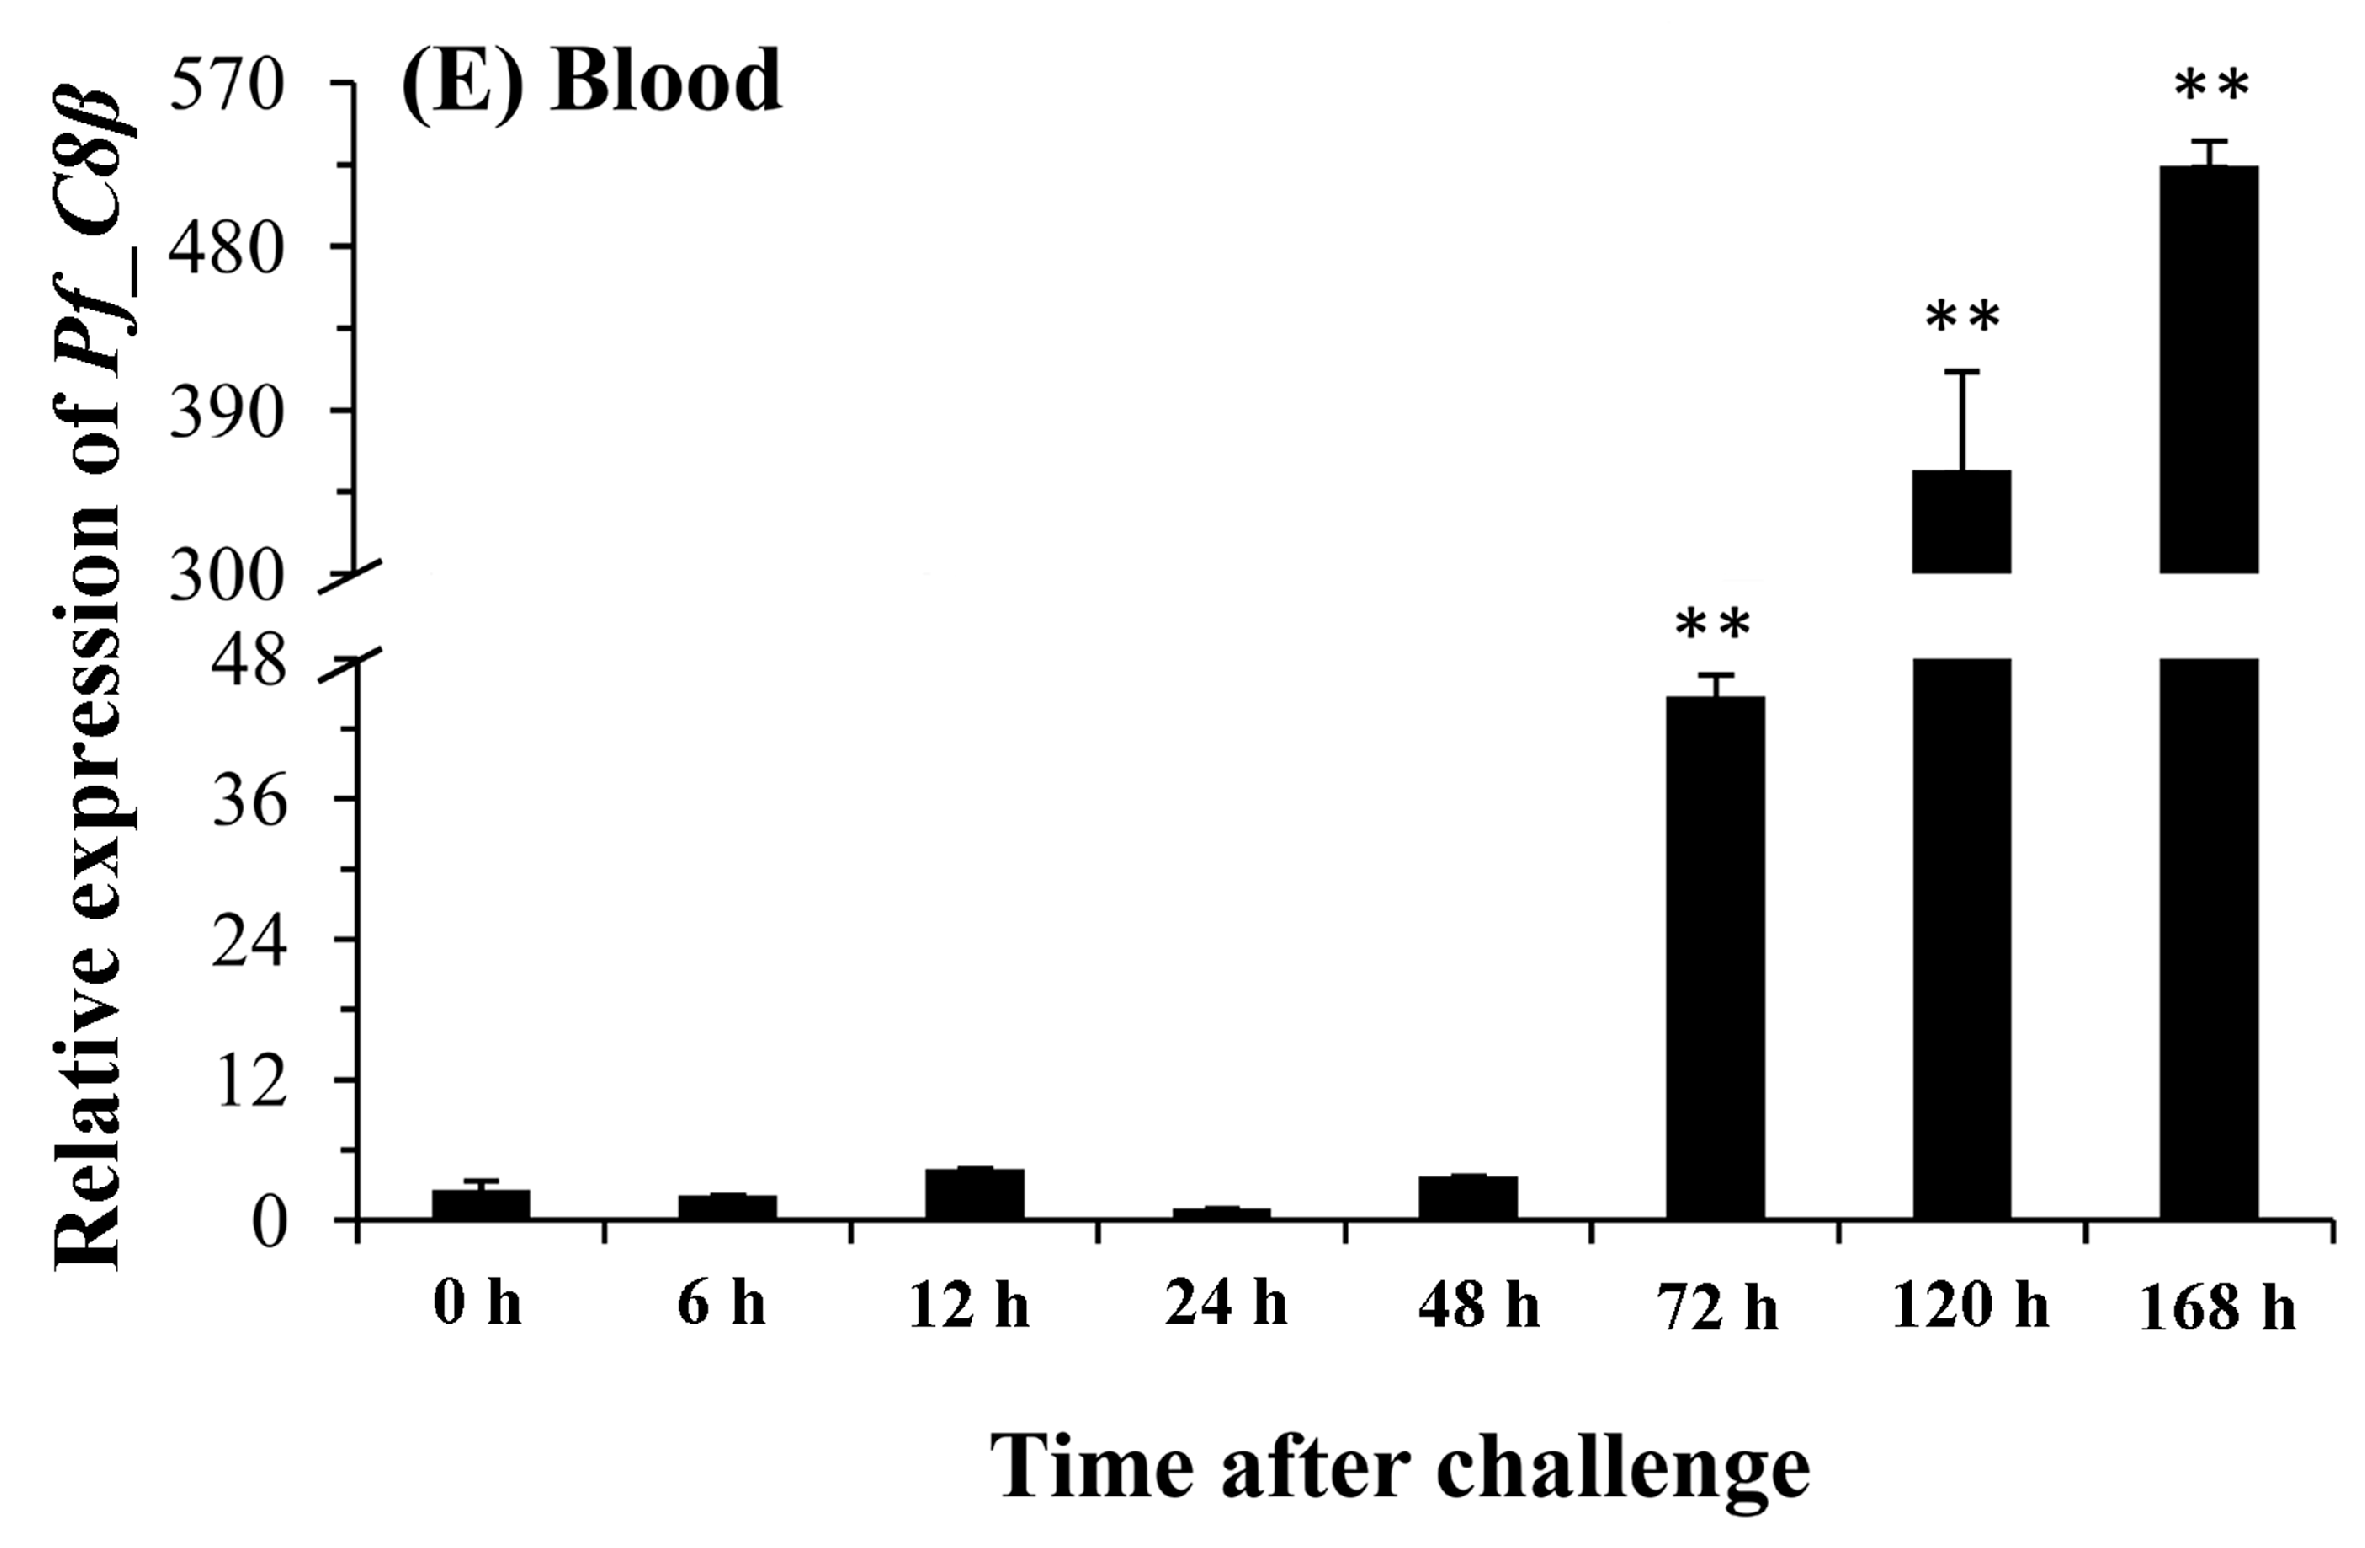
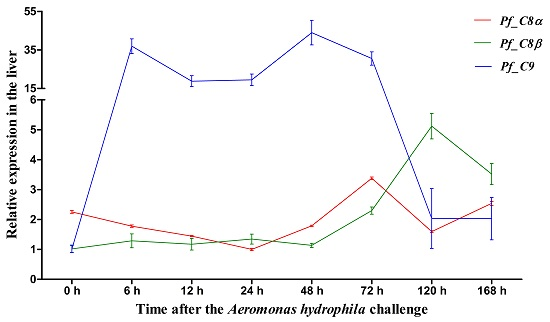
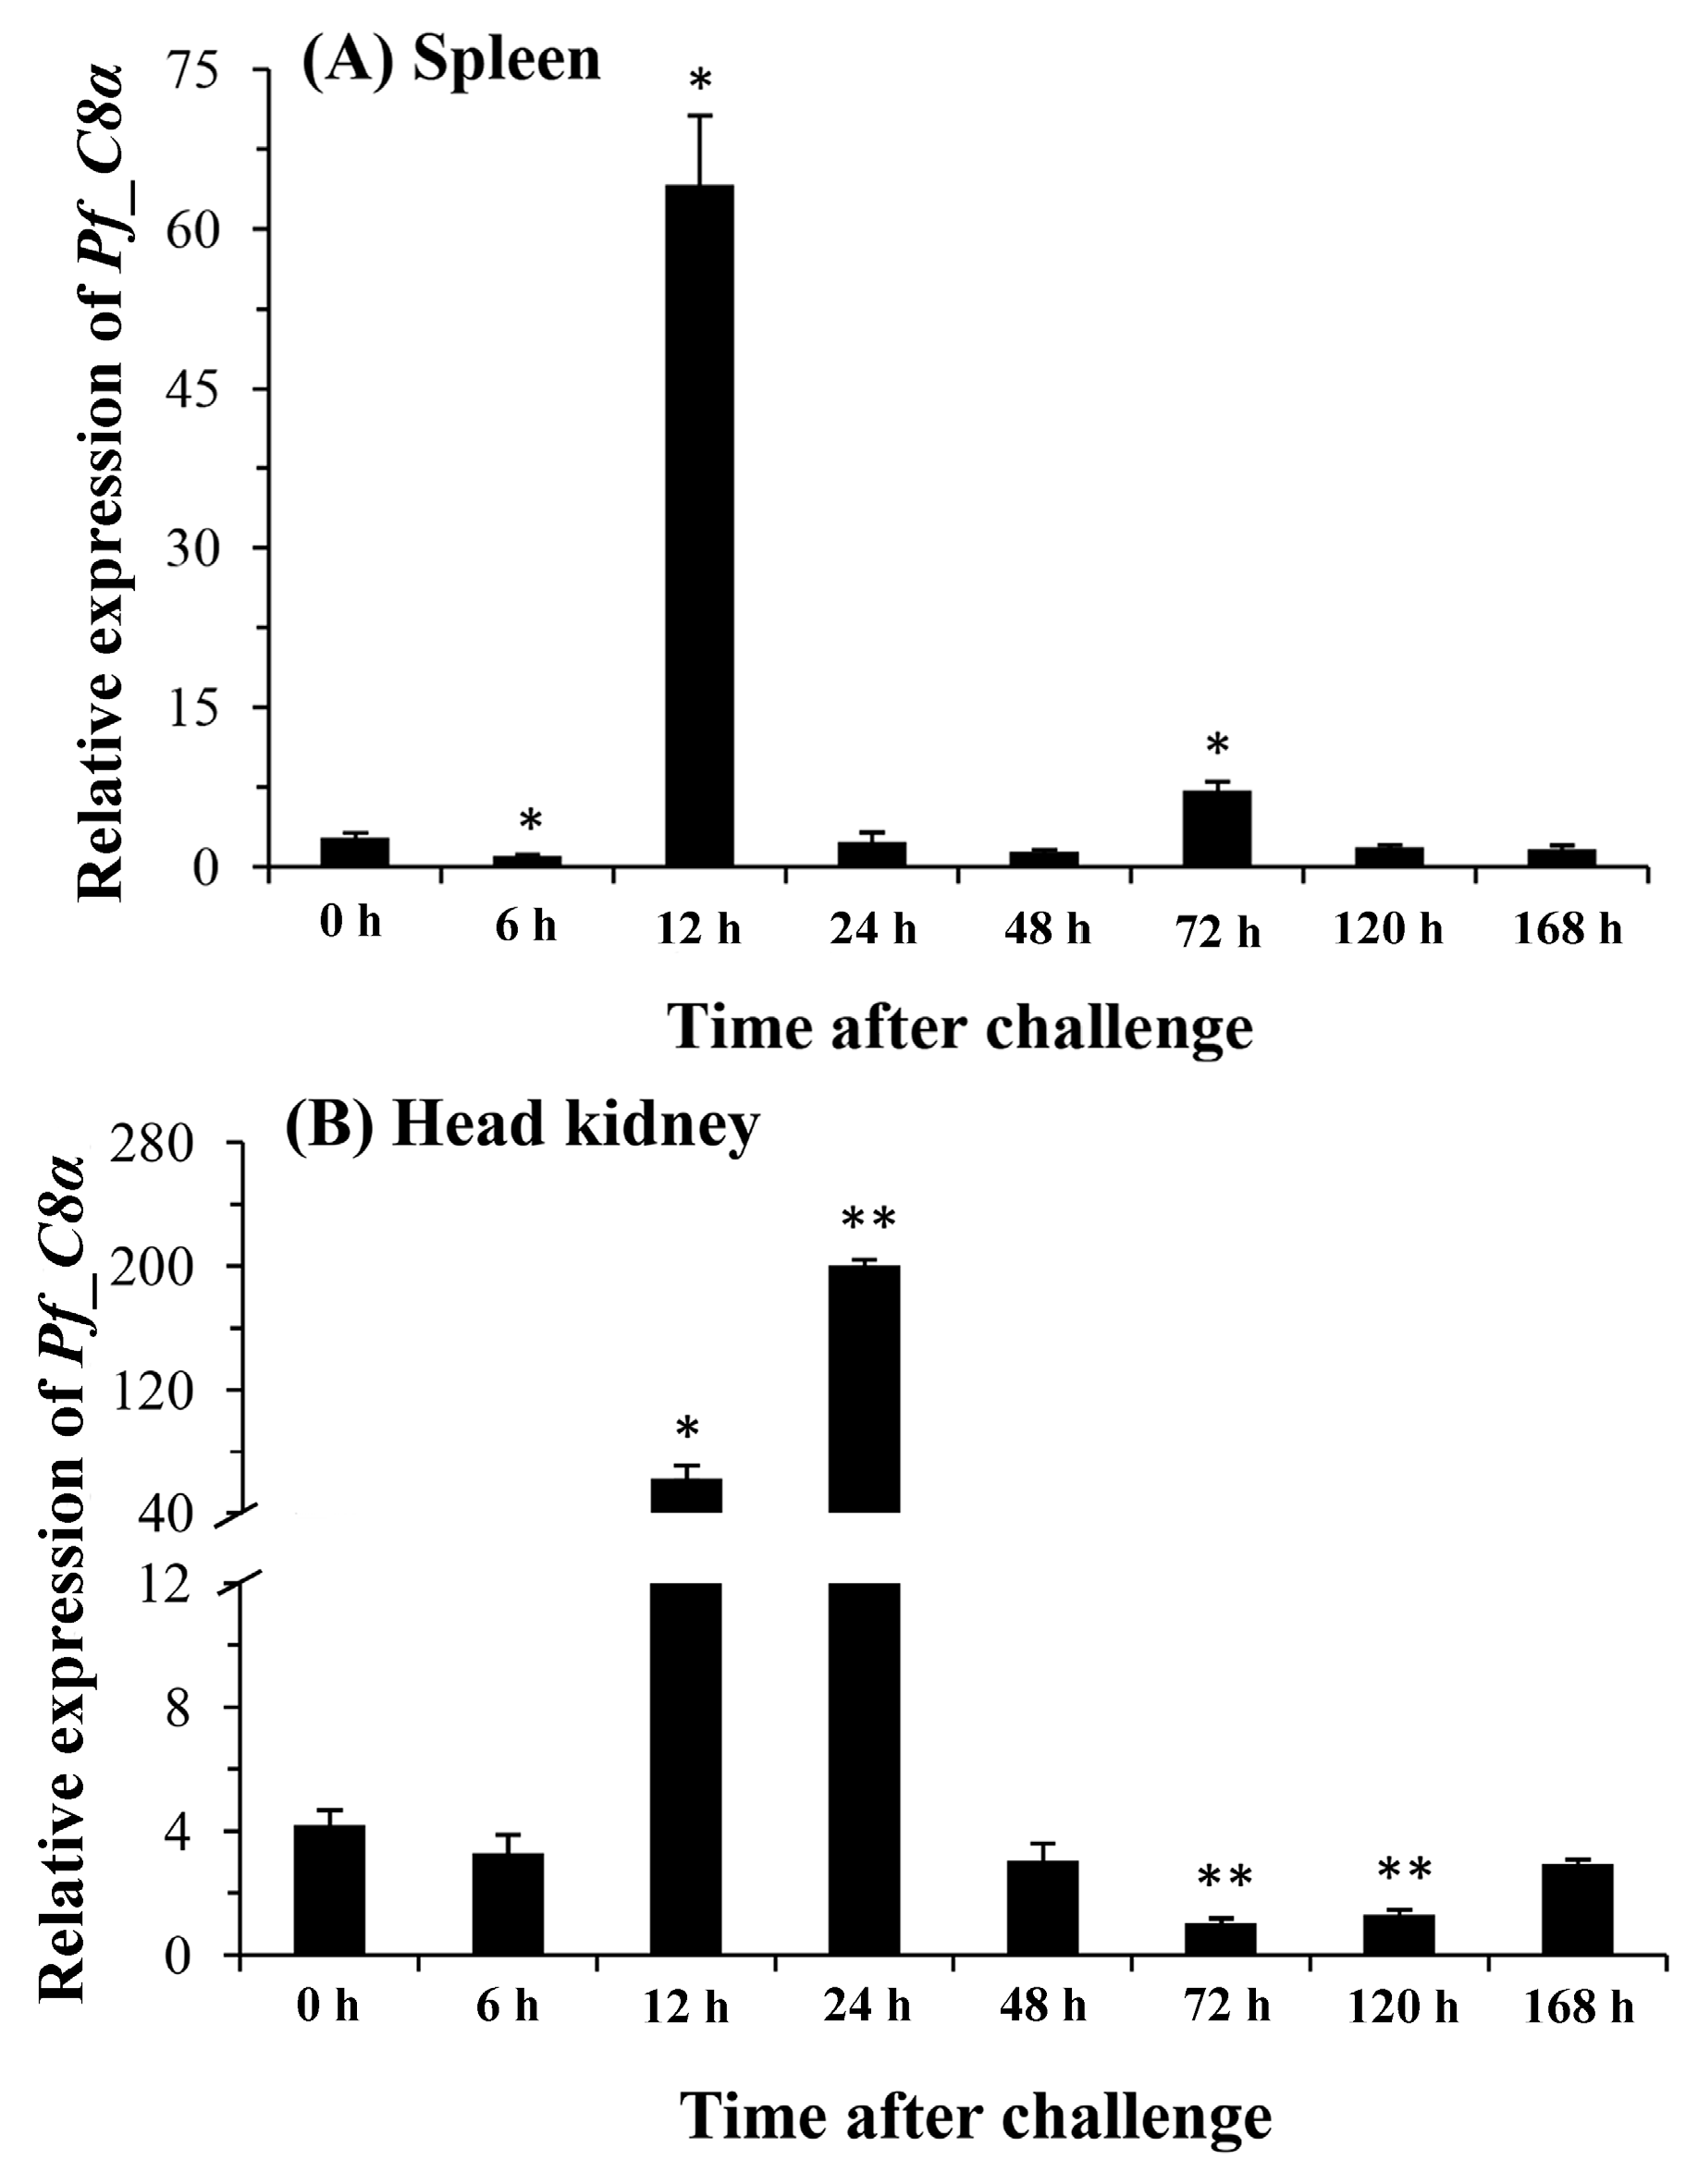
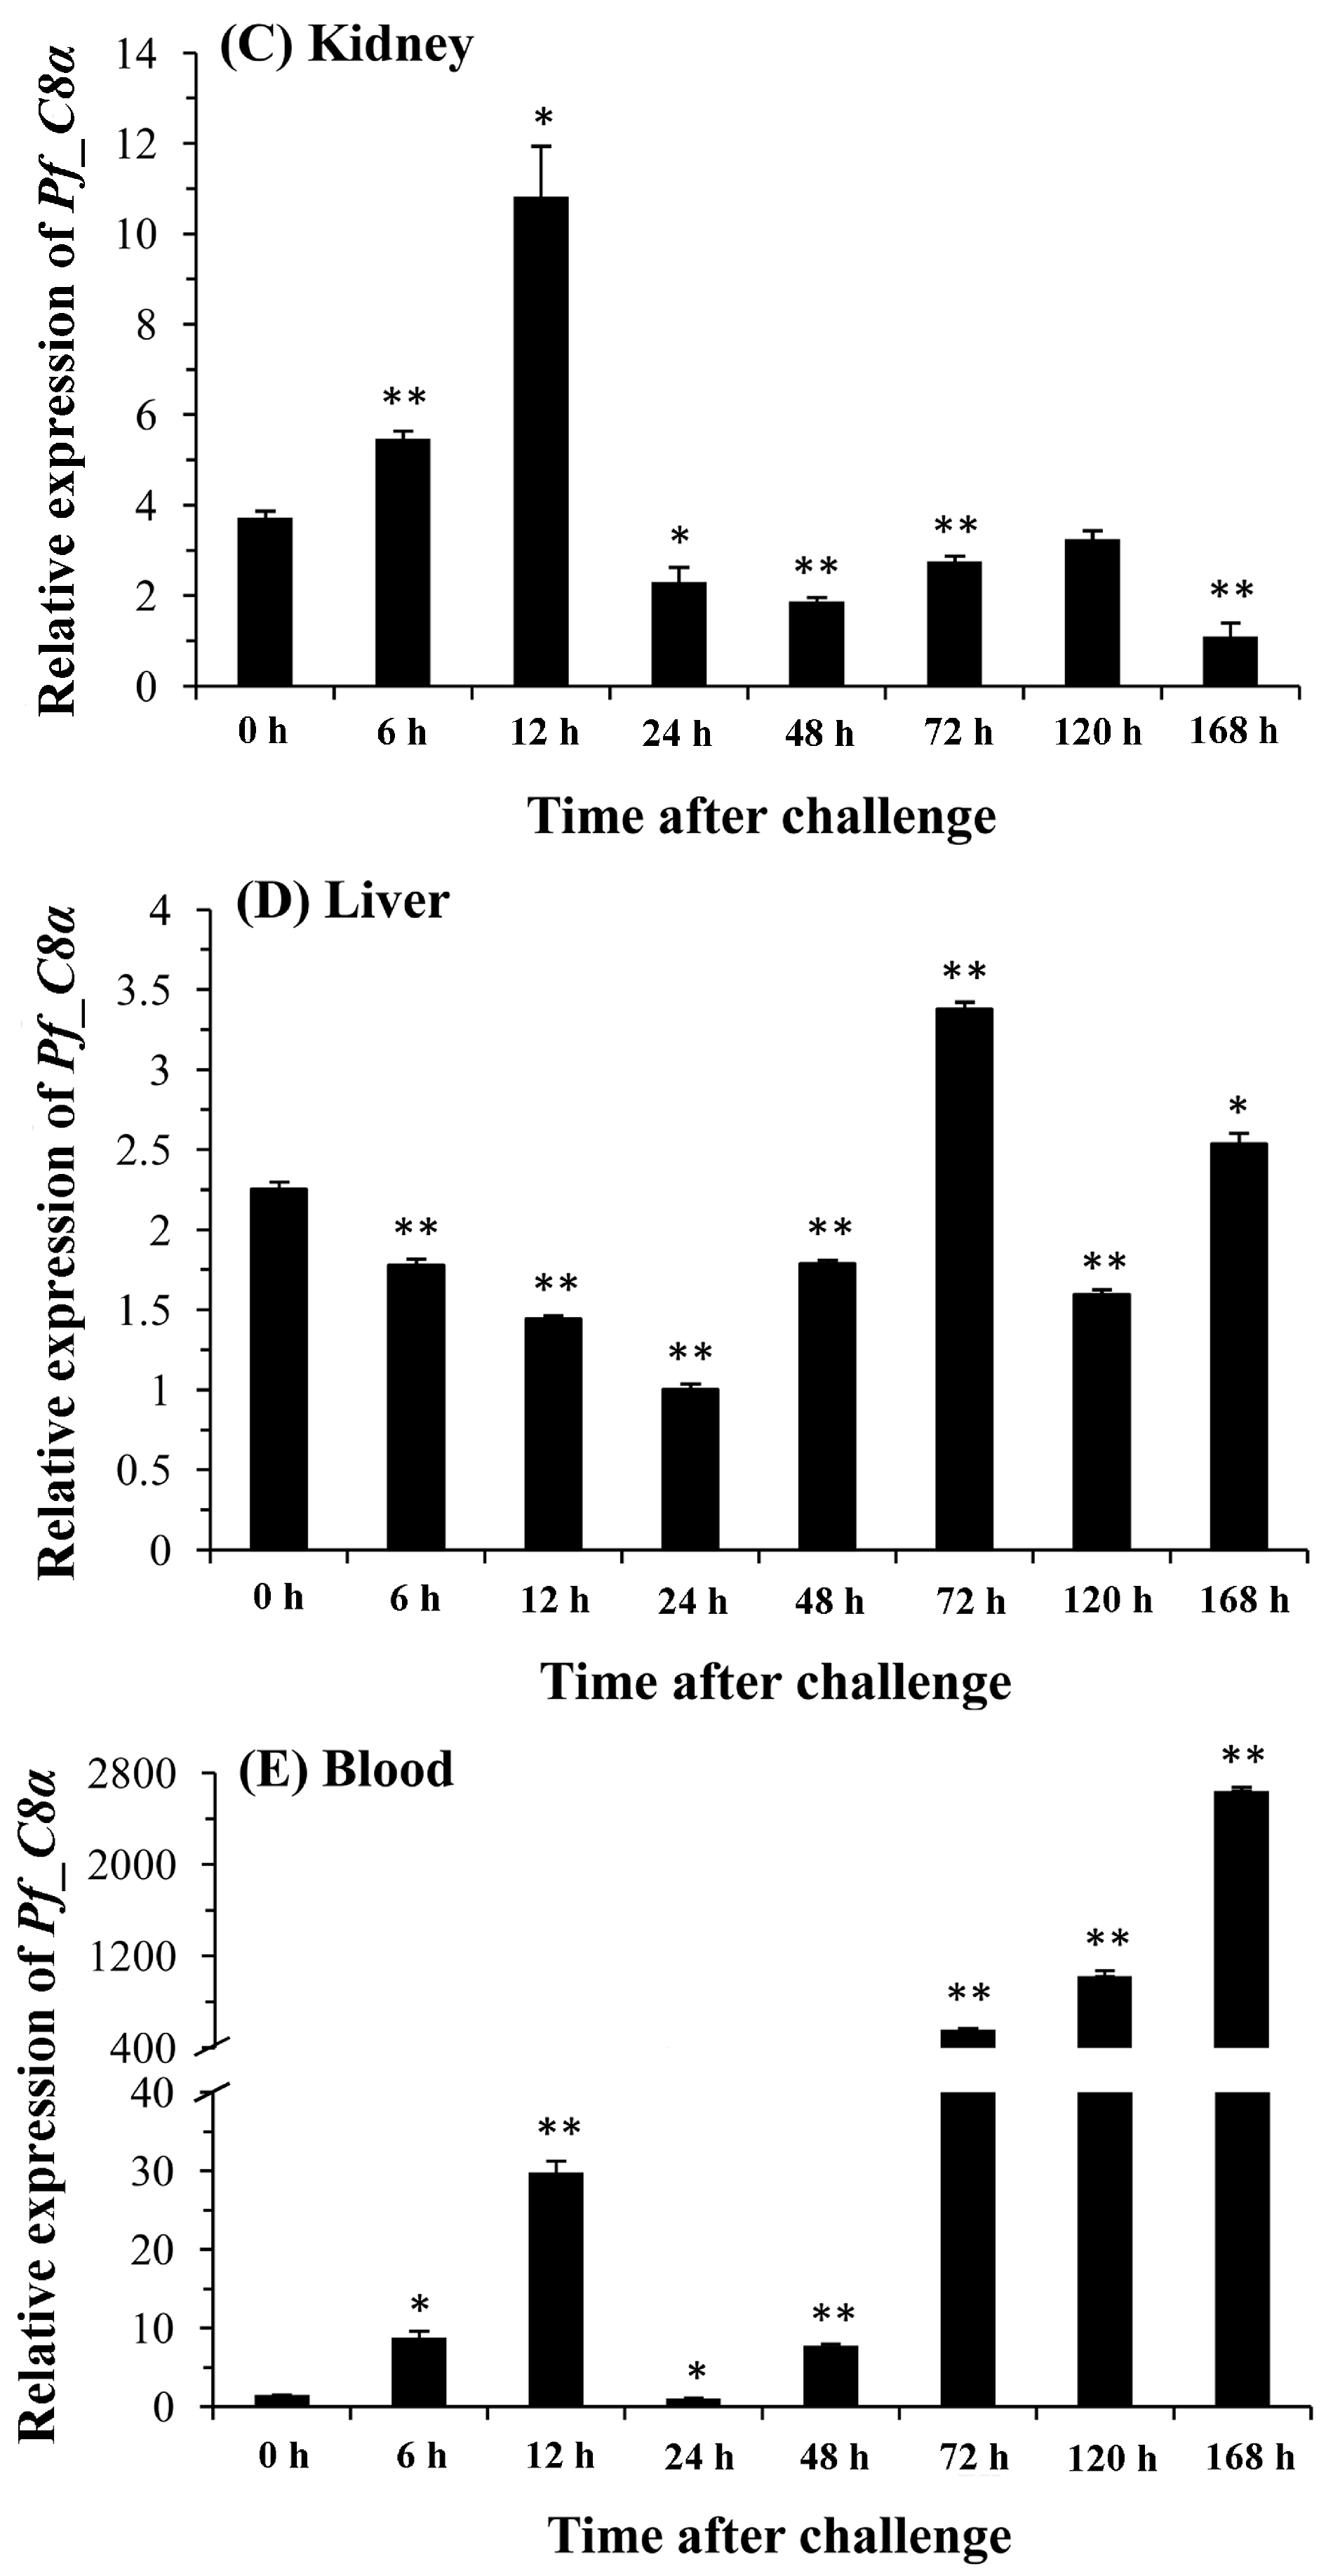
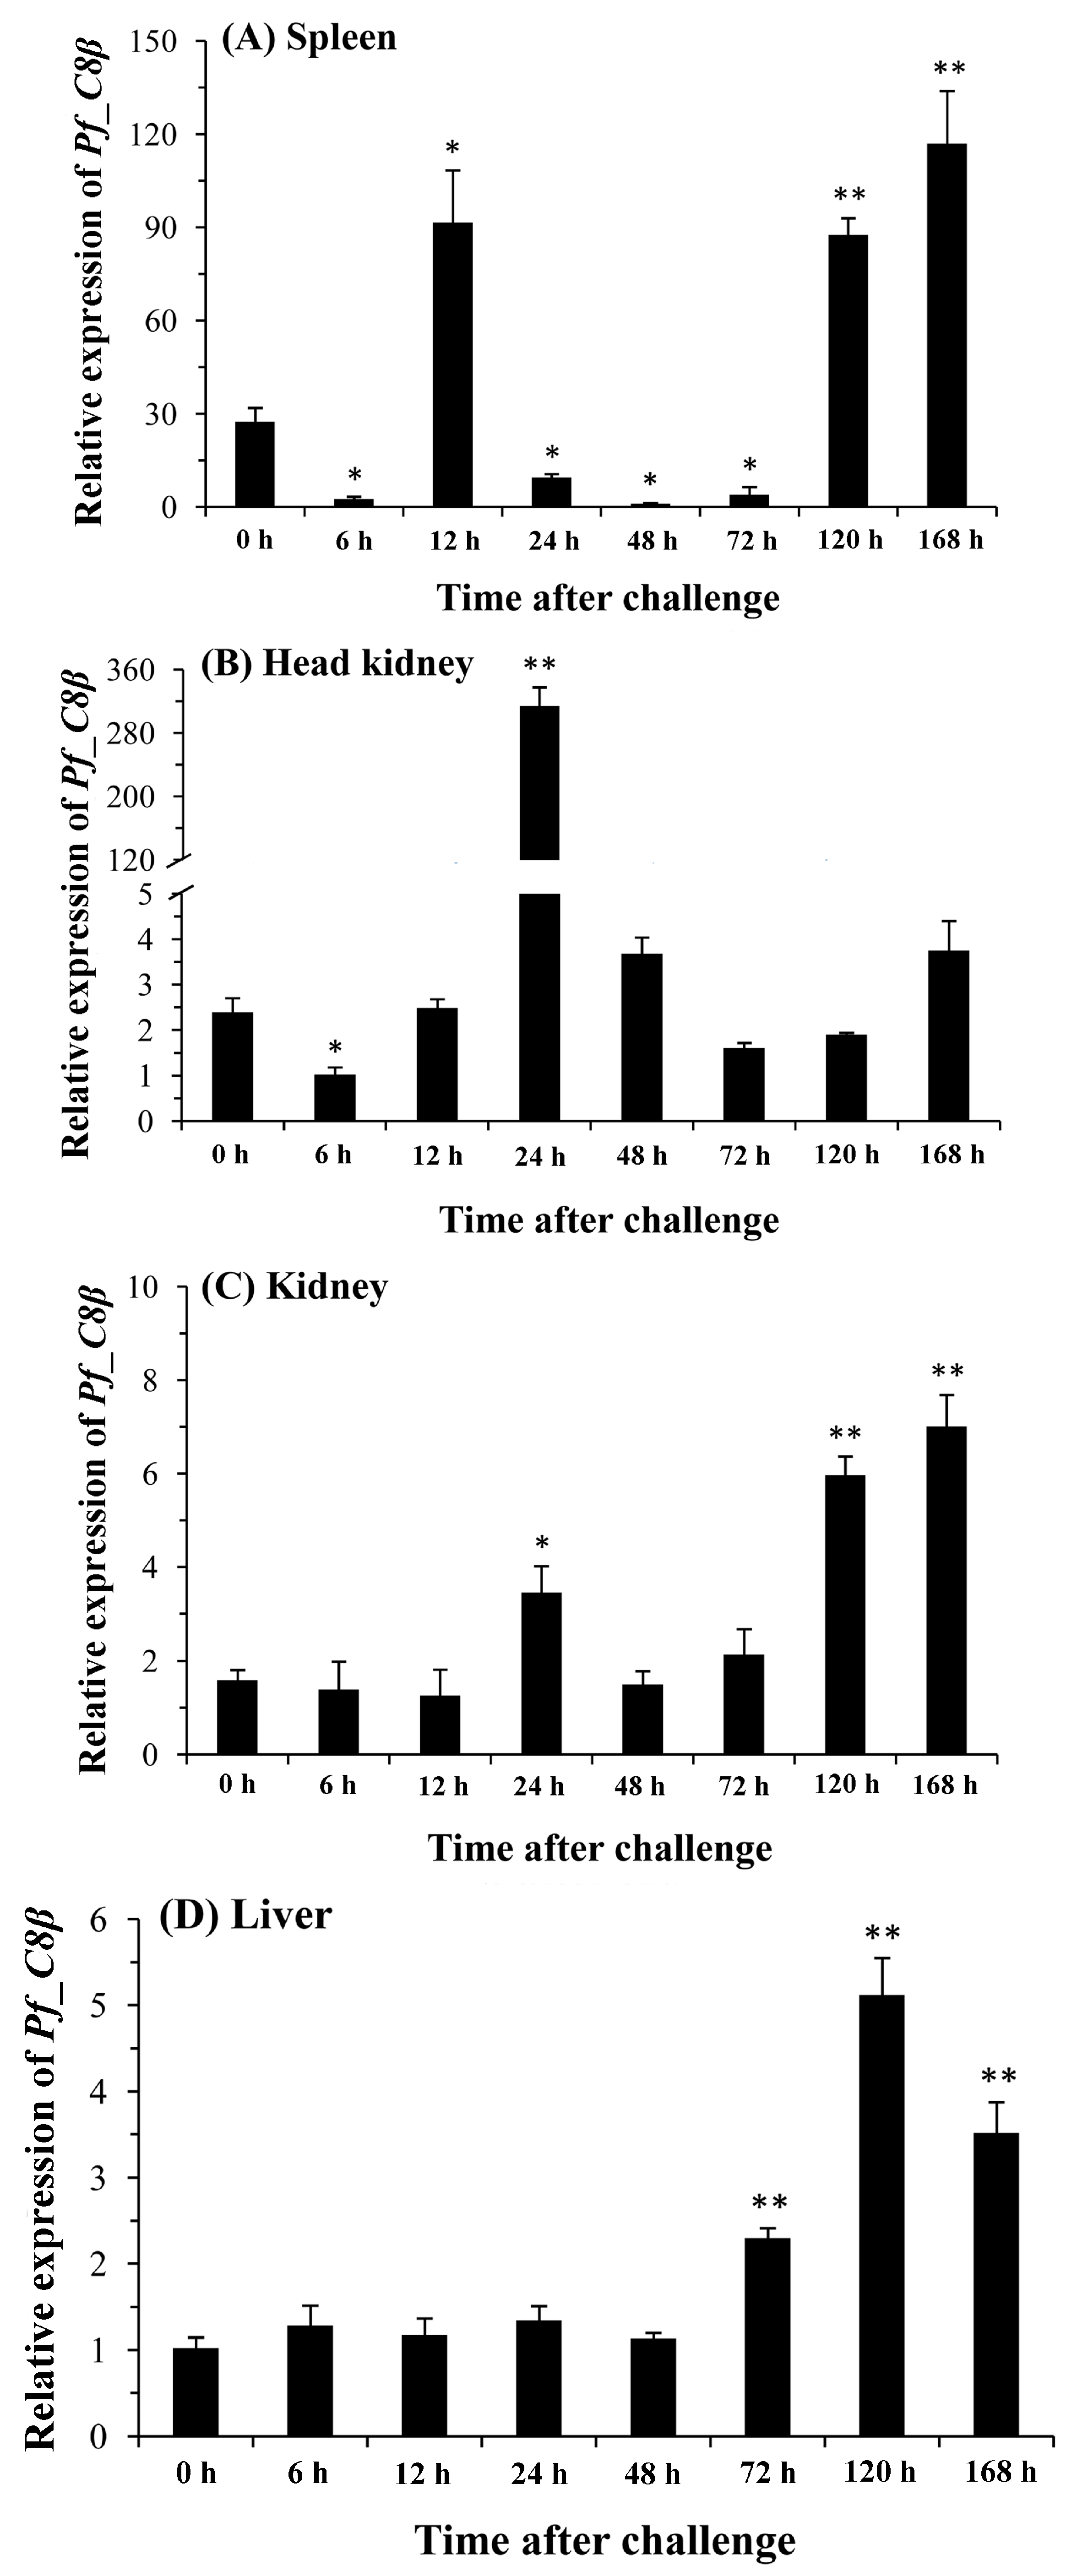
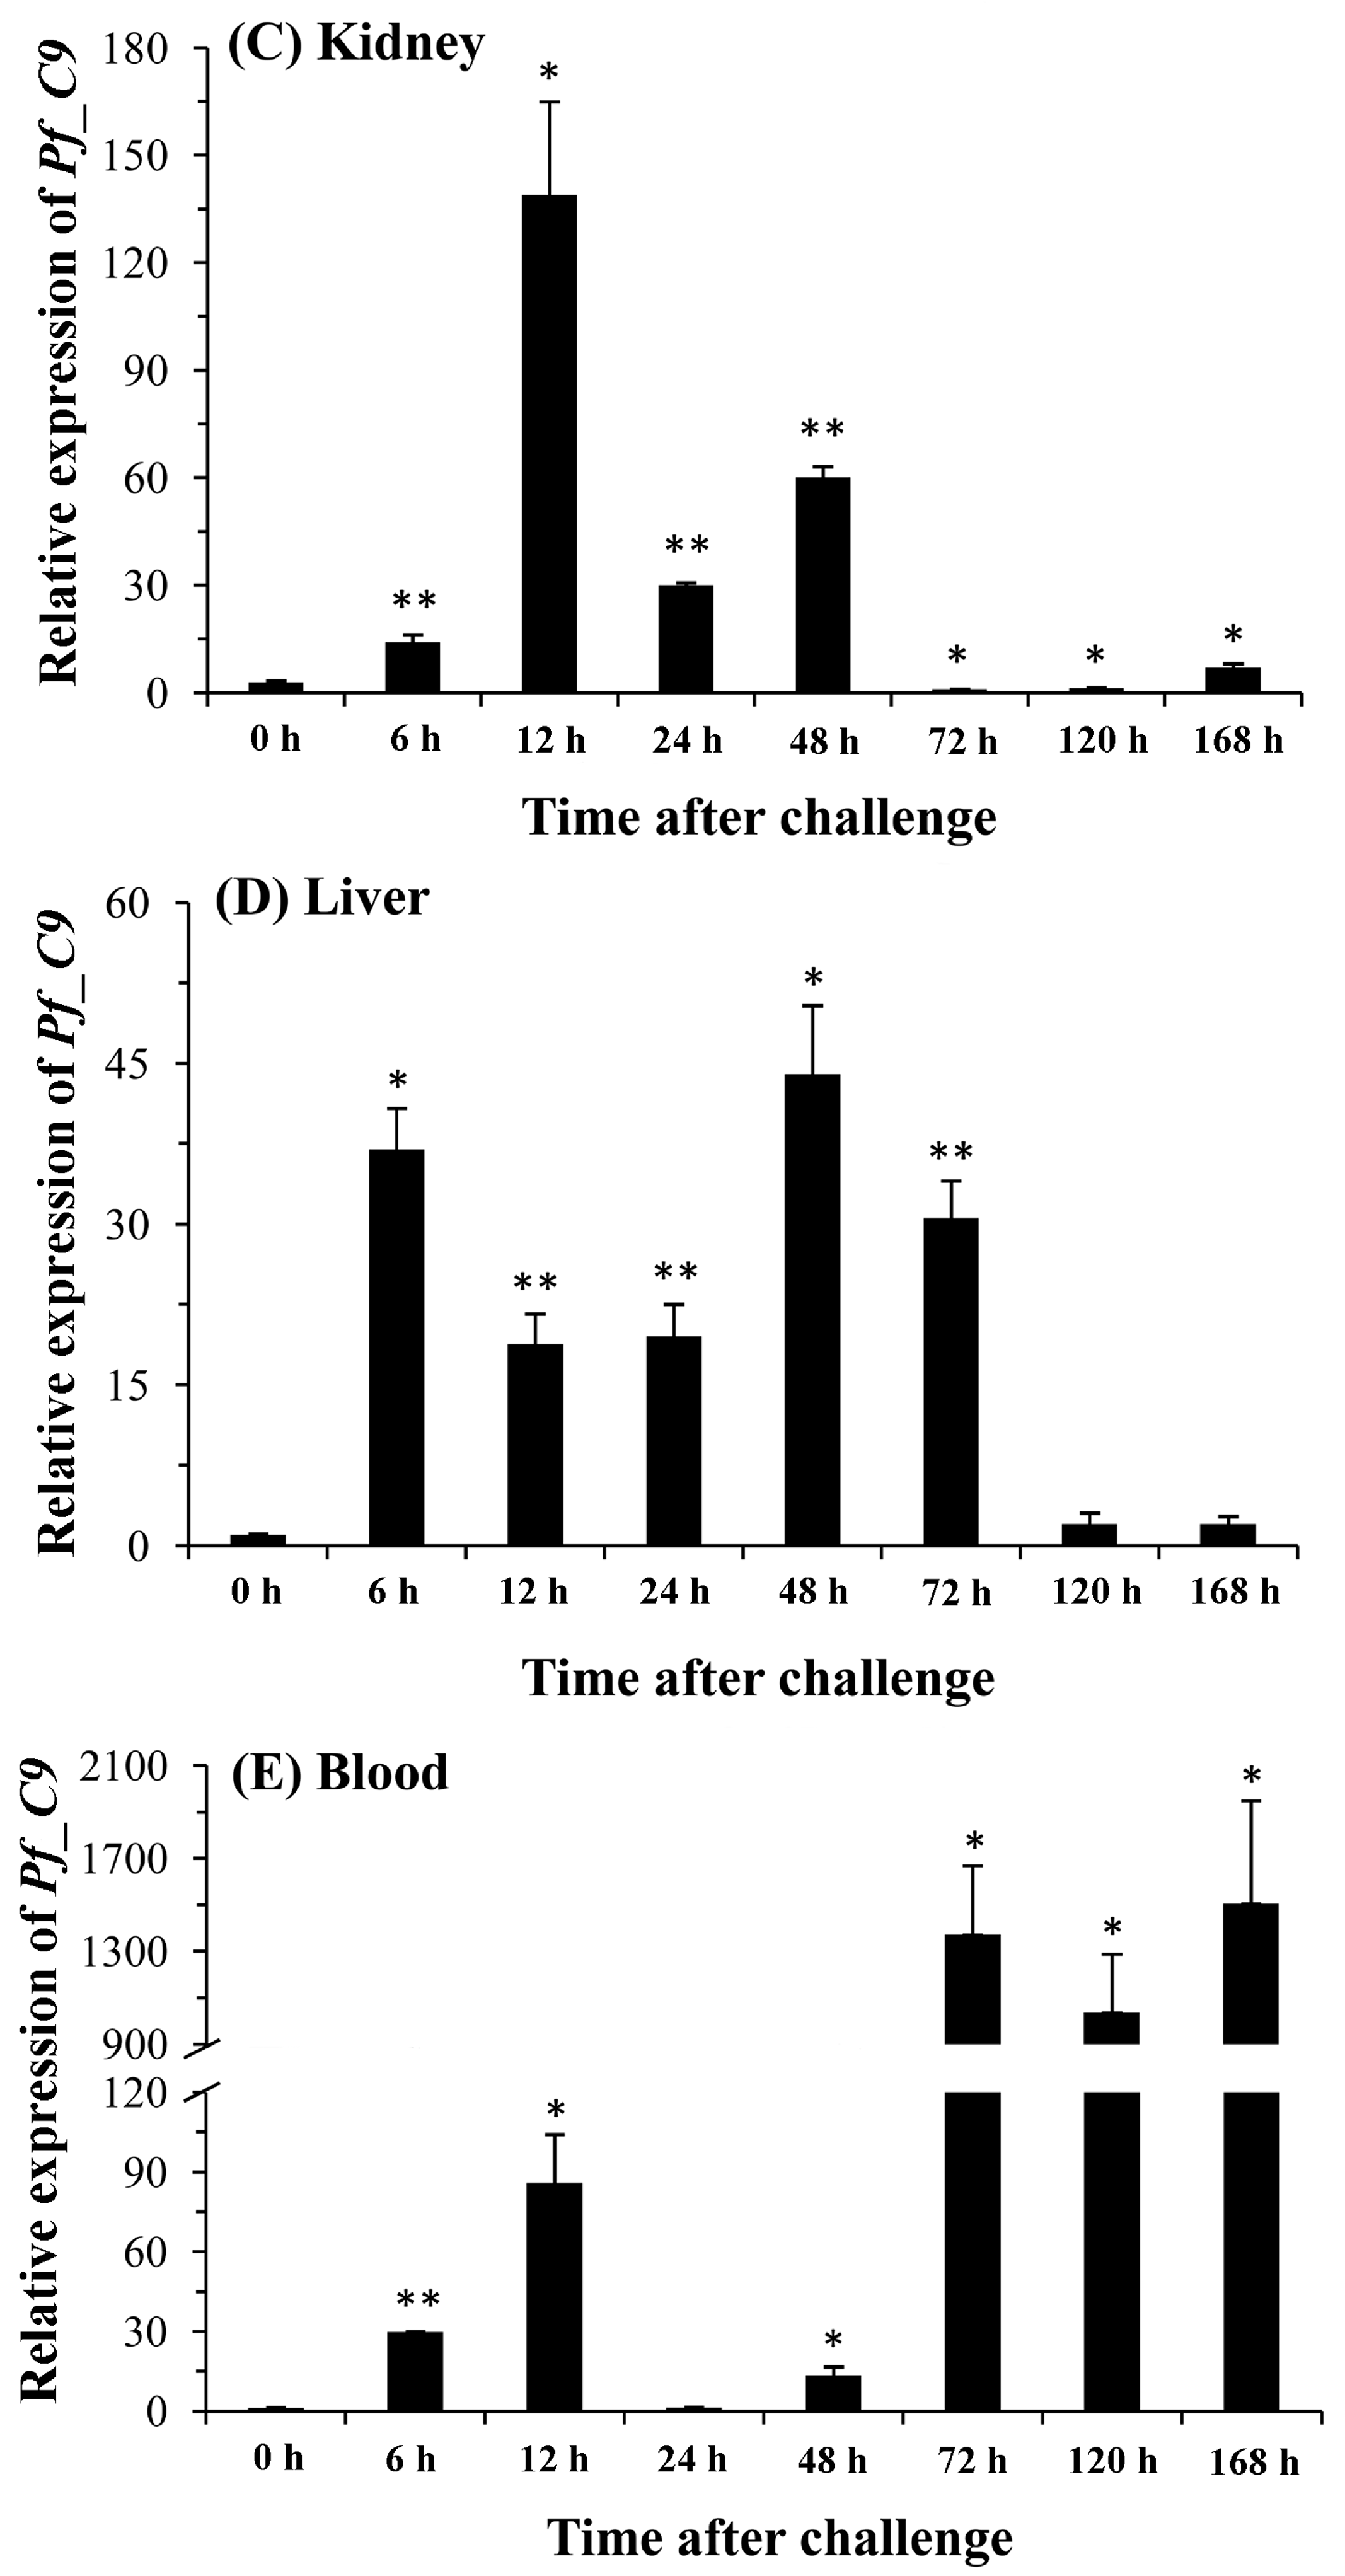
2.5. Quantitative Analysis of Pf_C8α, Pf_C8β and Pf_C9 mRNA Expression Levels in Five Tissues after Challenges of A. hydrophila

Expression levels of the Pf_C8α gene in the spleen, head kidney, kidney, liver, and blood after the A. hydrophila challenge were measured by qPCR (Figure 6). In the spleen and kidney, expressions increased significantly to a peak level at 12 h post-injection. This peak appeared at 72 h post-injection in the liver. In the head kidney, the expression level was significantly up-regulated at 12 h and reached a peak at 24 h post-injection. The expression level in the blood increased significantly from 72 to 168 h and reached a peak at 168 h post-injection.
Expression levels of the Pf_C8β gene in the spleen, head kidney, kidney, liver, and blood after the A. hydrophila challenge were measured by qPCR (Figure 7). In the spleen, kidney and blood, expressions were significantly up-regulated at 120 h and reached a peak level at 168 h post-injection. The expression in the head kidney increased significantly to a peak level at 24 h post-injection. This peak appeared at 120 h post-injection in the liver.
Expression levels of the Pf_C9 gene in the spleen, head kidney, kidney, liver, and blood after the A. hydrophila challenge were measured by qPCR (Figure 8). In the spleen and kidney, expressions increased significantly to a peak at 12 h post-injection. This peak appeared at 48 h post-injection in the liver. The expression level in the head kidney was significantly up-regulated at 12 h and reached a peak at 24 h post-injection, whereas the expression level in the blood increased significantly from 72 to 168 h and reached a peak at 168 h post-injection.

3. Discussion

Yellow catfish is one of the most important economic freshwater species in China [45]. In recent years, the artificial culture of this species has been affected by several kinds of diseases, especially bacterial infection. Because it is known that fish C8 and C9 genes are essential components in forming the pore-like MAC of complement on bacterial cells [46]. We isolated, sequenced and characterized three genes of the terminal complement components from yellow catfish to better understand their roles in the innate immune system. The deduced amino acid sequences of the Pf_C8α, Pf_C8β and Pf_C9 genes showed greatest similarity to those of other vertebrates. Like most other teleosts, the Pf_C8α, Pf_C8β and Pf_C9 genes of yellow catfish all have two TSP 1 domains, an LDLR-A domain, a MACPF domain and an EGF domain. The results suggest that the functionally mature regions of Pf_C8α, Pf_C8β and Pf_C9 are more conserved than their signal peptides, and demonstrate that the three genes are indeed C8α, C8β and C9 genes [8,12]. In the C-terminal region, the Pf_C9 gene has a second TSP 1 domain compared with mammalian counterparts, as previously reported for grass carp [27], Japanese flounder [47] and rainbow trout [30]. The second TSP 1 of C9 sequence is one of the distinctive features present in fish [24]. For other TCC genes, the second TSP 1 domain in the C-terminal region is commonly reported, i.e., C6, C7, C8 [31,32,33]. Thus, both the Pf_C8α and Pf_C8β genes have the repeat TSP 1 region in the C-terminal. Moreover, the second TSP 1 of each of the Pf_C8α, Pf_C8β and Pf_C9 sequences contains a C-mannosylation motif (WXXWXXW). The result of phylogenetic analysis of the three complement genes was similar to the BLAST result, and the evolutionary relationship of yellow catfish with other fish and vertebrates in the NJ phylogenetic tree was consistent with the traditional systematics. These unique characteristics and the high homology to other known vertebrates suggest that the Pf_C8α, Pf_C8β and Pf_C9 sequences belong to the MACPF super family of the complement system.
In mammals, the liver tissue is the major organ of synthesis for the majority of the complement components [48]. In rock bream, the expressions of the C8α, C8β and C9 genes in the liver were greater compared to other tissues (blood, skin, muscle, heart, brain, head kidney, spleen, kidney, gill, and intestine) [24,26]. In whitespotted bamboo shark (Chiloscyllium plagiosum), the C8α and C9 genes were extremely high expressed in the liver, with much less or even undetectable expression in other tissues (spleen, heart, fin, gastro, brain, intestine, and muscle) [49,50]. In the current study, Pf_C8α, Pf_C8β and Pf_C9 transcripts were most highly expressed in the liver, while their expressions were lower or much lower in the other tissues. Our results support previous findings for other healthy fish: TCC genes are mainly expressed in the liver and constitutively expressed in other tissues, because the liver plays a crucial role in controlling innate immunity, which is highly associated with the immune defense against bacterial infection [51]. Therefore, the liver may be the main source of Pf_C8α, Pf_C8β and Pf_C9 for yellow catfish, while other tissues may also contribute to their synthesis.
There have been limited studies on expressions of C8α, C8β and C9 mRNA during the early developmental stages of fish. The complement components are present early in the development of fish, before or soon after hatching [52]. In common carp (Cyprinus carpio haematopterus), expressions of the C8α and C8β genes were detected at different early developmental stages, whereas expression of the C9 gene was not detected at the blastula stage, gastrula stage or tail-bud stage, but it was detected at the stage of heart beating and then fluctuated until 5 dph [53]. For other TCC genes, the transcript of C6 gene in grass carp was detected in unfertilized eggs, the expression level was lower before heart beating and was significantly up-regulated from 1 to 7 dph [35]. Previous research has shown that most of the main immune genes are maternally transferred into eggs during vitellogenesis of fish [54]. Wang et al. (2008) found that transcripts of both C3 and Bf genes of the complement system were present in the newly fertilized eggs of zebrafish, and suggested that they are maternal complement components [55]. Lechniak et al. (2008) demonstrated that major genome activation in zygotes occurs at the 8–16 cell stage in vertebrates [56]. In the present study, transcripts of the Pf_C8α, Pf_C8β and Pf_C9 genes were detected in the newly fertilized egg of yellow catfish, and then they were significantly decreased to a low level at the cleavage stage and were maintained until the blastula stage. These results suggest that the transcripts of these three genes are likely to be derived from maternal copies. In general, newly fertilized eggs are immediately exposed to pathogenic microbes in the aquatic environment. One previous study showed that the complement-mediated killing of pathogenic microbes generally occurs in the early embryonic developmental stages of fishes [55]. Therefore, transferred maternal complement components of yellow catfish might be involved in the early defense against microbial attacks in the aquatic environment during early embryonic development. At the heart beat stage, the expression of the Pf_C8α gene was quickly up-regulated to its maximum level and maintained at a relatively high level until the stage of newly hatched larvae. For the Pf_C8β and Pf_C9 genes, expressions were at a relatively high level from the blood circulation stage to the newly hatched larval stage, and expressions were secondly up-regulated at 15–25 dph after a trough at 1–11 dph. These results imply that the Pf_C8α, Pf_C8β and Pf_C9 genes might play important roles in the early development of embryos and fry.
TCC genes are immune-related genes which play a crucial role in the innate resistance to bacterial pathogens [46]. A previous qPCR study in rock bream showed that Gram-negative bacteria (Edwardsiella tarda) can effectively induce expressions of the C8α and C8β genes in the head kidney and liver. The transcription levels of both C8α and C8β genes were highest in the liver at 12 h post-injection, and were highest in the head kidney at 24 h post-injection, compared to the un-injected control [26]. After the Vibrio alginolyticus challenge in orange-spotted grouper (Epinephelus coioides), the expressions of C8β transcripts in the liver and kidney were, respectively, induced to a peak level at 48 and 12 h post-injection [15]. In grass carp, a qPCR study indicated that C9 gene expression was effectively triggered by Gram-negative bacteria (Flavobacterium columnare) in hepatopancreas at 1 day post-injection, whereas the expressions of C9 in the head kidney and spleen were highest at 7 days post-injection [27]. In rock bream, the transcription level of C9 in the liver was highest at 12 h post challenge with E. tarda [24]. These results indicate that the expressions of a TCC gene in different tissues of a fish species may reach a peak level at different time points after bacterial challenge, as do the expressions of a TCC gene in the same tissue of different species. In this study, the expressions of Pf_C8α and Pf_C8β transcripts in the liver were respectively induced to a peak level until 72 and 120 h post-injection with A. hydrophila compared to the un-injection control, whereas the expression of the Pf_C9 transcript in the liver was effectively triggered at 6 h post-injection and reached the greatest level at the 48 h post-injection with an approximately 30-fold-high introduction. It took a longer induction time for the Pf_C8α and Pf_C8β transcriptions in the liver of yellow catfish to reach a peak level than in the liver of rock bream and orange-spotted grouper [15,26]. According to the bacterial challenge results, the expressions of Pf_C8α, Pf_C8β and Pf_C9 transcripts were effectively induced in the head kidney of yellow catfish and the transcription levels were highest at 24 h post-injection with very high up-regulation, which is consistent with the bacterial challenge results in the rock bream [26]. In addition, after the A. hydrophila challenge in yellow catfish, the expressions of Pf_C8α, Pf_C8β and Pf_C9 transcripts showed clear patterns of induction and very high up-regulations at the corresponding time points in the kidney, spleen and blood, demonstrating that they expressed in other immune tissues. These results suggest that the Pf_C8α, Pf_C8β and Pf_C9 genes are sensitive to the Gram-negative bacterial challenge and have potential roles in the immune defense system of yellow catfish, of which the liver, head kidney, kidney, spleen and blood tissues may make a contribution to the early defense against invading pathogenic microbes. However, the mechanism whereby bacterial invasion stimulated the complement gene expressions and the relation of interaction between these three genes and other complement genes require further study. The results obtained in the present study help to expand the understanding of expression characteristics and potential functions in innate immune system of teleost TCC genes. In addition, this study has provided basic data for further selective breeding of disease-resistant strain of yellow catfish.

4. Materials and Methods

4.1. Sampling, Bacterial Preparation and Bacterial Challenge

Fifty adult yellow catfish (one year old) were collected from a commercial fish pond of the Fish Culture Base of the Yangtze River Fisheries Research Institute, Jingzhou city, Hubei Province, China. They were transported to the Fish Breeding Base of Huazhong Agricultural University (HZAU). The fish were fed a commercial diet (Hubei Haid Feeds Company, Wuhan, China) twice daily (8:00 a.m. and 16:00 p.m.) in two circulating water tanks until gene cloning experiments and artificial propagation. The water temperature was kept at 24 °C.
To clone the cDNAs of the Pf_C8α, Pf_C8β and Pf_C9 genes and to examine the mRNA expression profiles of three genes in various tissues of yellow catfish, five adult yellow catfish were anesthetized with 300 mg/L tricaine methanesulfonate (MS-222; TCI, Shanghai, China) prior to dissection. The five adult fish used for tissue expression were a mixture of three males and two females. Blood, liver, spleen, head kidney, kidney, foregut, midgut, hindgut, stomach, gonad, heart, gill, brain, muscle, skin, fin, and eye tissues were rapidly sampled for RNA isolation.
To detect the expressions of Pf_C8α, Pf_C8β and Pf_C9 genes during the early developmental stages, newly fertilized eggs of yellow catfish were produced from three pairs of parent fish by artificial propagation at HZAU. Fertilized eggs from different pairs of parents were separately reared in different indoor tanks with fresh water at 20–22 °C throughout the experiment. Egg yolk and artemia were used to feed the larvae after hatching and mouth opening formation. Five individuals at the newly fertilized egg, cleavage, blastula, gastrula, neurula, somite appearance, muscular effect, heart beat, blood circulation, prophase of hatching, and newly hatched larval stages, as well as larvae of 1, 3, 5, 7, 11, 15, 20, 25, and 30 dph, were randomly collected from the offspring of a pair of parents for RNA extraction. Microscopic observations were used to verify all embryonic developmental stages.
To examine the expressions of the Pf_C8α, Pf_C8β and Pf_C9 genes after bacterial challenge, 60 juvenile yellow catfish were cultivated from the offspring of a pair of parents in HZAU. All fish were reared in a circulating water tank for two weeks at 24 °C, with sufficient dissolved oxygen. The bacterium (A. hydrophila) for immune challenge experiments was obtained from the microbiology laboratory of HZAU. The methods of bacterial cultures were as described in the previous study [57]. The A. hydrophila were killed with 0.2% formalin for 36 h at 4 °C. Five juvenile fish were injected with 50 μL of phosphate buffered saline (PBS, pH 7.2) as a control group. The other fish were challenged by an intraperitoneal injection of 50 μL of suspended formalin-treated A. hydrophila in PBS with a concentration of 1.5 × 10⁷ CFU/mL as the experimental group. Blood, spleen, liver, head kidney and kidney tissues of five fish were collected from the experimental group for RNA extraction after A. hydrophila challenge for 6, 12, 24, 48, 72, 120 and 168 h. The experimental fish were anesthetized with 300 mg/L MS-222 piror to dissection. All the experimental procedures were approved by the Institutional Animal Care and Use Committees (IACUC) of HZAU, Wuhan, China.

4.2. Total RNA Extraction and cDNA Synthesis

Total RNA was extracted from isolated tissues, embryos and larvae using TRIzol Reagent (Invitrogen, Carlsbad, CA, USA), according to the manufacturer’s instructions. A Nanodrop ND-2000 spectrophotometer (Thermo Scientific, Waltham, MA, USA) was used to determine the purity quotient and concentration of RNA with absorbance measurements of 260 and 280 nm. 1% agarose gel electrophoresis was used to determine the integrity of total RNA. The cDNA was synthesized using 2 μg of total RNA by employing the Revert Aid™ M-MLV Reverse Transcriptase Kit (Promega Corporation, Madison, WI, USA) following the manufacturer’s protocols. The cDNA products were stored at −20 °C.

4.3. Cloning of cDNA Sequences for Three Genes

In order to obtain the central sequences for the Pf_C8α, Pf_C8β and Pf_C9 genes, gene-specific primer pairs (C8α-F/C8α-R, C8β-F1/C8β-R1 and C8β-F2/C8β-R2, and C9-F/C9-R) were designed according to the result of transcriptome analysis of yellow catfish (Table 2). The PCR reactions consisted of 32 ng cDNA, 0.5 μM of each primer and 50 U Premix Taq DNA polymerase (TaKaRa, Dalian, China) in a total volume of 20 μL. The PCR thermal cycling conditions were set as follows: 95 °C for 3 min; followed by 35 cycles at 94 °C for 30 s, optimum temperature (Table 2) for 30 s and 72 °C for 1 min; 72 °C for 10 min.
3′RACE was used to amplify the partial sequences of the Pf_C8α, Pf_C8β and Pf_C9 genes. Six gene-specific primers for 3′RACE were designed according to the obtained sequences of the Pf_C8α, Pf_C8β and Pf_C9 genes (Table 2).
All primers were synthesized by the Tsingke Biotech Company (Wuhan, China). 1.5% agarose gel electrophoresis was used to check PCR products. The purified PCR products were obtained using an AxyPrep™ gel extraction kit (Axygen, Union City, CA, USA). They were ligated into a pMD18-T vector (TaKaRa, Dalian, China). Subsequently, 10 μL of ligated products were transformed into 100-μL Escherichia coli competent cells for 30 min at 16 °C, and they were then mixed with a 890-μL LB (Lysogeny Broth) liquid culture medium. Three selected colonies checked by PCR were sequenced by the Tsingke Biotech Company.

4.4. Sequence Analysis

Homologous sequences and the amino acid sequence of Pf_C8α, Pf_C8β and Pf_C9 genes were searched for and predicted in GenBank with the BLAST program (Available online: http://0-www-ncbi-nlm-nih-gov.brum.beds.ac.uk/blast). The putative amino acid sequences were analyzed for the presence of signal peptides using Simple Modular Architecture Research Tool (SMART) (Available online: http://smart.embl-heidelberg.de/). ClustalW (Available online: http://www.genome.jp/tools/clustalw/) and BoxShade (Available online: http://www.ch.embnet.org/software/BOX_form.html) were used for multiple sequence alignments. A neighbor-joining (NJ) phylogenetic tree was constructed based on the putative amino acid sequences using MEGA 5.03 (MEGA Software Development Team, Phenix, AZ, USA).

4.5. qPCR and Statistical Analyses

qPCR was used to investigate the temporal and spatial expression analyses of Pf_C8α, Pf_C8β and Pf_C9 mRNA. The qPCRs of Pf_C8α, Pf_C8β and Pf_C9 were performed using a Roche LightCycler 480 (Roche, Mannheim, Germany). The gene-specific primer pairs for qPCRs were designed based on the amplified sequences of Pf_C8α, Pf_C8β and Pf_C9 genes (Table 2). The PCR reaction mixtures of Pf_C8α, Pf_C8β and Pf_C9 consisted of a 32-ng cDNA template, 10 μL LightCycler® 480 SYBR Green I Master (Roche, Mannheim, Germany) and 1.0 μM of either gene-specific primer in a total volume of 20 μL. The qPCRs of Pf_C8α, Pf_C8β and Pf_C9 were performed in triplicate as: 95 °C for 5 min, followed by 45 cycles at 95 °C for 10 s, optimum annealing temperature (Table 3) for 10 s, 72 °C for 15 s respectively. At the end of each qPCR amplification reaction, melting curve analysis was performed to verify that each detected qPCR product was single. The amplification reaction without the cDNA template was used as a blank control.
The relative expression levels of these three genes were calculated using the comparative Ct method with the formula 2−ΔΔCt [58]. All data of qPCRs were expressed as the mean ± standard error (SE). One-way analysis of variance (one-way ANOVA) and Duncan’s post-hoc test were used to examine the differences among mean expression levels in different tissues and at early developmental stages using SPSS 17.0 software (IBM, Armonk, NY, USA). A t-test was performed to examine the differences in expression levels between the control and the experimental group after bacterial challenge. p-values less than 0.05 were determined to be statistically significant.

5. Conclusions

We cloned the partial cDNA sequences of the Pf_C8α, Pf_C8β and Pf_C9 genes from the yellow catfish. The deduced amino acid sequences of the Pf_C8α, Pf_C8β and Pf_C9 showed similarity with other reported teleosts and vertebrates. Ontogenetic expression analyses by qPCR suggested that Pf_C8α, Pf_C8β and Pf_C9 may play important roles in the early developmental stages. The Pf_C8α, Pf_C8β and Pf_C9 mRNAs were all constitutively expressed at the highest levels in the liver, followed by a relatively low level in the head kidney, foregut, midgut, hindgut, kidney, heart, and spleen, and a lower level still in the other tissues, demonstrating that the liver is the primary site for Pf_C8α, Pf_C8β and Pf_C9 synthesis. Moreover, the Pf_C8α, Pf_C8β and Pf_C9 mRNA expressions were found to be up-regulated in the spleen, head kidney, kidney, liver and blood tissues after challenge with A. hydrophila, indicating that the Pf_C8α, Pf_C8β and Pf_C9 genes play roles in the immune defense system of yellow catfish. However, the mechanism whereby bacterial invasion stimulated the complement gene expressions and the relation of interaction between these three genes and other complement genes require further study. The findings obtained in this study have provided valuable information to increase our understanding of the yellow catfish immune system, and help to expand the understanding of expression characteristics of teleost TCC genes.

Acknowledgments

We thank all the laboratory members for their help on the experiment. This work was supported by the Major Science and Technology Program for Water Pollution Control and Treatment (Grant No. 2014ZX07203010-4) and the Scientific Research Foundation for the Introduction of High-level Talents, Huazhong Agricultural University (Grant No. 2012RC012).

Author Contributions

Huan Zheng, Wei Ji and Kai-Jian Wei conceived and designed the experiments; Huan Zheng, Gui-Rong Zhang and Xiao-Ting Zhang performed the experiments; Huan Zheng and Kai-Jian Wei analyzed the data; Gui-Rong Zhang, Ze-Chao Shi, Rui-Bin Yang and Jonathan P. A. Gardner contributed reagents/materials/analysis tools; Huan Zheng and Kai-Jian Wei wrote the paper. All authors have read and approved the final manuscript.

Conflicts of Interest

The authors declare no conflict of interest.

References

  1. Carroll, M.C. The complement system in regulation of adaptive immunity. Nat. Immunol. 2004, 5, 981–986. [Google Scholar] [CrossRef] [PubMed]
  2. Dunkelberger, J.R.; Song, W.C. Complement and its role in innate and adaptive immune responses. Cell Res. 2010, 20, 34–50. [Google Scholar] [CrossRef] [PubMed]
  3. Mollnes, T.E.; Song, W.C.; Lambris, J.D. Complement in inflammatory tissue damage and disease. Trends Immunol. 2002, 23, 61–64. [Google Scholar] [CrossRef]
  4. Morgan, B.P.; Marchbank, K.J.; Longhi, M.P.; Harris, C.L.; Gallimore, A.M. Complement: Central to innate immunity and bridging to adaptive responses. Immunol. Lett. 2005, 97, 171–179. [Google Scholar] [CrossRef] [PubMed]
  5. Wills-Karp, M. Complement activation pathways: A bridge between innate and adaptive immune responses in asthma. Proc. Am. Thorac. Soc. 2007, 4, 247–251. [Google Scholar] [CrossRef] [PubMed]
  6. Rutkowski, M.J.; Sughrue, M.E.; Kane, A.J.; Ahn, B.J.; Fang, S.; Parsa, A.T. The complement cascade as a mediator of tissue growth and regeneration. Inflamm. Res. 2010, 59, 897–905. [Google Scholar] [CrossRef] [PubMed]
  7. Podack, E.R.; Olsen, K.J.; Lowrey, D.M.; Lichtenheld, M. Structure and function of perforin. Curr. Top. Microbiol. Immunol. 1988, 140, 11–17. [Google Scholar]
  8. Nonaka, M.; Kimura, A. Genomic view of the evolution of the complement system. Immunogenetics 2006, 58, 701–713. [Google Scholar] [CrossRef] [PubMed]
  9. Steckel, E.W.; York, R.G.; Monahan, J.B.; Sodetz, J.M. The eighth component of human complemen. J. Biol. Chem. 1980, 255, 11997–12005. [Google Scholar] [PubMed]
  10. Tegla, C.A.; Cudrici, C.; Patel, S.; Trippe, R.; Rus, V.; Niculescu, F.; Rus, H. Membrane attack by complement: The assembly and biology of terminal complement complexes. Immunol. Res. 2011, 51, 45–60. [Google Scholar] [CrossRef] [PubMed]
  11. Parker, C.L.; Sodetz, J.M. Role of the human C8 subunits in complement-mediated bacterial killing: Evidence that C8γ is not essential. Mol. Immunol. 2002, 39, 453–458. [Google Scholar] [CrossRef]
  12. Hadders, M.A.; Beringer, D.X.; Gros, P. Structure of C8α-MACPF reveals mechanism of membrane attack in complement immune. Science 2007, 317, 1552–1554. [Google Scholar] [CrossRef] [PubMed]
  13. Monahan, J.B.; Sodetz, J.M. Role of the β subunit in interaction of the eighth component of human complement with the membrane-bound cytolytic complex. J. Biol. Chem. 1981, 256, 3258–3262. [Google Scholar] [PubMed]
  14. Kotnik, V.; Luznik-Bufon, T.; Schneider, P.M.; Kirschfink, M. Molecular, genetic, and functional analysis of homozygous C8β-chain deficiency in two siblings. Immunopharmacology 1997, 38, 215–221. [Google Scholar] [CrossRef]
  15. Luo, S.; Xie, F.; Liu, Y.; Wang, W.N. Molecular cloning, characterization and expression analysis of complement component C8 beta in the orange-spotted grouper (Epinephelus coioides) after the Vibrio alginolyticus challenge. Gene 2015, 558, 291–298. [Google Scholar] [CrossRef] [PubMed]
  16. Discipio, R.G.; Berlin, C. The architectural transition of human complement component C9 to poly(C9). Mol. Immunol. 1999, 36, 575–585. [Google Scholar] [CrossRef]
  17. Nakao, M.; Tsujikura, M.; Ichiki, S.; Vo, T.K.; Somamoto, T. The complement system in teleost fish: Progress of post-homolog-hunting researches. Dev. Comp. Immunol. 2011, 35, 1296–1308. [Google Scholar] [CrossRef] [PubMed]
  18. Dishaw, L.J.; Smith, S.L.; Bigger, C.H. Characterization of a C3-like cDNA in a coral: Phylogenetic implications. Immunogenetics 2005, 57, 535–548. [Google Scholar] [CrossRef] [PubMed]
  19. Zhu, Y.; Thangamani, S.; Ho, B.; Ding, J.L. The ancient origin of the complement system. EMBO J. 2005, 24, 382–394. [Google Scholar] [CrossRef] [PubMed]
  20. Castillo, M.G.; Goodson, M.S.; McFall-Ngai, M. Identification and molecular characterization of a complement C3 molecule in a lophotrochozoan, the Hawaiian bobtail squid Euprymna scolopes. Dev. Comp. Immunol. 2009, 33, 69–76. [Google Scholar] [CrossRef] [PubMed]
  21. Smith, L.C.; Azumi, K.; Nonaka, M. Complement systems in invertebrates. The ancient alternative and lectin pathways. Immunopharmacology 1999, 42, 107–120. [Google Scholar] [CrossRef]
  22. Nonaka, M.; Azumi, K. Opsonic complement system of the solitary ascidian, Halocynthia roretzi. Dev. Comp. Immunol. 1999, 23, 421–427. [Google Scholar] [CrossRef]
  23. Nonaka, M.; Smith, S.L. Complement system of bony and cartilaginous fish. Fish Shellfish Immunol. 2000, 10, 215–228. [Google Scholar] [CrossRef] [PubMed]
  24. Wickramaarachchi, W.D.; Wan, Q.; Lee, Y.; Lim, B.S.; de Zoysa, M.; Oh, M.J.; Jung, S.J.; Kim, H.C.; Whang, I.; Lee, J. Genomic characterization and expression analysis of complement component 9 in rock bream (Oplegnathus fasciatus). Fish Shellfish Immunol. 2012, 33, 707–717. [Google Scholar] [CrossRef] [PubMed]
  25. Wickramaarachchi, W.D.; Whang, I.; Kim, E.; Lim, B.S.; Jeong, H.B.; De Zoysa, M.; Oh, M.J.; Jung, S.J.; Yeo, S.Y.; Kim, S.Y.; et al. Genomic characterization and transcriptional evidence for the involvement of complement component 7 in immune response of rock bream (Oplegnathus fasciatus). Dev. Comp. Immunol. 2013, 41, 44–49. [Google Scholar] [CrossRef] [PubMed]
  26. Wickramaarachchi, W.D.; Whang, I.; Wan, Q.; Bathige, S.D.; de Zoysa, M.; Lim, B.S.; Yeo, S.Y.; Park, M.A.; Lee, J. Genomic characterization and expression analysis of complement component 8α and 8β in rock bream (Oplegnathus fasciatus). Dev. Comp. Immunol. 2013, 39, 279–292. [Google Scholar] [CrossRef] [PubMed]
  27. Li, L.; Chang, M.X.; Nie, P. Molecular cloning, promoter analysis and induced expression of the complement component C9 gene in the grass carp Ctenopharyngodon idella. Vet. Immunol. Immunopathol. 2007, 118, 270–282. [Google Scholar] [CrossRef] [PubMed]
  28. Shen, Y.; Zhang, J.; Xu, X.; Fu, J.; Li, J. Expression of complement component C7 and involvement in innate immune responses to bacteria in grass carp. Fish Shellfish Immunol. 2012, 33, 448–454. [Google Scholar] [CrossRef] [PubMed]
  29. Encinas, P.; Rodriguez-Milla, M.A.; Novoa, B.; Estepa, A.; Figueras, A.; Coll, J. Zebrafish fin immune responses during high mortality infections with viral haemorrhagic septicemia rhabdovirus. A proteomic and transcriptomic approach. BMC Genom. 2010, 11. [Google Scholar] [CrossRef] [PubMed] [Green Version]
  30. Chondrou, M.P.; Londou, A.V.; Zarkadis, I.K. Expression and phylogenetic analysis of the ninth complement component (C9) in rainbow trout. Fish Shellfish Immunol. 2006, 21, 572–576. [Google Scholar] [CrossRef] [PubMed]
  31. Chondrou, M.P.; Mastellos, D.; Zarkadis, I.K. cDNA cloning and phylogenetic analysis of the sixth complement component in rainbow trout. Mol. Immunol. 2006, 43, 1080–1087. [Google Scholar] [CrossRef] [PubMed]
  32. Zarkadis, I.K.; Duraj, S.; Chondrou, M. Molecular cloning of the seventh component of complement in rainbow trout. Dev. Comp. Immunol. 2005, 29, 95–102. [Google Scholar] [CrossRef] [PubMed]
  33. Papanastasiou, A.D.; Zarkadis, I.K. Cloning and phylogenetic analysis of the α subunit of the eighth complement component (C8) in rainbow trout. Mol. Immunol. 2006, 43, 2188–2194. [Google Scholar] [CrossRef] [PubMed]
  34. Kazantzi, A.; Sfyroera, G.; Holland, M.C.H.; Lambris, J.D.; Zarkadis, I.K. Molecular cloning of the β subunit of complement component eight of rainbow trout. Dev. Comp. Immunol. 2003, 27, 167–174. [Google Scholar] [CrossRef]
  35. Shen, Y.; Zhang, J.; Xu, X.; Li, J. Molecular cloning, characterization and expression analysis of the complement component C6 gene in grass carp. Vet. Immunol. Immunopathol. 2011, 141, 139–143. [Google Scholar] [CrossRef] [PubMed]
  36. Nakao, M.; Uemura, T.; Yano, T. Terminal components of carp complement constituting a membrane attack complex. Mol. Immunol. 1996, 33, 933–937. [Google Scholar] [CrossRef]
  37. Uemura, T.; Yano, T.; Shiraishi, H.; Nakao, M. Purification and characterization of the eighth and ninth components of carp complement. Mol. Immunol. 1996, 33, 925–932. [Google Scholar] [CrossRef]
  38. Zhu, L.Y.; Nie, L.; Zhu, G.; Xiang, L.X.; Shao, J.Z. Advances in research of fish immune-relevant genes: A comparative overview of innate and adaptive immunity in teleosts. Dev. Comp. Immunol. 2013, 39, 39–62. [Google Scholar] [CrossRef] [PubMed]
  39. Zou, M.; Zhang, X.; Shi, Z.; Lin, L.; Ouyang, G.; Zhang, G.; Zheng, H.; Wei, K.; Ji, W. A Comparative transcriptome analysis between wild and albino yellow catfish (Pelteobagrus fulvidraco). PLoS ONE 2015, 10, e0131504. [Google Scholar] [CrossRef] [PubMed]
  40. Liang, Z.S.; Huang, J.; Shi, J.G.; Huang, Y.H.; Peng, M.Y.; Wen, H.C.; Liang, X.; Qin, J.X. Isolation and identification of ascites disease pathogen from Pelteobagrus fulvidraco Richardson and its drug sensitivity test. J. South Agric. 2012, 43, 1400–1404. [Google Scholar]
  41. Huang, J.; Wen, H.C.; Shi, J.G.; Huang, Y.H.; Liang, Z.S.; Long, Y.N.; Qin, J.X. Isolation and identification of pathogenic bacteria from Pelteobagrus fulvidraco ulcerative syndrome and its drug sensitive test. J. South Agric. 2012, 43, 107–112. [Google Scholar]
  42. Geng, Y.; Wang, K.Y.; Fan, F.L.; Chen, D.F.; Huang, J.L. Isolation, identification and biological characterization of Edwardsiella ictaluri from cultured yellow catfish Pelteobagrus fulvidraco. Oceanol. Limnol. Sin. 2010, 41, 61–67. [Google Scholar]
  43. Müller-Eberhard, H.J. The membrane attack complex of complement. Annu. Rev. Immunol. 1986, 4, 503–528. [Google Scholar] [CrossRef] [PubMed]
  44. Gasque, P. Complement: A unique innate immune sensor for danger signals. Mol. Immunol. 2004, 41, 1089–1098. [Google Scholar] [CrossRef] [PubMed]
  45. Dong, Z.; Ge, J.; Li, K.; Xu, Z.; Liang, D.; Li, J.; Li, J.; Jia, W.; Li, Y.; Dong, X.; et al. Heritable targeted inactivation of myostatin gene in yellow catfish (Pelteobagrus fulvidraco) using engineered zinc finger nucleases. PLoS ONE 2011, 6, e28897. [Google Scholar] [CrossRef] [PubMed]
  46. Holland, M.C.H.; Lambris, J.D. The complement system in teleosts. Fish Shellfish Immunol. 2002, 12, 399–420. [Google Scholar] [CrossRef] [PubMed]
  47. Katagiri, T.; Hirono, I.; Aoki, T. Molecular analysis of complement component C8β and C9 cDNAs of Japanese flounder, Paralichthys olivaceus. Immunogenetics 1999, 50, 43–48. [Google Scholar] [CrossRef] [PubMed]
  48. Witzel-Schlömp, K.; Rittner, C.; Schneider, P.M. The human complement C9 gene: Structural analysis of the 5′ gene region and genetic polymorphism studies. Eur. J. Immunogenet. 2001, 28, 515–522. [Google Scholar] [CrossRef] [PubMed]
  49. Wang, Y.; Zhang, M.; Wang, C.; Ye, B.; Hua, Z. Molecular cloning of the α subunit of complement component C8 (CpC8α) of whitespotted bamboo shark (Chiloscyllium plagiosum). Fish Shellfish Immunol. 2013, 35, 1993–2000. [Google Scholar] [CrossRef] [PubMed]
  50. Wang, Y.; Xu, S.; Su, Y.; Ye, B.; Hua, Z. Molecular characterization and expression analysis of complement component C9 gene in the whitespotted bambooshark, Chiloscyllium plagiosum. Fish Shellfish Immunol. 2013, 35, 599–606. [Google Scholar] [CrossRef] [PubMed]
  51. Gao, B.; Jeong, W.; Tian, Z. Liver: An organ with predominant innate immunity. Hepatology 2008, 47, 729–736. [Google Scholar] [CrossRef] [PubMed]
  52. Magnadóttir, B. Innate immunity of fish (overview). Fish Shellfish Immunol. 2006, 20, 137–151. [Google Scholar] [CrossRef] [PubMed]
  53. Li, C.M. Cloning and Expression Analysis of Terminal Complement Components of Cyprinus carpio haematopteru. Master Thesis, Henan Normal University, Xinxiang, China, May 2012. [Google Scholar]
  54. Mulero, I.; García-Ayala, A.; Meseguer, J.; Mulero, V. Maternal transfer of immunity and ontogeny of autologous immunocompetence of fish: A minireview. Aquaculture 2007, 268, 244–250. [Google Scholar] [CrossRef]
  55. Wang, Z.; Zhang, S.; Wang, G.; An, Y. Complement activity in the egg cytosol of zebrafish Danio rerio: Evidence for the defense role of maternal complement components. PLoS ONE 2008, 1, e1463. [Google Scholar] [CrossRef] [PubMed]
  56. Lechniak, D.; Pers-Kamczyc, E.; Pawlak, P. Timing of the first zygotic cleavage as a marker of developmental potential of mammalian embryos. Reprod. Biol. 2008, 8, 23–42. [Google Scholar] [CrossRef]
  57. Liang, T.; Ji, W.; Zhang, G.R.; Wei, K.J.; Feng, K.; Wang, W.M.; Zou, G.W. Molecular cloning and expression analysis of liver-expressed antimicrobial peptide 1 (LEAP-1) and LEAP-2 genes in the blunt snout bream (Megalobrama amblycephala). Fish Shellfish Immunol. 2013, 35, 553–563. [Google Scholar] [CrossRef] [PubMed]
  58. Livak, K.J.; Schmittgen, T.D. Analysis of relative gene expression data using real time quantitative PCR and the 2−ΔΔCt Method. Methods 2001, 25, 402–408. [Google Scholar] [CrossRef] [PubMed]
Figure 1. Partial nucleotide and deduced amino acid sequences of Pf_C8α (A); Pf_C8β (B) and Pf_C9 (C). The nucleotide sequence (upper line) and the deduced amino acid sequence (lower line) are numbered. Start codons, stop codons and polyadenylation signal sequences (AATAAA) are indicated by boxes. Predicted signal peptides are underlined. * indicates stop codon.
Ijms 17 00345 g001aIjms 17 00345 g001bIjms 17 00345 g001c
Figure 2. Multiple sequence alignment of the deduced amino acids of Pf_C8α (A); Pf_C8β (B) and Pf_C9 (C) with other vertebrates, derived using the ClustalW program. The identical residues are indicated in black and marked with an asterisk (*). Conserved and semi-conserved residues are indicated by gray shading, marked with a semicolon (:) and a dot (.), respectively. Missing amino acid is marked by dashes; the conserved domain is indicated by double arrows. MM_C8α: Mus musculus C8α; HS_C8α: Homo sapiens C8α; GG_C8α: Gallus gallus C8α; PF_C8α: Pelteobagrus fulvidraco C8α; DR_C8α: Danio rerio C8α; OC_C8β: Oryctolagus cuniculus C8β; HS_C8β: Homo sapiens C8β; RN_C8β: Rattus norvegicus C8β; PF_C8β: Pelteobagrus fulvidraco C8β; DR_C8β: Danio rerio C8β; OC_C9: Oryctolagus cuniculus C9; HS_C9: Homo sapiens C9; RN_C9: Rattus norvegicus C9; PF_C9: Pelteobagrus fulvidraco C9; DR_C8β: Danio rerio C9. The GenBank accession numbers of these sequences are shown in Table 1. TSP: thrombospondin; LDLR-A: low-density lipoprotein receptor class A; MACPF: unique membrane attack complex/perforin-like; EGF: epidermal growth factor-like.
Ijms 17 00345 g002aIjms 17 00345 g002bIjms 17 00345 g002c
Figure 3. Neighbor-joining (NJ) phylogenetic relationship of Pf_C8α, Pf_C8β and Pf_C9 with those of other vertebrates. The phylogenetic tree was constructed based on the deduced partial amino acid sequences of Pf_C8α, Pf_C8β and Pf_C9 using the neighbor-joining method in MEGA 5.03. The numbers at tree nodes indicate percentage of 1000 bootstrap samples. The scale bar refers to a phylogenetic distance of 0.1 amino acid substitutions per site. The GenBank accession numbers of these sequences are shown in Table 1.
Ijms 17 00345 g003
Figure 4. Tissue distributions of relative expression levels of Pf_C8α (A); Pf_C8β (B) and Pf_C9 (C) mRNAs. Columns represent the means of 3 repeats for each treatment. Error bars represent standard error of the means. Different letters above the bars indicate significant difference (Duncan test, p < 0.05).
Ijms 17 00345 g004
Figure 5. The expression profiles of Pf_C8α (A); Pf_C8β (B) and Pf_C9 (C) genes during the embryonic and early larval developmental stages. Abscissa (x-axis) values 1–20 are qPCR products from various developmental stages with (1) fertilized egg; (2) cleavage; (3) blastula; (4) gastrula; (5) neurula; (6) somite appearance; (7) muscular effect; (8) heart beat; (9) blood circulation; (10) prophase of hatching; (11) newly hatched larval; (12) 1 dph; (13) 3 dph; (14) 5 dph; (15) 7 dph; (16) 11 dph; (17) 15 dph; (18) 20 dph; (19) 25 dph; (20) 30 dph. Different letters above the bars indicate significant difference (Duncan test, p < 0.05). dph: days post-hatching.
Ijms 17 00345 g005
Figure 6. Changes of relative mRNA expression levels of the Pf_C8α gene in the spleen (A); head kidney (B); kidney (C); liver (D) and blood (E) after the A. hydrophila challenge. Transcriptional fold changes of Pf_C8α at different time points (6, 12, 24, 48, 72, 120 and 168 h) were calculated compared to the control (0 h). Columns and bars represent the means and standard errors, respectively. Significant difference is indicated by asterisks (*: p < 0.05, **: p < 0.01).
Ijms 17 00345 g006aIjms 17 00345 g006b
Figure 7. Changes of relative mRNA expression levels of the Pf_C8β gene in the spleen (A); head kidney (B); kidney (C); liver (D) and blood (E) after the A. hydrophila challenge. Transcriptional fold changes of Pf_C8β at different time points (6, 12, 24, 48, 72, 120 and 168 h) were calculated compared to the control (0 h). Columns and bars represent the means and standard errors, respectively. Significant difference is indicated by asterisks (*: p < 0.05, **: p < 0.01).
Ijms 17 00345 g007aIjms 17 00345 g007b
Figure 8. Changes of relative mRNA expression levels of the Pf_C9 gene in the spleen (A); head kidney (B); kidney (C); liver (D) and blood (E) after the A. hydrophila challenge. Transcriptional fold changes of Pf_C9 at different time points (6, 12, 24, 48, 72, 120 and 168 h) were calculated compared to the control (0 h). Columns and bars represent the means and standard errors, respectively. Significant difference is indicated by asterisks (*: p < 0.05, **: p < 0.01).
Ijms 17 00345 g008aIjms 17 00345 g008b
Table 1. Different vertebrate species and their GenBank accession numbers of C8α, C8β and C9 sequences used for multiple alignment and phylogenetic analysis in this study.
ProteinSpeciesGenBank Accession no.
C8αEsox luciusXP_010885181.1
Oncorhynchus mykissNP_001118096.1
Oplegnathus fasciatusAFZ93888.1
Siniperca chuatsiAKA66305.1
Clupea harengusXP_012681433.1
Pelteobagrus fulvidracoKT588317
Danio rerioAAH78409.1
Xenopus (Silurana) tropicalisAAH74554.1
Gallus gallusXP_426667.2
Mus musculusAAH27748.1
Bos taurusAAI12636.1
Homo sapiensAAI32914.1
Oryctolagus cuniculusNP_001075724.1
C8βHomo sapiensNP_000057.2
Macaca mulattaXP_001114456.1
Oryctolagus cuniculusP98137.1
Rattus norvegicusNP_001178688.1
Pelteobagrus fulvidracoKT588318
Danio rerioNP_001243652.1
Esox luciusXP_010885201.1
Oncorhynchus mykissAAL16647.1
Neolamprologus brichardiXP_006786991.1
Paralichthys olivaceusBAA86877.1
C9Oryctolagus cuniculusNP_001075815.1
Homo sapiensAAH20721.1
Sus scrofaNP_001090917.1
Rattus norvegicusAAB38023.1
Xenopus (Silurana) tropicalisAAI59018.1
Danio rerioXP_005171925.1
Ctenopharyngodon idellaABN49522.1
Pelteobagrus fulvidracoKT454382
Plecoglossus altivelisCBX31962.1
Oncorhynchus mykissNP_001117898.1
Xiphophorus helleriiAEJ08068.1
Oplegnathus fasciatusAFU81223.1
Paralichthys olivaceusBAA86878.1
Takifugu rubripesAAC60288.1
Table 2. Primers used for cloning of C8α, C8β and C9 cDNA in Pelteobagrus fulvidraco.
Name of PrimerSequence of Primes (5′→3′)Ta (°C)Application
C8α-FATGAGGCAGTATATCTCTACTTCTGG60cDNA cloning of C8α gene
C8α-RTCAGCAGCGTCTTGTCTGCA
C8α-3′RACE outerCTGTCAGATGGCGGGTGGCA583′RACE (1st round PCR)
C8α-3′RACE innerCTTCAGTTCGCCTGCTCCCG583′RACE (2nd round PCR)
C8β-F1CGCCGTCACGCTACTCAT60cDNA Cloning of C8β gene
C8β-R1GTGGTCAAAGGTTCCCCC
C8β-F2CTTTCGTTTCGTGCCT50cDNA cloning of C8β gene
C8β-R2GTGTATTGCTGGATGTTGTA
C8β-3′RACE outerCCTGCGAACTCTCCCACT553′RACE (1st round PCR)
C8β-3′RACE innerGCTTGGGGGAACCTTTGAC553′RACE (2nd round PCR)
C9-FATGAGGATGTTGATGTCAAT56cDNA cloning of C9 gene
C9-RTTAACAATATTCGTCGCTGA
C9-3′RACE outerCACCCCTACTGAGTCATCGG583′RACE (1st round PCR)
C9-3′RACE innerATTACAGACCACAGCACCAC543′RACE (2nd round PCR)
Oligo(dT)17GACTCGAGTCGACATCGA(T)17 Universal primer for 3′RACE
linker adapterGACTCGAGTCGACATCG Universal primer for 3′RACE
Ta, annealing temperature; RACE: rapid amplification of cDNA ends.
Table 3. Primers used for qPCRs of C8α, C8β and C9 mRNA and β-actin mRNA in Pelteobagrus fulvidraco.
Name of PrimerSequence of Primes (5′→3′)Ta (°C)Application
C8α-DLFTGCCTGAGCAATACGACT58qPCR of C8α mRNA
C8α-DLRCGAGCACCACTATGTAATCTA
C8β-DLFCAAGGAGCCAACAGAAGA55qPCR of C8β mRNA
C8β-DLRTGAAGGCAAAGGAGACAG
C9-DLFTTCATTGCTGAGCGAACT62qPCR of C9 mRNA
C9-DLRATTTGTGGTGCTGTGGTC
β-actin-FTCCCTGTATGCCTCTGGTGGT58qPCR of β-actin mRNA
β-actin-RAAGCTGTAGCCTCTCTCGGTC
Ta, annealing temperature; DL: real time PCR.

