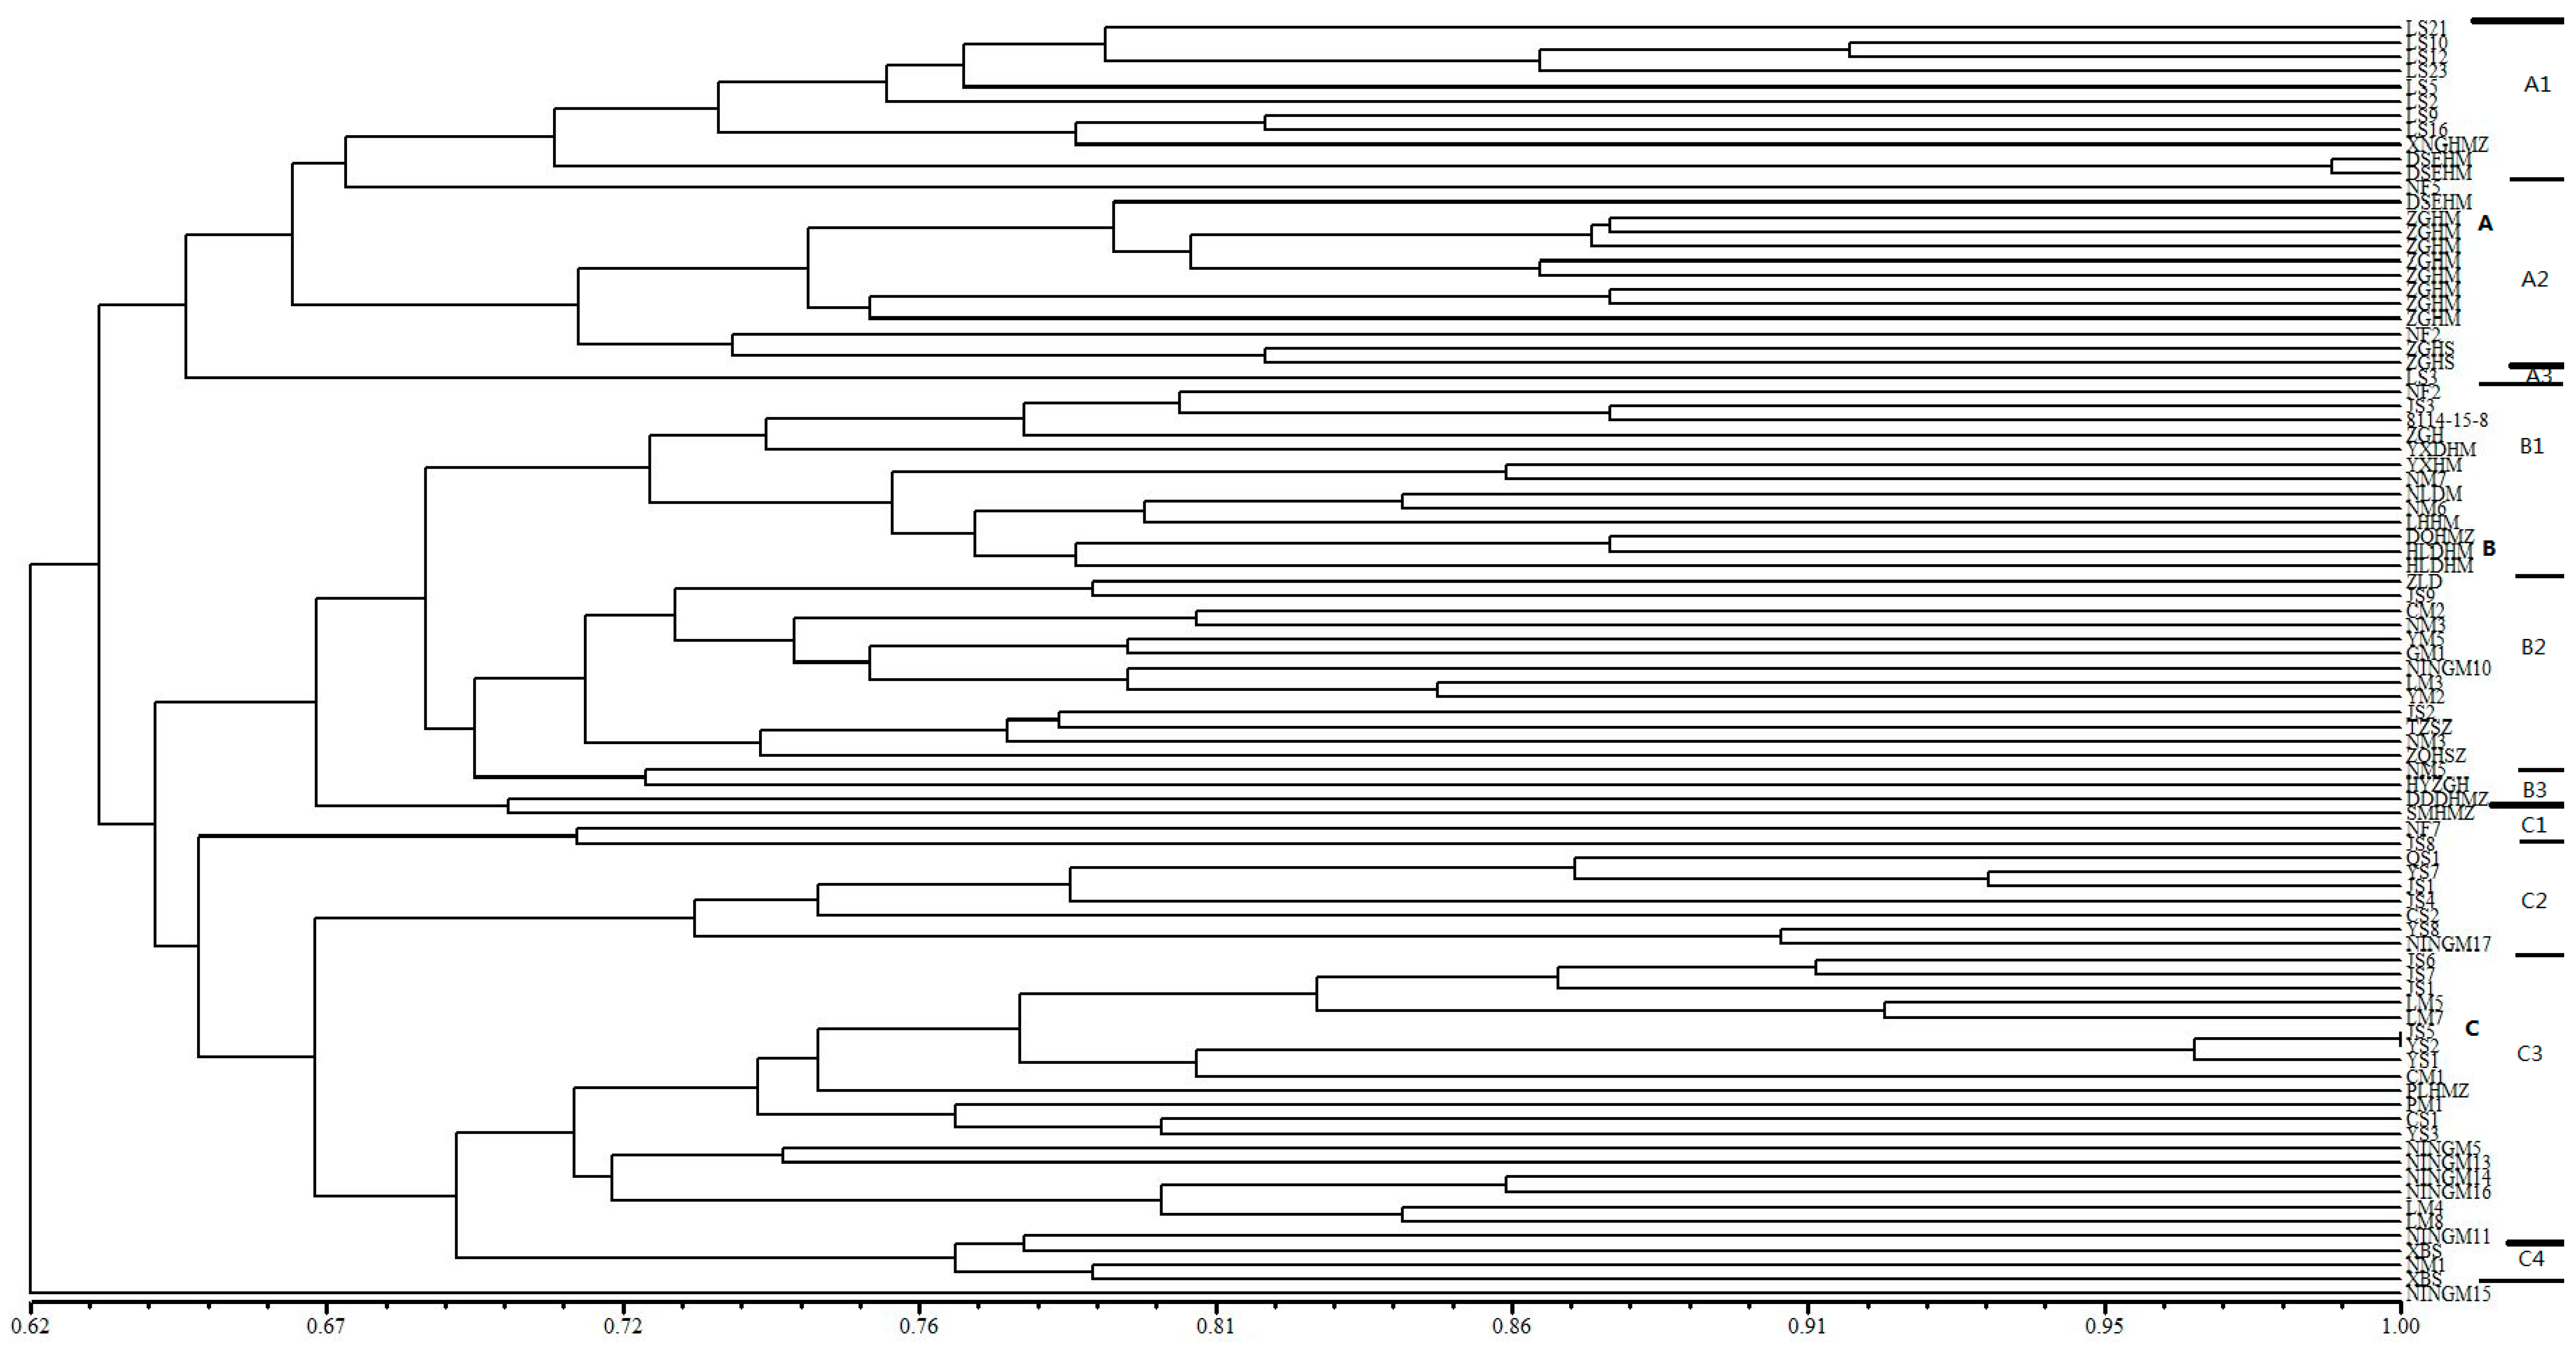
Figure 1.
Dendrogram generated by UPGMA cluster analysis of 88 broomcorn millet accessions based on data from 67 SSR markers. A, B, C are main groups by cluster, A1, A2, A3, B1, B2, B3, C1, C2, C3, C4 are subgroups in each main group. Thick line is used to divide main group and thin line is used to divide subgroup.
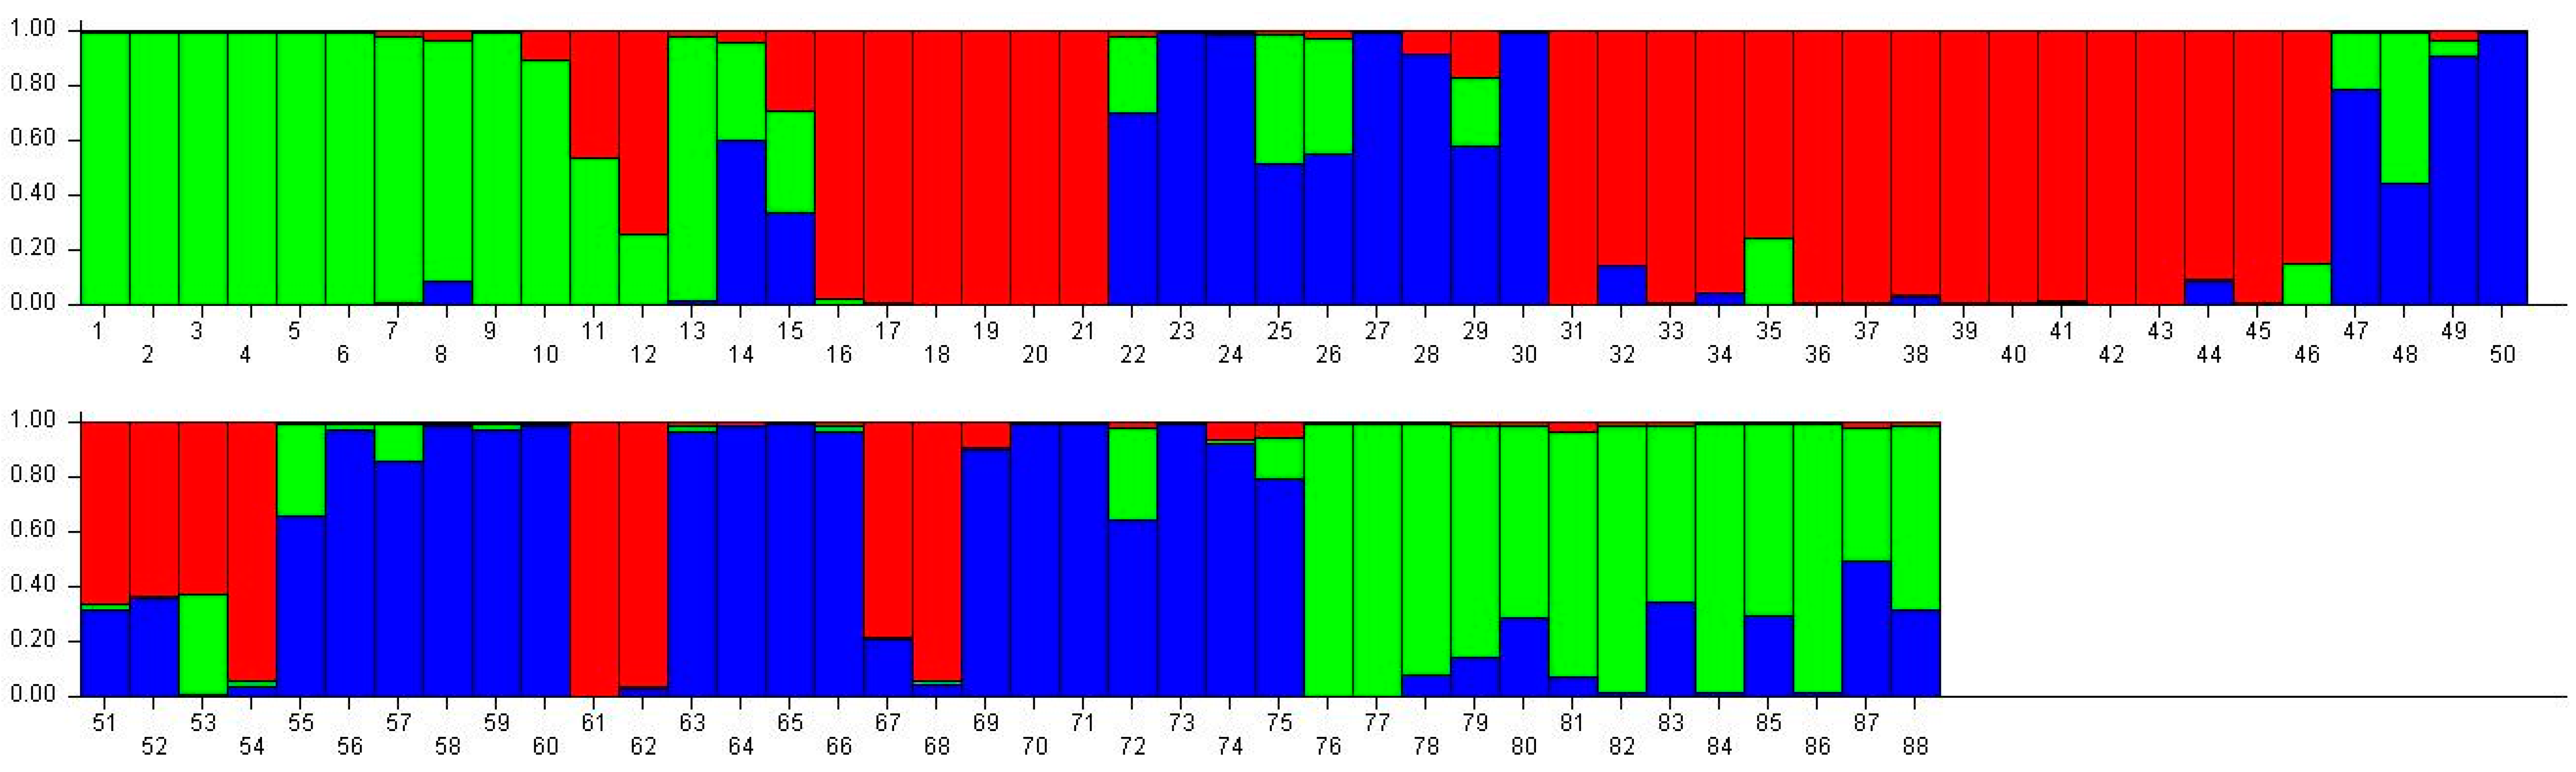
Figure 2.
Population structure of 88 broomcorn milletcultivars based on STRUCTUREanalysis at K = 3. Different colors represent different groups and a bar represents a sample. The proportion of a color in a bar which is higher than other colors indicates that this sample belongs to the group which the color represents. 1–15 samples come from Heilongjiang (1, Longshu21; 2, Longshu5; 3, Longshu10; 4, Longshu9; 5, Longshu23; 6, Xiaonangouheimizi; 7, Longshu12; 8, LOngshu3; 9, Longshu16; 10, Longshu2; 11, NIanfeng5; 12, Nianfeng2; 13, Nianfeng2-1; 14, Qishu1; 15, Nianfeng7), 16–30 samples come from Shanxi (16, Jinshu3; 17, Ziluodai; 18, Jinshu2; 19, Tianzhenshuzi; 20, Jinshu9; 21, 8114-15-8; 22, Yanshu7; 23, JInshu6; 24, Yanshu8; 25, Jinshu8; 26, Jinshu4; 27, Jinshu5; 28, Jinshu7; 29, Pinmi1; 30, Jinshu1), 31–50 samples come from Inner Mongolia (31, Yixuanhuangmi; 32, Zhunqihuangshuzi; 33, Neimi5; 34, Neimi3; 35, Yixuandahongmi; 36, Chimi2; 37, Yimi5; 38, Niuluandanmi; 39, Neimi7; 40, Linhehuangmi; 41, Neimi6; 42, Daqiqingmizi; 43, Helindahuangmi; 44, Helingdahuangmi2; 45, Neimi3; 46, Dangdidahuangmizi; 47, Chishu1; 48, Chishu2; 49, Chimi1; 50, Neimi1), 51–60 samples come from Ningxia (51, Ningmi10; 52, Haiyuanziganhong; 53, Ningmi15; 54, Ziganhong; 55, NIngmi5; 56, Ningmi11; 57, Ningmi13; 58, Ningmi14; 59, Ningmi16; 60, Ningmi17), 61–66 samples come from Gansu (61, Longmi3; 62, Ganmi1; 63, Longmi4; 64, Longmi5; 65, Longmi7; 66, Longmi8), 67–71 samples come from Shaanxi (67,Yumi2; 68, Shenmuhongmizi; 69, Yushu3; 70, Yushu2; 71, Yushu1), 72–73 samples come from Jilin (72, Jiushu1; 73, Panlonghuangmi), 74–88 are samples come from Inner Mongolia which with same name (74–75 are Xiaobaishu; 76–78 are Dongshengerhuangmi; 79–88 are Ziganhongmi).
![Ijms 17 00370 g002]()
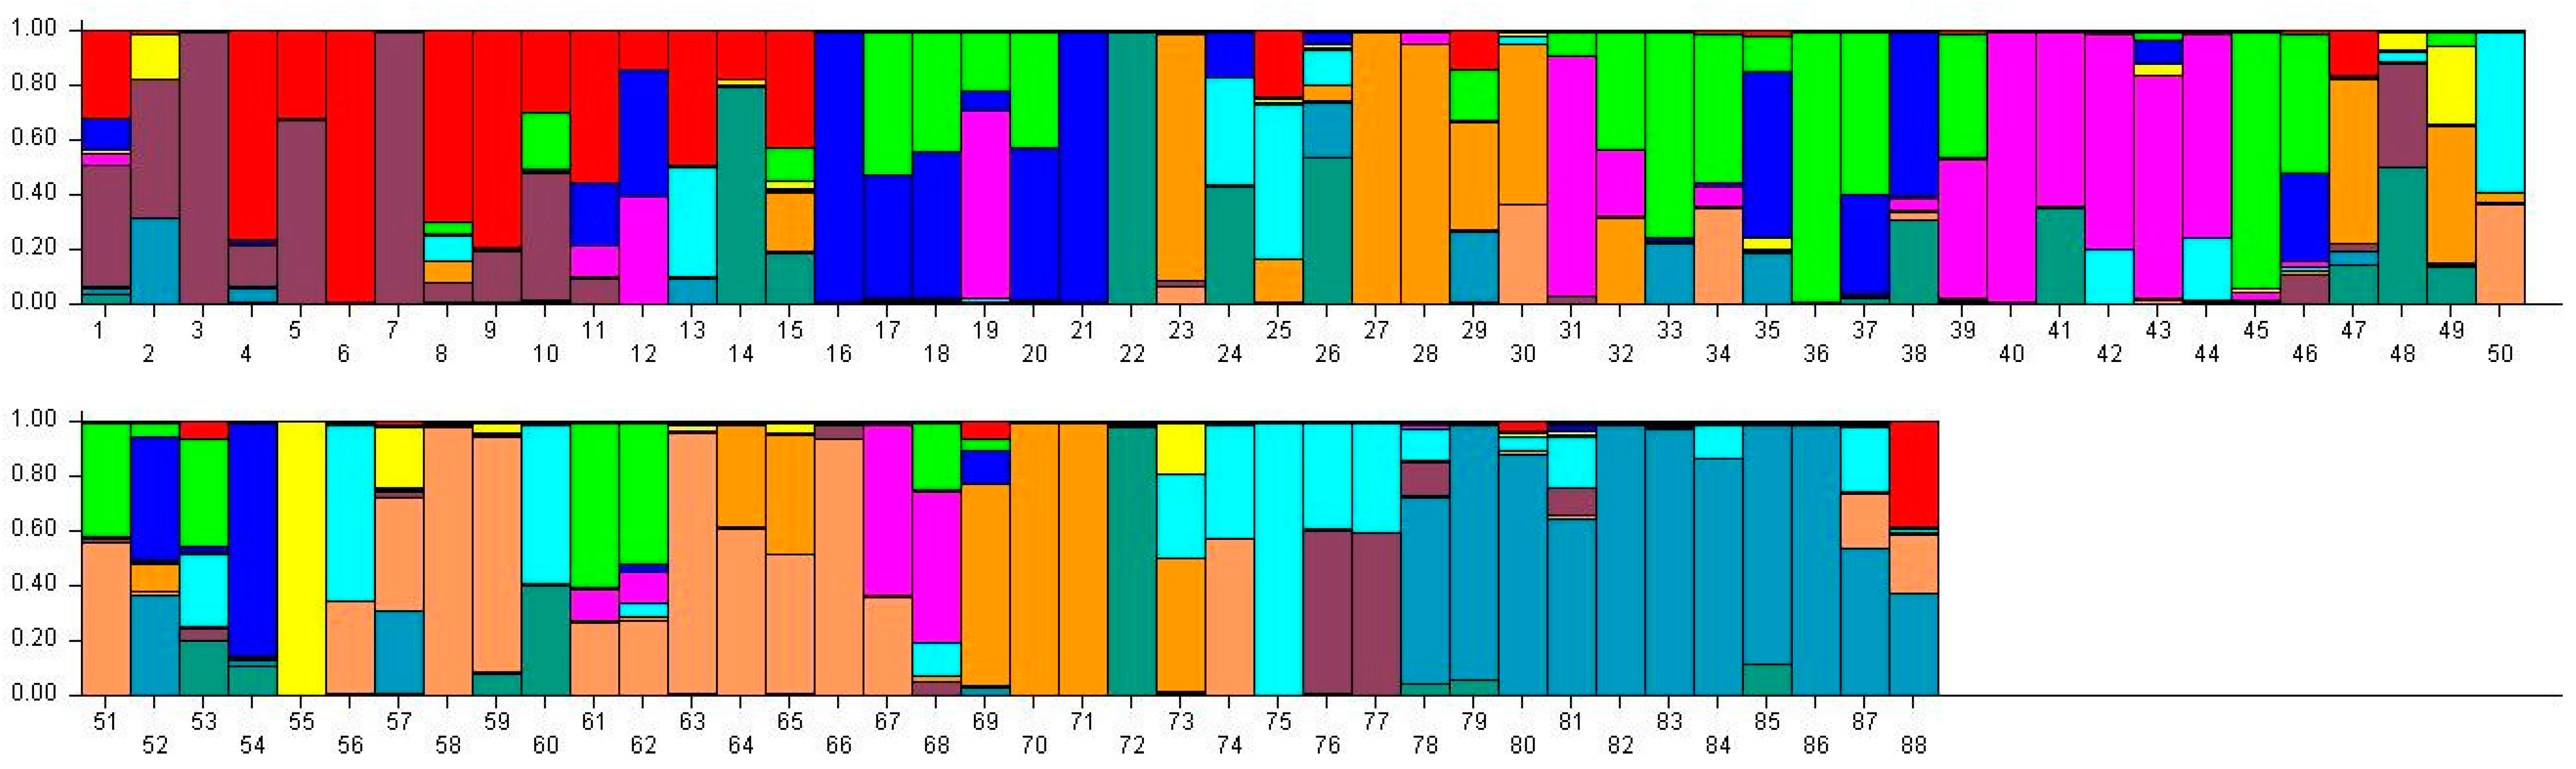
Figure 3.
Population structure of 88 broomcorn millet cultivars based on STRUCTURE analysis at K = 11. Different colors represent different groups and a bar represents a sample. The proportion of a color in which a bar is higher than other colors indicates that this sample belongs to the group which the color represents. 1–15 samples come from Heilongjiang (1, Longshu21; 2, Longshu5; 3, Longshu10; 4, Longshu9; 5, Longshu23; 6, Xiaonangouheimizi; 7, Longshu12; 8, LOngshu3; 9,Longshu16; 10, Longshu2; 11, NIanfeng5; 12, Nianfeng2; 13, Nianfeng2-1; 14, Qishu1; 15, Nianfeng7), 16–30samples come from Shanxi (16, Jinshu3; 17, Ziluodai; 18, Jinshu2; 19, Tianzhenshuzi; 20, Jinshu9; 21, 8114-15-8; 22, Yanshu7; 23, JInshu6; 24, Yanshu8; 25, Jinshu8; 26, Jinshu4; 27, Jinshu5; 28, Jinshu7; 29, Pinmi1; 30, Jinshu1), 31–50 samples come from Inner Mongolia (31, Yixuanhuangmi; 32, Zhunqihuangshuzi; 33, Neimi5; 34, Neimi3; 35, Yixuandahongmi; 36, Chimi2; 37, Yimi5; 38, Niuluandanmi; 39, Neimi7; 40, Linhehuangmi; 41, Neimi6; 42, Daqiqingmizi; 43, Helindahuangmi; 44, Helingdahuangmi2; 45, Neimi3; 46, Dangdidahuangmizi; 47, Chishu1; 48, Chishu2; 49, Chimi1; 50, Neimi1), 51–60 samples come from Ningxia (51, Ningmi10; 52, Haiyuanziganhong; 53, Ningmi15; 54, Ziganhong; 55, NIngmi5; 56, Ningmi11; 57, Ningmi13; 58, Ningmi14; 59, Ningmi16; 60, Ningmi17), 61–66 samples come from Gansu (61, Longmi3; 62, Ganmi1; 63, Longmi4; 64, Longmi5; 65, Longmi7; 66, Longmi8), 67–71 samples come from Shaanxi (67,Yumi2; 68, Shenmuhongmizi; 69, Yushu3; 70, Yushu2; 71, Yushu1), 72–73 samples come from Jilin (72, Jiushu1; 73, Panlonghuangmi), 74–88 are samples come from Inner Mongolia which with same name (74–75 are Xiaobaishu; 76–78 are Dongshengerhuangmi; 79–88 are Ziganhongmi).
![Ijms 17 00370 g003]()
Table 1.
Genetic parameters of the 67 polymorphic simple sequence repeat markers used in this study.
Table 1.
Genetic parameters of the 67 polymorphic simple sequence repeat markers used in this study.
| Locus Name | Ng a | Na b | Ne c | I d | Ho e | He f | H g | FST h | PIC i |
|---|
| F265 | 10 | 4 | 3.215 | 1.225 | 0.830 | 0.693 | 0.689 | 0.121 | 0.626 |
| F258 | 6 | 3 | 2.997 | 1.098 | 0.435 | 0.670 | 0.666 | 0.150 | 0.592 |
| F334 | 3 | 2 | 1.984 | 0.689 | 0.136 | 0.499 | 0.496 | 0.449 | 0.373 |
| F503 | 10 | 4 | 3.350 | 1.289 | 0.288 | 0.706 | 0.702 | 0.209 | 0.649 |
| F510 | 3 | 2 | 2.000 | 0.693 | 0.026 | 0.503 | 0.500 | 0.505 | 0.375 |
| F515 | 6 | 3 | 1.440 | 0.585 | 0.034 | 0.307 | 0.305 | 0.408 | 0.284 |
| F619 | 3 | 2 | 1.585 | 0.556 | 0.102 | 0.371 | 0.369 | 0.207 | 0.301 |
| F621 | 3 | 2 | 1.512 | 0.522 | 0.091 | 0.341 | 0.339 | 0.248 | 0.281 |
| F630 | 3 | 2 | 1.527 | 0.529 | 0.080 | 0.347 | 0.345 | 0.252 | 0.285 |
| F632 | 6 | 3 | 2.281 | 0.952 | 0.552 | 0.565 | 0.562 | 0.175 | 0.500 |
| F691 | 3 | 2 | 1.996 | 0.692 | 0.091 | 0.502 | 0.499 | 0.352 | 0.374 |
| F1080 | 6 | 3 | 1.586 | 0.682 | 0.023 | 0.372 | 0.370 | 0.206 | 0.339 |
| F653 | 10 | 4 | 2.400 | 1.005 | 1.000 | 0.589 | 0.583 | 0.051 | 0.498 |
| F1761 | 3 | 2 | 1.994 | 0.692 | 0.057 | 0.501 | 0.498 | 0.296 | 0.374 |
| F1036 | 3 | 2 | 1.047 | 0.109 | 0.000 | 0.045 | 0.044 | 0.123 | 0.043 |
| F1065 | 10 | 4 | 2.692 | 1.180 | 0.322 | 0.632 | 0.629 | 0.200 | 0.585 |
| F1429 | 10 | 4 | 3.665 | 1.340 | 0.955 | 0.731 | 0.727 | 0.079 | 0.677 |
| F1400 | 6 | 3 | 1.990 | 0.830 | 0.205 | 0.500 | 0.498 | 0.423 | 0.427 |
| F1387 | 10 | 4 | 3.712 | 1.346 | 0.886 | 0.735 | 0.731 | 0.139 | 0.681 |
| F1380 | 15 | 5 | 4.290 | 1.519 | 1.000 | 0.771 | 0.767 | 0.155 | 0.729 |
| F635 | 6 | 3 | 1.444 | 0.574 | 0.109 | 0.310 | 0.307 | 0.726 | 0.281 |
| F746 | 6 | 3 | 1.456 | 0.594 | 0.114 | 0.315 | 0.313 | 0.449 | 0.289 |
| F780 | 3 | 2 | 1.831 | 0.646 | 0.125 | 0.458 | 0.454 | 0.404 | 0.351 |
| F836 | 10 | 4 | 1.413 | 0.627 | 0.094 | 0.295 | 0.292 | 0.803 | 0.280 |
| F845 | 6 | 3 | 1.630 | 0.692 | 0.046 | 0.389 | 0.387 | 0.274 | 0.347 |
| F850 | 6 | 3 | 1.399 | 0.539 | 0.034 | 0.287 | 0.285 | 0.226 | 0.261 |
| F1067 | 6 | 3 | 1.147 | 0.280 | 0.000 | 0.129 | 0.128 | 0.273 | 0.123 |
| F1071 | 6 | 3 | 1.135 | 0.269 | 0.000 | 0.120 | 0.119 | 0.834 | 0.114 |
| F1553 | 3 | 2 | 1.585 | 0.556 | 0.057 | 0.371 | 0.369 | 0.291 | 0.301 |
| F1610 | 3 | 2 | 2.000 | 0.693 | 0.058 | 0.503 | 0.500 | 0.332 | 0.375 |
| F1625 | 3 | 2 | 1.964 | 0.684 | 0.068 | 0.494 | 0.491 | 0.448 | 0.370 |
| F1672 | 6 | 3 | 2.045 | 0.880 | 0.330 | 0.514 | 0.511 | 0.309 | 0.456 |
| F1703 | 3 | 2 | 1.938 | 0.677 | 0.071 | 0.488 | 0.484 | 0.757 | 0.367 |
| F1760 | 10 | 4 | 2.367 | 1.019 | 0.215 | 0.581 | 0.578 | 0.352 | 0.504 |
| F1908 | 6 | 3 | 2.993 | 1.097 | 0.852 | 0.670 | 0.666 | 0.074 | 0.592 |
| F1940 | 3 | 2 | 1.337 | 0.419 | 0.023 | 0.253 | 0.252 | 0.313 | 0.220 |
| F2068 | 3 | 2 | 1.266 | 0.366 | 0.080 | 0.211 | 0.210 | 0.556 | 0.188 |
| F2074 | 3 | 2 | 1.872 | 0.659 | 0.080 | 0.469 | 0.466 | 0.379 | 0.357 |
| F2185 | 3 | 2 | 1.225 | 0.330 | 0.000 | 0.185 | 0.184 | 0.227 | 0.167 |
| F2202 | 3 | 2 | 1.933 | 0.676 | 0.023 | 0.486 | 0.483 | 0.375 | 0.366 |
| F2281 | 3 | 2 | 1.458 | 0.494 | 0.016 | 0.317 | 0.314 | 0.786 | 0.265 |
| F2288 | 3 | 2 | 1.996 | 0.692 | 0.114 | 0.502 | 0.499 | 0.273 | 0.374 |
| F2290 | 3 | 2 | 2.000 | 0.693 | 0.138 | 0.503 | 0.500 | 0.240 | 0.375 |
| F2305 | 6 | 3 | 2.896 | 1.081 | 0.193 | 0.659 | 0.655 | 0.203 | 0.581 |
| F2370 | 6 | 3 | 1.815 | 0.683 | 0.636 | 0.452 | 0.449 | 0.179 | 0.358 |
| F2382 | 3 | 2 | 2.000 | 0.693 | 0.011 | 0.503 | 0.500 | 0.425 | 0.375 |
| F2540 | 6 | 3 | 1.293 | 0.463 | 0.091 | 0.228 | 0.227 | 0.187 | 0.214 |
| F2551 | 6 | 3 | 1.372 | 0.532 | 0.136 | 0.273 | 0.271 | 0.145 | 0.254 |
| F2734 | 3 | 2 | 1.839 | 0.649 | 0.159 | 0.459 | 0.456 | 0.328 | 0.352 |
| F2782 | 3 | 2 | 1.294 | 0.388 | 0.057 | 0.229 | 0.227 | 0.335 | 0.201 |
| F2901 | 3 | 2 | 1.600 | 0.562 | 0.023 | 0.377 | 0.375 | 0.218 | 0.305 |
| F2979 | 3 | 2 | 1.146 | 0.249 | 0.023 | 0.128 | 0.127 | 0.262 | 0.119 |
| F2019 | 6 | 3 | 1.406 | 0.561 | 0.034 | 0.290 | 0.289 | 0.198 | 0.269 |
| BM114 | 6 | 3 | 2.377 | 0.936 | 0.897 | 0.583 | 0.579 | 0.043 | 0.487 |
| BM136 | 3 | 2 | 1.133 | 0.234 | 0.011 | 0.118 | 0.117 | 0.345 | 0.110 |
| BM212 | 6 | 3 | 2.848 | 1.071 | 0.818 | 0.653 | 0.649 | 0.150 | 0.574 |
| BM289 | 3 | 2 | 1.727 | 0.612 | 0.102 | 0.423 | 0.421 | 0.346 | 0.332 |
| BM295 | 6 | 3 | 2.630 | 1.028 | 0.609 | 0.623 | 0.620 | 0.189 | 0.546 |
| BM306 | 3 | 2 | 1.576 | 0.552 | 0.000 | 0.369 | 0.366 | 0.745 | 0.299 |
| BM341 | 3 | 2 | 1.789 | 0.633 | 0.094 | 0.448 | 0.441 | 0.810 | 0.344 |
| BM344 | 3 | 2 | 1.839 | 0.649 | 0.000 | 0.459 | 0.456 | 0.203 | 0.352 |
| BM374 | 6 | 3 | 1.630 | 0.707 | 0.188 | 0.389 | 0.386 | 0.675 | 0.354 |
| BM378 | 3 | 2 | 1.969 | 0.685 | 0.511 | 0.495 | 0.492 | 0.140 | 0.371 |
| BM396 | 10 | 4 | 3.636 | 1.331 | 0.796 | 0.729 | 0.725 | 0.173 | 0.673 |
| BM411 | 3 | 2 | 1.999 | 0.693 | 0.277 | 0.503 | 0.500 | 0.313 | 0.375 |
| BM483 | 10 | 4 | 3.258 | 1.248 | 0.309 | 0.699 | 0.693 | 0.315 | 0.633 |
| F786 | 3 | 2 | 1.920 | 0.672 | 0.000 | 0.482 | 0.479 | 0.390 | 0.364 |
| Mean | 5.209 | 2.672 | 1.995 | 0.725 | 0.235 | 0.445 | 0.442 | 0.299 | 0.376 |
| SD | 2.766 | 0.786 | 0.722 | 0.302 | 0.300 | 0.173 | 0.172 | | |
Table 2.
Distribution of allelic variation in 67 polymorphic simple sequence repeat (SSR) loci.
Table 2.
Distribution of allelic variation in 67 polymorphic simple sequence repeat (SSR) loci.
| Number of Alleles | Number of SSR Loci | Polymorphic Loci (%) |
|---|
| 2 | 34 | 50.75 |
| 3 | 22 | 32.84 |
| 4 | 10 | 14.92 |
| 5 | 1 | 1.49 |
Table 3.
Estimates of genetic diversity within 11 populations of Chinese broomcorn millet.
Table 3.
Estimates of genetic diversity within 11 populations of Chinese broomcorn millet.
| Population | Genetic Parameter |
|---|
| N a | Na b | Ne c | I d | Ho e | He f | H g | PIC h |
|---|
| 1 | 156 | 2.328 ± 0.877 | 1.843 ± 0.708 | 0.618 ± 0.377 | 0.239 ± 0.329 | 0.396 ± 0.230 | 0.380 ± 0.220 | 0.366 |
| 2 | 112 | 1.723 ± 0.781 | 1.650 ± 0.719 | 0.431 ± 0.421 | 0.215 ± 0.375 | 0.382 ± 0.358 | 0.287 ± 0.269 | 0.417 |
| 3 | 159 | 2.373 ± 0.775 | 1.821 ± 0.623 | 0.623 ± 0.336 | 0.197 ± 0.296 | 0.402 ± 0.230 | 0.309 ± 0.169 | 0.345 |
| 4 | 157 | 2.343 ± 0.897 | 1.892 ± 0.651 | 0.649 ± 0.367 | 0.217 ± 0.300 | 0.428 ± 0.225 | 0.404 ± 0.213 | 0.393 |
| 5 | 122 | 1.821 ± 0.815 | 1.552 ± 0.662 | 0.417 ± 0.395 | 0.230 ± 0.336 | 0.292 ± 0.273 | 0.264 ± 0.246 | 0.370 |
| 6 | 132 | 1.970 ± 0.797 | 1.653 ± 0.653 | 0.495 ± 0.375 | 0.206 ± 0.333 | 0.351 ± 0.255 | 0.313 ± 0.228 | 0.386 |
| 7 | 94 | 1.541 ± 0.673 | 1.472 ± 0.614 | 0.329 ± 0.382 | 0.271 ± 0.404 | 0.303 ± 0.345 | 0.223 ± 0.252 | 0.358 |
| 8 | 167 | 2.493 ± 0.823 | 1.934 ± 0.670 | 0.691 ± 0.322 | 0.263 ± 0.323 | 0.441 ± 0.188 | 0.427 ± 0.181 | 0.377 |
| 9 | 97 | 1.516 ± 0.713 | 1.483 ± 0.658 | 0.318 ± 0.405 | 0.188 ± 0.383 | 0.287 ± 0.354 | 0.215 ± 0.269 | 0.420 |
| 10 | 99 | 1.623 ± 0.662 | 1.515 ± 0.543 | 0.375 ± 0.376 | 0.240 ± 0.418 | 0.305 ± 0.299 | 0.254 ± 0.250 | 0.385 |
| 11 | 125 | 2.049 ± 0.845 | 1.709 ± 0.695 | 0.523 ± 0.380 | 0.331 ± 0.370 | 0.355 ± 0.251 | 0.332 ± 0.234 | 0.365 |
| Mean | 129.1 | 1.980 ± 0.361 | 1.684 ± 0.168 | 0.497 ± 0.133 | 0.236 ± 0.041 | 0.358 ± 0.056 | 0.310 ± 0.071 | 0.380 |
Table 4.
Number and distribution of alleles at each of 67 loci among 11 broomcorn millet populations.
Table 4.
Number and distribution of alleles at each of 67 loci among 11 broomcorn millet populations.
| Locus | Population |
|---|
| 1 | 2 | 3 | 4 | 5 | 6 | 7 | 8 | 9 | 10 | 11 |
|---|
| F265 | 2 | 3-D | 4 | 3-D | 3-D | 4 | 2-AD | 4 | 3-D | 2-AD | 2-AD |
| F258 | 3 | 3-C | 3 | 3 | 3 | 3 | 2-B | 3 | 2-BC | 2 | 3 |
| F334 | 2 | 1-B | 2 | 2 | 2 | 2 | 1-A | 2 | 1-A | 1A | 2 |
| F503 | 4 | 2 | 3 | 4 | 3 | 3 | 2 | 4 | 3 | 1-A(h) | 4 |
| F510 | 2 | 2 | 2 | 2 | 2 | 2 | 1-A | 2 | - | 1-A | 1-A |
| F515 | 2 | 2 | 2 | 3 | 2 | 2 | 1-A | 3 | 2 | 1-B | 1-B |
| F619 | 2 | 1-A | 2 | 2 | 1-A | 2 | 2 | 2 | 2 | 2 | 2 |
| F621 | 2 | 1-A | 2 | 2 | 1-A | 2 | 1-A | 2 | 2 | 2 | 2 |
| F630 | 2 | 1-A | 2 | 2 | 1-A | 2 | 1-A | 2 | 2 | 2 | 2 |
| F632 | 3 | 1-B(i) | 3 | 3 | 2 | 3 | 2 | 3 | 2 | 2 | 3 |
| F691 | 2 | 2 | 2 | 2 | 2 | 2 | 1-B | 2 | 1-B | 2 | 2 |
| F1080 | 3 | 2 | 3 | 1-B | 3 | 3 | 1-B | 3 | 2 | 1-B | 1-B |
| F653 | 3 | 2 | 2 | 4 | 4 | 2 | 2-CD | 2 | 3 | 2-CD | 2-CD |
| F1761 | 2 | 2 | 2 | 2 | 2 | 2 | 2 | 2(j) | 1-B | 2 | 1-B |
| F1036 | 2(a) | 1-A | 1-A | 1-A | 1-A | 1-A | 1-A | 1-A | 1-A | 1-A | 1-A |
| F1065 | 4 | 3 | 4 | 4 | 2 | 2 | 1-C(k) | 4 | 2 | 2 | 4 |
| F1429 | 4 | 4 | 4 | 4 | 2-AC | 4 | 4 | 4 | 4 | 2-BD | 4 |
| F1400 | 2 | 1-C | 3 | 3 | 2 | 2 | 2 | 3 | 1-B | 2 | 2 |
| F1387 | 4 | 4 | 4 | 4 | 3 | 4 | 3 | 4 | 2-BD | 3 | 2-AD |
| F1380 | 5 | 3 | 4 | 5 | 3 | 4 | 2-CE | 5 | 2-CD | 3 | 4 |
| F635 | 1-C | 1-C | 1-C | 3 | 3 | 1-C | - | 3 | 2 | - | - |
| F746 | 3 | 1-B | 2 | 2 | 1-B | 1-B | 1-B | 3 | 1-B | 1-B | 1-B |
| F780 | 2 | 2 | 2 | 2 | 1-B | 1-B | 1-B | 2 | 1-B | 2 | 2 |
| F836 | 4 | 1-B | 3 | 1-B | 1-B | 1-B | - | 4 | 1-B | - | - |
| F845 | 3 | 1-A | 3 | 2 | 1-A | 1-A | 1-A | 3 | 1-A | 1-A | 1-A |
| F850 | 3(b) | 1-A | 2 | 1-A | 1-A | 1-A | 1-A | 2 | 1-A | 1-A | 1-A |
| F1067 | 2(c) | 2 | 2 | 1-B | 1-B | 2 | 1-B | 2 | 1-B | 1-B | 1-B |
| F1071 | 1-B | 2 | 2(e) | 1-B | 1-B | 2 | - | 2 | 1-B | - | - |
| F1553 | 2 | 1-B | 2 | 2 | 2 | 2 | 1-B | 2 | 1-B | 2 | 2 |
| F1610 | 2 | 2 | 2 | 2 | 2 | 2 | 1-B | 2 | 1-A | 2 | 2 |
| F1625 | 2 | 2 | 2 | 2 | 1-B | 2 | 1-B | 2 | 1-B | 1-A | 2 |
| F1672 | 3 | 1-B | 2 | 2 | 2 | 1-B | 3 | 3 | 1-B | 3 | 3 |
| F1703 | 2 | - | 2 | 2 | 1-B | 1-A | 1-B | 2 | - | 1-A | 2 |
| F1760 | 1-D | 1-D | 4 | 4 | 4 | 3 | 1-D | 4 | 1-D | 1-D | 1-D |
| F1908 | 3 | 3 | 3 | 3 | 3 | 3 | 3 | 3 | 2-BC | 3 | 2-AC |
| F1940 | 1-B | 1-B | 2 | 2 | 1-B | 2 | 1-B | 2 | 1-B | 2 | 2 |
| F2068 | 2 | 1-A | 2 | 2 | 1-A | 1-A | 2 | 2 | 1-A | 1-B | 2 |
| F2074 | 2 | 1-A | 2 | 2 | 2 | 2 | 2 | 2 | 1-B | 1-A | 2 |
| F2185 | 1-B | 1-B | 2 | 1-B | 1-B | 2 | 1-B | 2 | 1-B | 1-B | 1-B |
| F2202 | 2 | 2 | 2 | 2 | 2 | 1-B | 1-A | 2 | 1-A | 2 | 2 |
| F2281 | 1-A | 1-A | 2 | 2 | 1-A | 2 | - | 2 | 1-A | - | - |
| F2288 | 2 | 2 | 2 | 2 | 2 | 2 | 2 | 2 | 1-A | 2 | 2 |
| F2290 | 2 | 2 | 2 | 2 | 2 | 2 | 2 | 2 | 1-A | 2 | 2 |
| F2305 | 3 | 2 | 3 | 3 | 2 | 2 | 2 | 3 | 2 | 2-AC | 3 |
| F2370 | 2 | 1-B | 2 | 2 | 2 | 2 | 2-BC | 2(d) | 2 | 2-BC | 2-BC |
| F2382 | 2 | 1-A | 2 | 2 | 1-B | 2 | 1-B | 2 | 2 | 1-A | 2 |
| F2540 | 1-A | 2 | 2 | 2 | 1-A | 1-A | 1-A | 2 | 1-A | 1-A | 2 |
| F2551 | 2 | 2 | 2 | 3 | 1-A | 1-A | 1-A | 3 | 1-A | 1-A | 3 |
| F2734 | 2 | 2 | 2 | 2 | 2 | 2 | 1-A | 2 | 1-A | 1-A | 2 |
| F2782 | 1-B | 2 | 2 | 2 | 2 | 2 | 1-B | 2 | 1-B | 1-B | 2 |
| F2901 | 2 | 1-B | 2 | 2 | 2 | 2 | 2 | 2 | 2 | 1-B | 1-B |
| F2979 | 2 | 1-B | 2 | 1-B | 1-B | 1-B | 1-B | 1-B | 1-B | 1-B | 1-B |
| F2019 | 2 | 1-B | 2 | 2 | 1-B | 2 | 1-B | 2 | 1-B | 1-B | 1-B |
| BM114 | 3 | 2 | 3 | 3 | 2 | 2 | 2 | 3 | 2 | 2 | 3 |
| BM136 | 2(f) | 1-A | 1-A | 1-A | 1-A | 1-A | 1-A | 1-A | 1-A | 1-A | 1-A |
| BM212 | 3(g) | 2 | 3 | 3 | 3 | 2 | 2 | 3 | 2 | 3 | 3 |
| BM289 | 2 | 1-A | 2 | 2 | 2 | 2 | 1-A | 2 | 1-A | 1-A | 1-A |
| BM295 | 3 | 3 | 3 | 3 | 3 | 3 | 2 | 3 | 1-A | 2 | 3 |
| BM306 | 1-A | - | 1-A | 2 | 2 | 1-A | 1-B | 2 | - | 1-A | 2 |
| BM341 | 2 | 1-B | 2 | 2 | 1-A | 1-A | - | 2 | 1-B | - | - |
| BM344 | 2 | 2 | 2 | 2 | 1-A | 1-A | 2 | 2 | 2 | 2 | 2 |
| BM374 | 2 | 2 | 3 | 3 | 1-B | 2 | - | 3 | 1-B | - | - |
| BM378 | 2 | 2 | 2 | 2 | 2 | 2 | 2 | 2 | 2 | 2 | 2 |
| BM396 | 4 | 3 | 4 | 4 | 3 | 3 | 2 | 4 | 3 | 2 | 2 |
| BM411 | 2 | 2 | 2 | 2 | 2 | 2 | 2 | 2 | 1-A | 1-A | 2 |
| BM483 | 3 | 2 | 3 | 3 | 2 | 2 | 1-C | 2 | 1-B | 3 | 4 |
| F786 | 2 | 1-A | 2 | 2 | 1-B | 2 | 2 | 2 | 2 | 1-A | 2 |
| NOP a | 154 | 77 | 158 | 144 | 90 | 114 | 94 | 163 | 96 | 99 | 124 |
| NOFP (%) b | 9 (13.4) | 31 (46.3) | 4 (6.0) | 10 (14.9) | 29 (43.3) | 18 (26.9) | 38 (56.7) | 3 (4.5) | 43 (64.2) | 34 (50.7) | 21 (31.3) |
| NOR c | 165 | | 177 | | | | | 174 | | | |
| NOUR (%) d | 6 (3.64) | | 2 (1.13) | 3 (1.72) |
Table 5.
Distribution of broomcorn millet accessions from various provinces based on cluster analysis.
Table 5.
Distribution of broomcorn millet accessions from various provinces based on cluster analysis.
| Province | Group A | Group B | Group C | Group D | Total Accessions |
|---|
| Heilongjiang | 12 | 2 | 2 | 0 | 16 |
| Shanxi | 0 | 4 | 11 | 0 | 15 |
| Inner Mongolia | 11 | 16 | 5 | 0 | 34 |
| Ningxia | 0 | 3 | 7 | 1 | 11 |
| Gansu | 0 | 2 | 4 | 0 | 5 |
| Shaanxi | 2 | 2 | 2 | 0 | 5 |
| Jilin | 0 | 0 | 2 | 0 | 2 |
| Accessions in each group | 25 | 29 | 33 | 1 | 88 |
Table 6.
Distribution of 88 broomcorn millet accessions based on STRUCTURE analysis (K = 3).
Table 6.
Distribution of 88 broomcorn millet accessions based on STRUCTURE analysis (K = 3).
| Province | Group 1 | Group 2 | Group 3 | Total |
|---|
| Heilongjiang | 1 | 13 | 1 | 15 |
| Shanxi | 6 | 0 | 9 | 15 |
| Inner Mongolia | 16 | 12 | 5 | 33 |
| Ningxia | 4 | 0 | 6 | 10 |
| Gansu | 2 | 0 | 4 | 6 |
| Shaanxi | 2 | 1 | 4 | 7 |
| Jilin | 0 | 0 | 2 | 2 |
| Total | 31 | 26 | 31 | 88 |
Table 7.
Distribution of 88 broomcorn millet accessions based on STRUCTURE analysis (K = 11).
Table 7.
Distribution of 88 broomcorn millet accessions based on STRUCTURE analysis (K = 11).
| Province | Group 1 | Group 2 | Group 3 | Group 4 | Group 5 | Group 6 | Group 7 | Group 8 | Group 9 | Group 10 | Group 11 | Total |
|---|
| Heilongjiang | 7 | 0 | 1 | 0 | 0 | 0 | 0 | 6 | 0 | 0 | 1 | 15 |
| Shanxi | 0 | 0 | 5 | 0 | 1 | 1 | 5 | 0 | 0 | 0 | 3 | 15 |
| Inner Mongolia | 0 | 7 | 1 | 0 | 8 | 2 | 2 | 2 | 1 | 9 | 1 | 33 |
| Ningxia | 0 | 1 | 2 | 1 | 0 | 2 | 0 | 0 | 4 | 0 | 0 | 10 |
| Gansu | 0 | 2 | 0 | 0 | 0 | 0 | 0 | 0 | 4 | 0 | 0 | 6 |
| Shaanxi | 0 | 0 | 0 | 0 | 2 | 0 | 3 | 0 | 0 | 2 | 0 | 7 |
| Jilin | 0 | 0 | 0 | 0 | 0 | 0 | 1 | 0 | 0 | 0 | 1 | 2 |
| Total | 7 | 10 | 9 | 1 | 11 | 5 | 11 | 8 | 9 | 11 | 6 | 88 |


