
Placental Expression Patterns of Galectin-1, Galectin-2, Galectin-3 and Galectin-13 in Cases of Intrauterine Growth Restriction (IUGR)


Abstract
: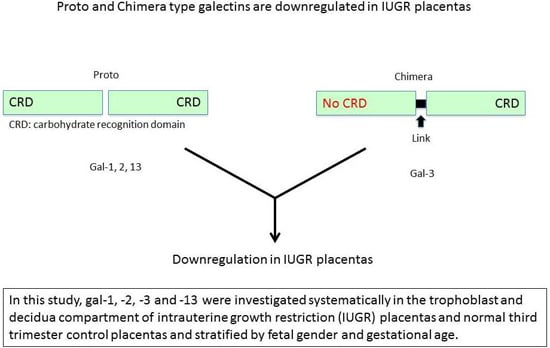
1. Introduction
2. Results
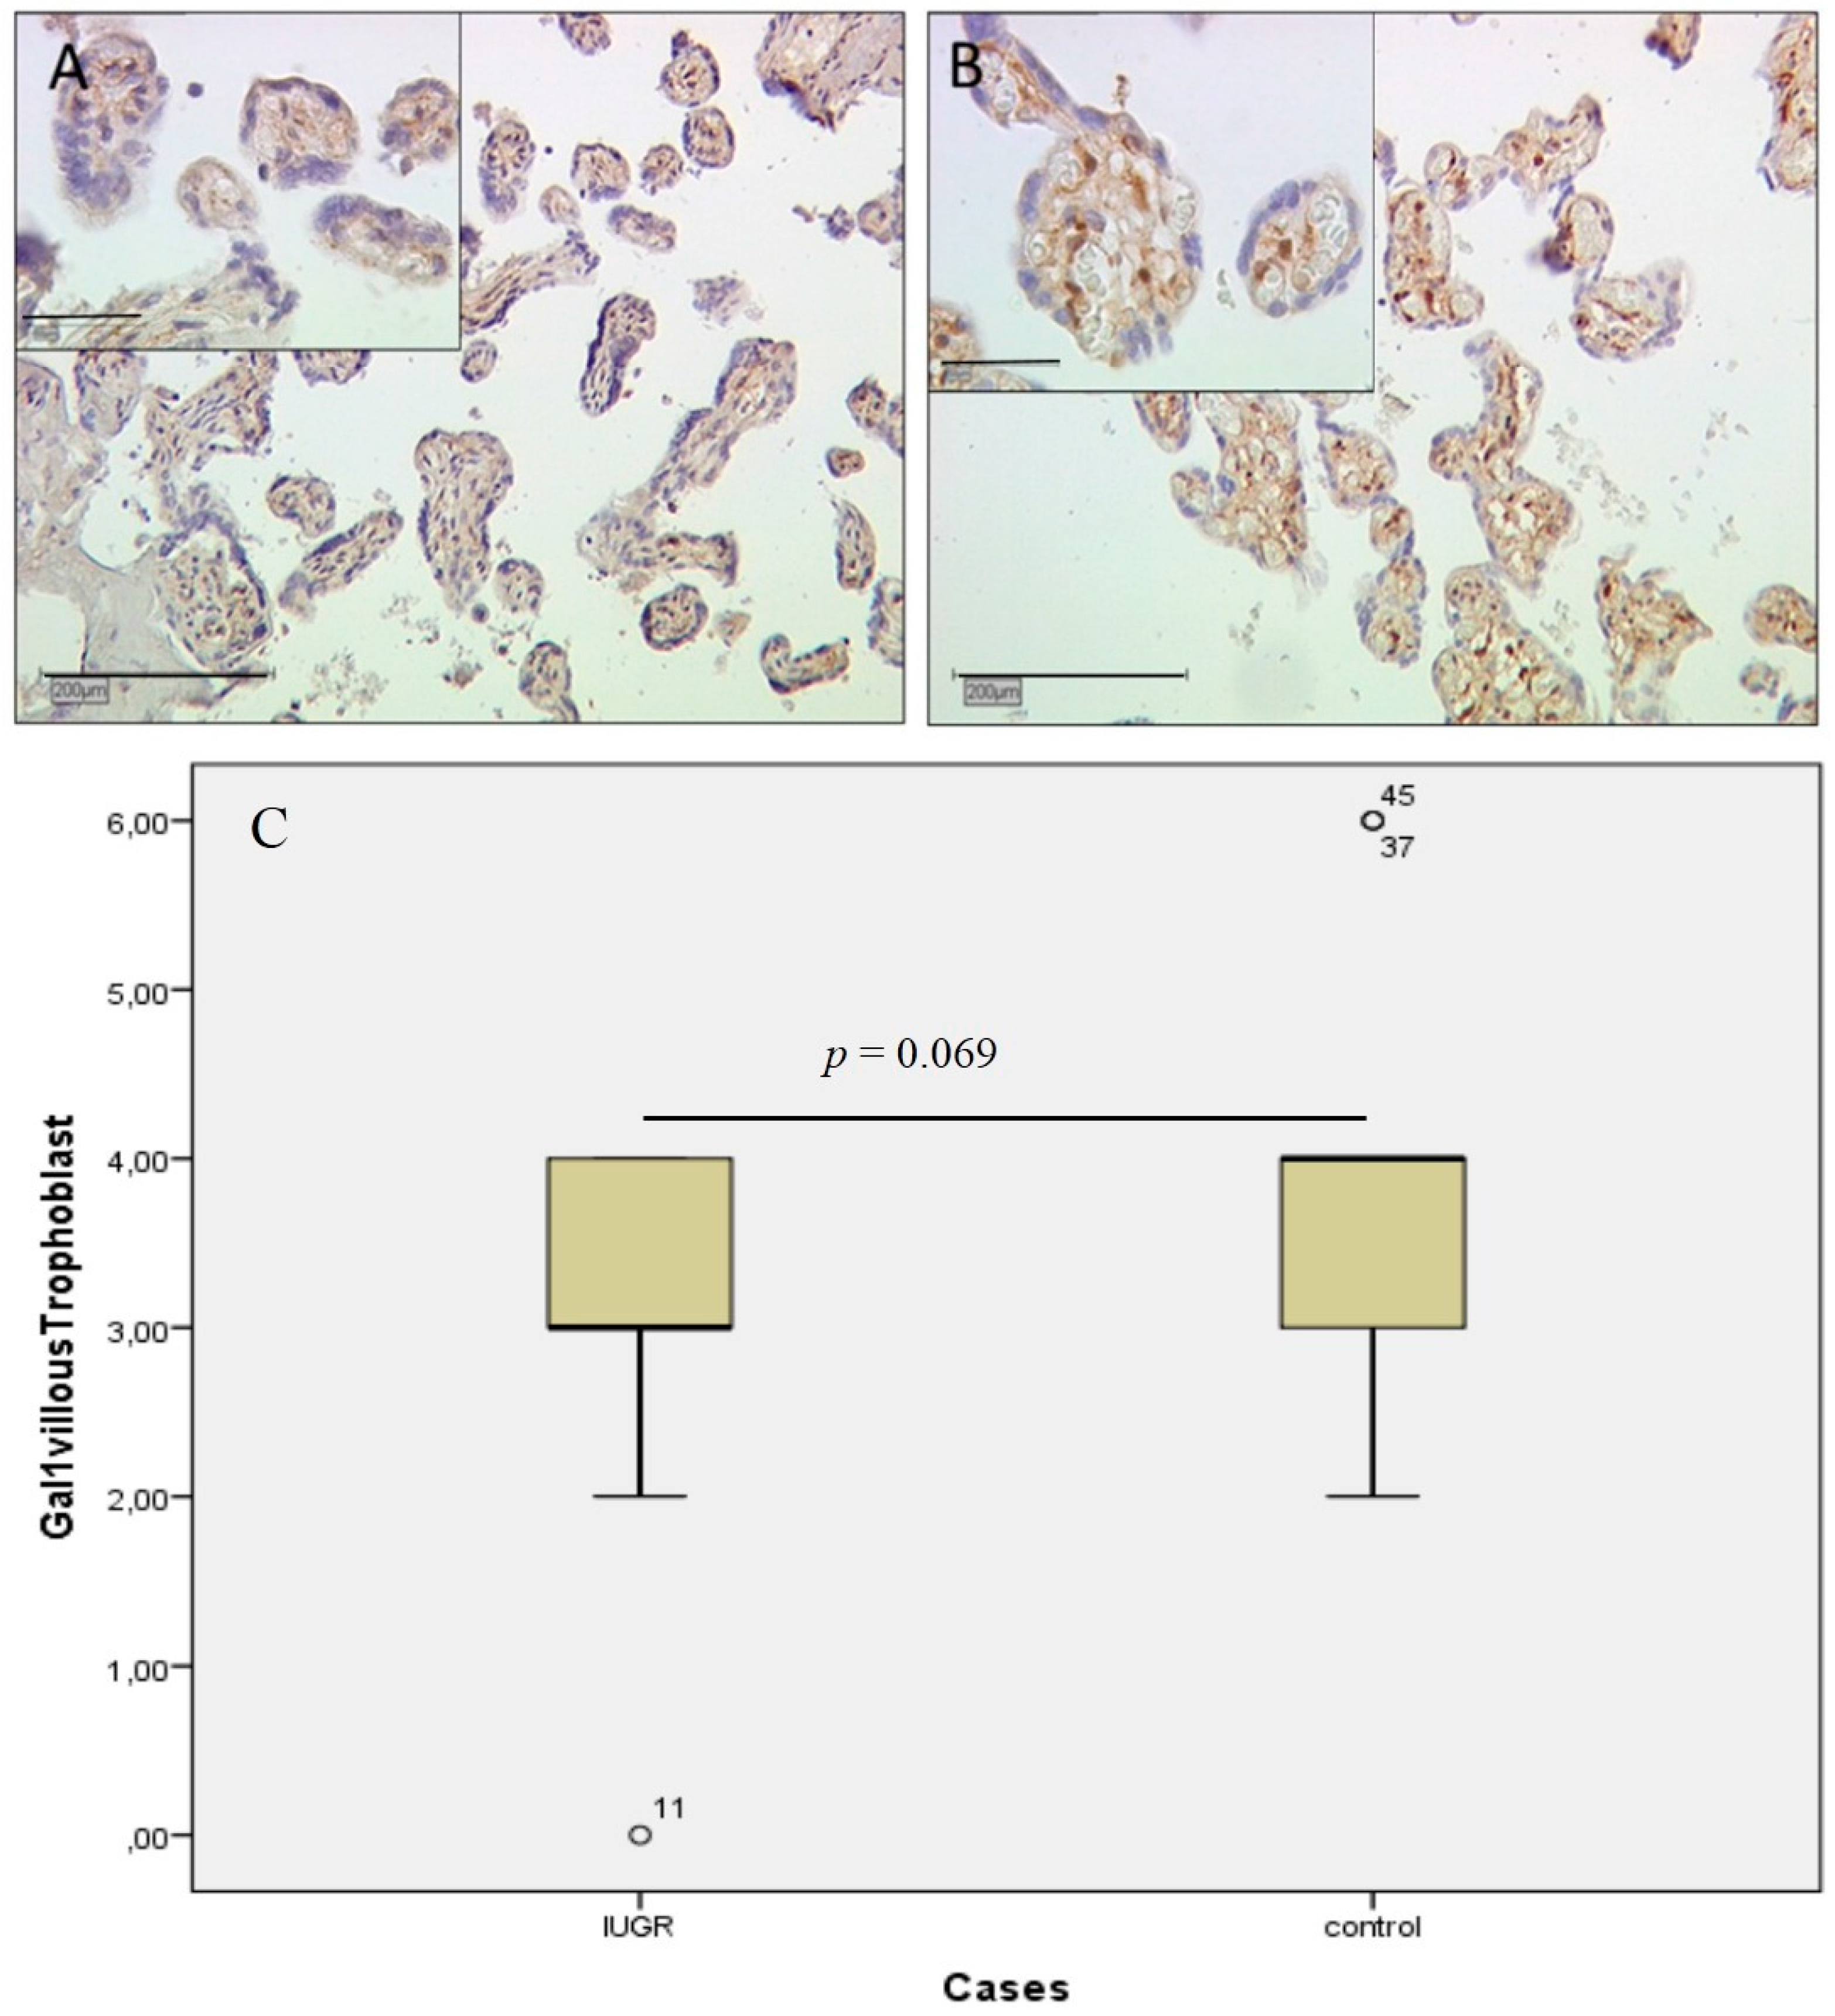
2.1. Gal-1 Expression Shows No Significant Changes in IUGR Placentas in Villous Trophoblasts
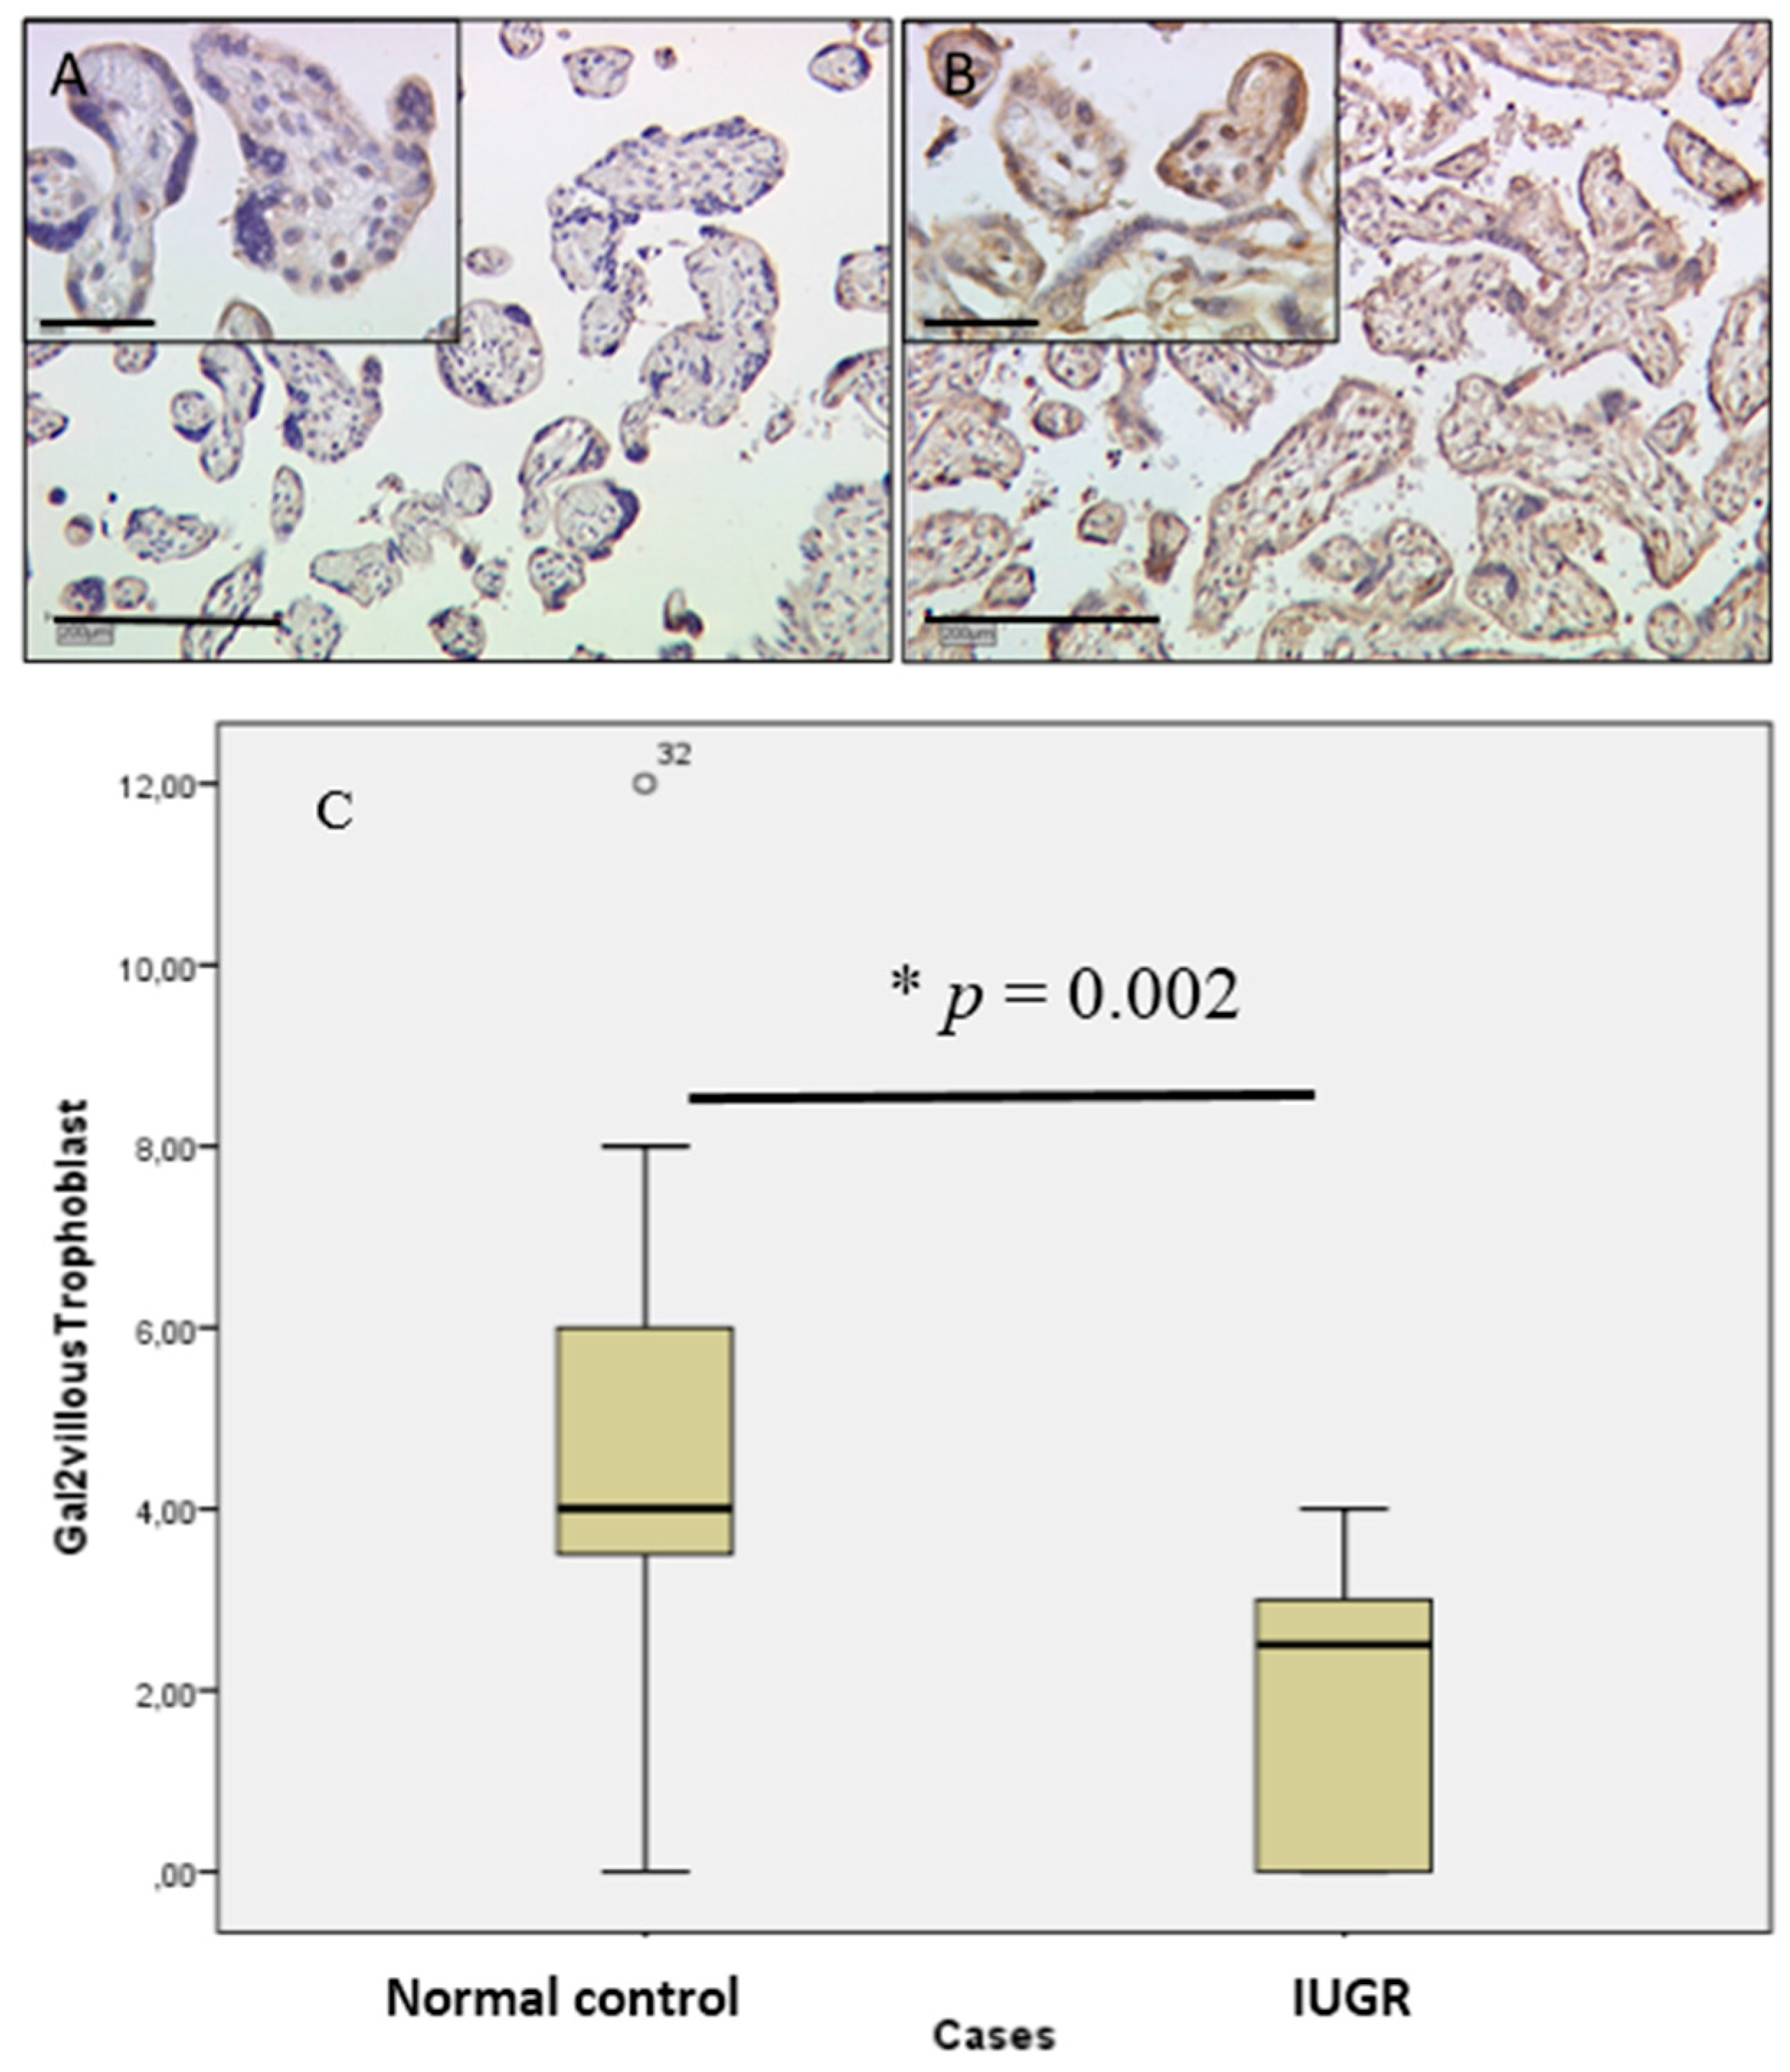
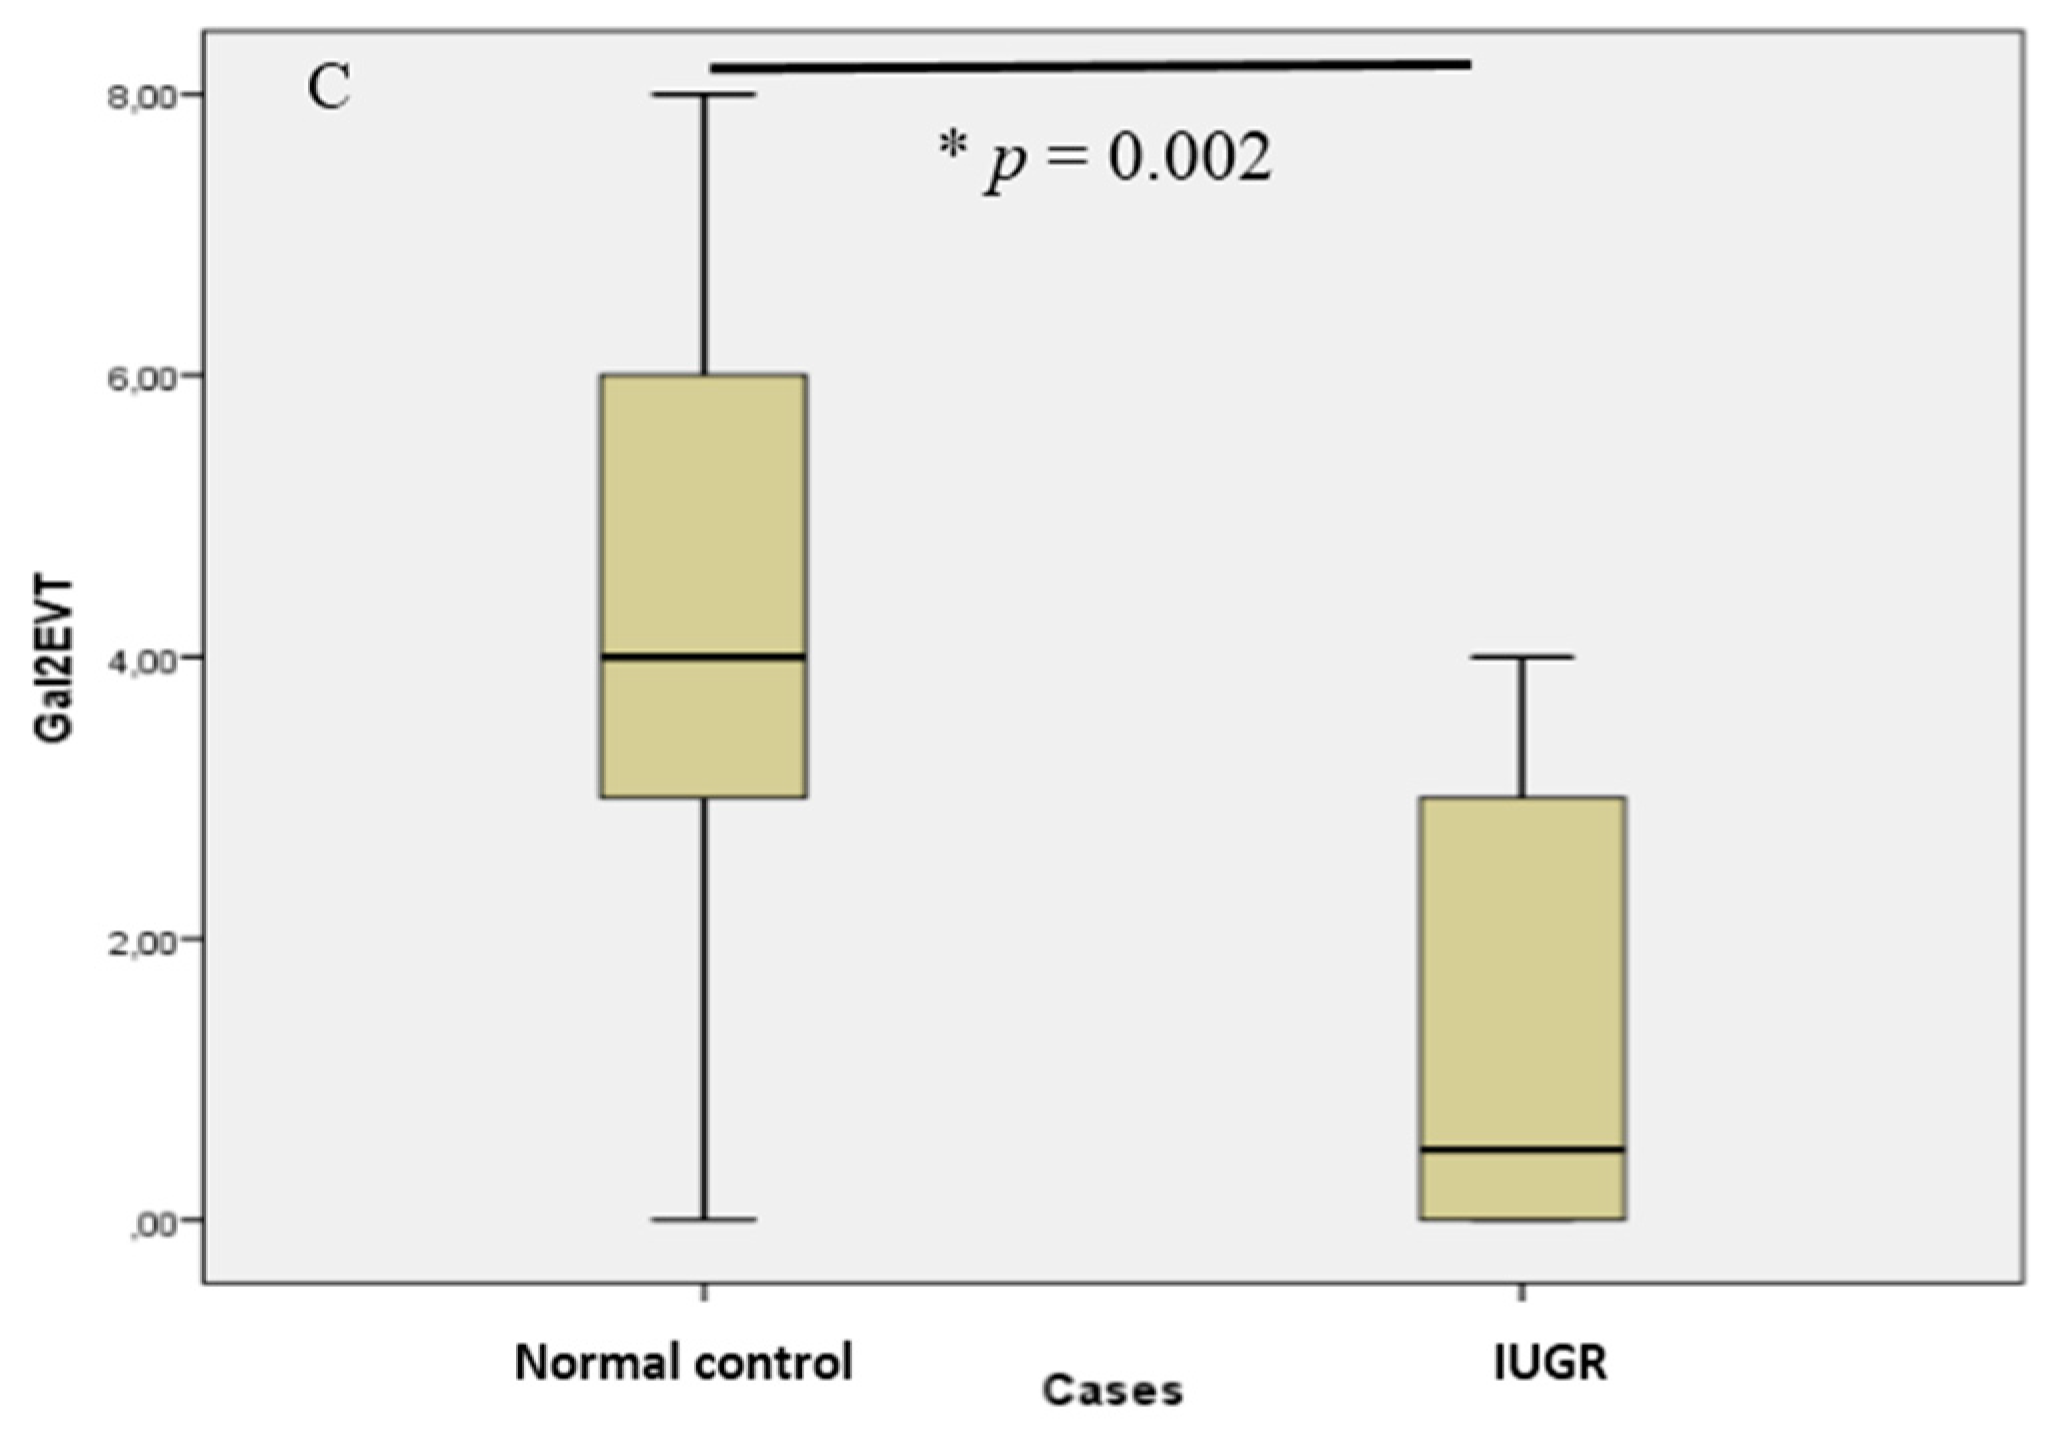
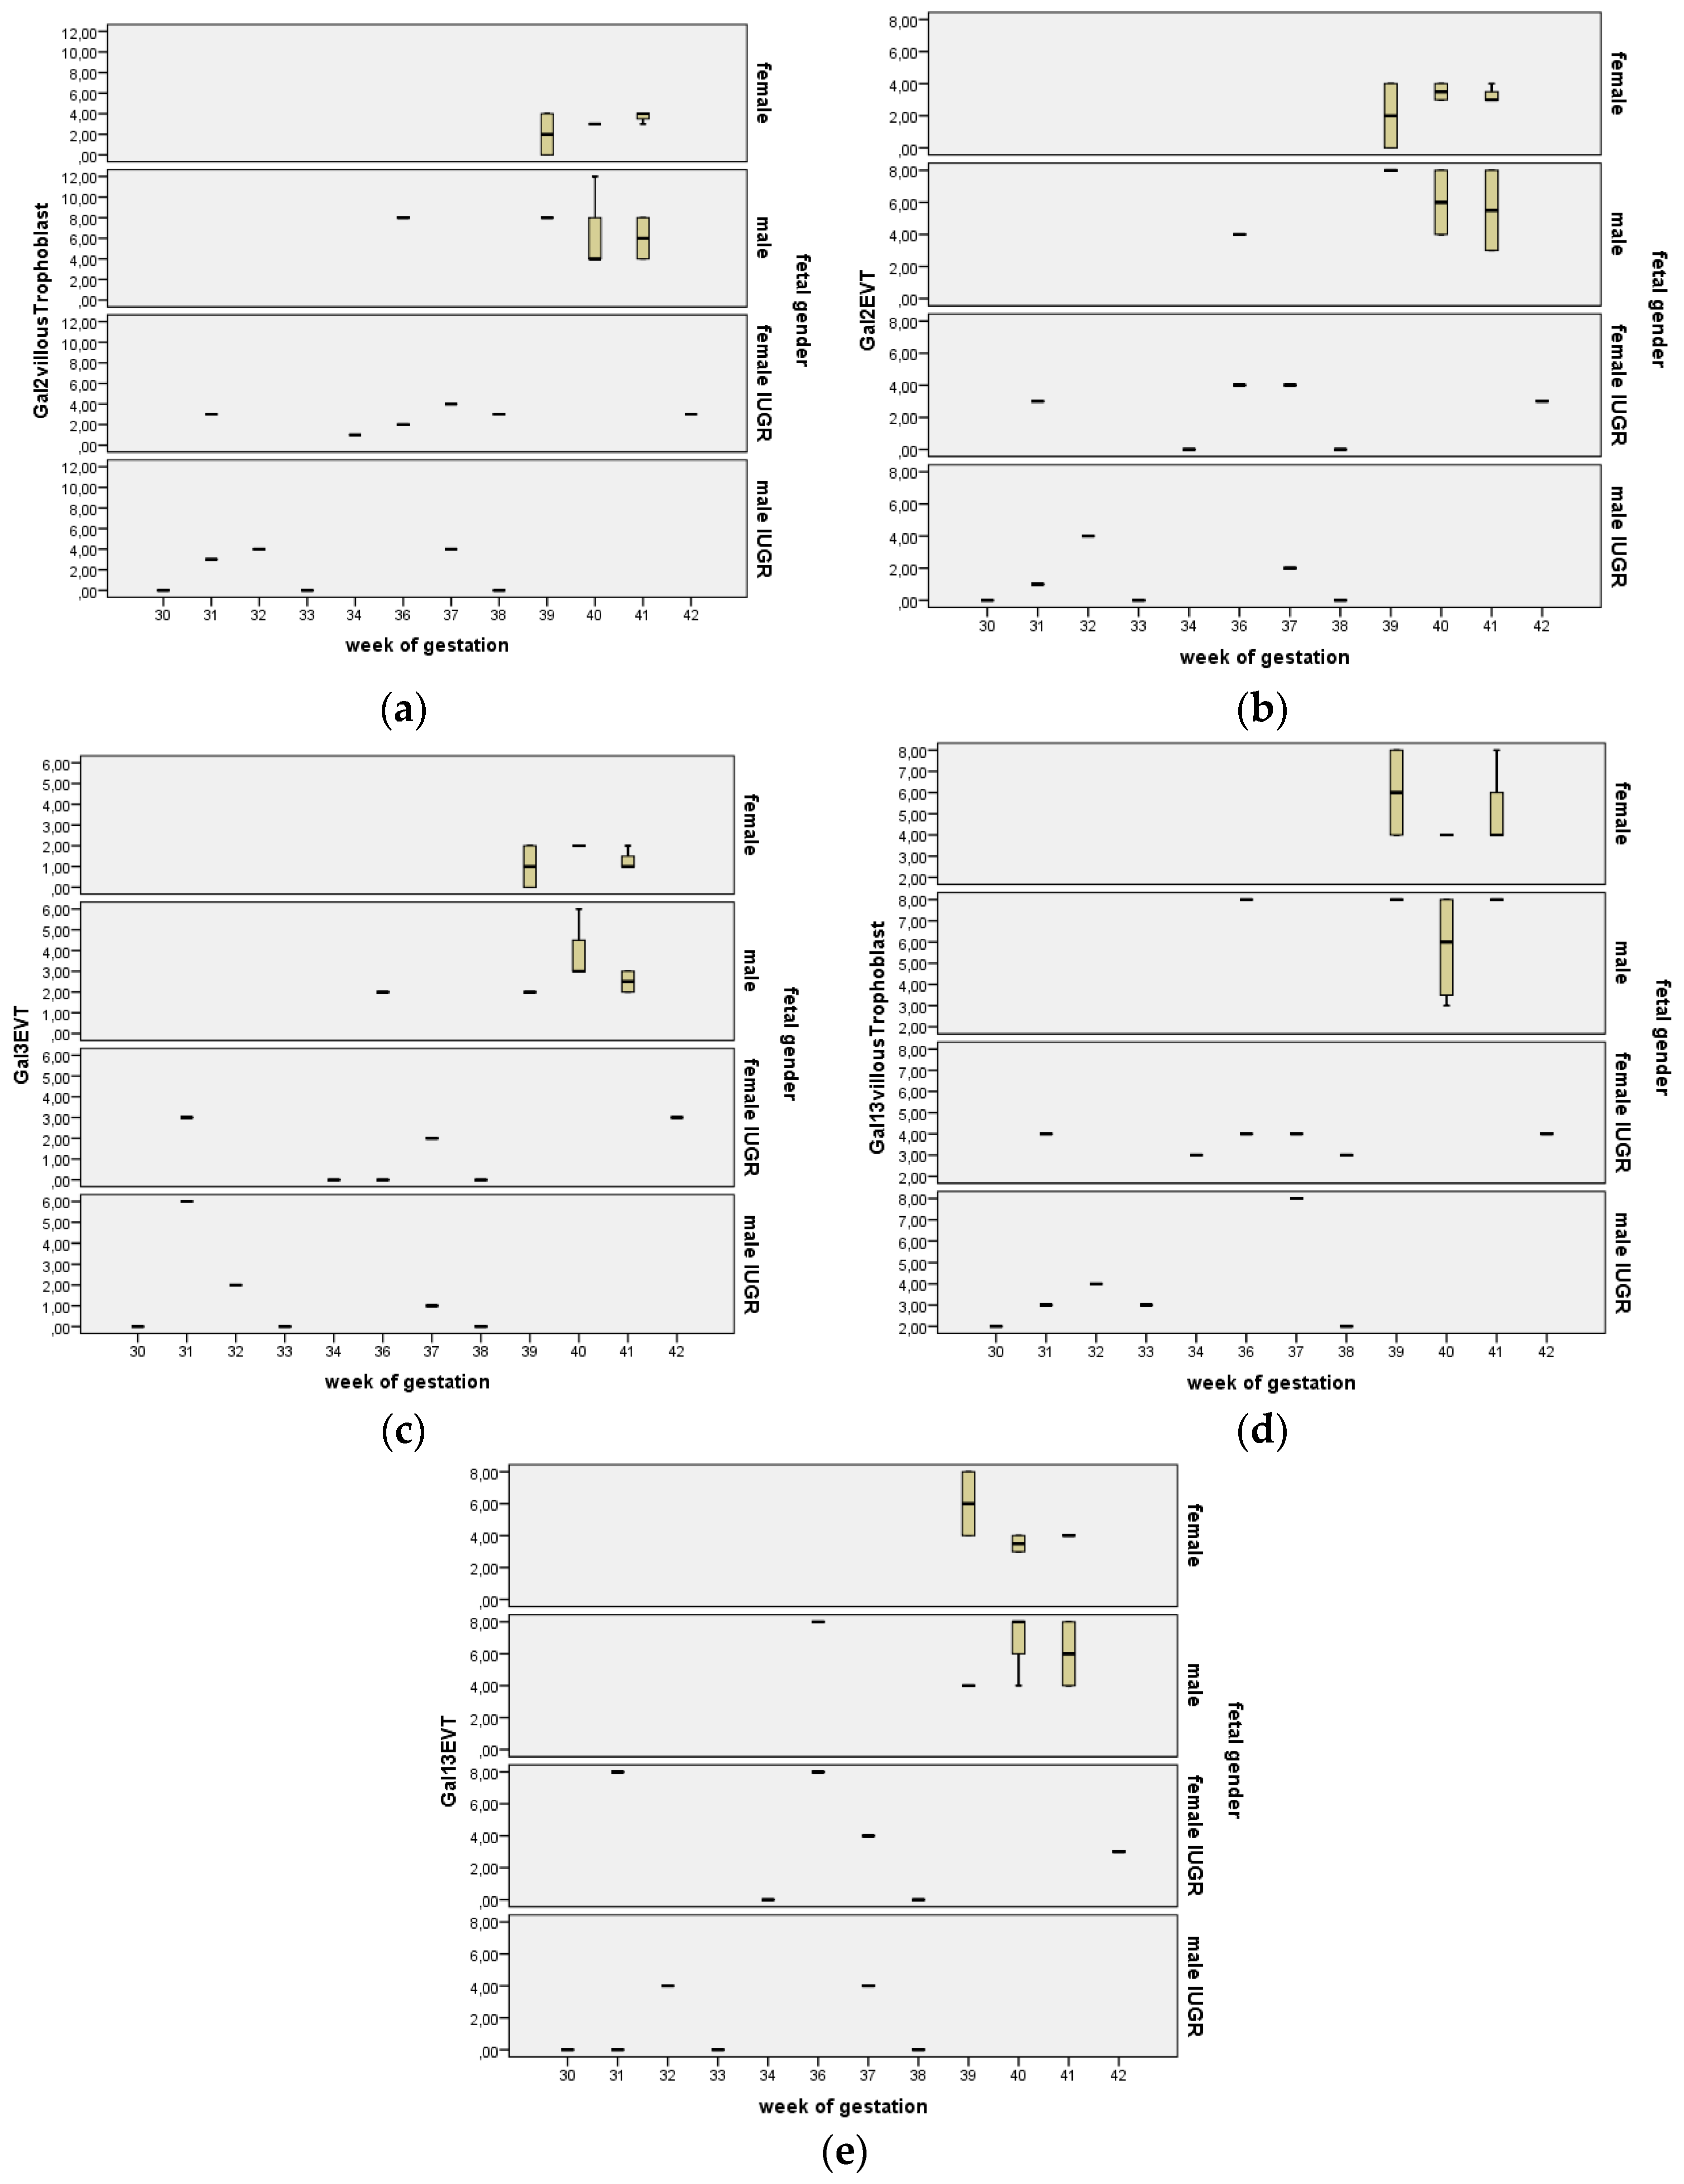
2.2. In Villous and Extravillous Trophoblasts, Gal-2 Shows a Fetal Gender-Specific Expression in Control and IUGR Placentas
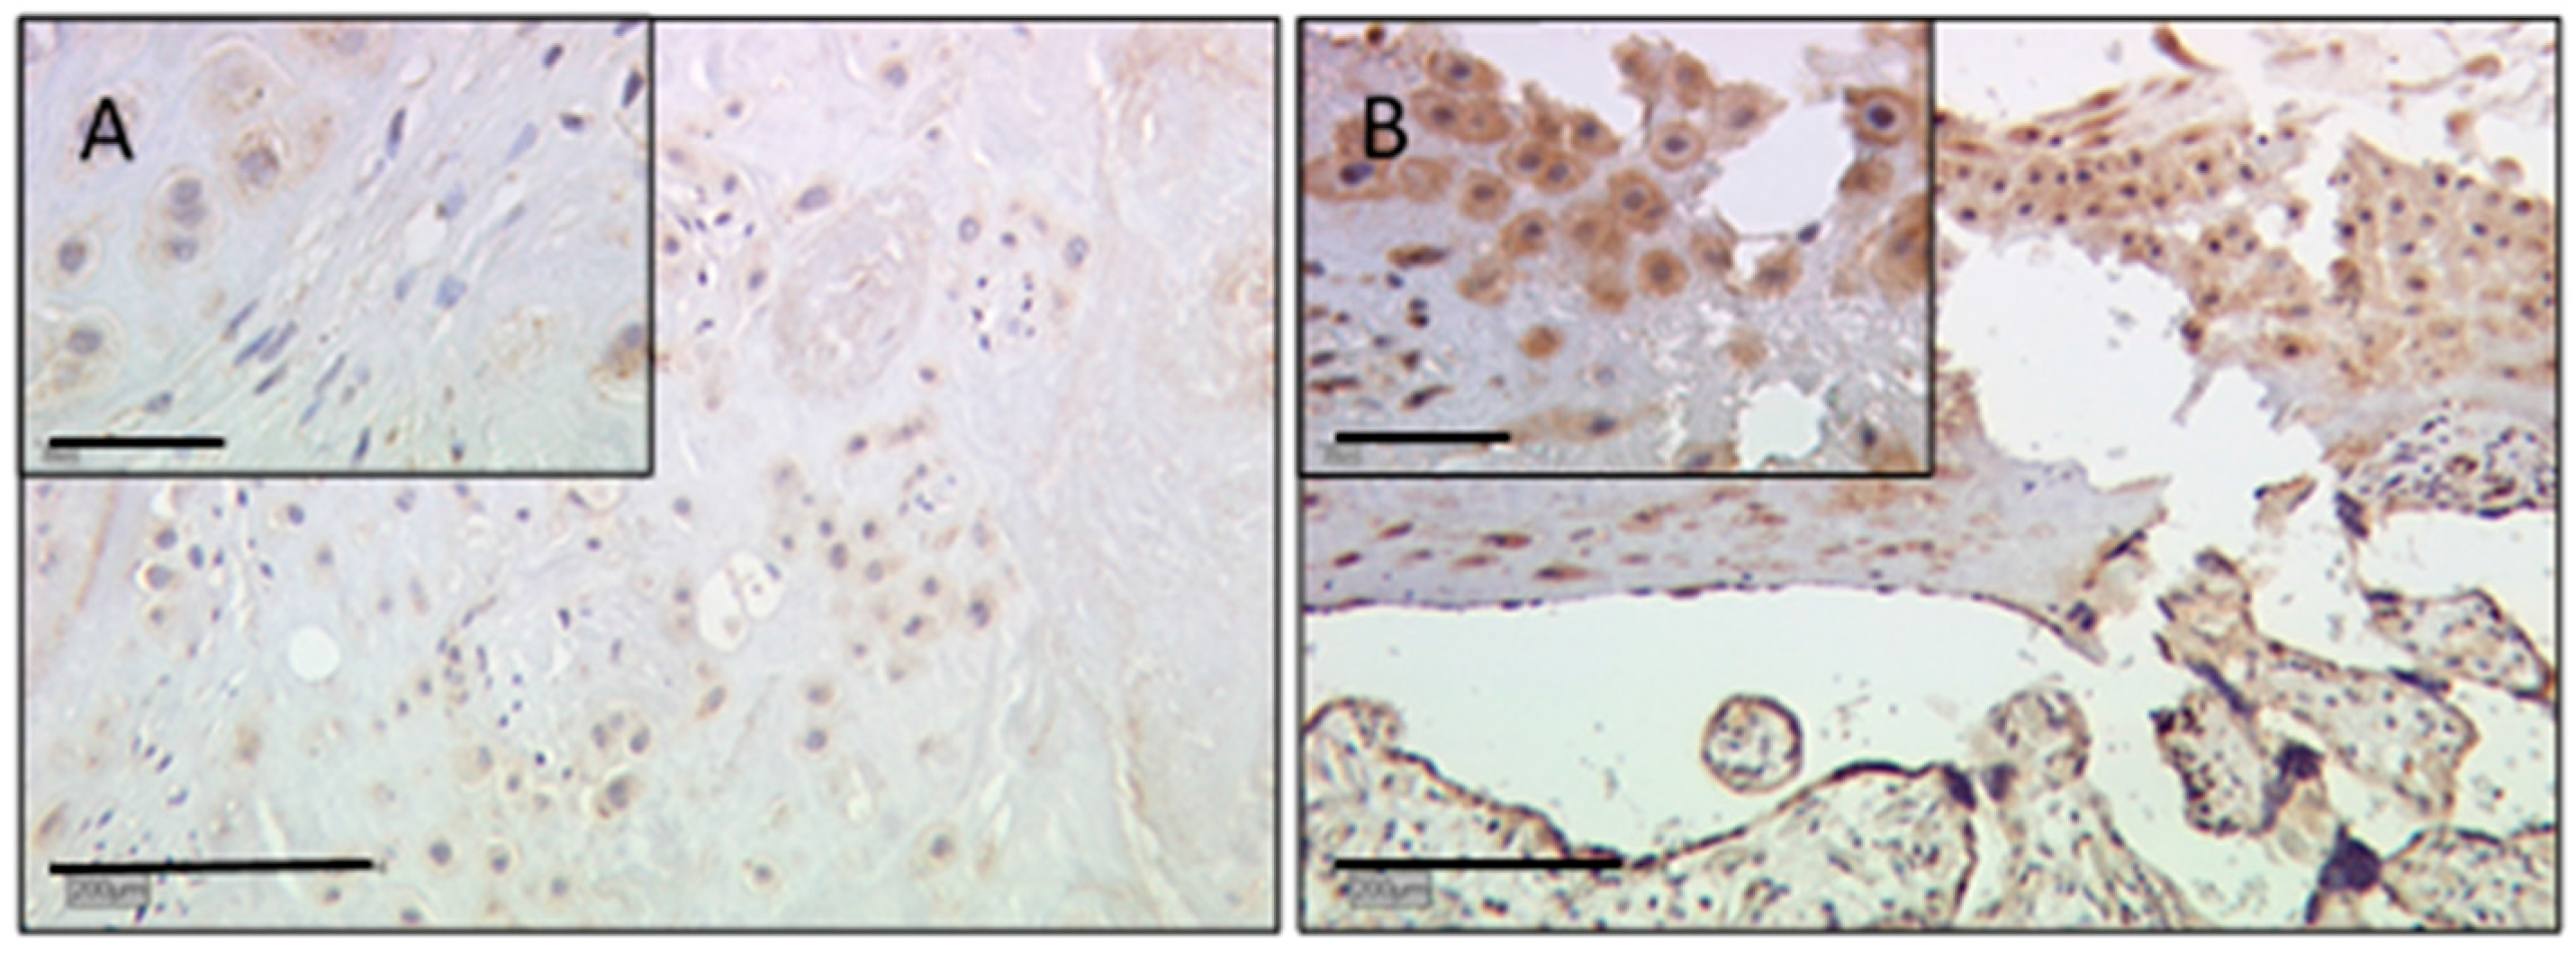
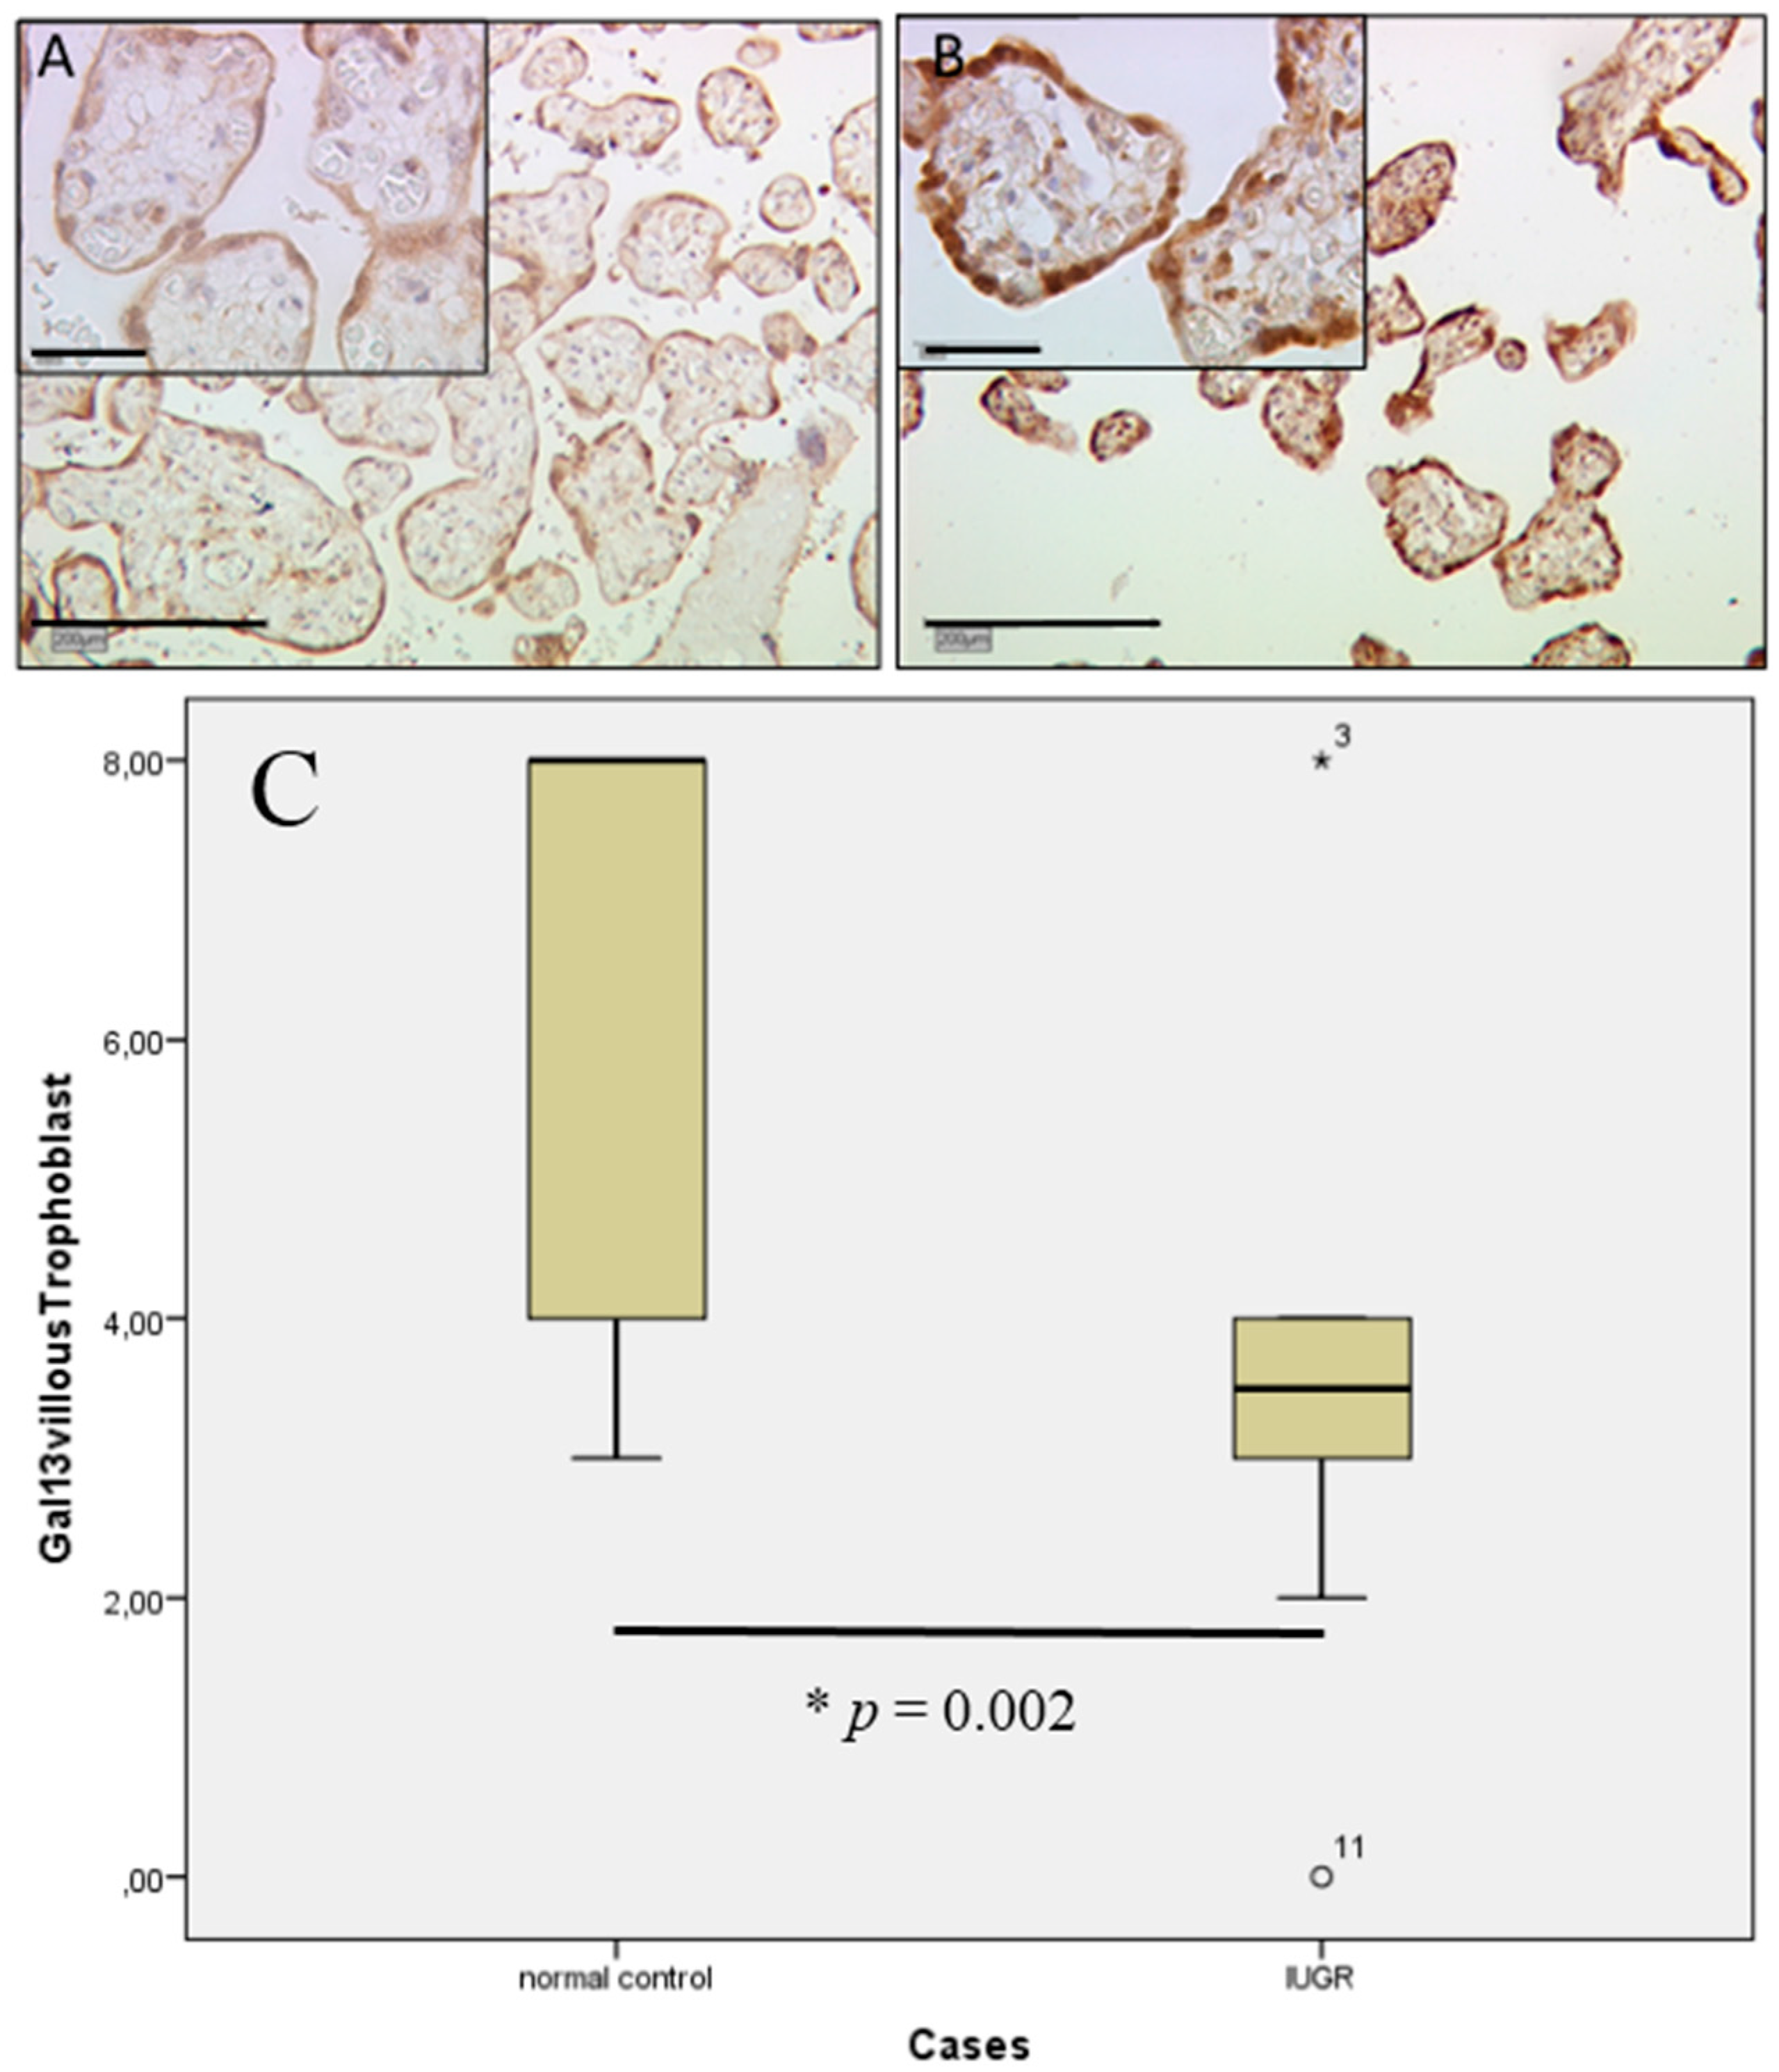
2.3. In Extravillous Trophoblasts, Gal-3 Gender-Specific Differences in Expression Disappear in Cases of IUGR
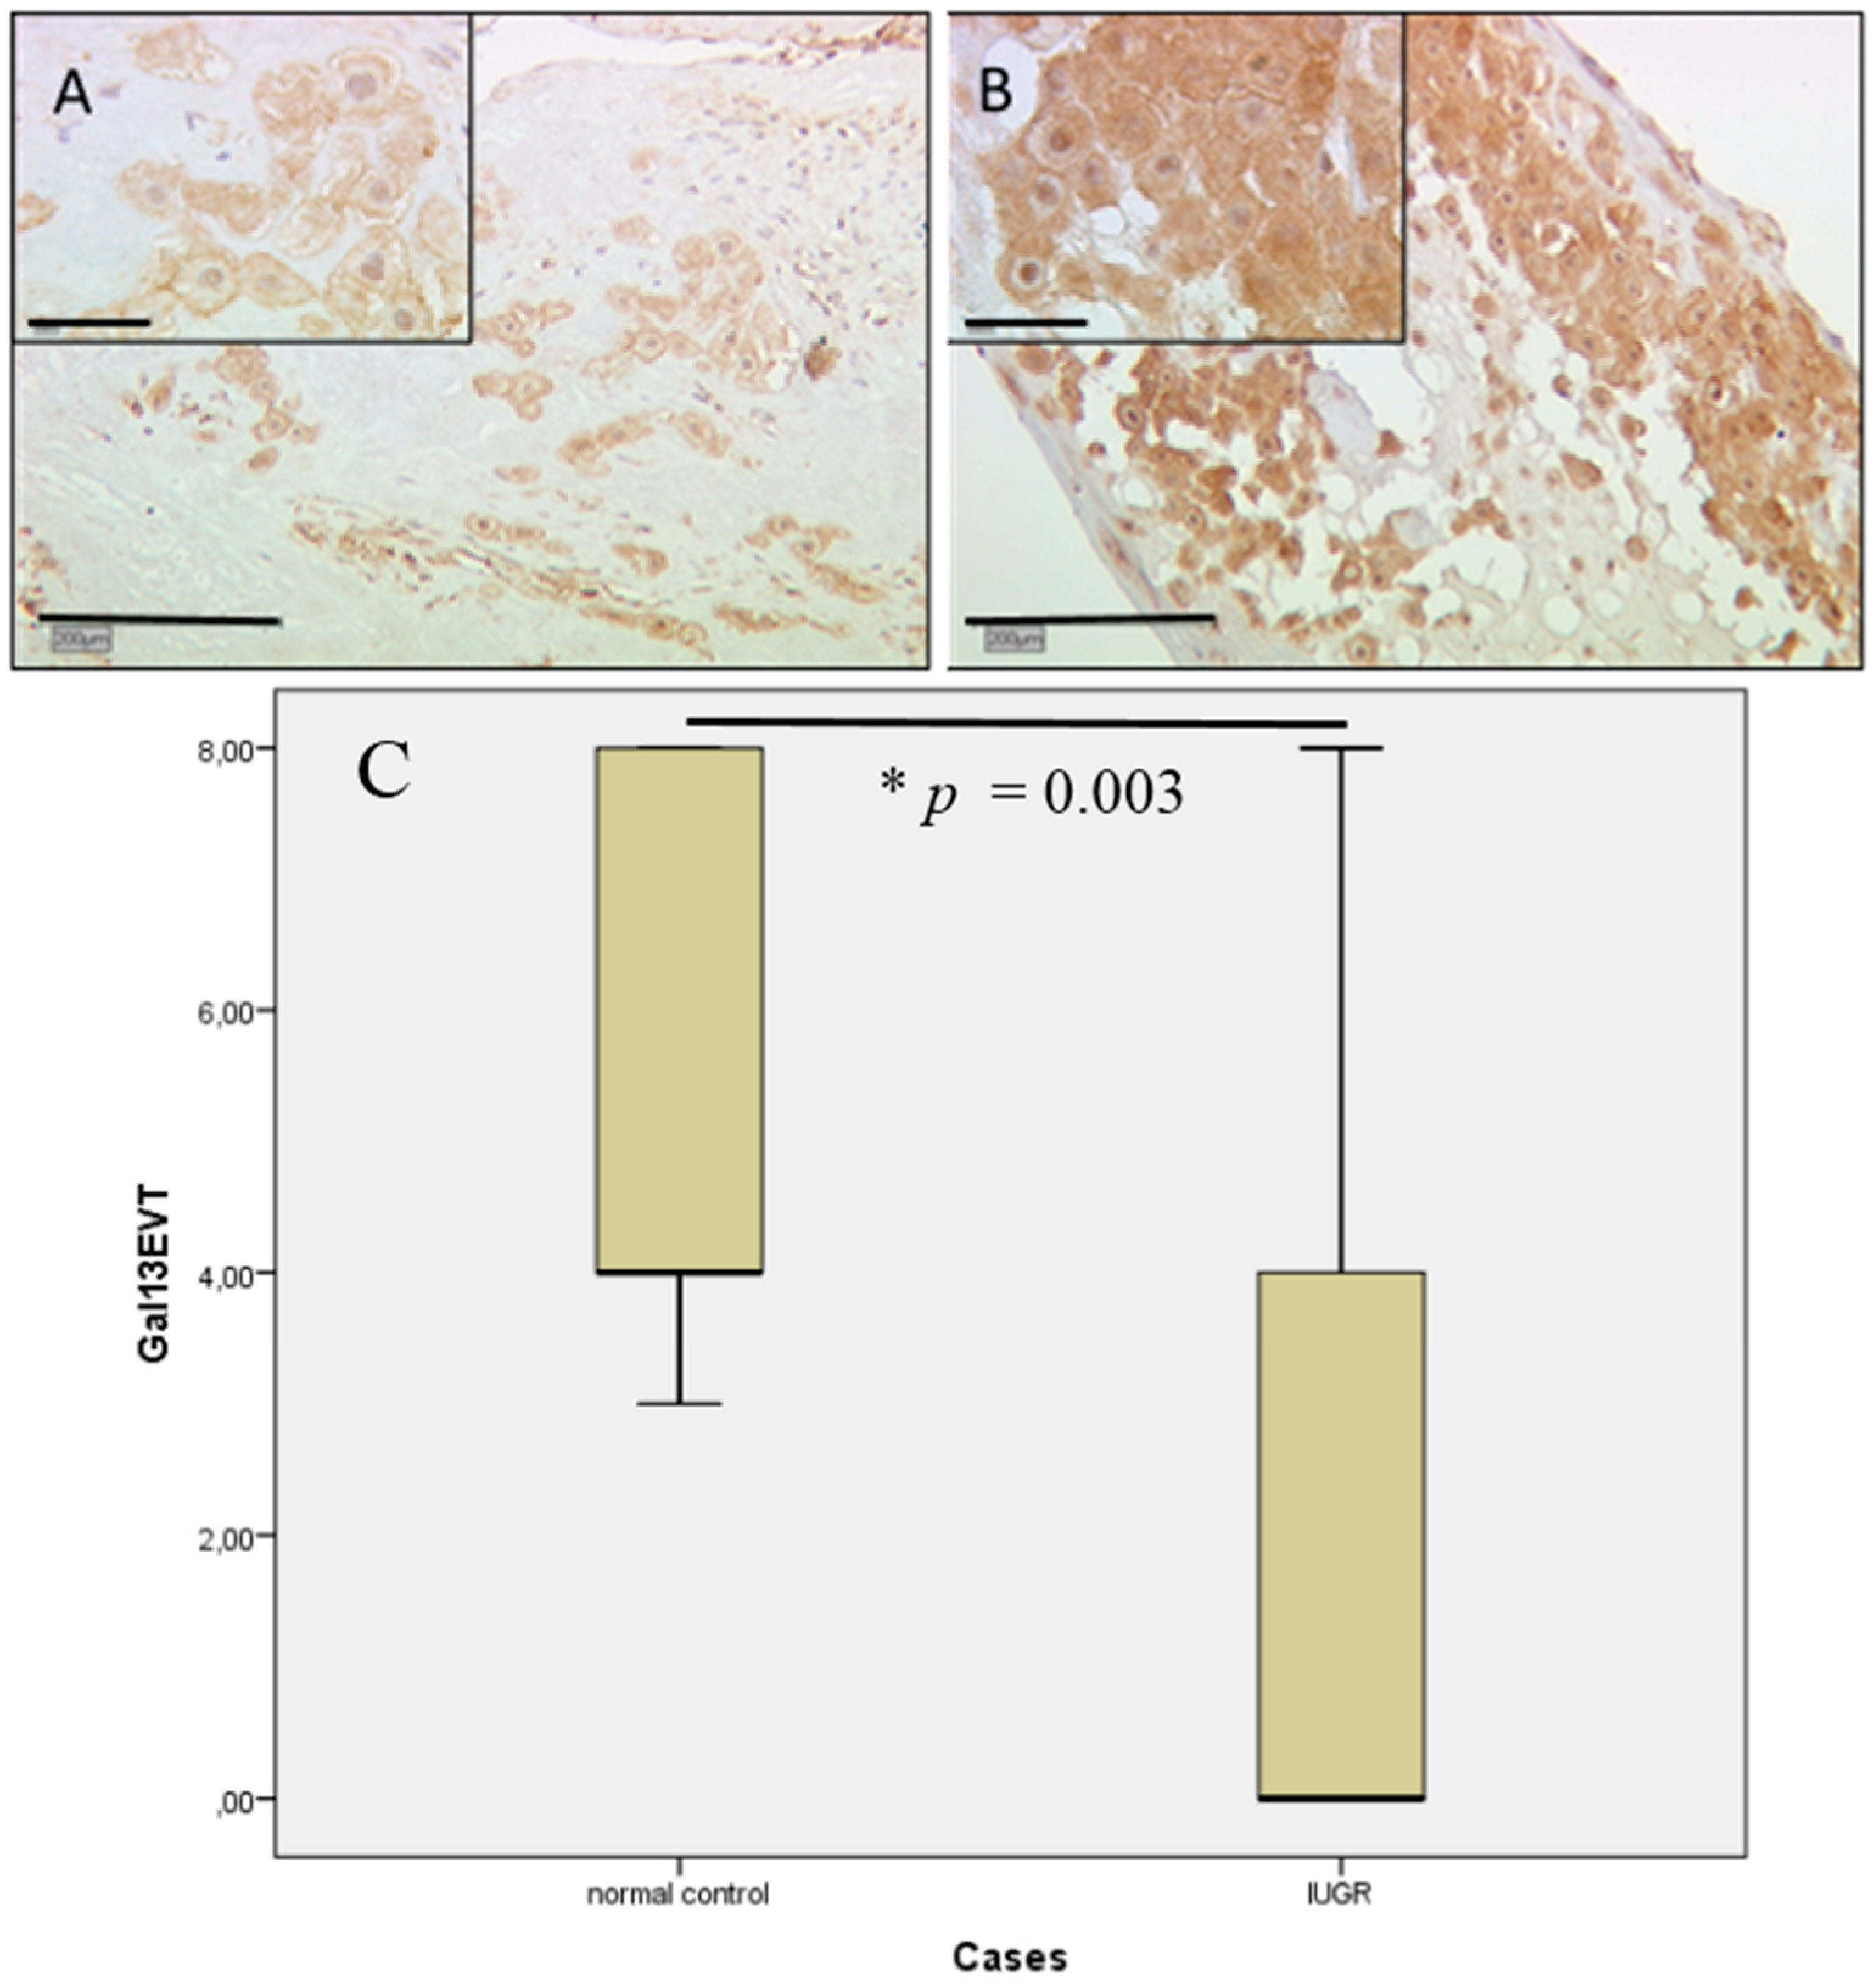
2.4. Gal-13 Expression Is Strongly Decreased in Villous and Extravillous Trophoblasts in IUGR Complicated Pregnancies of Male Fetal Gender
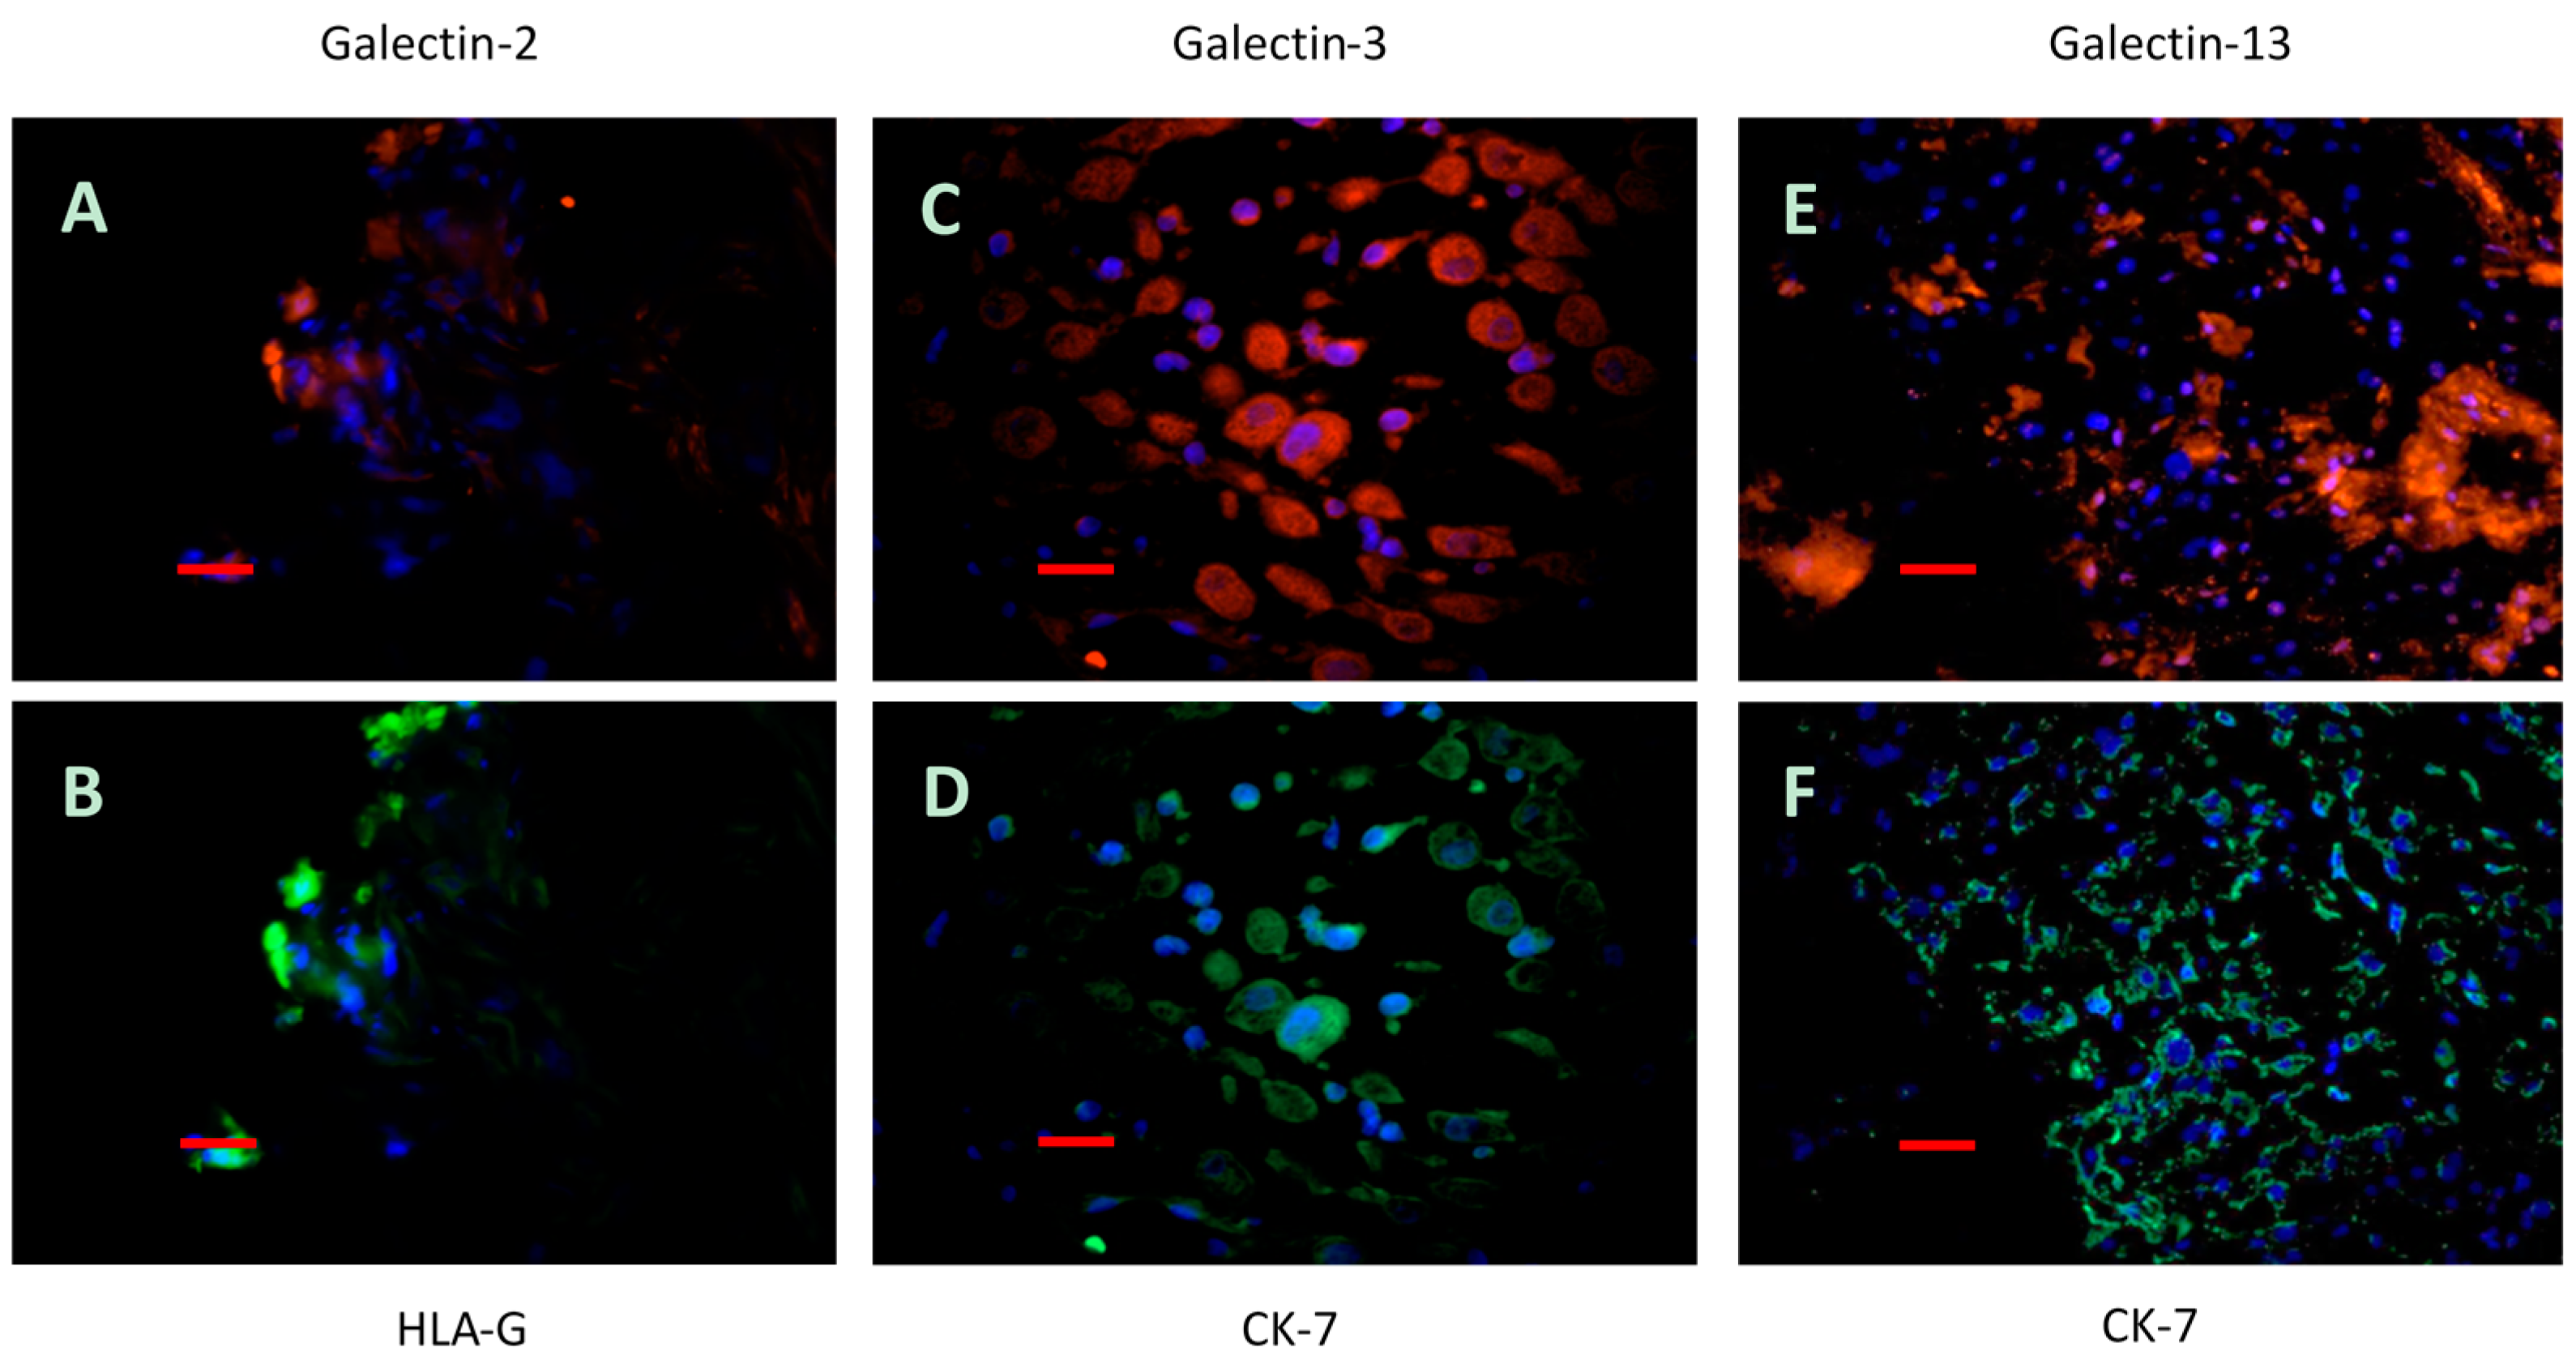
2.5. Immunofluorescence Double Staining
2.6. Correlation Analysis
2.7. Stratification for Gestational Age
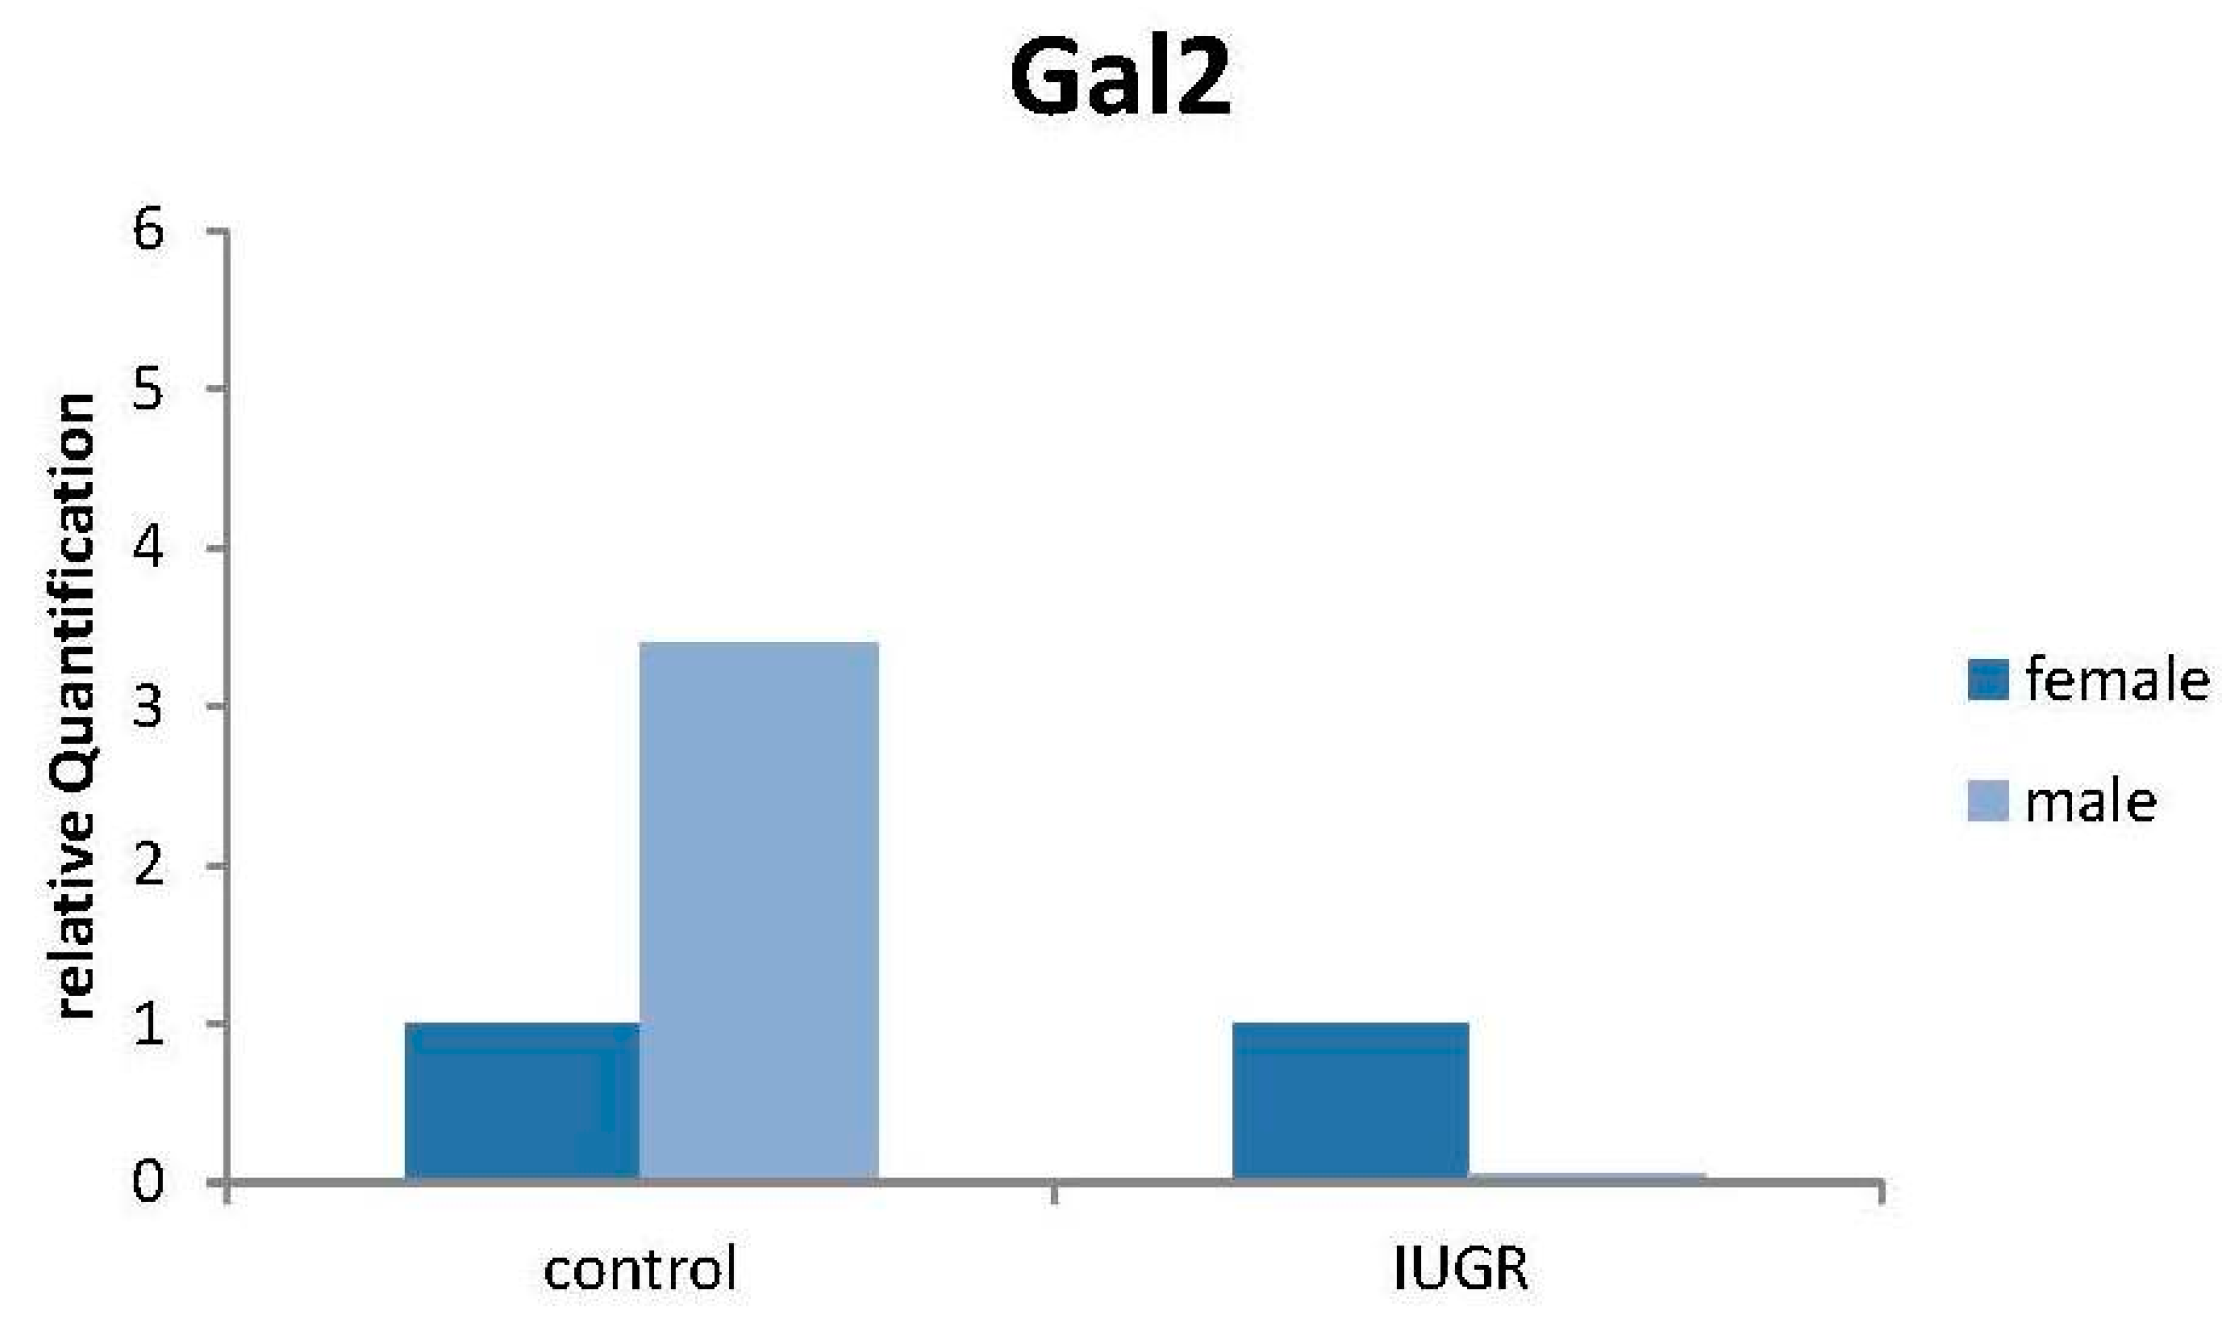
2.8. Production of Gal-2 mRNA Is Downregulated in Male IUGR Placentas
3. Discussion
4. Materials and Methods
4.1. Placental Tissues
4.2. Immunohistochemical Staining for Paraffin Sections
4.3. Evaluation of Staining
4.4. Immunofluorescence Double Staining
4.5. Control Slides for Galectin Staining
4.6. Isolation of RNA for qPCR
4.7. cDNA Synthesizing/Reverse Transcription
4.8. qPCR
4.9. Statistics
5. Conclusions
Acknowledgments
Author Contributions
Conflicts of Interest
Abbreviations
| MDPI | Multidisciplinary Digital Publishing Institute |
| DOAJ | Directory of Open Access Journals |
| TLA | three letter acronym |
| LD | linear dichroism |
References
- Yang, R.Y.; Havel, P.J.; Liu, F.T. Galectin-12: A protein associated with lipid droplets that regulates lipid metabolism and energy balance. Adipocyte 2012, 1, 96–100. [Google Scholar] [CrossRef] [PubMed]
- Paclik, D.; Werner, L.; Guckelberger, O.; Wiedenmann, B.; Sturm, A. Galectins distinctively regulate central monocyte and macrophage function. Cell. Immunol. 2011, 271, 97–103. [Google Scholar] [CrossRef] [PubMed]
- Liu, F.T.; Patterson, R.J.; Wang, J.L. Intracellular functions of galectins. Biochim. Biophys. Acta 2002, 1572, 263–273. [Google Scholar] [CrossRef]
- Jeschke, U.; Hutter, S.; Heublein, S.; Vrekoussis, T.; Andergassen, U.; Unverdorben, L.; Papadakis, G.; Makrigiannakis, A. Expression and function of galectins in the endometrium and at the human feto-maternal interface. Placenta 2013, 34, 863–872. [Google Scholar] [CrossRef] [PubMed]
- Khalil, A.; Cowans, N.J.; Spencer, K.; Goichman, S.; Meiri, H.; Harrington, K. First-trimester markers for the prediction of pre-eclampsia in women with a-priori high risk. Ultrasound Obstet. Gynecol. 2010, 35, 671–679. [Google Scholar] [CrossRef] [PubMed]
- Blois, S.M.; Barrientos, G. Galectin signature in normal pregnancy and preeclampsia. J. Reprod. Immunol. 2014, 101, 127–134. [Google Scholar] [CrossRef] [PubMed]
- Sammar, M.; Nisamblatt, S.; Gonen, R.; Huppertz, B.; Gizurarson, S.; Osol, G.; Meiri, H. The role of the carbohydrate recognition domain of placental protein 13 (PP13) in pregnancy evaluated with recombinant PP13 and the delt221 PP13 variant. PLoS ONE 2014, 9, e102832. [Google Scholar] [CrossRef] [PubMed]
- Freitag, N.; Tirado-Gonzalez, I.; Barrientos, G.; Herse, F.; Thijssen, V.L.; Weedon-Fekjaer, S.M.; Schulz, H.; Wallukat, G.; Klapp, B.F.; Nevers, T.; et al. Interfering with gal-1-mediated angiogenesis contributes to the pathogenesis of preeclampsia. Proc. Natl. Acad Sci. USA 2013, 110, 11451–11456. [Google Scholar] [CrossRef] [PubMed]
- Jeschke, U.; Mayr, D.; Schiessl, B.; Mylonas, I.; Schulze, S.; Kuhn, C.; Friese, K.; Walzel, H. Expression of galectin-1, -3 (gal-1, gal-3) and the thomsen-friedenreich (TF) antigen in normal, iugr, preeclamptic and hellp placentas. Placenta 2007, 28, 1165–1173. [Google Scholar] [CrossRef] [PubMed]
- Blois, S.M.; Ilarregui, J.M.; Tometten, M.; Garcia, M.; Orsal, A.S.; Cordo-Russo, R.; Toscano, M.A.; Bianco, G.A.; Kobelt, P.; Handjiski, B.; et al. A pivotal role for galectin-1 in fetomaternal tolerance. Nat. Med. 2007, 13, 1450–1457. [Google Scholar] [CrossRef] [PubMed]
- Hutter, S.; Martin, N.; von Schonfeldt, V.; Messner, J.; Kuhn, C.; Hofmann, S.; Andergassen, U.; Knabl, J.; Jeschke, U. Galectin 2 (gal-2) expression is downregulated on protein and mrna level in placentas of preeclamptic (PE) patients. Placenta 2015, 36, 438–445. [Google Scholar] [CrossRef] [PubMed]
- Toal, M.; Chan, C.; Fallah, S.; Alkazaleh, F.; Chaddha, V.; Windrim, R.C.; Kingdom, J.C. Usefulness of a placental profile in high-risk pregnancies. Am. J. Obstet. Gynecol. 2007, 196. [Google Scholar] [CrossRef] [PubMed]
- Zamudio, S.; Torricos, T.; Fik, E.; Oyala, M.; Echalar, L.; Pullockaran, J.; Tutino, E.; Martin, B.; Belliappa, S.; Balanza, E.; et al. Hypoglycemia and the origin of hypoxia-induced reduction in human fetal growth. PLoS ONE 2010, 5, e8551. [Google Scholar] [CrossRef] [PubMed]
- Jansson, T.; Scholtbach, V.; Powell, T.L. Placental transport of leucine and lysine is reduced in intrauterine growth restriction. Pediatr. Res. 1998, 44, 532–537. [Google Scholar] [CrossRef] [PubMed]
- Kuzmina, I.Y.; Hubina-Vakulik, G.I.; Burton, G.J. Placental morphometry and doppler flow velocimetry in cases of chronic human fetal hypoxia. Eur. J. Obstet. Gynecol. Reprod. Biol. 2005, 120, 139–145. [Google Scholar] [CrossRef] [PubMed]
- Odibo, A.O.; Zhong, Y.; Longtine, M.; Tuuli, M.; Odibo, L.; Cahill, A.G.; Macones, G.A.; Nelson, D.M. First-trimester serum analytes, biophysical tests and the association with pathological morphometry in the placenta of pregnancies with preeclampsia and fetal growth restriction. Placenta 2011, 32, 333–338. [Google Scholar] [CrossRef] [PubMed]
- Schneuer, F.J.; Nassar, N.; Khambalia, A.Z.; Tasevski, V.; Guilbert, C.; Ashton, A.W.; Morris, J.M.; Roberts, C.L. First trimester screening of maternal placental protein 13 for predicting preeclampsia and small for gestational age: In-house study and systematic review. Placenta 2012, 33, 735–740. [Google Scholar] [CrossRef] [PubMed]
- Herraiz, I.; Droge, L.A.; Gomez-Montes, E.; Henrich, W.; Galindo, A.; Verlohren, S. Characterization of the soluble fms-like tyrosine kinase-1 to placental growth factor ratio in pregnancies complicated by fetal growth restriction. Obstet. Gynecol. 2014, 124, 265–273. [Google Scholar] [CrossRef] [PubMed]
- Zhang, S.; Regnault, T.R.; Barker, P.L.; Botting, K.J.; McMillen, I.C.; McMillan, C.M.; Roberts, C.T.; Morrison, J.L. Placental adaptations in growth restriction. Nutrients 2015, 7, 360–389. [Google Scholar] [CrossRef] [PubMed]
- Ahmad, N.; Gabius, H.J.; Sabesan, S.; Oscarson, S.; Brewer, C.F. Thermodynamic binding studies of bivalent oligosaccharides to galectin-1, galectin-3, and the carbohydrate recognition domain of galectin-3. Glycobiology 2004, 14, 817–825. [Google Scholar] [CrossRef] [PubMed]
- Knabl, J.; Hiden, U.; Huttenbrenner, R.; Riedel, C.; Hutter, S.; Kirn, V.; Gunthner-Biller, M.; Desoye, G.; Kainer, F.; Jeschke, U. GDM alters expression of placental estrogen receptor alpha in a cell type and gender-specific manner. Reprod. Sci. 2015, 22, 1488–1495. [Google Scholar] [CrossRef] [PubMed]
- Hutter, S.; Knabl, J.; Andergassen, U.; Mayr, D.; Hofmann, S.; Kuhn, C.; Mahner, S.; Arck, P.; Jeschke, U. Fetal gender specific expression of tandem-repeat galectins in placental tissue from normally progressed human pregnancies and intrauterine growth restriction (IUGR). Placenta 2015, 36, 1352–1361. [Google Scholar] [CrossRef] [PubMed]
- Di Renzo, G.C.; Rosati, A.; Sarti, R.D.; Cruciani, L.; Cutuli, A.M. Does fetal sex affect pregnancy outcome? Gend. Med. 2007, 4, 19–30. [Google Scholar] [CrossRef]
- Eriksson, J.G.; Kajantie, E.; Osmond, C.; Thornburg, K.; Barker, D.J. Boys live dangerously in the womb. Am. J. Hum. Biol. 2010, 22, 330–335. [Google Scholar] [CrossRef] [PubMed]
- Brett, K.E.; Ferraro, Z.M.; Yockell-Lelievre, J.; Gruslin, A.; Adamo, K.B. Maternal-fetal nutrient transport in pregnancy pathologies: The role of the placenta. Int. J. Mol. Sci. 2014, 15, 16153–16185. [Google Scholar] [CrossRef] [PubMed]
- Chafetz, I.; Kuhnreich, I.; Sammar, M.; Tal, Y.; Gibor, Y.; Meiri, H.; Cuckle, H.; Wolf, M. First-trimester placental protein 13 screening for preeclampsia and intrauterine growth restriction. Am. J. Obstet. Gynecol. 2007, 197. [Google Scholar] [CrossRef] [PubMed]
- Than, N.G.; Pick, E.; Bellyei, S.; Szigeti, A.; Burger, O.; Berente, Z.; Janaky, T.; Boronkai, A.; Kliman, H.; Meiri, H.; et al. Functional analyses of placental protein 13/galectin-13. Eur. J. Biochem. 2004, 271, 1065–1078. [Google Scholar] [CrossRef] [PubMed]
- Than, N.G.; Sumegi, B.; Than, G.N.; Berente, Z.; Bohn, H. Isolation and sequence analysis of a cDNA encoding human placental tissue protein 13 (PP13), a new lysophospholipase, homologue of human eosinophil charcot-leyden crystal protein. Placenta 1999, 20, 703–710. [Google Scholar] [CrossRef] [PubMed]
- Unverdorben, L.; Huttenbrenner, R.; Knabl, J.; Jeschke, U.; Hutter, S. Galectin-13/PP-13 expression in term placentas of gestational diabetes mellitus pregnancies. Placenta 2015, 36, 191–198. [Google Scholar] [CrossRef] [PubMed]
- Cetin, I.; Huppertz, B.; Burton, G.; Cuckle, H.; Gonen, R.; Lapaire, O.; Mandia, L.; Nicolaides, K.; Redman, C.; Soothill, P.; et al. Pregenesys pre-eclampsia markers consensus meeting: What do we require from markers, risk assessment and model systems to tailor preventive strategies? Placenta 2011, 32, S4–S16. [Google Scholar] [CrossRef] [PubMed]
- Wortelboer, E.J.; Koster, M.P.; Kuc, S.; Eijkemans, M.J.; Bilardo, C.M.; Schielen, P.C.; Visser, G.H. Longitudinal trends in fetoplacental biochemical markers, uterine artery pulsatility index and maternal blood pressure during the first trimester of pregnancy. Ultrasound Obstet. Gynecol. 2011, 38, 383–388. [Google Scholar] [CrossRef] [PubMed]
- Naljayan, M.V.; Karumanchi, S.A. New developments in the pathogenesis of preeclampsia. Adv. Chronic Kidney Dis. 2013, 20, 265–270. [Google Scholar] [CrossRef] [PubMed]
- van der Laan, A.M.; Schirmer, S.H.; de Vries, M.R.; Koning, J.J.; Volger, O.L.; Fledderus, J.O.; Bastiaansen, A.J.; Hollander, M.R.; Baggen, J.M.; Koch, K.T.; et al. Galectin-2 expression is dependent on the rs7291467 polymorphism and acts as an inhibitor of arteriogenesis. Eur. Heart J. 2012, 33, 1076–1084. [Google Scholar] [CrossRef] [PubMed]
- Demmert, M.; Faust, K.; Bohlmann, M.K.; Troger, B.; Gopel, W.; Herting, E.; Hartel, C. Galectin-3 in cord blood of term and preterm infants. Clin. Exp. Immunol. 2012, 167, 246–251. [Google Scholar] [CrossRef] [PubMed]
- Norling, L.V.; Perretti, M.; Cooper, D. Endogenous galectins and the control of the host inflammatory response. J. Endocrinol. 2009, 201, 169–184. [Google Scholar] [CrossRef] [PubMed]
- Li, Y.; Komai-Koma, M.; Gilchrist, D.S.; Hsu, D.K.; Liu, F.T.; Springall, T.; Xu, D. Galectin-3 is a negative regulator of lipopolysaccharide-mediated inflammation. J. Immunol. 2008, 181, 2781–2789. [Google Scholar] [CrossRef] [PubMed]
- Moon, B.K.; Lee, Y.J.; Battle, P.; Jessup, J.M.; Raz, A.; Kim, H.R. Galectin-3 protects human breast carcinoma cells against nitric oxide-induced apoptosis: Implication of galectin-3 function during metastasis. Am. J. Pathol. 2001, 159, 1055–1060. [Google Scholar] [CrossRef]
- Zeng, Y.; Danielson, K.G.; Albert, T.J.; Shapiro, I.M.; Risbud, M.V. HIF-1 α is a regulator of galectin-3 expression in the intervertebral disc. J. Bone Miner. Res. 2007, 22, 1851–1861. [Google Scholar] [CrossRef] [PubMed]
- Greijer, A.E.; van der Groep, P.; Kemming, D.; Shvarts, A.; Semenza, G.L.; Meijer, G.A.; van de Wiel, M.A.; Belien, J.A.; van Diest, P.J.; van der Wall, E. Up-regulation of gene expression by hypoxia is mediated predominantly by hypoxia-inducible factor 1 (HIF-1). J. Pathol. 2005, 206, 291–304. [Google Scholar] [CrossRef] [PubMed]
- Than, N.G.; Romero, R.; Goodman, M.; Weckle, A.; Xing, J.; Dong, Z.; Xu, Y.; Tarquini, F.; Szilagyi, A.; Gal, P.; et al. A primate subfamily of galectins expressed at the maternal-fetal interface that promote immune cell death. Proc. Natl. Acad. Sci. USA 2009, 106, 9731–9736. [Google Scholar] [CrossRef] [PubMed]
- Kaltner, H.; Seyrek, K.; Heck, A.; Sinowatz, F.; Gabius, H.J. Galectin-1 and galectin-3 in fetal development of bovine respiratory and digestive tracts. Comparison of cell type-specific expression profiles and subcellular localization. Cell Tissue Res. 2002, 307, 35–46. [Google Scholar] [CrossRef] [PubMed]
- Dvorankova, B.; Lacina, L.; Smetana, K., Jr.; Lensch, M.; Manning, J.C.; Andre, S.; Gabius, H.J. Human galectin-2: Nuclear presence in vitro and its modulation by quiescence/stress factors. Histol. Histopathol. 2008, 23, 167–178. [Google Scholar] [PubMed]
- Ohannesian, D.W.; Lotan, D.; Thomas, P.; Jessup, J.M.; Fukuda, M.; Gabius, H.J.; Lotan, R. Carcinoembryonic antigen and other glycoconjugates act as ligands for galectin-3 in human colon carcinoma cells. Cancer Res. 1995, 55, 2191–2199. [Google Scholar] [PubMed]


| Parameter | IUGR | Control | ||
|---|---|---|---|---|
| Male | Female | Male | Female | |
| Duration of gestation at delivery (weeks) | 33 (SD 3.27) | 37 (SD 4.30) | 40 (SD 1.6) | 40 (SD 0.9) |
| neonatal birth weight (g) | 1400 (SD 496.65) | 1950 (SD 625.7) | 3157.5 (SD 480.3) | 3440 (SD 249.19) |
| pH umbilical artery | 7.32 (SD 0.04) | 7.36 (SD 0.08) | 7.3 (SD 0.09) | 7.39 (SD 0.08) |
| Apgar score at 5 min | 9 (SD 1.52) | 9.5 (SD 2.34) | 10 (SD 0) | 10 (SD 0) |
| Apgar score at 10 min | 10 (SD 1.73) | 10 (SD 1.6) | 10 (SD 0) | 10 (SD 0) |
| maternal age (years) | 32 (SD 5.43) | 31 (SD 3.45) | 30,5 (SD 6.4) | 33 (SD 5.20) |
| ethnicity of parents | Caucasian (100%) | Caucasian (100%) | Caucasian (100%) | Caucasian (100%) |
| Antigen | Antibody | Isotype | Dilution | Source |
|---|---|---|---|---|
| Gal-1 | 201002 | Rat IgG2b | 1:50 | R&D |
| Gal-2 | NBP1-89690 | Rabbit IgG | 1:100 | Novus Biologicals |
| Gal-3 | 9C4 | Mouse IgG1 | 1:500 | Novocastra |
| Gal-13 | NBP1-91922 | Rabbit IgG | 1:50 | Novus Biologicals |
| HLA-G | MEM-6/9 | Mouse IgG1 | 1:50 | Dako |
| CK7 | NCL-L-CK7-OVTL | Mouse IgG1 | 1:30 | Novocastra |
| CK7 | Sc-25721 | Rabbit IgG | 1:100 | Santa Cruz |
| Target | Applied Biosystems Number |
|---|---|
| LGALS2 | Hs00197810_m1 |
| LGALS3 | Hs00173587_m1 |
| LGALS13 | Hs00747811_m1 |
| ACTB | Hs99999903_m1 |
© 2016 by the authors; licensee MDPI, Basel, Switzerland. This article is an open access article distributed under the terms and conditions of the Creative Commons by Attribution (CC-BY) license (http://creativecommons.org/licenses/by/4.0/).
Share and Cite
Hutter, S.; Knabl, J.; Andergassen, U.; Hofmann, S.; Kuhn, C.; Mahner, S.; Arck, P.; Jeschke, U. Placental Expression Patterns of Galectin-1, Galectin-2, Galectin-3 and Galectin-13 in Cases of Intrauterine Growth Restriction (IUGR). Int. J. Mol. Sci. 2016, 17, 523. https://0-doi-org.brum.beds.ac.uk/10.3390/ijms17040523
Hutter S, Knabl J, Andergassen U, Hofmann S, Kuhn C, Mahner S, Arck P, Jeschke U. Placental Expression Patterns of Galectin-1, Galectin-2, Galectin-3 and Galectin-13 in Cases of Intrauterine Growth Restriction (IUGR). International Journal of Molecular Sciences. 2016; 17(4):523. https://0-doi-org.brum.beds.ac.uk/10.3390/ijms17040523
Chicago/Turabian StyleHutter, Stefan, Julia Knabl, Ulrich Andergassen, Simone Hofmann, Christina Kuhn, Sven Mahner, Petra Arck, and Udo Jeschke. 2016. "Placental Expression Patterns of Galectin-1, Galectin-2, Galectin-3 and Galectin-13 in Cases of Intrauterine Growth Restriction (IUGR)" International Journal of Molecular Sciences 17, no. 4: 523. https://0-doi-org.brum.beds.ac.uk/10.3390/ijms17040523