Article

Profilings of MicroRNAs in the Liver of Common Carp (Cyprinus carpio) Infected with Flavobacterium columnare

1
Shandong Freshwater Fisheries Research Institute, Jinan 250013, China
2
Shandong Provincial Key Laboratory of Freshwater Genetics and Breeding, Jinan 250013, China
3
Shandong Provincial Freshwater Aquatic Products Quality Inspection Center, Jinan 250013, China
4
Key Lab of Freshwater Animal Breeding, Ministry of Agriculture, Huazhong Agricultural University, Wuhan 430070, China
5
Department of Aquatic Animal Medicine, College of Fisheries, Huazhong Agricultural University, Wuhan 430070, China
*
Authors to whom correspondence should be addressed.
Int. J. Mol. Sci. 2016, 17(4), 566; https://0-doi-org.brum.beds.ac.uk/10.3390/ijms17040566
Submission received: 14 January 2016 / Revised: 20 March 2016 / Accepted: 8 April 2016 / Published: 15 April 2016
(This article belongs to the Special Issue Fish Molecular Biology)

Abstract

:
MicroRNAs (miRNAs) play important roles in regulation of many biological processes in eukaryotes, including pathogen infection and host interactions. Flavobacterium columnare (FC) infection can cause great economic loss of common carp (Cyprinus carpio) which is one of the most important cultured fish in the world. However, miRNAs in response to FC infection in common carp has not been characterized. To identify specific miRNAs involved in common carp infected with FC, we performed microRNA sequencing using livers of common carp infected with and without FC. A total of 698 miRNAs were identified, including 142 which were identified and deposited in the miRbase database (Available online: http://www.mirbase.org/) and 556 had only predicted miRNAs. Among the deposited miRNAs, eight miRNAs were first identified in common carp. Thirty of the 698 miRNAs were differentially expressed miRNAs (DIE-miRNAs) between the FC infected and control samples. From the DIE-miRNAs, seven were selected randomly and their expression profiles were confirmed to be consistent with the microRNA sequencing results using RT-PCR and qRT-PCR. In addition, a total of 27,363 target genes of the 30 DIE-miRNAs were predicted. The target genes were enriched in five Kyoto Encyclopedia of Genes and Genomes (KEGG) pathways, including focal adhesion, extracellular matrix (ECM)-receptor interaction, erythroblastic leukemia viral oncogene homolog (ErbB) signaling pathway, regulation of actin cytoskeleton, and adherent junction. The miRNA expression profile of the liver of common carp infected with FC will pave the way for the development of effective strategies to fight against FC infection.

Graphical Abstract

1. Introduction

Flavobacterium columnare (FC) is a member of the family Flavobacteriaceae and was identified as the causative agent of columnaris. It can cause world-wide fish diseases with high mortality and heavy economical losses in aquaculture industry, including channel catfish (Ictalurus punctatus), grass carp (Ctenopharygodon idella), Mandarin fish (Siniperca chuatsi), and common carp (Cyprinus carpio), etc. [1,2]. Common carp is the number one fish of aquaculture in the world with the annual products amounting to approximately three million tonnes [3]. In recent years, an increased incidence of common carp columnaris was reported [4]. Identification of host proteins and miRNAs which are involved in response to FC infection has a great significance for the prevention of columnaris in common carp. MiRNAs are small RNAs with approximately 22 nucleotides in length. MiRNA are excised from RNA precursors (pre-miRNAs) by t enzyme Dicer [5]. The pre-miRNAs are processed from the primary RNA (pri-miRNAs) in the nucleus by enzyme Drosha [6]. One of the duplex strands of the mature miRNAs can be incorporated into the RNA-induced silencing complexes (RISCs), thereafter, they bind to the 3 untranslated region (3UTR) of the target mRNAs, so as to degrade the target mRNAs or inhibit their translation [7]. It has been well established that miRNAs are involved in regulation of many biological processes in eukaryotes, including pathogen infection and host interactions [8]. Concerning the miRNAs of common carp, there have been three reports [9,10,11]. In these previous reports, the authors identified miRNAs from the muscle, spleen, and mixed tissues of common carp without any pathogen infection, but no study on miRNAs from the liver (a major target of FC infection) of common carp has been reported. Furthermore, the complete genome of common carp was not published when they analyzed the miRNAs of common carp in the three previous reports. Systematic analysis on the miRNA of common carp involved in FC infection is not available. Ultrahigh-throughput sequencing is a powerful tool to explore genome-wide transcriptomic analysis at high resolution. The miRNAs profiles of many fish have been characterized by this technique [12]. In the present report, we present the miRNA profiling of the liver from common carp infected with or without FC. Additionally, a great number of miRNAs target genes were annotated and enriched pathways were analyzed. The target genes were enriched in focal adhesion, ECM-receptor interaction, ErbB signaling pathway, regulation of actin cytoskeleton, and adherent junction KEGG pathways which are closely related to the bacterial infections [13]. These results shed a new light on the development of effective strategies to fight against FC infection.

2. Results

2.1. Construction of cDNA Library for Sequencing and Small RNA Discovery

To investigate the miRNA expression profiles of the liver of common carp, the cDNA library of small RNAs was constructed with pooled total RNAs from liver tissues collected from 10 common carps infected with FC or control. Through IlluminaHiseq2500, 19,619,555 and 18,776,497 raw reads were obtained from control and FC-infected samples, respectively; After removal of low quality reads (the 5 and 3 adapters, reads containing ploy-N, reads with sequences smaller than 18 nt or longer than 30 nt), 16,907,877 (94.94%) and 13,599,310 (94.58%) high-quality (Q30) clean reads were extracted from control and infected samples, respectively (Table 1). Using Bowtie software searches against Silva database, GtRNAdb database, Rfam database, and Repbase database, 3,210,400 (18.99%) and 3,758,445 (27.64%) of the clean reads from control and infected samples, respectively, were annotated as either repeat base, rRNA, snRNA, snoRNA, scRNA or tRNA. Given the genome of common carp is available, the clean reads small RNAs 16,907,877 (control) and 13,599,310 (infected) were mapped to the common carp genome using miRDeep2 software. In the case of the control sample, 9,181,153 (54.3%) of miRNA clean reads were mapped to the common carp genome. While in the infected samples, 6,479,172 (47.6%) of miRNA clean reads were mapped to the common carp genome (Table 1). The length distribution of the miRNA mapped rate was analyzed and a similar trend of the distribution was observed in the two samples. Higher miRNA mapped rates were observed in small RNAs with 21–23 nt in length (Figure 1).

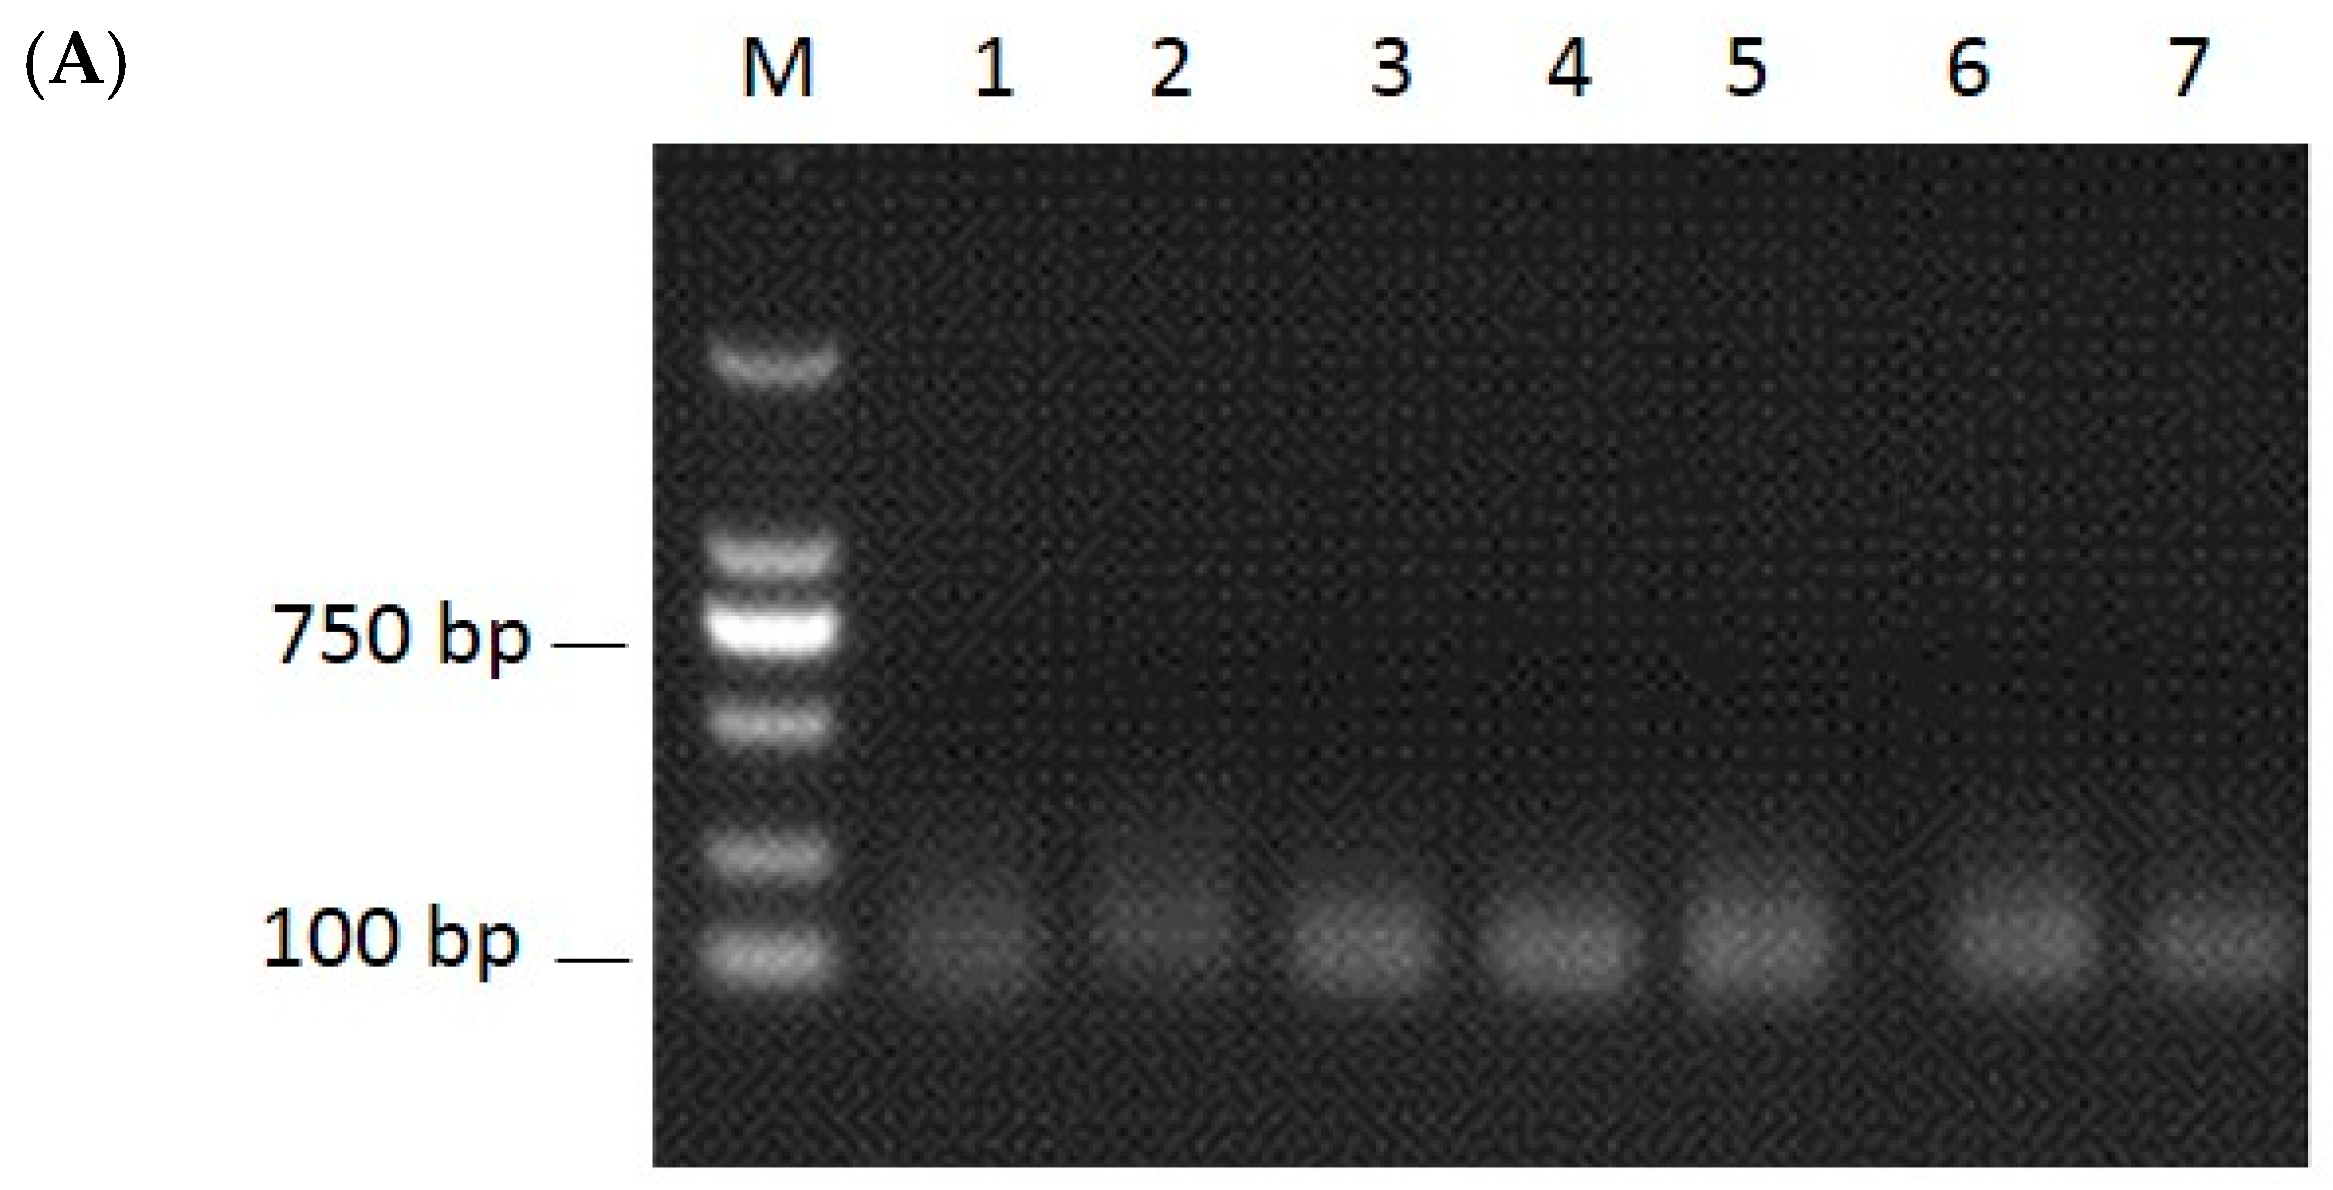
2.2. Identification of miRNAs and Validation by RT-PCR and qRT-PCR

To identify miRNAs in the liver of the common carp infected with or without FC, the clean reads were used and the miRNAs identified by comparing with the deposited miRNAs from miRBase using Bowtie tools software. Randfold tools soft was used for novel miRNA secondary structure prediction. There were totally 698 miRNAs, including 142 deposited miRNAs and 556 predicted novel miRNAs (Table S1). Among the deposited miRNAs, 13 miRNAs (Ccr-miR-22a, ccr-miR-122, ccr-miR-146a, ccr-miR-192, ccr-miR-148, ccr-miR-100, ccr-miR-21, ccr-miR-126-3p, ccr-miR-143, ccr-miR-26a, ccr-let-7a, ccr-miR-101a, and ccr-miR-199-5p) were the most abundant miRNAs (TPM > 10,000) in both samples (TPM = Readout × 1,000,000/Mapped reads, Table S2). In order to validate the novel miRNAs, RT-PCR was used to test randomly selected seven miRNAs from the control, and the size of RT-PCR products were observed around 100 bp (Figure 2A), indicating the existence of these miRNAs in the liver of common carp.

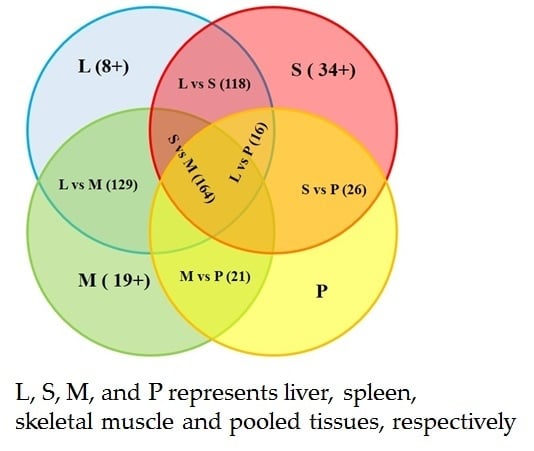
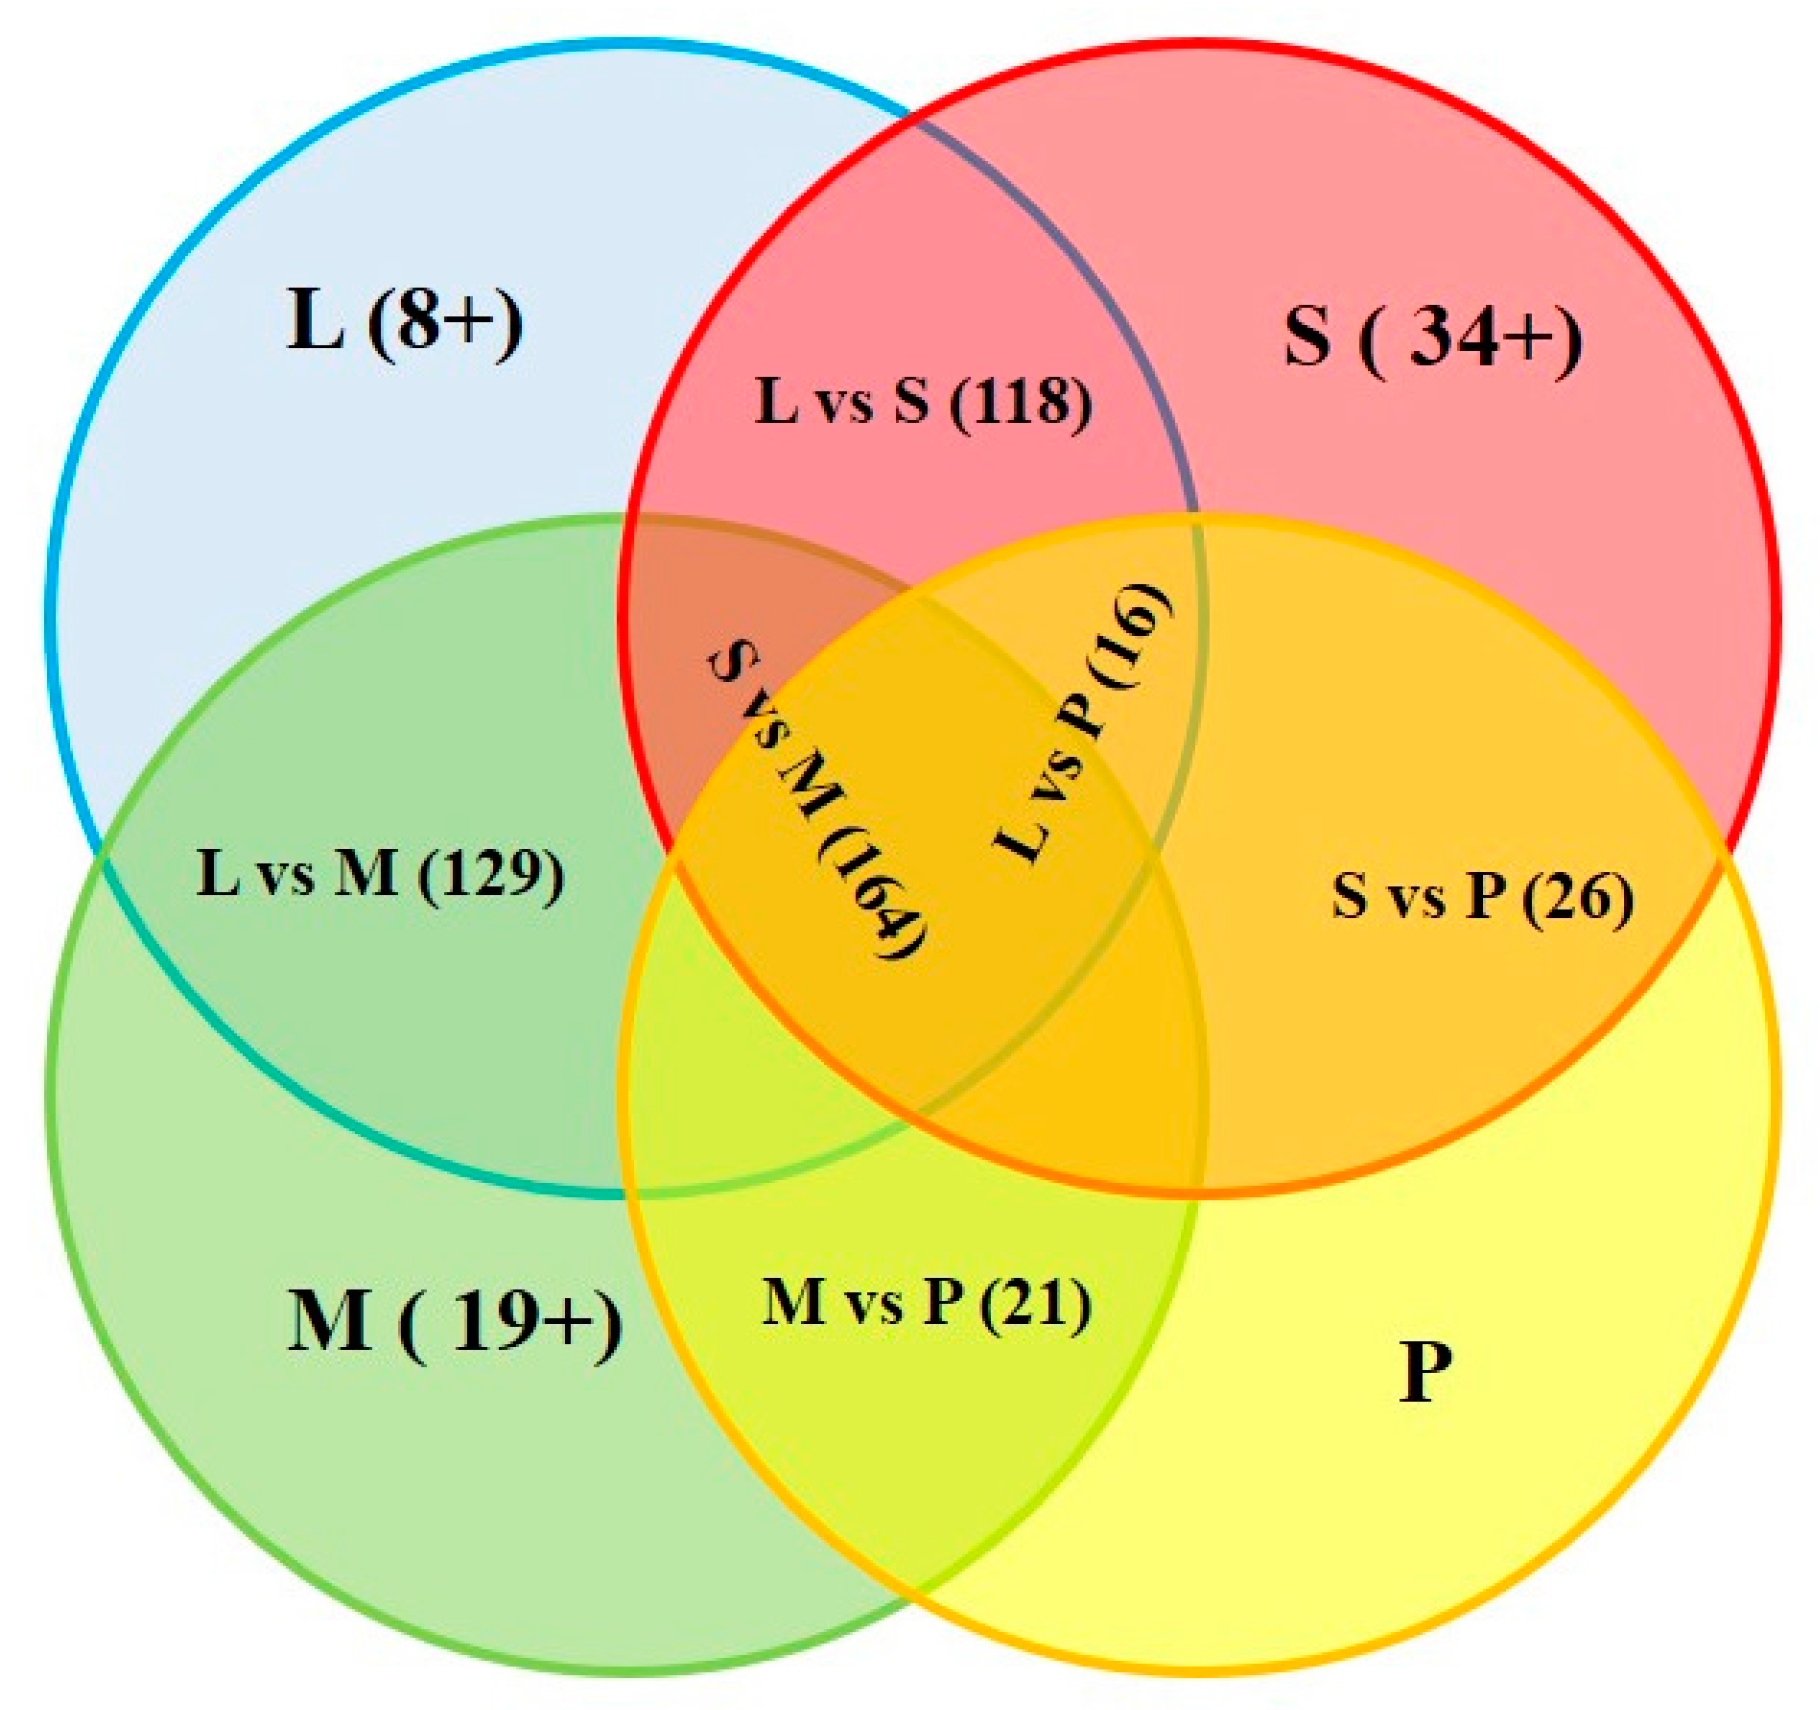
2.3. Conservation Analysis of the Identified Common Carp miRNAs

To date, thousands of miRNAs have been annotated in nearly 100 species [14]. In this report, we identified 142 deposited miRNAs and 556 predicted novel miRNAs of common carp. The comparison was further performed between the deposited miRNAs discovered in the common carp with those identified in the previous reports [9,10,11]. The result shows that the number of over-lapped miRNAs between liver and spleen was 118, between liver and skeletal muscle 129, between liver and pooled tissues 16, between spleen and skeletal muscle 164, between spleen and pooled tissues 26, and between skeletal muscle and pooled tissues 21 (Figure 3 and Table 2). Tissue specific miRNA was shown in bold in the Table S1. The number of specific miRNAs detected in the liver, spleen and skeletal muscle was 8, 34, and 19, respectively. One hundred and thirty four miRNAs were discovered in common carp published previously, eight miRNAs were newly identified in the common carp (Table S1), named ccr-miR-124a, ccr-miR-124b, ccr-miR-132b, ccr-miR-7132, ccr-miR-7133, ccr-miR-722, ccr-miR-9-3p, and ccr-miR-9-5p. Considering there were still 556 predicted miRNAs candidates, this indicates that there are still many new miRNAs of common carp remaining to be characterized. To analyze the conservation of common carp miRNA families, we compared them to the other eight animal miRNAs obtained the data from miRbase database (Available online: http://www.mirbase.org/), including worm (Caenorhabditis elegans), fly (Drosophila melanogaster), zebrafish (Danio rerio), channel catfish (Ictalurus punctatus), frog (Xenopus tropicalis), mouse (Mus musculus), chicken (Gallus gallus), and human (Homo sapiens). As shown in Table 3 and Table S2, miR-let_7, miR-8, miR-1, miR-34, miR-9 and miR-124 families were highly conserved from worm to human, miR-2 was found only in the two invertebrate species (worm and fly), miR-63 and miR-392 were only found in worm. Eight miRNAs were highly conserved from fly to human (No. 10–17), among them, 62.5% (five of eight, miR-10, miR-25, miR-7, miR-375, and miR-29) were abundant ones (>1000 reads). Forty one miRNA species were identified in the nine represented vertebrates (No. 26–66), among them 58.5% (24 of 41) miRNAs were highly expressed (>1000 read, No. 26–49). There were 10 miRNAs which were only identified in common carp (No. 92–101), among them 50% (five of 10, miR-122, miR-722, miR-217, miR-363 and miR-724) were abundant ones (>1000 reads).

2.4. Differentially Expressed miRNAs (DIE-miRNAs) between Infected and Control Livers of Common Carp

In the infected samples, 30 miRNAs were differentially expressed including 14 up-regulated and 16 down-regulated ones (Table 4). Among them, 21 were predicted novel miRNAs, while nine miRNAs (miR-196b, miR-365, miR-184, miR-153b, miR-301a, miR-133a-5p, miR-132b, miR-124a, miR-124b) were deposited in the miRbase database (Available online: http://www.mirbase.org/). Based on the similarity of miRNA seed sequences, miRNAs can be classified into many families. Since miRNAs in the same family have similar functions, we further analyzed the expression profiles of the nine deposited DIE-miRNA species at the family level. Only miR-365, miR-184, and miR-124 showed significant expression at both species and family levels. The other six miRNAs only showed significant expression at species level but not at family level (Table 5). For example, miR-301a was significantly up-regulated (3.58 times) in the infected sample. miR-301a belongs to the miR-130 family which consists of four members (miR-301a, miR-130b, miR-130c, miR-130a). When we calculated the expression of all members in the miR-130 family, there was no significantly up-regulated in the infected sample (0.90 times, even a little lower expression). In order to validate the results of the differentially expressed miRNAs, the expression levels of seven randomly selected miRNAs were quantified by qRT-PCR in both samples. The expression profiles of the seven miRNAs were consistent with those obtained by deep sequencing (Figure 2B).

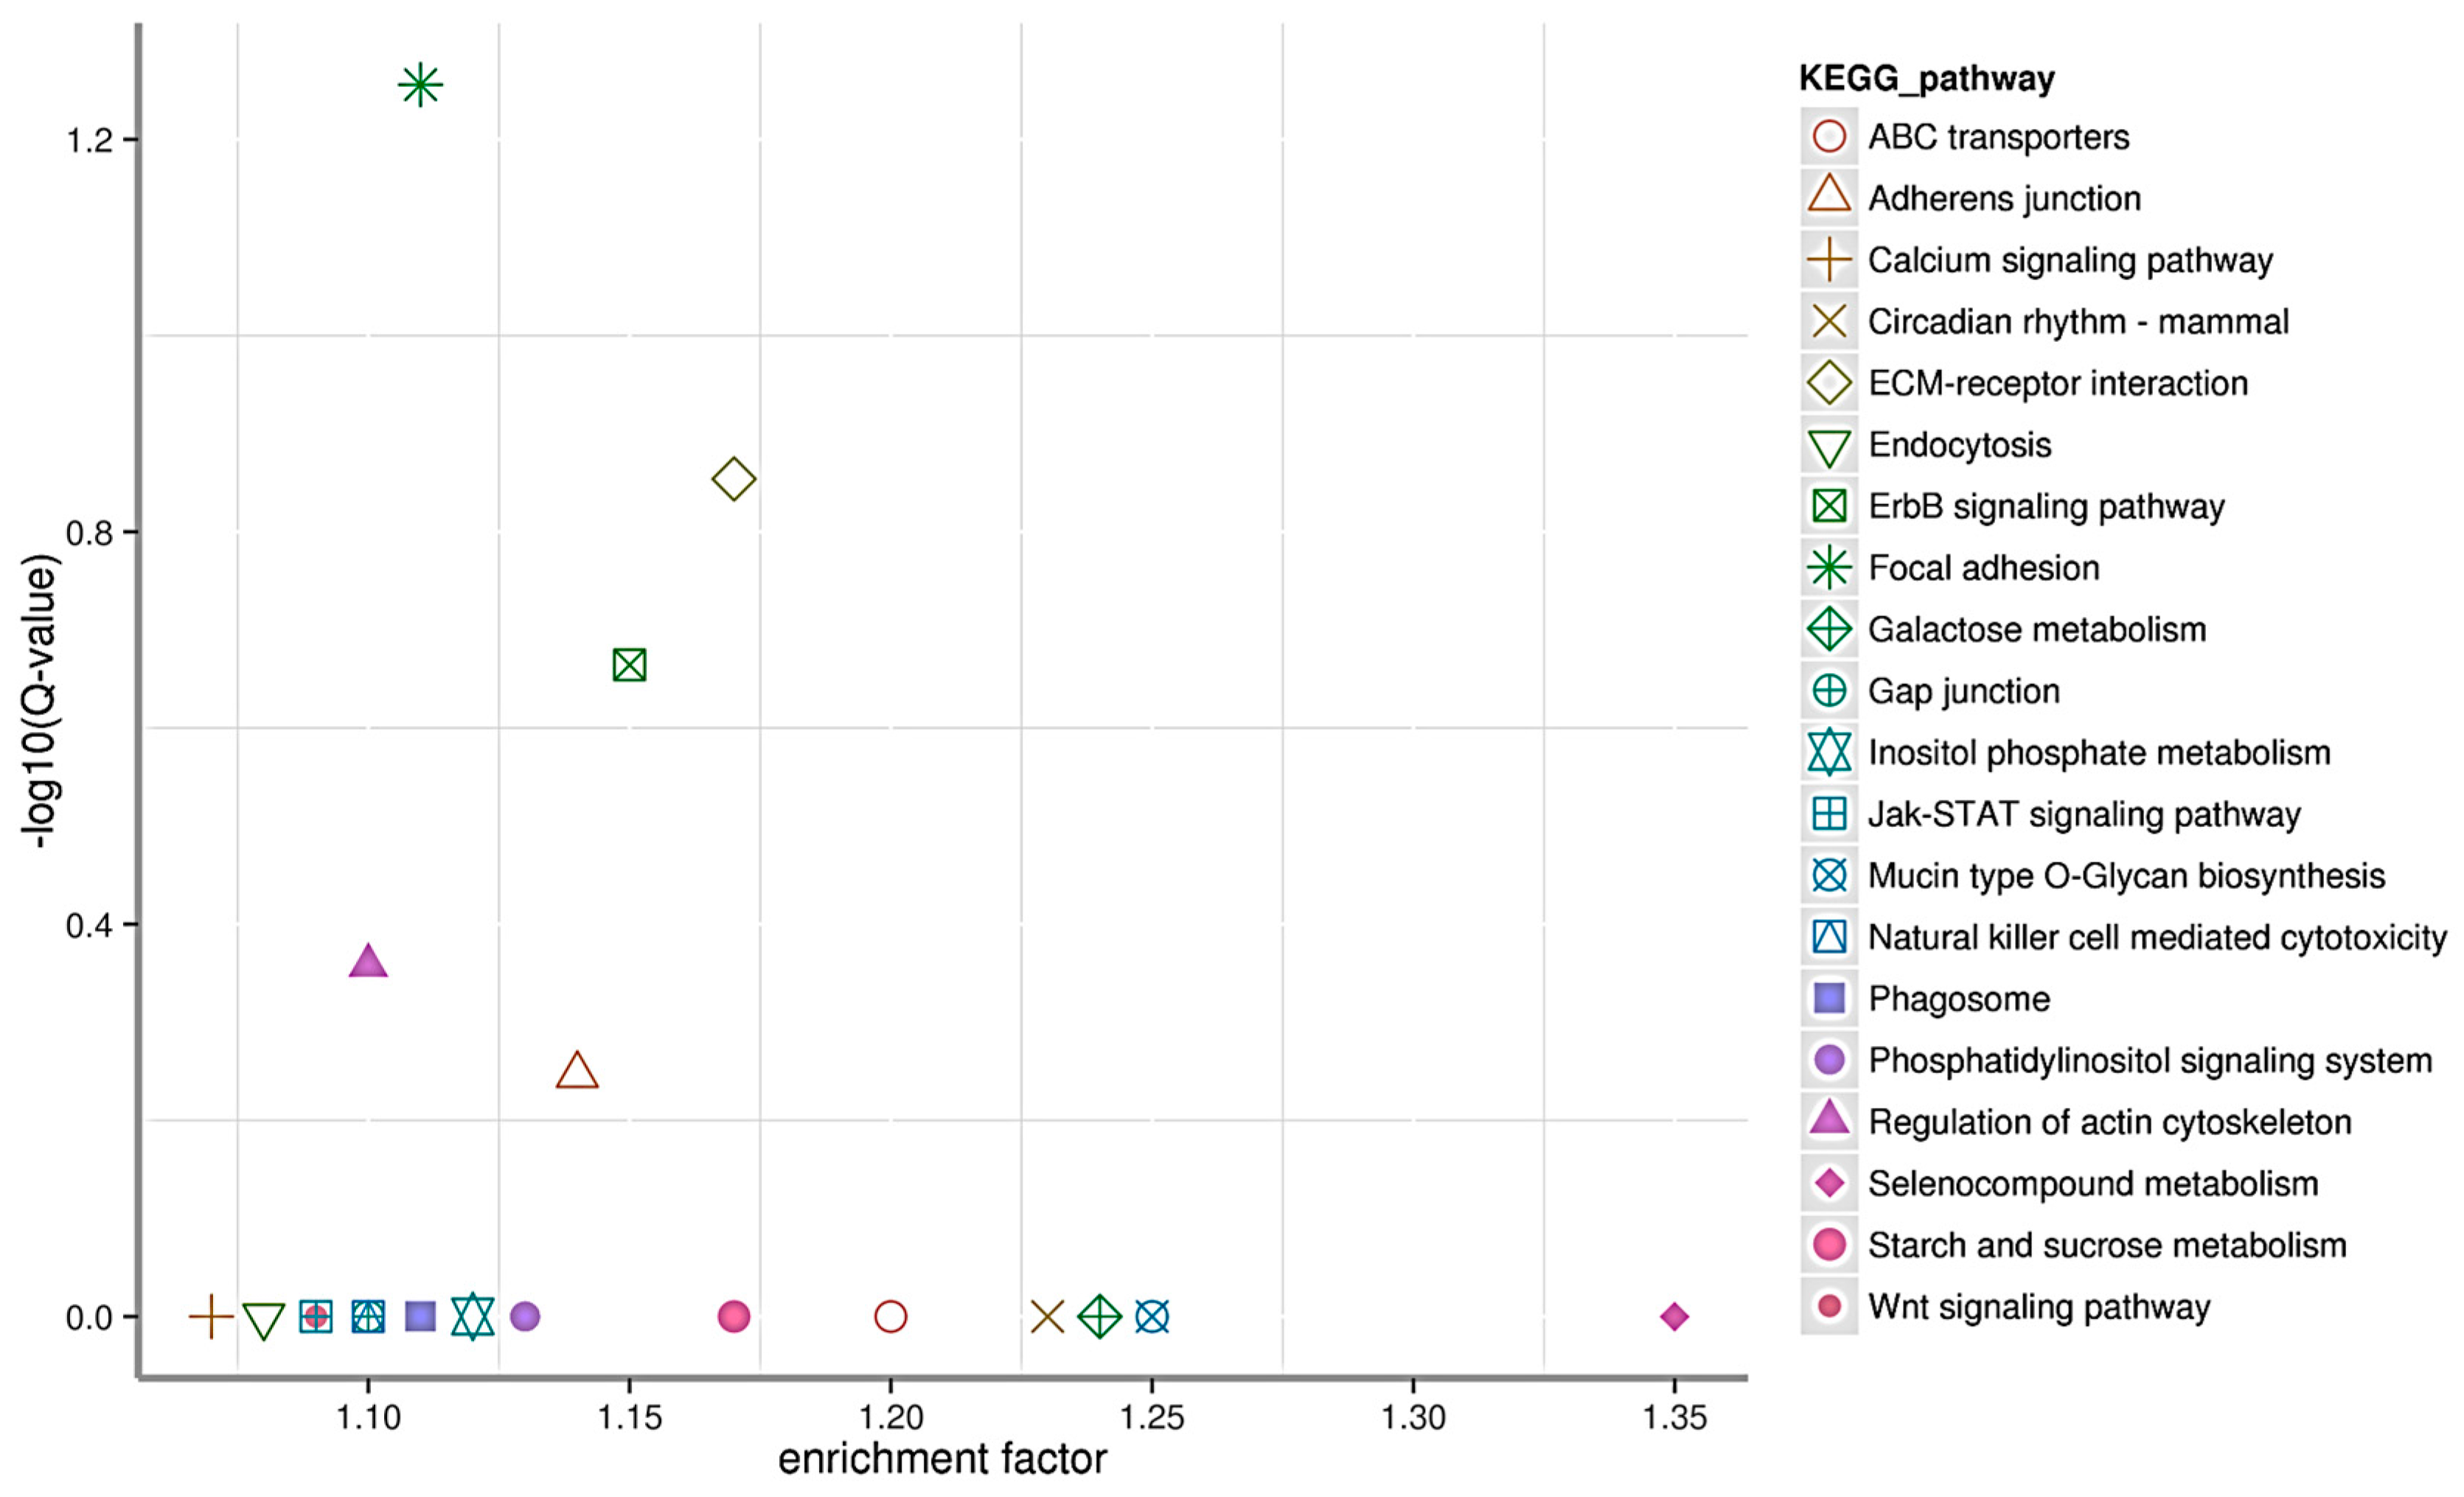
2.5. miRNA Target Genes, Annotation and KEGG Pathway Enrichment Analysis

To better understand the functions of miRNAs in the liver of common carp, the target genes of miRNAs in common carp were predicted using miRnada (Available online: http://www.microrna.org) and RNAhybrid (Available online: http://bibiserv.techfak.uni-bielefeld.de/rnahybrid/) softwares. There were totally 52,537 target genes of the identified 698 miRNAs. More than 91.3% (47,982 out of 52,537) of the target genes could be annotated. The 30 DIE-miRNAs target genes were 27,363 which were grouped into genetic information processing, organismal systems, cellular processes, environmental information processing, and metabolism clusters. Furthermore, neuroactive ligand-receptor interaction, focal adhesion, mitogen-activated protein kinase (MAPK) signaling pathway, regulation of actin cytoskeleton, and endocytosis were the top five clusters (Figure 4). When the target genes were further subjected to KEGG pathway enrichment analysis, the results showed that there were five significant enriched pathways as following: Focal adhesion (Q = 0.056), ECM-receptor interaction (Q = 0.140), ErbB signaling pathway (Q = 0.217), Regulation of actin cytoskeleton (Q = 0.439), and Adherent junction (Q = 0.567) (Figure 5).

3. Discussion

MicroRNAs are involved in diverse biogenesis pathways and versatile regulatory functions. They have convoluted relationships, in which they cooperate, compete, or regulate each other [15]. They are involved in basic cellular processes, including differentiation, proliferation, and apoptosis [16]. Common carp is an important commercial fish worldwide. Recently, the whole genome of common carp was sequenced [2]. There have been three reports about the miRNAs of common carp [9,10,11]. However, these miRNAs were identified in common carp without infection and they were published before the genome of common carp was available. F. columnare (FC) infection can cause pathogenesis of the liver of common carp with high mortality. However, miRNA profiling of common carp in response to FC infection has not been characterized. In this study, 142 deposited miRNAs and 556 predicted miRNAs were identified from the liver of common carp. Among the 142 deposited miRNAs, eight were first identified in common carp, 134 were identical to those reported previously [9,10,11]. When we compared the miRNAs from nine animals, more than 50% of the conserved miRNAs were highly expressed in common carp (>1000 reads), indicating that these miRNAs might be important in the common carp.
Numerous reports have shown that the expression patterns of miRNA are species, tissue, and time dependent. For example, miR-1and miR-let_7 were expressed in the mature fly but not in the embryo of the fly [17]. Moreover, miR-171 was highly expressed in the flower but not in the leaves of Arabidopsis thaliana [18]. In this report, we compared the tissue specificity of miRNAs in common carp. As shown in Figure 3 and Table 2, they were indeed many miRNAs which specifically expressed in the liver, spleen, and skeletal muscle. In the previous report [10], the authors analyzed the miRNAs from pooled 10 tissues which included the three above mentioned tissues. Therefore, it is reasonable to believe that miRNAs in the pooled tissues should cover all miRNAs identified in the liver, spleen, and skeletal muscle. However, for an unknown reason, there were only 80 miRNAs identified in the pooled tissues and most of the miRNAs in the three tissues could not be found.
The DIE-miRNA target genes were grouped into five significant enriched KEGG pathways, named focal adhesion, ECM-receptor interaction, ErbB signaling pathway, adherent junction, and regulation of actin cytoskeleton. Focal adhesions play essential roles in important biological processes including cellular motility. In the focal adhesions, bundles of actin filaments are anchored to the receptors of the integrin signaling pathway, resulting in reorganization of the cytoskeleton which is a prerequisite for changes in cell shape and motility [19,20]. ECM consists of many macromolecules and plays an important role in the maintenance of cell and tissue structure and function. Integrins are involved in the interactions between cells and ECM, and play important roles in the control of cell adhesion, migration, and apoptosis. The ErbB protein family consists of four tyrosine kinases. ErbB signaling is closely related to the neurodegenerative diseases and tumors of humans [21]. Adherent junctions are protein complexes which link to the intracellular actin cytoskeleton. Via direct interaction, adherent junctions play a role as a bridge connecting the cytoskeleton of neighboring cells [22]. Apparently, the above mentioned enriched pathways were all closely related to cytoskeleton and its associated signaling pathways, such as the integrin signaling pathway and the cadherins signaling pathway, indicating that FC infection has dramatic effects on the cell adhesion, migration, differentiation, proliferation, and apoptosis of the liver cells of common carp. The underlying mechanism is not known and remains to be elucidated.
Among the deposited nine DIE-miRNAs, the read counts of three miRNAs (miR-196b, miR-365, miR-184) in both infected and control samples were more than 20 (TPM > 3.5), the read counts of the other six miRNAs in both infected and control samples were less than 20 (TPM < 3.5). Considering the high sensitivity of Highseq 2500 assay, we have only focused our discussion on three miRNAs with read counts more than 20. By comparison with the control sample, ccr-miR-196b and ccr-miR-365 were significantly up-regulated, while ccr-miR-184 was significantly decreased. The functions of the three miRNAs have been intensively studied in the human being. These three miRNAs can suppress or promote the pathogenesis of cancers of humans. miR-184 may have oncogenic effects in liver cancer, glioma cancer, and bone cancer [23,24,25], but has anti-cancer effects on lung cancer, renal, and corneal tumors [26,27,28]. miR-196 had oncogenic functions in colorectal cancer, pancreatic cancer, breast cancer, leukaemia, and oesophageal adenocarcinoma [29,30,31,32,33,34,35,36,37], but acts as a tumor suppressor of melanoma [38]. miR-365 could promote the pathogenesis of squamous cell carcinoma and gastric tumor [39,40], but could inhibit the development of lung cancer, colon cancer, and melanoma [41,42,43].The mechanisms of action of these three miRNAs in different types of cancer are not known. In fish, it has been shown that miR-184 was expressed in the eye of zebrafish embryo [44] and was expressed specifically in retina cells, indicating cell type- and developmental stage-specific expression patterns of miR-184 [45]. miR-196b could target estrogen receptor transcript [46] and estrogens are important in the teleost spermatogonial process [47]. The function of miR-365 in fish is largely unknown. These regulation mechanisms of these three miRNAs involved in FC infection in common carp are enigmatic and warrant further investigation.

4. Materials and Methods

4.1. Fish, Bacteria, and Infection

Flavobacterium columnare (FC) was isolated from diseased yellow catfish (Pelteobagrus fulvidraco) and kept in the College of Fisheries, Huazhong Agricultural University. All animal experiments were performed using wild common carps bred in the Shandong Freshwater Fisheries Research Institute in accordance with the recommendations in the Guide for the Care and Use of Laboratory Animals of China and Shandong Freshwater Fisheries Research Institute. Fish were maintained at 25–26 °C in a recirculating freshwater system and acclimatized in the laboratory for 2 weeks before experiments. Fish were divided into two groups, each group consisted of 10 fish. Fish were intraperitoneally infected with FC at the dose of 104 pfu/g.body weight or the same volume of culture medium of FC, and were used as the infected group or control group. Meanwhile, fish liver tissues were collected at 40 h post infection. The samples were snap-frozen in liquid nitrogen and stored at −80 °C.

4.2. Small RNA Isolation and cDNA Library Construction

Liver tissues used for the generation of the small RNA library were obtained from10 individual fish from FC-infected and control groups, respectively. Total RNA was isolated from livers using TRIzol reagent (Invitrogen, Carlsbad, CA, USA). The purity, concentration, and integrity of RNA samples were measured to ensure that the RNA quality met the criteria for sequencing using the NanoPhotometer spectrophotometer (IMPLEN, Westlake Village, CA, USA), Qubit 2.0 Flurometer (Life Technologies, Carlsbad, CA, USA) and the Agilent Bioanalyzer 2100 system (Agilent Technologies, Santa Clara, CA, USA), respectively. Equal amount of the RNAs from 10 fish were mixed together to eliminate the variation among the samples and used as a sample. A total amount of 1.5 μg RNA per sample was used as input material for the RNA sample preparations. Sequencing libraries were generated using NEBNext Ultra small RNA Sample Library Prep Kit for Illumina (NEB, Boston, MA, USA). Briefly, mixed 3′ SR Adaptor, RNA and nuclease-free water in a tube and incubated for 2 min at 70 °C in a preheated thermal cycler, followed by transferring the tube to ice. Then, 3′-ligation reaction buffer (2×) and 3′-ligation enzyme mix were added and incubated for 1 h at 25 °C in a thermal cycler. To prevent adaptor-dimer formation, the SR RT Primer hybridized to the excess of 3′ SR Adaptor and transformed the single stranded DNA adaptor into a double-stranded DNA molecule. Then, the first chain of cDNA was synthesized by reverse transcription. Subsequently, the cDNAs were amplified using PCR. The small-RNAs were separated using polyacrylamide gel and purified using the AMPure XP system (Beckman Coulter, Brea, CA, USA). The clustering of the index-coded samples was performed on a cBot Cluster Generation System using TruSeq PE Cluster Kit v4-cBot-HS (Illumina). After cluster generation, the library preparations were sequenced on an Illumina Hiseq 2500 platform (Illumina, Santa Clara, CA, USA) and paired-end reads were generated at Biomaker Biotechnologies, Co., Ltd. (Beijing, China).

4.3. Sequence Analysis and Identification of miRNAs

The raw reads were firstly processed through in-house perl scripts. By removing reads containing adapter, ploy-N, and low quality from raw data, the clean reads were obtained. Subsequently, the clean reads were further processed by removing the sequences smaller than 18 nt or longer than 30 nt. Meanwhile, Q20, Q30, GC-content and sequence duplication level of the clean data were measured. Clean data with high quality were used for the downstream analyses.
The clean reads were aligned with Silva, GtRNAdb, Rfam and Repbase database using Bowtie tools software (Available online: http://bowtie-bio.sourceforge.net/) respectively. After filtering ribosomal RNA (rRNA), transfer RNA (tRNA), small nuclear RNA (snRNA), small nucleolar RNA (snoRNA), repeat sequences, and other non-coding RNA (ncRNA), the remaining reads were used to detect known miRNA and new miRNA predicted by mapping to the common carp genome using SOAP (Available online: http://soap.genomics.org.cn). The miRNA precursors were predicted by homologous comparison miRNA sequences to the genome sequence of the common carp with mfold software (Available online: http://unafold.rna.albany.edu). New miRNA secondary structure was predicted using Randfold tools software (Available online: http://www.aquafold.com).

4.4. Target Gene Functional Annotation

Gene function was annotated based on the Nr (NCBI non-redundant protein sequences), Nt (NCBI non-redundant nucleotide sequences), Pfam (Protein family).
KOG/COG (Clusters of Orthologous Groups of proteins), Swiss-Prot (manually annotated and reviewed protein sequences), KO (KEGG Ortholog), and GO (Gene Ontology) databases.

4.5. Differential miRNA Expression Analysis

Differential expression analysis of miRNAs was performed using the IDEG6 software (Available online: http://telethon.bio.unipd.it/bioinfo/IDEG6_form). p-value was adjusted using q-value. q-value < 0.005 and |log2 (fold-change)| ≥ 1 was set as the threshold for significantly differential expression.

4.6. GO and KEGG Pathway Enrichment Analysis

GO enrichment analysis of the differentially expressed genes was implemented by the GOseq R packages (Available online: http://www.bioconductor.org) based Wallenius non-central hyper-geometric distribution. The statistical enrichment of differential expression genes in KEGG pathways was measured using KOBAS software (Available online: http://kobas.cbi.pku.edu.cn). Differential expression analysis of two samples was checked using the IDEG6. p value was adjusted using q value. q value < 0.005 and |log2 (fold change)| ≥ 1 was set as the threshold for significantly differential expression.

4.7. RT-PCR and qRT-PCR Analysis of miRNAs

The predicted novel miRNAs were validated by RT-PCR as described previously [48]. The primers used for this study was shown in Table S5. Seven randomly selected miRNAs were detected by qRT-PCR using the same RNA samples used for the construction of the miRNA library. Seven forward primers were designed based on mature miRNA sequences. The reverse primer was supplied in the kit purchased from Tiagen, Beijing. U6 RNA gene was amplified as an endogenous control to normalize template amounts. Quantitative PCR reactions were conducted in 20 µL volumes containing 1 µL diluted cDNA, 300 nM of each primer, and 10 µL of the SYBR Master Mix with the following cycling conditions: 95 °C for 5 min, 45 cycles at 95 °C for 10 s, 58 °C for 10 s, and 72 °C for 15 s, and ended with 95 °C at 5 °C/s calefactive velocity to make the melt curve. All expression levels were normalized to the U6 RNA gene. Amplification results were analyzed using a comparative Ct method. Ct represents the threshold cycle.

Supplementary Materials

Supplementary materials can be found at https://0-www-mdpi-com.brum.beds.ac.uk/1422-0067/17/4/566/s1.

Acknowledgments

This work was jointly supported by the Agricultural seed project of Shandong Province “Genetic resources and selection breeding of common carp in Dongpinghu lake” awarded to Ling Yang; Agricultural seed project of Shandong Province “Collection, protection and evaluation of fresh water economic organism” awarded to Dengxuan Duan; Special fund for Science and technology from Hubei Province (2015BBA228), the Fundamental Research Funds for the Central Universities (2014PY035), Special fund for fish diseases prevention and therapy from Guangdong province (2015-115) awarded to Li Lin.

Author Contributions

Lijuan Zhao, Li Lin, Weimin Wang and Ling Yang designed the research; Li Lin and Lijuan Zhao finalized the paper writing; Lijuan Zhao, Hong Lu, Jinfu Wang, Qinglei Meng performed the experiments and contributed to the data collection and statistical analysis.

Conflicts of Interest

The authors declare no conflict of interest.

References

  1. Declercq, A.M.; Haesebrouck, F.; van den Broeck, W.; Bossier, P.; Decostere, A. Columnaris disease in fish: A review with emphasis on bacterium-host interactions. Vet Res. 2013, 44. [Google Scholar] [CrossRef] [PubMed] [Green Version]
  2. Zhou, W.; Zhang, Y.; Wen, Y.; Ji, W.; Zhou, Y.; Ji, Y.; Liu, X.; Wang, W.; Asim, M.; Liang, X.; et al. Analysis of the transcriptomic profilings of Mandarin fish (Siniperca chuatsi) infected with Flavobacterium columnare with an emphasis on immune responses. Fish Shellfish Immunol. 2015, 43, 111–119. [Google Scholar] [CrossRef] [PubMed]
  3. Xu, P.; Zhang, X.; Wang, X.; Ji, W.; Zhou, Y.; Ji, Y.; Liu, X.; Wang, W.; Asim, M.; Liang, X.; et al. Genome sequence and genetic diversity of the common carp, Cyprinus carpio. Nat. Genet. 2014, 46, 1212–1219. [Google Scholar] [CrossRef] [PubMed]
  4. Declercq, A.M.; Chiers, K.; van den Broeck, W.; Eeckhaut, V.; Cornelissen, M.; Bossier, P.; Haesebrouck, F.; Decostere, A. Interactions of highly and low virulent Flavobacterium columnare isolates with gill tissue in carp and rainbow trout. Vet. Res. 2015, 46. [Google Scholar] [CrossRef] [PubMed] [Green Version]
  5. Lee, Y.; Ahn, C.; Han, J.; Choi, H.; Kim, J.; Yim, J.; Lee, J.; Provost, P.; Rådmark, O.; Kim, S.; et al. The nuclear RNase III Drosha initiates microRNA processing. Nature 2003, 425, 415–419. [Google Scholar] [CrossRef] [PubMed]
  6. Fabian, M.R.; Sonenberg, N. The mechanics of miRNA-mediated gene silencing: A look under the hood of miRISC. Nat. Struct. Mol. Biol. 2012, 19, 586–593. [Google Scholar] [CrossRef] [PubMed]
  7. Lee, Y.; Jeon, K.; Lee, J.T.; Kim, S.; Kim, V.N. MicroRNA maturation: Stepwise processing and subcellular localization. EMBO J. 2002, 21, 4663–4670. [Google Scholar] [CrossRef] [PubMed]
  8. Ghildiyal, M.; Zamore, P.D. Small silencing RNAs: An expanding universe. Nat. Rev. Genet. 2009, 10, 94–108. [Google Scholar] [CrossRef] [PubMed]
  9. Li, G.; Zhao, Y.; Wen, L.; Liu, Z.; Yan, F.; Gao, C. Identification and characterization of microRNAs in the spleen of common carp immune organ. J. Cell. Biochem. 2014, 115, 1768–1778. [Google Scholar] [CrossRef] [PubMed]
  10. Zhu, Y.P.; Xue, W.; Wang, J.T.; Wan, Y.M.; Wang, S.-L.; Xu, P.; Zhang, Y.; Li, J.-T.; Sun, X.-W. Identification of common carp (Cyprinus carpio) microRNAs and microRNA-related SNPs. BMC Genom. 2012, 13. [Google Scholar] [CrossRef] [PubMed]
  11. Yan, X.; Ding, L.; Li, Y.; Zhang, X.; Liang, Y.; Sun, X.; Teng, C.B. Identification and profiling of microRNAs from skeletal muscle of the common carp. PLoS ONE 2012, 7, e30925. [Google Scholar] [CrossRef] [PubMed]
  12. Bizuayehu, T.T.; Babiak, I. MicroRNA in teleost fish. Genome Biol. Evol. 2014, 6, 1911–1937. [Google Scholar] [CrossRef] [PubMed]
  13. Hauck, C.R. Cell adhesion receptors—Signaling capacity and exploitation by bacterial pathogens. Med. Microbiol. Immunol. 2002, 191, 55–62. [Google Scholar] [CrossRef] [PubMed]
  14. Hammond, S.M. An overview of microRNAs. Adv. Drug Deliv. Rev. 2015, 87, 3–14. [Google Scholar] [CrossRef] [PubMed]
  15. Gao, L.; Jiang, F. MicroRNA (miRNA) profiling. Methods Mol. Biol. 2016, 1381, 151–161. [Google Scholar] [PubMed]
  16. Bartel, D. MicroRNAs: Target recognition and regulatory functions. Cell 2009, 136, 215–233. [Google Scholar] [CrossRef] [PubMed]
  17. Thompson, B.J. Developmental control of cell growth and division in Drosophila. Curr. Opin. Cell Biol. 2010, 22, 788–794. [Google Scholar] [CrossRef] [PubMed]
  18. Yu, S.; Lian, H.; Wang, J.W. Plant developmental transitions: The role of microRNAs and sugars. Curr. Opin. Plant Biol. 2015, 27, 1–7. [Google Scholar] [CrossRef] [PubMed]
  19. Turner, C.E. Paxillin and focal adhesion signaling. Nat. Cell Biol. 2000, 2, E231–E236. [Google Scholar] [CrossRef] [PubMed]
  20. Danen, E.H.; Yamada, K.M. Fibronectin, integrins, and growth control. J. Cell. Physiol. 2001, 189, 1–13. [Google Scholar] [CrossRef] [PubMed]
  21. Marmor, M.D.; Skaria, K.B.; Yarden, Y. Signal transduction and oncogenesis by ErbB/HER receptors. Int. J. Radiat. Oncol. Biol. Phys. 2004, 58, 903–913. [Google Scholar] [CrossRef] [PubMed]
  22. Guo, R.; Sakamoto, H.; Sugiura, S.; Ogawa, M. Endothelial cell motility is compatible with junctional integrity. J. Cell. Physiol. 2007, 211, 327–335. [Google Scholar] [CrossRef] [PubMed]
  23. Wu, G.; Li, W.; He, W.; Jiang, N.; Zhang, G.X.; Chen, W.; Yang, H.F.; Liu, Q.L.; Huang, Y.N.; Zhang, L.; et al. miR-184 post-transcriptionally regulates SOX7 expression and promotes cell proliferation in human hepatocellular carcinoma. PLoS ONE 2014, 9, e88796. [Google Scholar] [CrossRef] [PubMed]
  24. Yuan, Q.; Gao, W.; Liu, B.; Ye, W. Upregulation of miR-184 enhances the malignant biological behavior of human glioma cell line A172 by targeting FIH-1. Cell. Physiol. Biochem. 2014, 34, 1125–1136. [Google Scholar] [CrossRef] [PubMed]
  25. Yin, G.R.; Wang, Q.; Zhang, X.B.; Wang, S.J. Regulatory role of microRNA184 in osteosarcoma cells. Genet. Mol. Res. 2015, 14, 14246–14252. [Google Scholar] [CrossRef] [PubMed]
  26. Liu, Z.; Mai, C.; Yang, H.; Zhen, Y.; Yu, X.; Hua, S.; Wu, Q.; Jiang, Q.; Zhang, Y.; Song, X.; et al. Candidate tumour suppressor CCDC19 regulates miR-184 direct targeting of C-Myc thereby suppressing cell growth in non-small cell lung cancers. J. Cell. Mol. Med. 2014, 18, 1667–1679. [Google Scholar] [CrossRef] [PubMed]
  27. Su, Z.; Chen, D.; Li, Y.; Zhang, E.; Yu, Z.; Chen, T.; Jiang, Z.; Ni, L.; Yang, S.; Gui, Y. MicroRNA-184 functions as tumor suppressor in renal cell carcinoma. Exp. Ther. Med. 2015, 9, 961–966. [Google Scholar] [CrossRef] [PubMed]
  28. Grimaldo, S.; Yuen, D.; Theis, J.; Ng, M.; Ecoiffier, T.; Chen, L. MicroRNA-184 regulates corneal lymphangiogenesis. Investig. Ophthalmol. Vis. Sci. 2015, 56, 7209–7213. [Google Scholar] [CrossRef] [PubMed]
  29. Maru, D.M.; Singh, R.R.; Hannah, C.; Albarracin, C.T.; Li, Y.X.; Abraham, R.; Romans, A.M.; Yao, H.; Luthra, M.G.; Anandasabapathy, S. MicroRNA-196a is a potential marker of progression during Barrett’s metaplasiadysplasia-invasive adenocarcinoma sequence in esophagus. Am. J. Pathol. 2009, 174, 1940–1948. [Google Scholar] [CrossRef] [PubMed]
  30. Bloomston, M.; Frankel, W.L.; Petrocca, F.; Volinia, S.; Alder, H.; Hagan, J.P.; Liu, C.G.; Bhatt, D.; Taccioli, C.; Croce, C.M. MicroRNA expression patterns to differentiate pancreatic adenocarcinoma from normal pancreas and chronic ancreatitis. JAMA 2007, 297, 1901–1908. [Google Scholar] [CrossRef] [PubMed]
  31. Szafranska, A.E.; Doleshal, M.; Edmunds, H.S.; Gordon, S.; Luttges, J.; Munding, J.B.; Barth, R.J., Jr.; Gutmann, E.J.; Suriawinata, A.A.; Marc Pipas, J. Analysis of microRNAs in pancreatic fine-needle aspirates can classify benign and malignant tissues. Clin. Chem. 2008, 54, 1716–1724. [Google Scholar] [CrossRef] [PubMed]
  32. Hui, A.B.; Shi, W.; Boutros, P.C.; Miller, N.; Pintilie, M.; Fyles, T.; McCready, D.; Wong, D.; Gerster, K.; Waldron, L.; et al. Robust global micro-RNA profiling with formalin-fixed paraffin-embedded breast cancer tissues. Lab. Investig. 2009, 89, 597–606. [Google Scholar] [CrossRef] [PubMed]
  33. Debernardi, S.; Skoulakis, S.; Molloy, G.; Chaplin, T.; Dixon-McIver, A.; Young, B.D. MicroRNA miR-181a correlates with morphological sub-class of acute myeloid leukaemia and the expression of its target genes in global genome-wide analysis. Leukemia 2007, 21, 912–916. [Google Scholar] [CrossRef] [PubMed]
  34. Thorsteinsdottir, U.; Sauvageau, G.; Hough, M.R.; Dragowska, W.; Lansdorp, P.M.; Lawrence, H.J.; Largman, C.; Humphries, R.K. Overexpression of HOXA10 in murine hematopoietic cells perturbs both myeloid and lymphoid differentiation and leads to acute myeloid leukemia. Mol. Cell. Biol. 1997, 17, 495–505. [Google Scholar] [CrossRef] [PubMed]
  35. Thorsteinsdottir, U.; Mamo, A.; Kroon, E.; Jerome, L.; Bijl, J.; Lawrence, H.J.; Humphries, K.; Sauvageau, G. Overexpression of the myeloid leukemia-associated Hoxa9 gene in bone marrow cells induces stem cell expansion. Blood 2002, 99, 121–129. [Google Scholar] [CrossRef] [PubMed]
  36. Schimanski, C.C.; Frerichs, K.; Rahman, F.; Berger, M.; Lang, H.; Galle, P.R.; Moehler, M.; Gockel, I. High miR-196a levels promote the oncogenic phenotype of colorectal cancer cells. World J. Gastroenterol. 2009, 15, 2089–2096. [Google Scholar] [CrossRef] [PubMed]
  37. Wang, Y.X.; Zhang, X.Y.; Zhang, B.F.; Yang, C.Q.; Chen, X.M.; Gao, H.J. Initial study of microRNA expression profiles of colonic cancer without lymph node metastasis. J. Dig. Dis. 2010, 11, 50–54. [Google Scholar] [CrossRef] [PubMed]
  38. Braig, S.; Mueller, D.W.; Rothhammer, T.; Bosserhoff, A.K. MicroRNA miR-196a is a central regulator of HOX-B7 and BMP4 expression in malignant melanoma. Cell. Mol. Life Sci. 2010, 67, 3535–3548. [Google Scholar] [CrossRef] [PubMed]
  39. Guo, S.; Ye, H.; Teng, Y.; Wang, Y.L.; Yang, G.; Li, X.B.; Zhang, C.; Yang, X.; Yang, Z.Z.; Yang, X. Akt-p53-miR-365-cyclin D1/cdc25A axis contributes to gastric tumorigenesis induced by PTEN deficiency. Nat. Commun. 2013, 4, 2544. [Google Scholar] [CrossRef] [PubMed]
  40. Zhou, M.; Liu, W.; Ma, S.; Cao, H.; Peng, X.; Guo, L.; Zhou, X.; Zheng, L.; Guo, L.; Wan, M. A novel onco-miR-365 induces cutaneous squamous cell carcinoma. Carcinogenesis 2013, 34, 1653–1659. [Google Scholar] [CrossRef] [PubMed]
  41. Qi, J.; Rice, S.; Salzberg, A.; Runkle, E.A.; Liao, J.; Zander, D.S.; Mu, D. miR-365 regulates lung cancer and developmental gene thyroid transcription factor 1. Cell Cycle 2012, 11, 177–186. [Google Scholar] [CrossRef] [PubMed]
  42. Nie, J.; Liu, L.; Zheng, W.; Chen, L.; Wu, X.; Xu, Y.; Du, X.; Han, W. microRNA-365, down-regulated in colon cancer, inhibits cell cycle progression and promotes apoptosis of colon cancer cells by probably targeting Cyclin D1 and Bcl-2. Carcinogenesis 2012, 33, 220–225. [Google Scholar] [CrossRef] [PubMed]
  43. Bai, J.; Zhang, Z.; Li, X.; Liu, H. MicroRNA-365 inhibits growth, invasion and metastasis of malignant melanoma by targeting NRP1 expression. Int. J. Clin. Exp. Pathol. 2015, 8, 4913–4922. [Google Scholar] [CrossRef] [PubMed]
  44. Cavodeassi, F.; Carreira-Barbosa, F.; Young, R.M.; Concha, M.L.; Allende, M.L.; Houart, C.; Tada, M.; Wilson, S.W. Early stages of zebrafish eye formation require the coordinated activity of Wnt11, Fz5, and the Wnt/b-catenin pathway. Neuron 2005, 47, 43–56. [Google Scholar] [CrossRef] [PubMed]
  45. Kapsimali, M.; Kloosterman, W.P.; de Bruijn, E.; Rosa, F.; Plasterk, R.H.; Wilson, S.W. MicroRNAs show a wide diversity of expression profiles in the developing and mature central nervous system. Genome Biol. 2007, 8. [Google Scholar] [CrossRef] [PubMed]
  46. Cochrane, D.R.; Cittelly, D.M.; Richer, J.K. Steroid receptors and microRNAs: Relationships revealed. Steroids 2011, 76, 1–10. [Google Scholar] [CrossRef] [PubMed]
  47. Schulz, R.W.; de França, L.R.; Lareyre, J.J.; LeGac, F. Spermatogenesis in fish. Gen. Comp. Endocrinol. 2010, 165, 390–411. [Google Scholar] [CrossRef] [PubMed]
  48. Liu, X.; Tu, J.; Yuan, J.; Liu, X.; Zhao, L.; Dawar, F.U.; Khattak, M.N.; Hegazy, A.M.; Chen, N.; Vakharia, V.N.; et al. Identification and characterization of microRNAs in snakehead fish cell line upon snakehead fish vesiculovirus infection. Int. J. Mol. Sci. 2016, 17. [Google Scholar] [CrossRef] [PubMed]
Figure 1. Length distribution of miRNA mapped rates in livers of common carp infected with Flavobacterium columnare (FC) and control. The miRNA mapped rates from the two samples with length between 18 and 30 nt were analyzed. The 100% was the clean read count of small RNAs of a certain length.
Ijms 17 00566 g001
Figure 2. Validation of seven novel miRNAs by RT-PCR and qRT-PCR. M: marker; lane 1–7: the RT-PCR products of the seven novel miRNAs. (A) RT-PCR results; (B) qRT-PCR results.
Ijms 17 00566 g002aIjms 17 00566 g002b
Figure 3. Comparison of miRNAs from different tissues of common carp. The number of over-lapping is shown in the parentheses. Tissue specific miRNA is shown in the parentheses and marked with “+”. L, S, M, and P represents liver, spleen, skeletal muscle and pooled tissues, respectively.
Ijms 17 00566 g003
Figure 4. Functional enrichment of differentially expressed miRNA target genes.
Ijms 17 00566 g004
Figure 5. KEGG pathway enrichment of differentially expressed miRNA target genes. KOBAS software (Availible online: http://kobas.cbi.pku.edu.cn/help.do) was used to test the statistical enrichment of differential expression genes in KEGG pathways.
Ijms 17 00566 g005
Table 1. Overview of miRNA high-sequencing data. Mapped rate (%) = mapped miRNA reads/clean reads × 100.
SampleClean ReadsAnnotated Small RNAUnannotated Small RNAMapped siRNA ReadsMapped Rate (%)
Control16,907,8773,210,40013,697,4779,181,15354.3
Infection13,599,3103,758,4459,840,8656,479,17247.6
Table 2. Comparison of miRNAs from different tissues of common carp. The number of over-lapped miRNA is followed by the number of tissue specific miRNAs which are in parentheses. L, S, M, and P represent liver, spleen, skeletal muscle, and pooled tissues, respectively.
TissueLiver (142)Spleen (193)Skeletal Muscle (188)Pooled Tissues (80)
liver118 (L: 24; S: 75)129 (L: 13; M: 59)16 (L: 126; P: 64)
spleen164 (S: 29; M: 24)26 (S: 167; P: 54)
skeletal muscle21 (M: 167; P: 59)
pooled tissues
Table 3. Comparison of miRNAs among invertebrates and vertebrates. The miRNAs from other represented animals were obtained from miRbase database (Available online: http://www.mirbase.org/).
No.miRNA Familyceldmeccrdreipuxtrggammuhsaccr Read
1miR-let_711518219111212185,356
2miR-811366335541,287
3miR-1112434443943
4miR-34111325333305
5miR-914177423377
6miR-12411265143312
7miR-21800000000
8miR-631000000000
9miR-3921000000000
10miR-1004715158588313,126
11miR-2502344514449,817
12miR-70124634335689
13miR-3750112211111846
14miR-290123344441215
15miR-184011211111743
16miR-13301243443398
17miR-19001122112213
18miR-210011111011455
19miR-19301130122221
20miR-330100021120
21miR-3140100000000
22miR-310201111110
23miR-2630200000000
24miR-2190103312330
25miR-2160102213220
The abbreviation of the animal names used for miRNA nomenclature: Worm (Caenorhabditis elegans, cel); Fly (Drosophila melanogaster, dme); Common carp (Cyprinus carpio, ccr); Zebrafish (Danio rerio, dre); Channel catfish (Ictalurus punctatus, ipu); Frog (Xenopus tropicalis, xtr); Mouse (Mus musculus, mmu); Chicken (Gallus gallus, gga); Human (Homo sapiens, hsa); ccr read represents mRNA read count in the liver of the common carp control sample. The miRNAs in bold represent high abundant expression ones.
Table 4. Differentially expressed miRNA species between control and infected samples. The plus (+) value represents up-regulated fold, while the minus (−) value represents down-regulated fold. Two folds difference was set as significant differentially expressed. miRNAs with the absolute value of TPM >3.5 in bold. TPM = miRNA read count/total clean read count × 1,000,000.
No.Name of miRNAControl TPMInfected TPMFolds
1miR-36530.0377.28+2.57
2miR-196b3.6410.03+2.75
3miR-153b2.124.80+2.26
4miR-301a0.762.72+3.58
5miR-133a-5p0.300.84+2.75
6miR-132b0.611.67+2.75
7miR-184112.6845.53−2.47
8miR-124a1.210.21−5.76
9miR-124b0.610.21−2.91
10ID_LG1_1214310.152.09+13.77
11ID_LG10_1202872.7313.16+4.82
12ID_000000701_3113476988.2026,568.39+3.80
13ID_000000130_3589886988.2026,568.39+3.80
14ID_LG9_1861041.364.59+3.37
15ID_LG32_10587233.3773.52+2.20
16ID_LG42_11512437.08924.83+2.12
17ID_000001225_2353453.948.35+2.12
18ID_LG17_1138505.762.51−2.30
19ID_LG40_16468212.135.22−2.32
20ID_000000552_21263411.985.01−2.39
21ID_LG20_17393413.955.01−2.78
22ID_LG11_1368535.461.88−2.90
23ID_000000219_2028803.791.25−3.03
24ID_000028861_2474135.161.67−3.09
25ID_LG30_14726540.199.61−4.18
26ID_000001954_37470540.199.61−4.18
27ID_000000316_20592740.199.61−4.18
28ID_LG27_1757223.490.63−5.57
29ID_000028889_2993501.520.00
30ID_000008345_3107531.520.00
Table 5. Comparison of confirmed miRNA species and families from control and infected samples. Two folds difference was set as significant differentially expressed and is in bold and marked with *.
No.miRNA SpeciesmiRNA FamilyControl TPMInfected TPMInfected/Control TPM (miRNA Species)Infected/Control TPM (miRNA Family)
1miR-365miR-36530.0377.282.57 *2.57 *
2miR-301amiR-1300.762.723.58 *0.90
3miR-130b27.7526.940.97
4miR-130c44.5937.180.83
5miR-130a7.135.640.79
6miR-153bmiR-1532.124.802.26 *1.94
7miR-153c8.1915.251.86
8miR-196bmiR-1963.6410.032.75 *1.77
9miR-196a4.253.970.93
10miR-133a-5pmiR-1330.300.842.75 *1.80
11miR-133a-3p14.5625.901.78
12miR-132bmiR-1320.611.672.75 *1.78
13miR-132a3.495.641.62
14miR-9-5pmiR-90.460.210.461.13
15miR-9-3p11.2212.951.15
16miR-184miR-184112.6845.530.40 *0.40 *
17miR-124bmiR-1240.610.210.34 *0.23 *
18miR-124a1.210.210.17 *

