Article

In Vitro Model for Hepatotoxicity Studies Based on Primary Human Hepatocyte Cultivation in a Perfused 3D Bioreactor System

1
Bioreactor Group, Berlin-Brandenburg Center for Regenerative Therapies (BCRT), Charité-Universitätsmedizin Berlin, Campus Virchow-Klinikum, Berlin 13353, Germany
2
Janssen Research & Development, Beerse 2340, Belgium
3
Department for General, Visceral and Transplantation Surgery, Charité-Universitätsmedizin Berlin, Campus Virchow-Klinikum, Berlin 13353, Germany
*
Author to whom correspondence should be addressed.
Int. J. Mol. Sci. 2016, 17(4), 584; https://0-doi-org.brum.beds.ac.uk/10.3390/ijms17040584
Submission received: 29 February 2016 / Revised: 24 March 2016 / Accepted: 12 April 2016 / Published: 16 April 2016
(This article belongs to the Section Molecular Toxicology)

Abstract

:
Accurate prediction of the potential hepatotoxic nature of new pharmaceuticals remains highly challenging. Therefore, novel in vitro models with improved external validity are needed to investigate hepatic metabolism and timely identify any toxicity of drugs in humans. In this study, we examined the effects of diclofenac, as a model substance with a known risk of hepatotoxicity in vivo, in a dynamic multi-compartment bioreactor using primary human liver cells. Biotransformation pathways of the drug and possible effects on metabolic activities, morphology and cell transcriptome were evaluated. Formation rates of diclofenac metabolites were relatively stable over the application period of seven days in bioreactors exposed to 300 µM diclofenac (300 µM bioreactors (300 µM BR)), while in bioreactors exposed to 1000 µM diclofenac (1000 µM BR) metabolite concentrations declined drastically. The biochemical data showed a significant decrease in lactate production and for the higher dose a significant increase in ammonia secretion, indicating a dose-dependent effect of diclofenac application. The microarray analyses performed revealed a stable hepatic phenotype of the cells over time and the observed transcriptional changes were in line with functional readouts of the system. In conclusion, the data highlight the suitability of the bioreactor technology for studying the hepatotoxicity of drugs in vitro.

Graphical Abstract

1. Introduction

To date, there is an unmet need towards innovative in vitro liver models enabling clinical translation of laboratory research. Each new drug has to undergo extensive preclinical testing before entering clinical trials, and on average only one out of nine developed compounds receives approval by the regulatory authorities [1]. Animal models and in vitro models are both currently used to investigate pharmacodynamics and pharmacokinetics of new drugs. A major limitation of animal models is the insufficient prediction of human drug effects due to species-dependent differences in hepatic metabolism and different sensitivity to toxic effects [2]. In vitro culture models provide an option to address this limitation by using human liver cells. Human hepatoma cell lines were suggested as a potential human cell source for in vitro studies due to their high proliferation capacity and good availability [3,4], but aberrations in specific metabolic enzymes can alter bioactivation processes in pharmacological studies. The generation of hepatocytes from human stem cells, such as embryonic or induced pluripotent stem cells, holds large potential for future applications but currently lacks robust protocols for generating hepatocyte-like cells with a sufficiently mature hepatic phenotype [5]. Thus, primary human hepatocytes (pHH) are currently deemed as the gold standard to provide human-predictive data on hepatic metabolism and toxicity of new drugs [6].
The commonly used two-dimensional (2D) cultures of pHH are characterized by a lack of cell–cell contacts and paracrine signaling resulting in a rapid loss of metabolic functions [7,8]. To overcome the limitations of classical 2D culture systems, various 2D co-culture and 3D culture systems for cultivation of pHH were developed to improve the long-term maintenance and functionality of the cells in vitro [9,10,11]. Our approach is based on a 3D multi-compartment hollow-fiber bioreactor technology (Figure 1) for high-density perfusion culture of pHH in co-culture with non-parenchymal liver cells [12]. Tissue-like cell reorganization and stable cell maintenance over at least two weeks were observed using different scales of the technology [13]. In addition, stable preservation of cytochrome P450 (CYP) dependent enzyme activities under serum-free conditions was shown, using a miniaturized bioreactor variant [14,15].
In this study, the metabolism and toxicity of the non-steroidal anti-inflammatory drug diclofenac were investigated. In humans, diclofenac is mainly hydroxylated by cytochrome P450 2C9 (CYP2C9) to form the oxidative metabolite 4′-OH-diclofenac [16]. In addition, diclofenac undergoes glucuronidation by uridine diphosphate (UDP)-glucuronosyltransferase-2B7 (UGT2B7) to form the unstable diclofenac-acyl-glucuronide, which can be further hydroxylated by CYP2C8 leading to 4′-OH-diclofenac-acyl-glucuronide [17] (Figure 2).
Diclofenac can cause idiosyncratic drug-induced liver injury (DILI), which is barely predictable in terms of manifestation and dose-dependency of effects [18]. In a study with 180 patients, diclofenac hepatotoxicity was observed in 85% of cases within six months of therapy [19]. Liver injury was characterized by clinical symptoms (e.g., jaundice) and/or changes in biochemical values (e.g., increased transaminase values) [19]. The mechanisms of diclofenac toxicity are not yet completely understood [20], although several hazards caused by its reactive adducts were identified including oxidative stress [17], mitochondrial toxicity [20,21] as well as induction of an immune response via hapten formation [22].
Hence, diclofenac was selected as a model drug to investigate the suitability of the bioreactor technology for studies on hepatotoxicity. Two concentrations of diclofenac were used to identify a potential dose-dependent toxic effect of the model drug with respect to the parameters determined. The concentrations were chosen on the basis of studies by other groups performed in 2D or 3D culture systems. Several studies showed a toxic effect of diclofenac in the range of 180–1000 µM upon 24 h of exposure based on viability parameters such as 3-(4,5-dimethylthiazol-2-yl)-2,5-diphenyltetrazolium bromide (MTT) assay or lactate dehydrogenase (LDH) release [23,24,25]. Thus, one dose at the lower end (300 µM bioreactors (300 µM BR)) and one dose at the higher end (1000 µM BR) of that range were selected. Diclofenac was applied to primary human liver cells cultured in the bioreactors, and a possible toxic effect of drug exposure was assessed in comparison to untreated control bioreactors (control BR). This was performed by monitoring the metabolic activity of the cells over time with regard to glucose and lactate metabolism and nitrogen elimination (urea and ammonia production). In addition, the leakage of enzymes including alanine transaminase (ALT), aspartate transaminase (AST), LDH and glutamate dehydrogenase (GLDH) was measured to detect potential cell damage caused by the drug. The influence of diclofenac exposure on specific metabolism of the drug was analyzed by measuring the formation of diclofenac products. Upon culture termination the reorganization and differentiation state of the liver cells within the bioreactor was evaluated by means of histological and immunohistochemical analysis. In order to identify potential effects of diclofenac application on metabolic pathways and involved enzymes, the expression of genes assumed to be relevant in the disposition and/or hepatotoxicity of diclofenac were analyzed by whole genome microarray analysis. The design and time schedule of experiments is shown in Figure 3.

2. Results

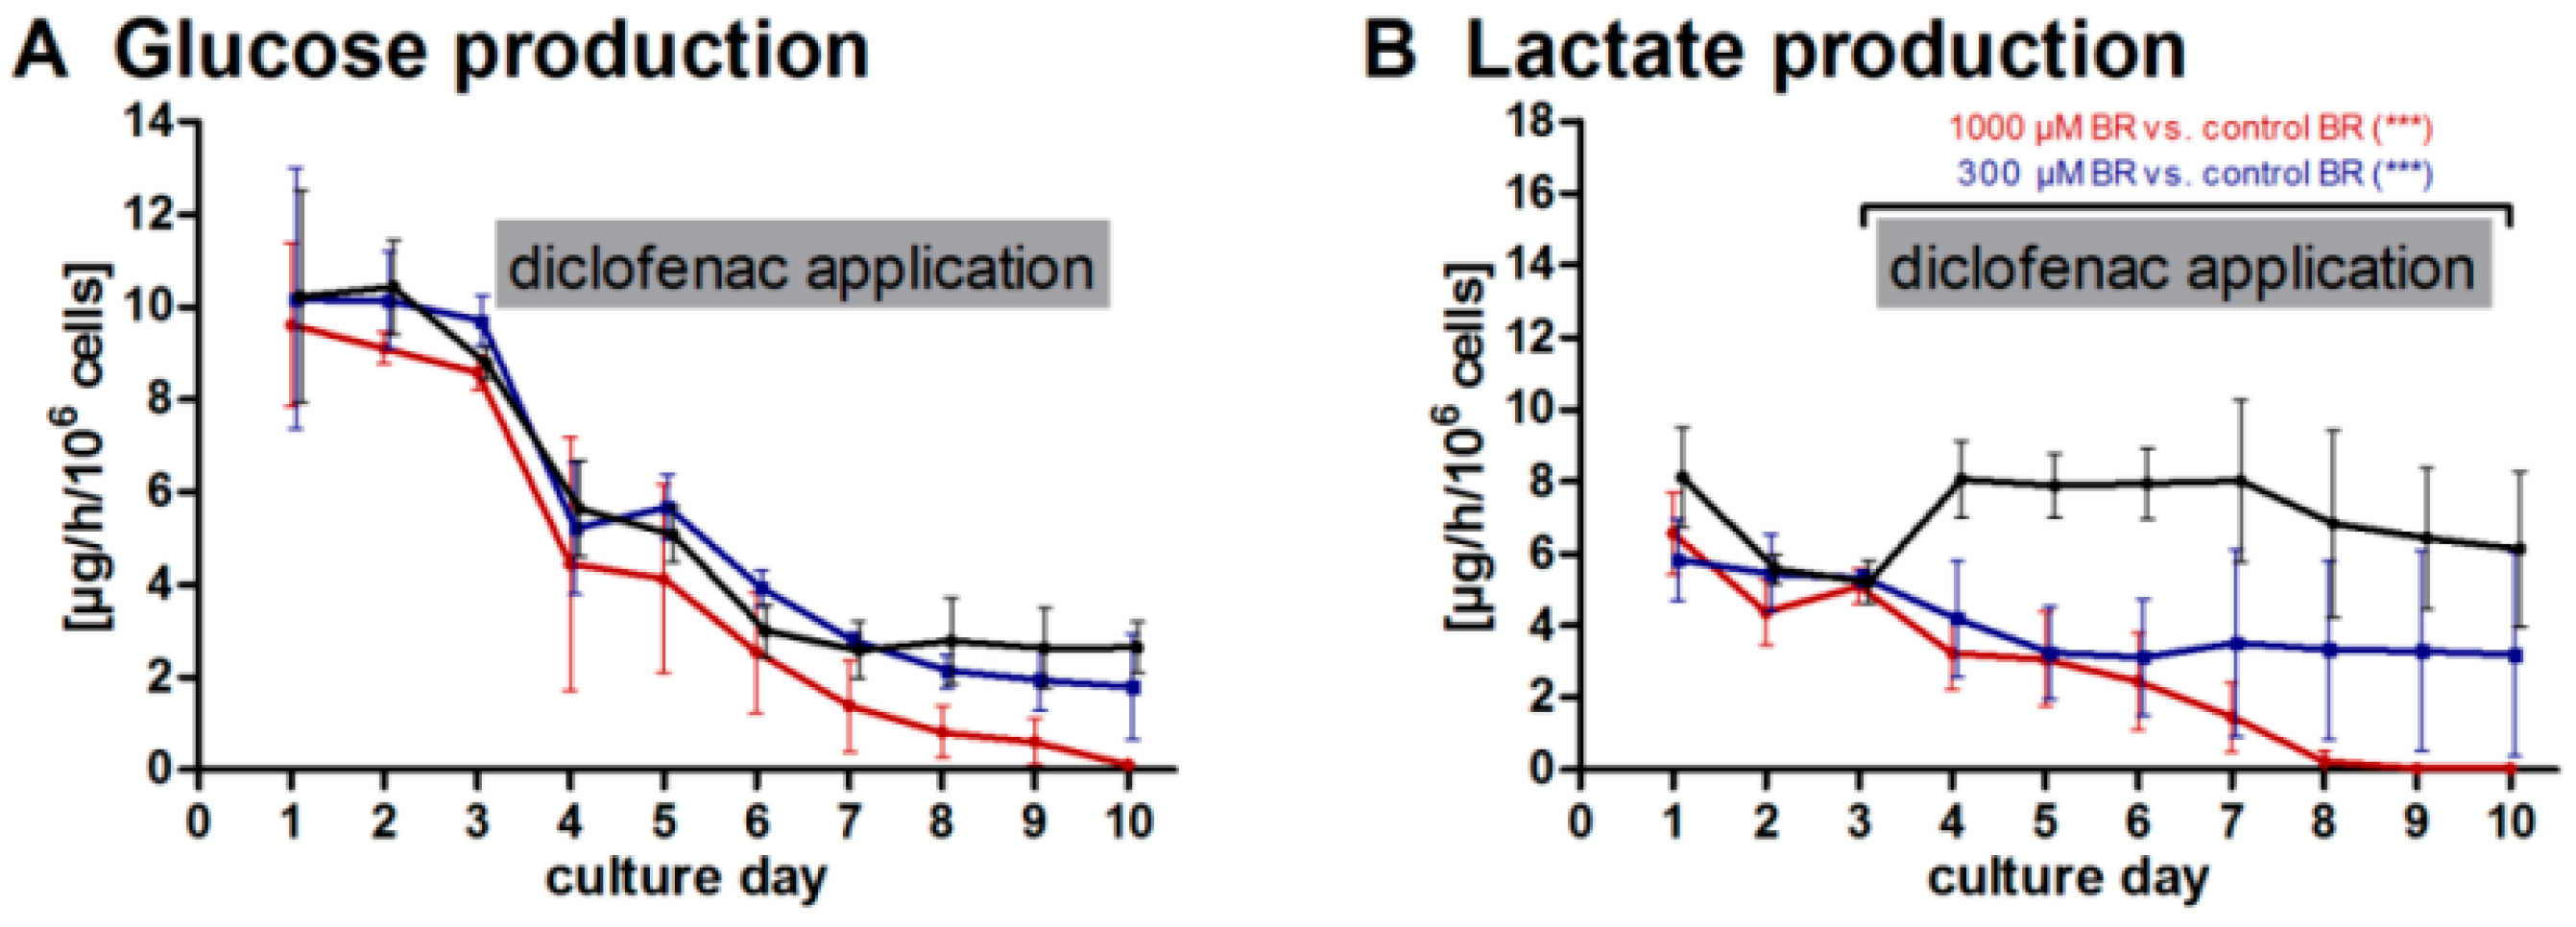
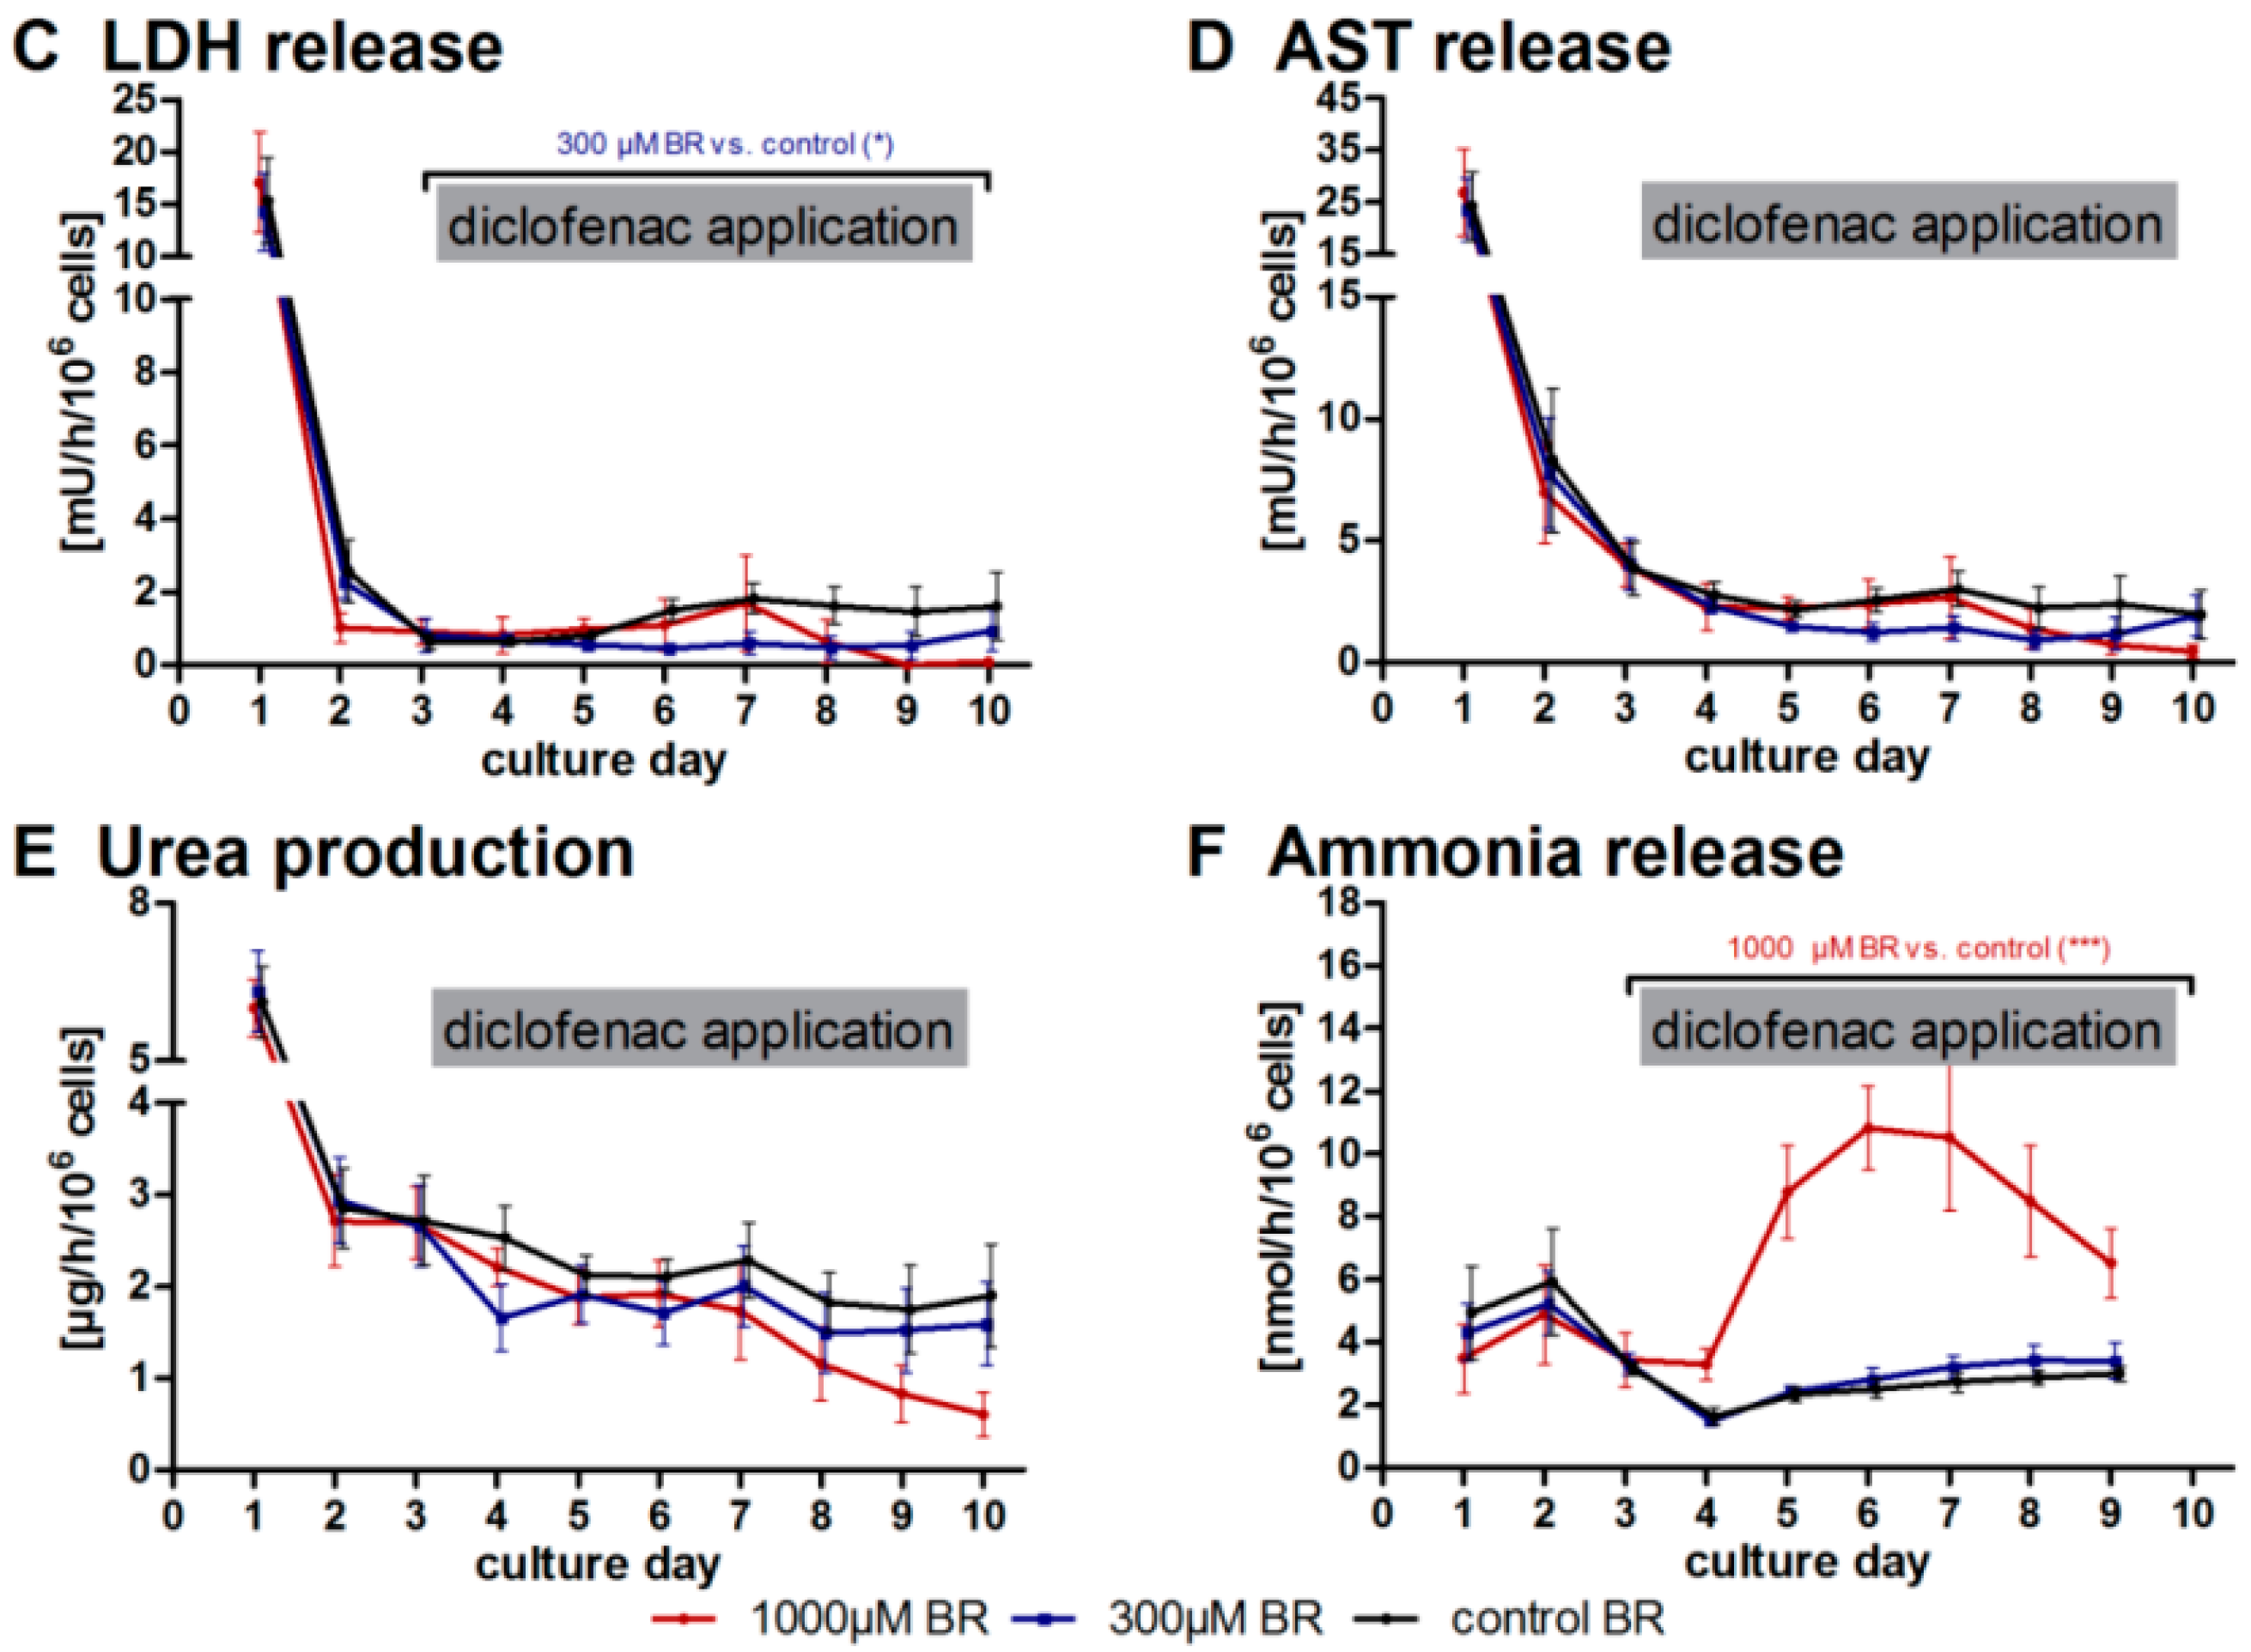
2.1. General Metabolic Activity

The metabolic activities of liver cells in bioreactors exposed or non-exposed to diclofenac were monitored throughout the entire cultivation period (Figure 4). After the initial adaptation phase (Day 0–3), the glucose production rate (Figure 4A) decreased in all groups from Day 3 until the end of culture. While the bioreactors exposed to 300 µM (300 µM BR) showed a comparable time-course than the control group (control BR), bioreactors exposed to 1000 µM diclofenac (1000 µM BR) showed a more distinct, though not significantly different, decrease in glucose production starting from Day 4. The influence of drug application was more pronounced regarding lactate production rates (Figure 4B), which showed a significant (p < 0.001) dose-dependent decrease in bioreactors exposed to diclofenac as compared to the untreated control group. Release rates of the enzymes LDH and AST (Figure 4C,D) as well as GLDH and ALT (Figure S1) showed similar kinetics in all groups until Day 7 with initial peaks followed by a decrease to basal levels. Only LDH release was significantly lower in the 300 µM BR as compared to the control BR (p < 0.05). From Day 7 on, however, values showed a stronger decrease in the 1000 µM BR than in the other groups. Similarly, the production of urea (Figure 4E) showed a distinct, although not significant, decrease from Day 7 in the 1000 µM BR, while both the control BR and the 300 µM BR preserved stable values. The measured ammonia secretion rate showed an initial peak in all groups, and returned to basal values on Day 4 (Figure 4F). At later time-points, both bioreactor groups exposed to the drug differed significantly from the control runs. While the 300 µM BR showed a similar course of ammonia release as the control BR, a drastic increase in ammonia concentration was observed in the 1000 µM BR (p < 0.001).

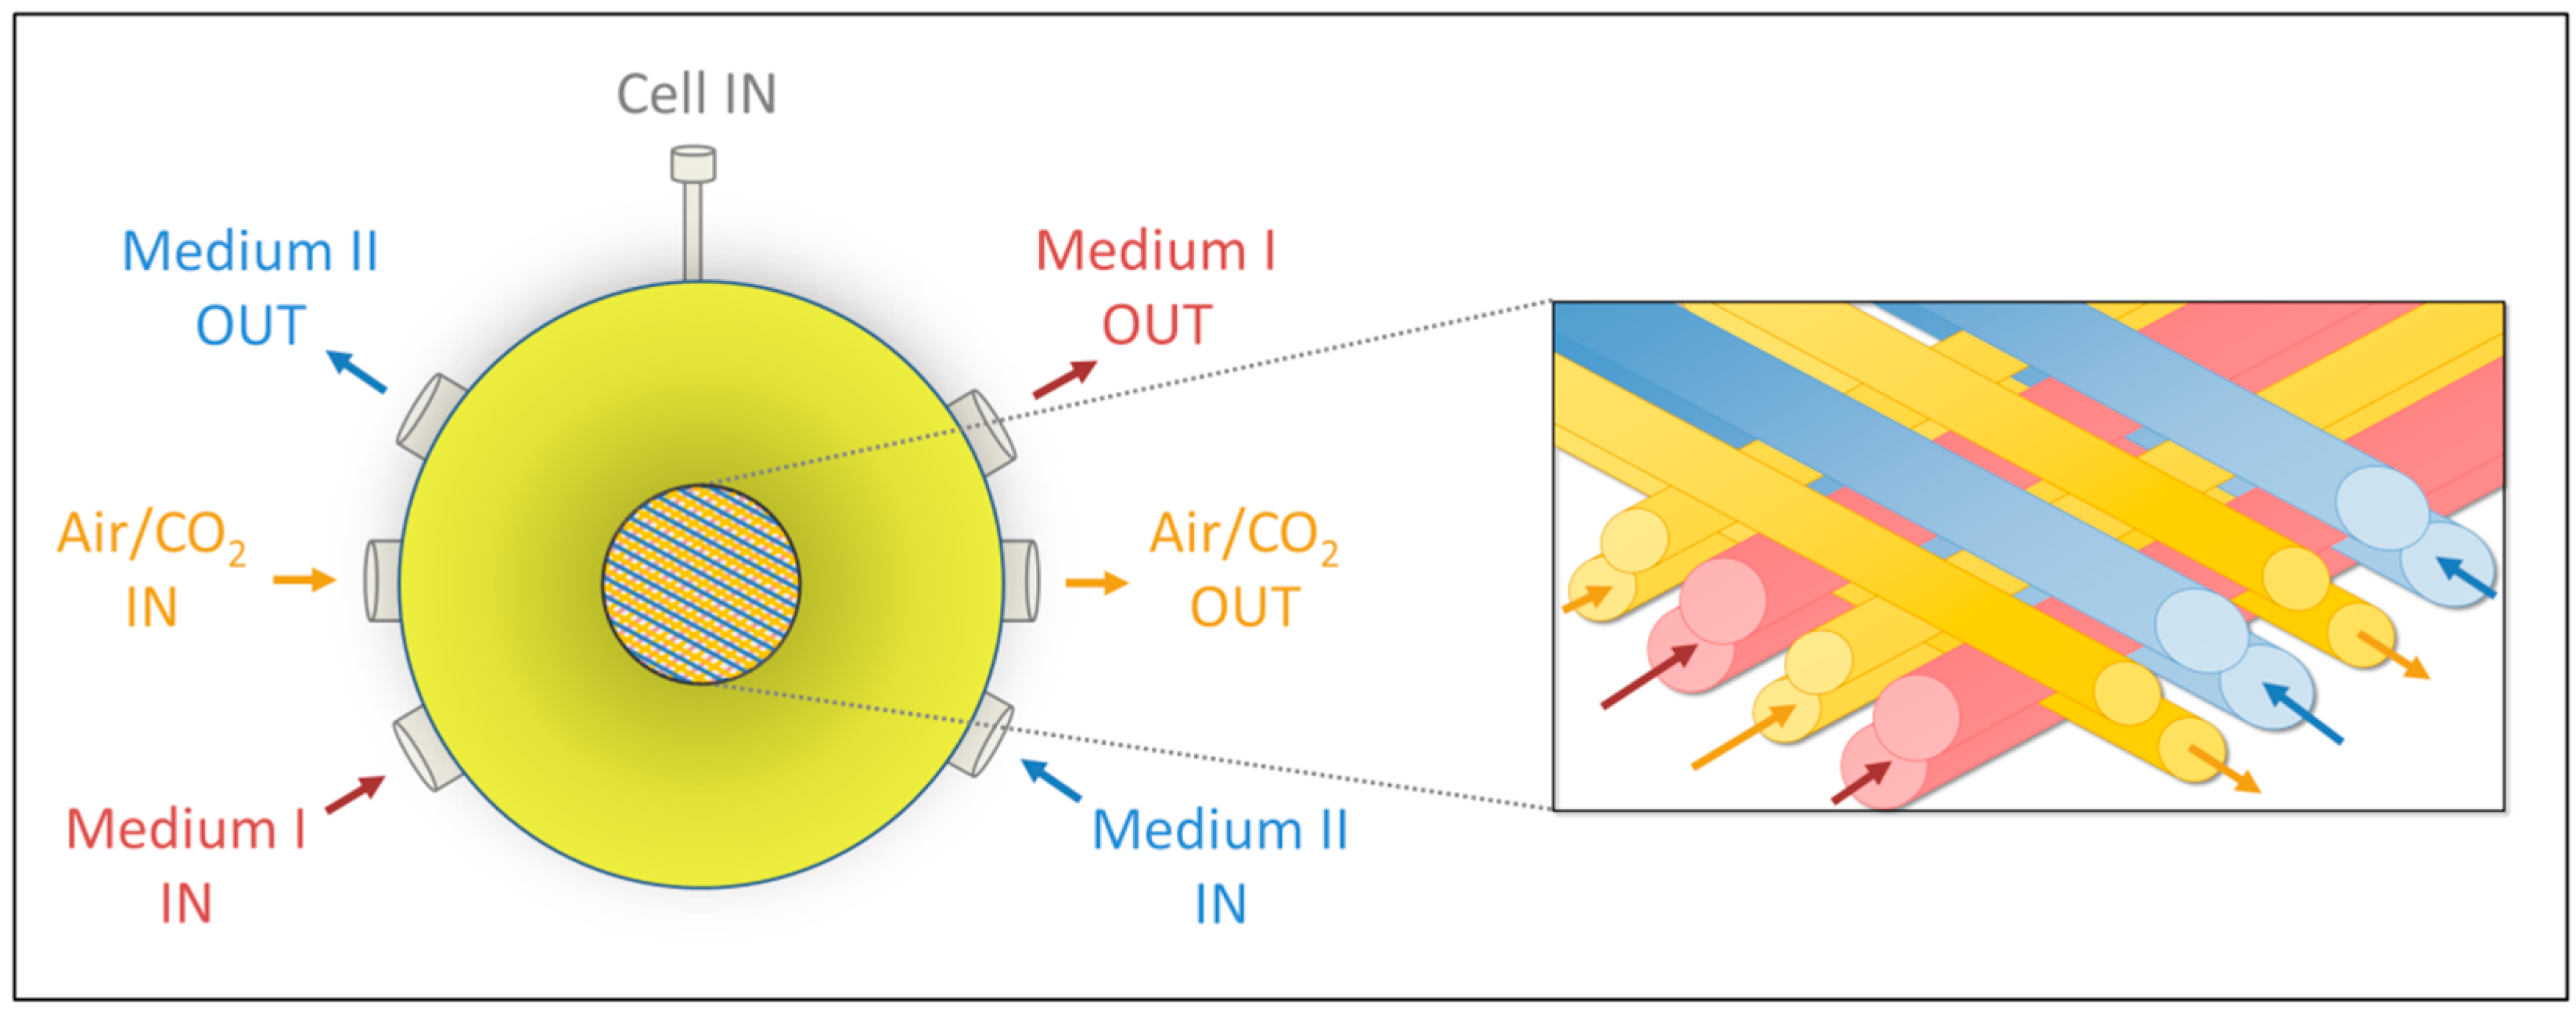
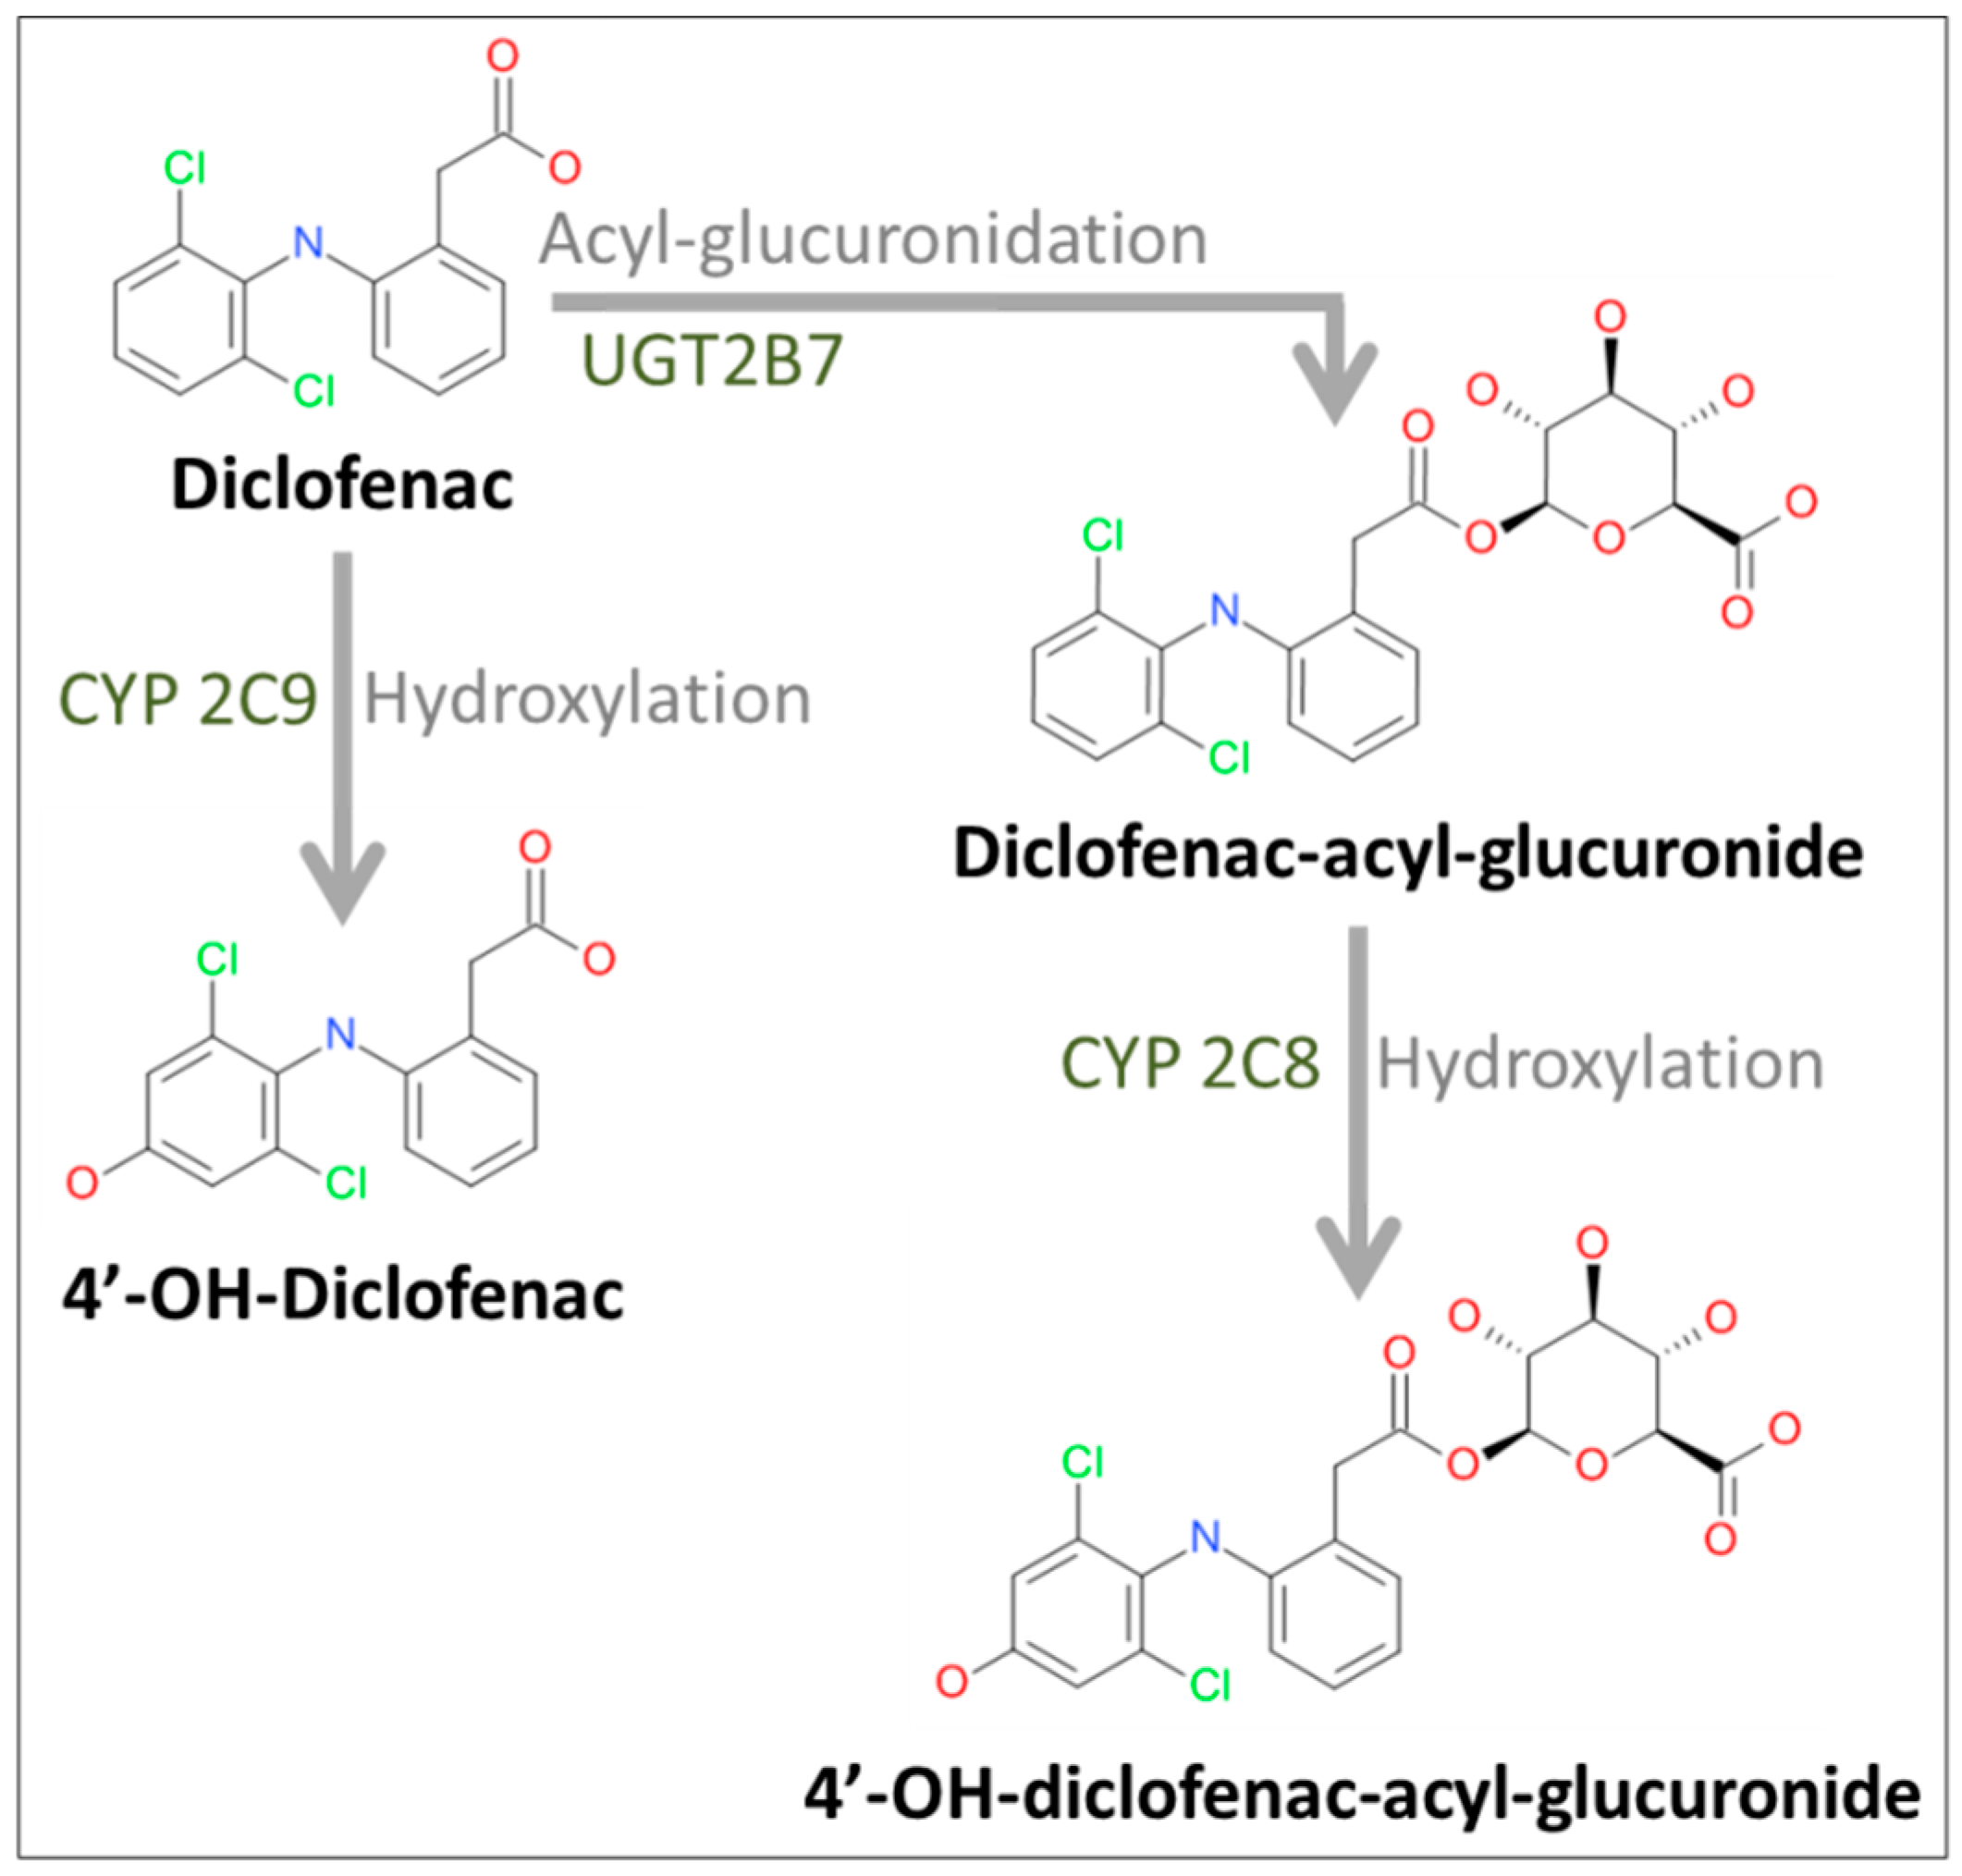
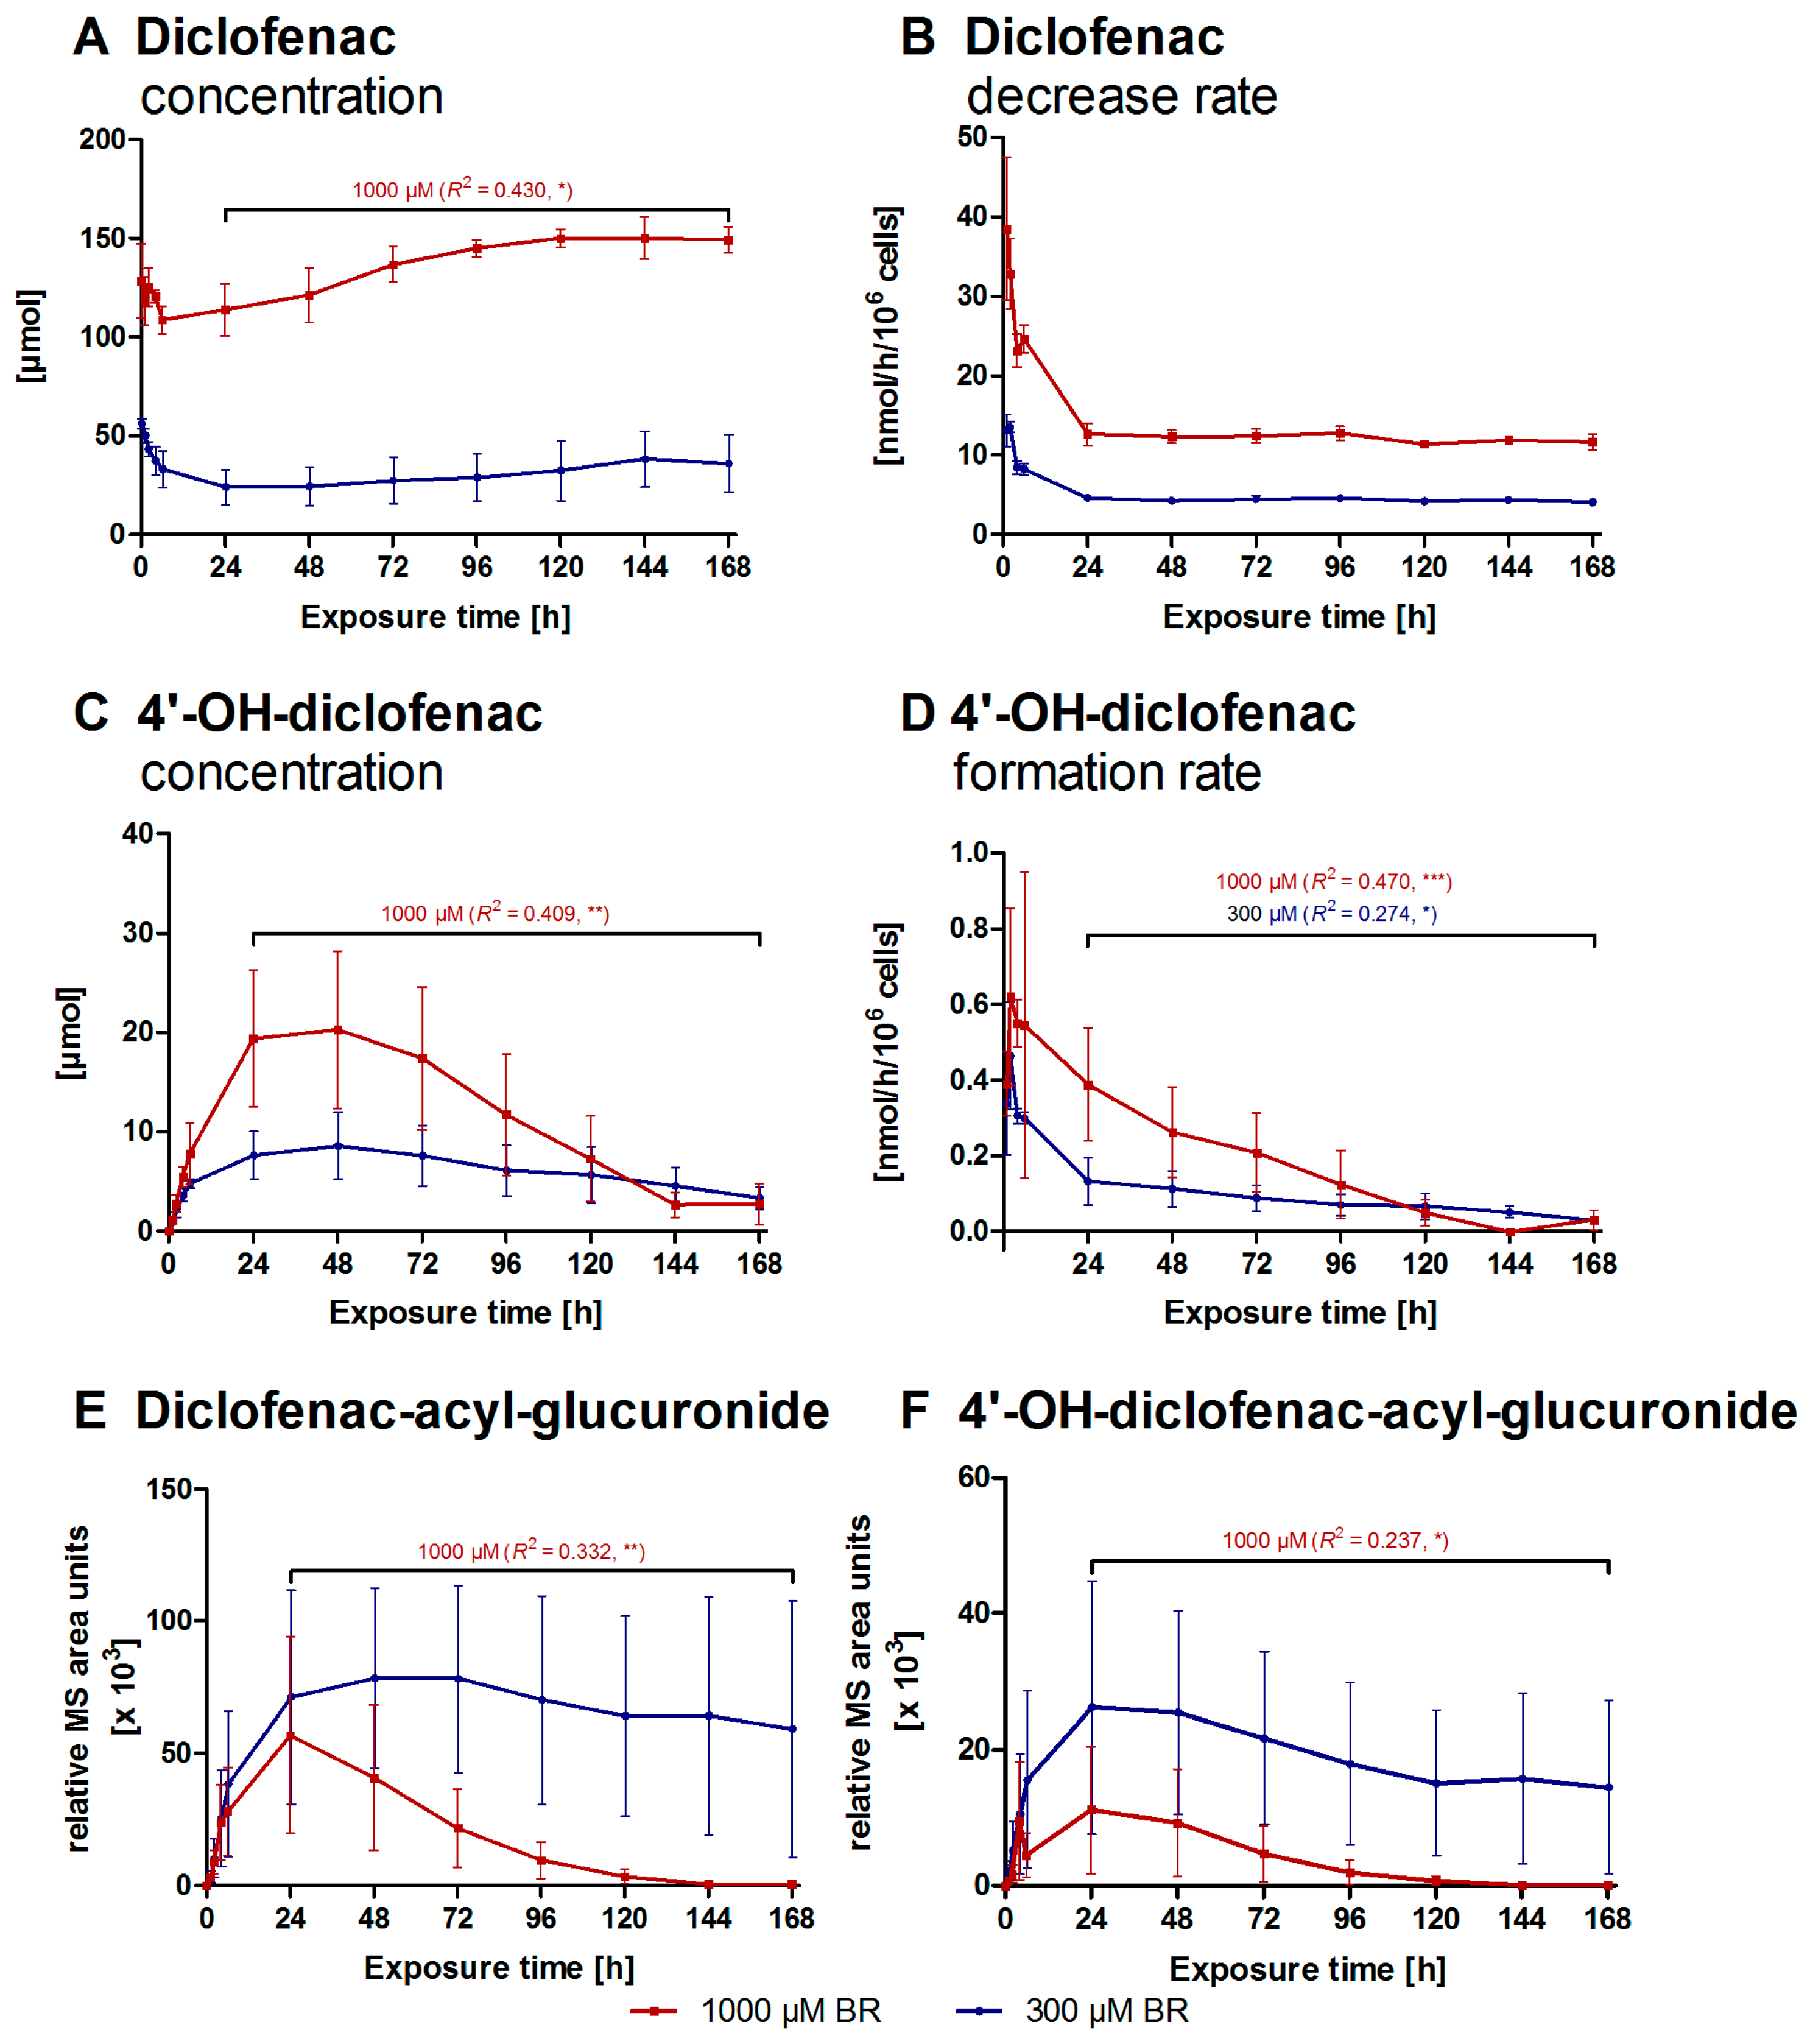
2.2. Formation of Diclofenac Metabolites

Samples for determining the parent drug diclofenac and its metabolites were taken at defined time-points from drug-treated bioreactors in accordance to the sample schedule (see Figure 3). As shown in Figure 5A, an initial diclofenac concentration of 56.3 ± 2.5 µM in the 300 µM BR respectively 128.4 ± 18.7 µM in the 1000 µM BR was measured directly after application to the system (Day 3, 0 h), i.e., in average only 16% of the desired concentration was achieved.
During the first six hours of exposure the concentration of diclofenac decreased rapidly in both groups (Figure 5A). In the 300 µM BR a steady state was maintained between 24 and 96 h of exposure followed by a slow increase. In contrast, a significant increase with a linear regression of R2 = 0.430 (p < 0.05) was observed for the 1000 µM BR. The drug was rapidly eliminated in both groups within the first four hours with an initial elimination rate of 11.7 ± 1.2 (300 µM BR) or 31.5 ± 5.2 nmol/h/106 cells (1000 µM BR), followed by a stable elimination rate of 4.35 ± 0.37 nmol/h/106 cells when applying the lower dose or 12.2 ± 0.8 nmol/h/106 cells in the 1000 µM BR from 24 h to the end of drug exposure on Day 10 (Figure 5B). All investigated diclofenac metabolites could be detected. The concentration of 4′-OH-diclofenac (Figure 5C) was increased initially in all bioreactors with maximum values of 8.56 ± 3.39 µM for the 300 µM BR and 20.3 ± 8.0 µM for the higher dose (1000 µM BR) after 48 h, which was followed by an significant decrease in the concentration in the 1000 µM BR (R2 = 0.409, p < 0.01). As shown in Figure 5D, the formation rate of 4′-OH-diclofenac was lower in the 300 µM BR with a maximum formation rate of 0.46 ± 0.14 nmol/h/106 cells after two hours as compared to the 1000 µM BR with 0.62 ± 0.23 nmol/h/106 cells. Afterwards, a significant decrease was observed in both groups, (300 µM BR: R2 = 0.274, p < 0.05; 1000 µM BR: R2 = 0.470, p < 0.001) reaching similar values after 120 h. Due to the absence of available metabolite reference standards, the formation of diclofenac-acyl-glucuronide (Figure 5E) was determined by mass spectrometry (MS) area units. These showed an increase to a maximum of 78.4 ± 34.1 × 10³ relative MS area units at 48 h in the 300 µM BR and maintained a stable level of approximately 67.1 ± 41.2 × 10³ relative MS area units afterwards. In contrast, the maximal formation of this metabolite in the higher dose bioreactors was already measured at 24 h after starting with diclofenac exposure (56.9 ± 37.1 × 10³ relative MS area units). From Day 4 (24 h), a steep, significant decrease towards nearly zero on Day 8 (120 h) could be detected in the 1000 µM BR (R2 = 0.332, p < 0.01). The formation of 4′-OH-diclofenac-acyl-glucuronide (Figure 5F) showed a comparable time-course in both groups with a maximum amount of 26.2 ± 18.6 × 10³ relative MS area units for the 300 µM BR respectively 11.2 ± 9.3 × 10³ relative MS area units for the 1000 µM BR at Day 4 (24 h) followed by a decrease, which showed statistical significance only in the 1000 µM BR (R2 = 0.237, p < 0.05).

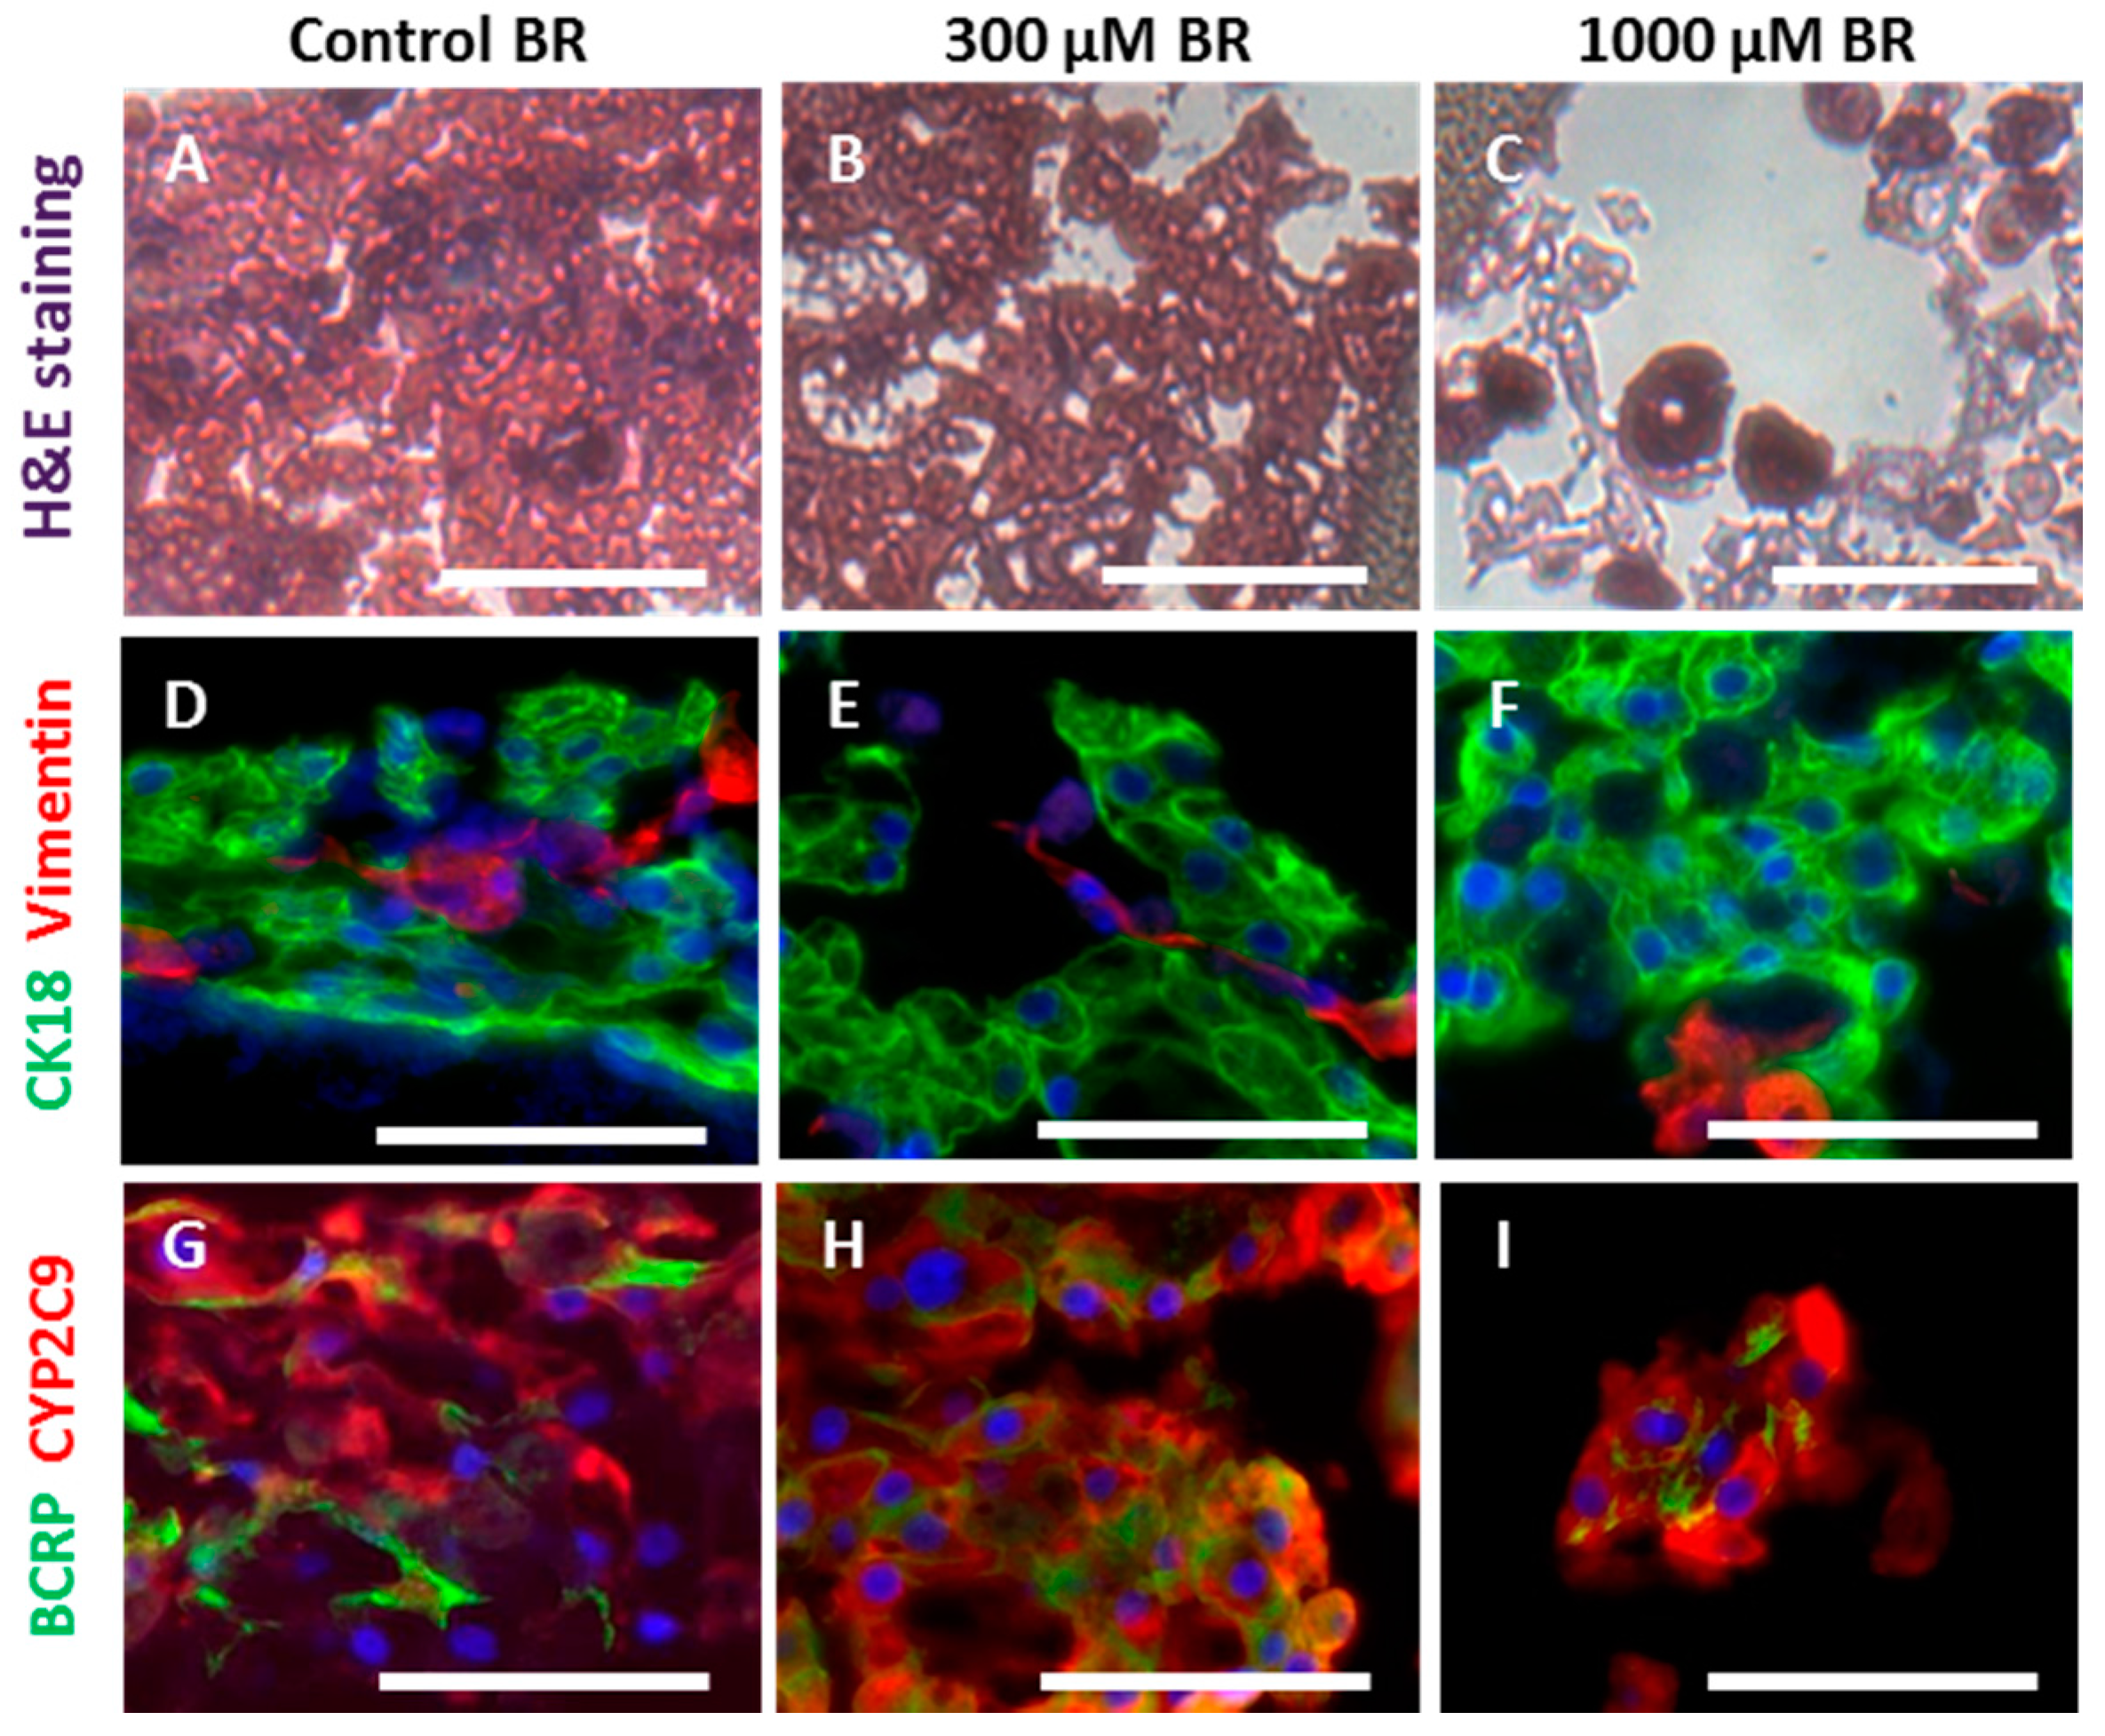
2.3. Cell Morphology and Reorganization in the Bioreactor

The morphologic appearance and reorganization state of hepatocytes and non-parenchymal liver cells within the bioreactor was investigated after 10 days of cultivation with or without diclofenac exposure by means of histological and immunohistochemical analysis (Figure 6).
The hematoxylin and eosin staining (Figure 6A–C) demonstrated a compact network of cell aggregates within the control BR group (Figure 6A), while diclofenac exposure resulted in partial disruption of aggregates, especially in the 1000 µM BR, which showed a high amount of disintegrated cells (Figure 6C). Hepatocytes characterized by the liver epithelial marker cytokeratin 18 (CK18) and non-parenchymal cells showing vimentin immunoreactivity could be observed in all cultures (Figure 6D–F). The non-parenchymal cells were integrated in the parenchymal aggregates and formed strand-like cell linings in both the control BR and the 300 µM BR (Figure 6D,E), while in the 1000 µM BR the cells appeared less organized. All cultures showed positive staining of the diclofenac metabolizing CYP isoform CYP2C9 located in the cytoplasm of the hepatocytes (Figure 6G–I). In addition, the biliary transporter breast cancer resistance protein (BCRP) was clearly visible in plasma membranes of the pHH (Figure 6G–I). Although all markers under investigation could be detected in all bioreactors, the cell density and the reorganization state of the cells were lower in the 1000 µM BR group.

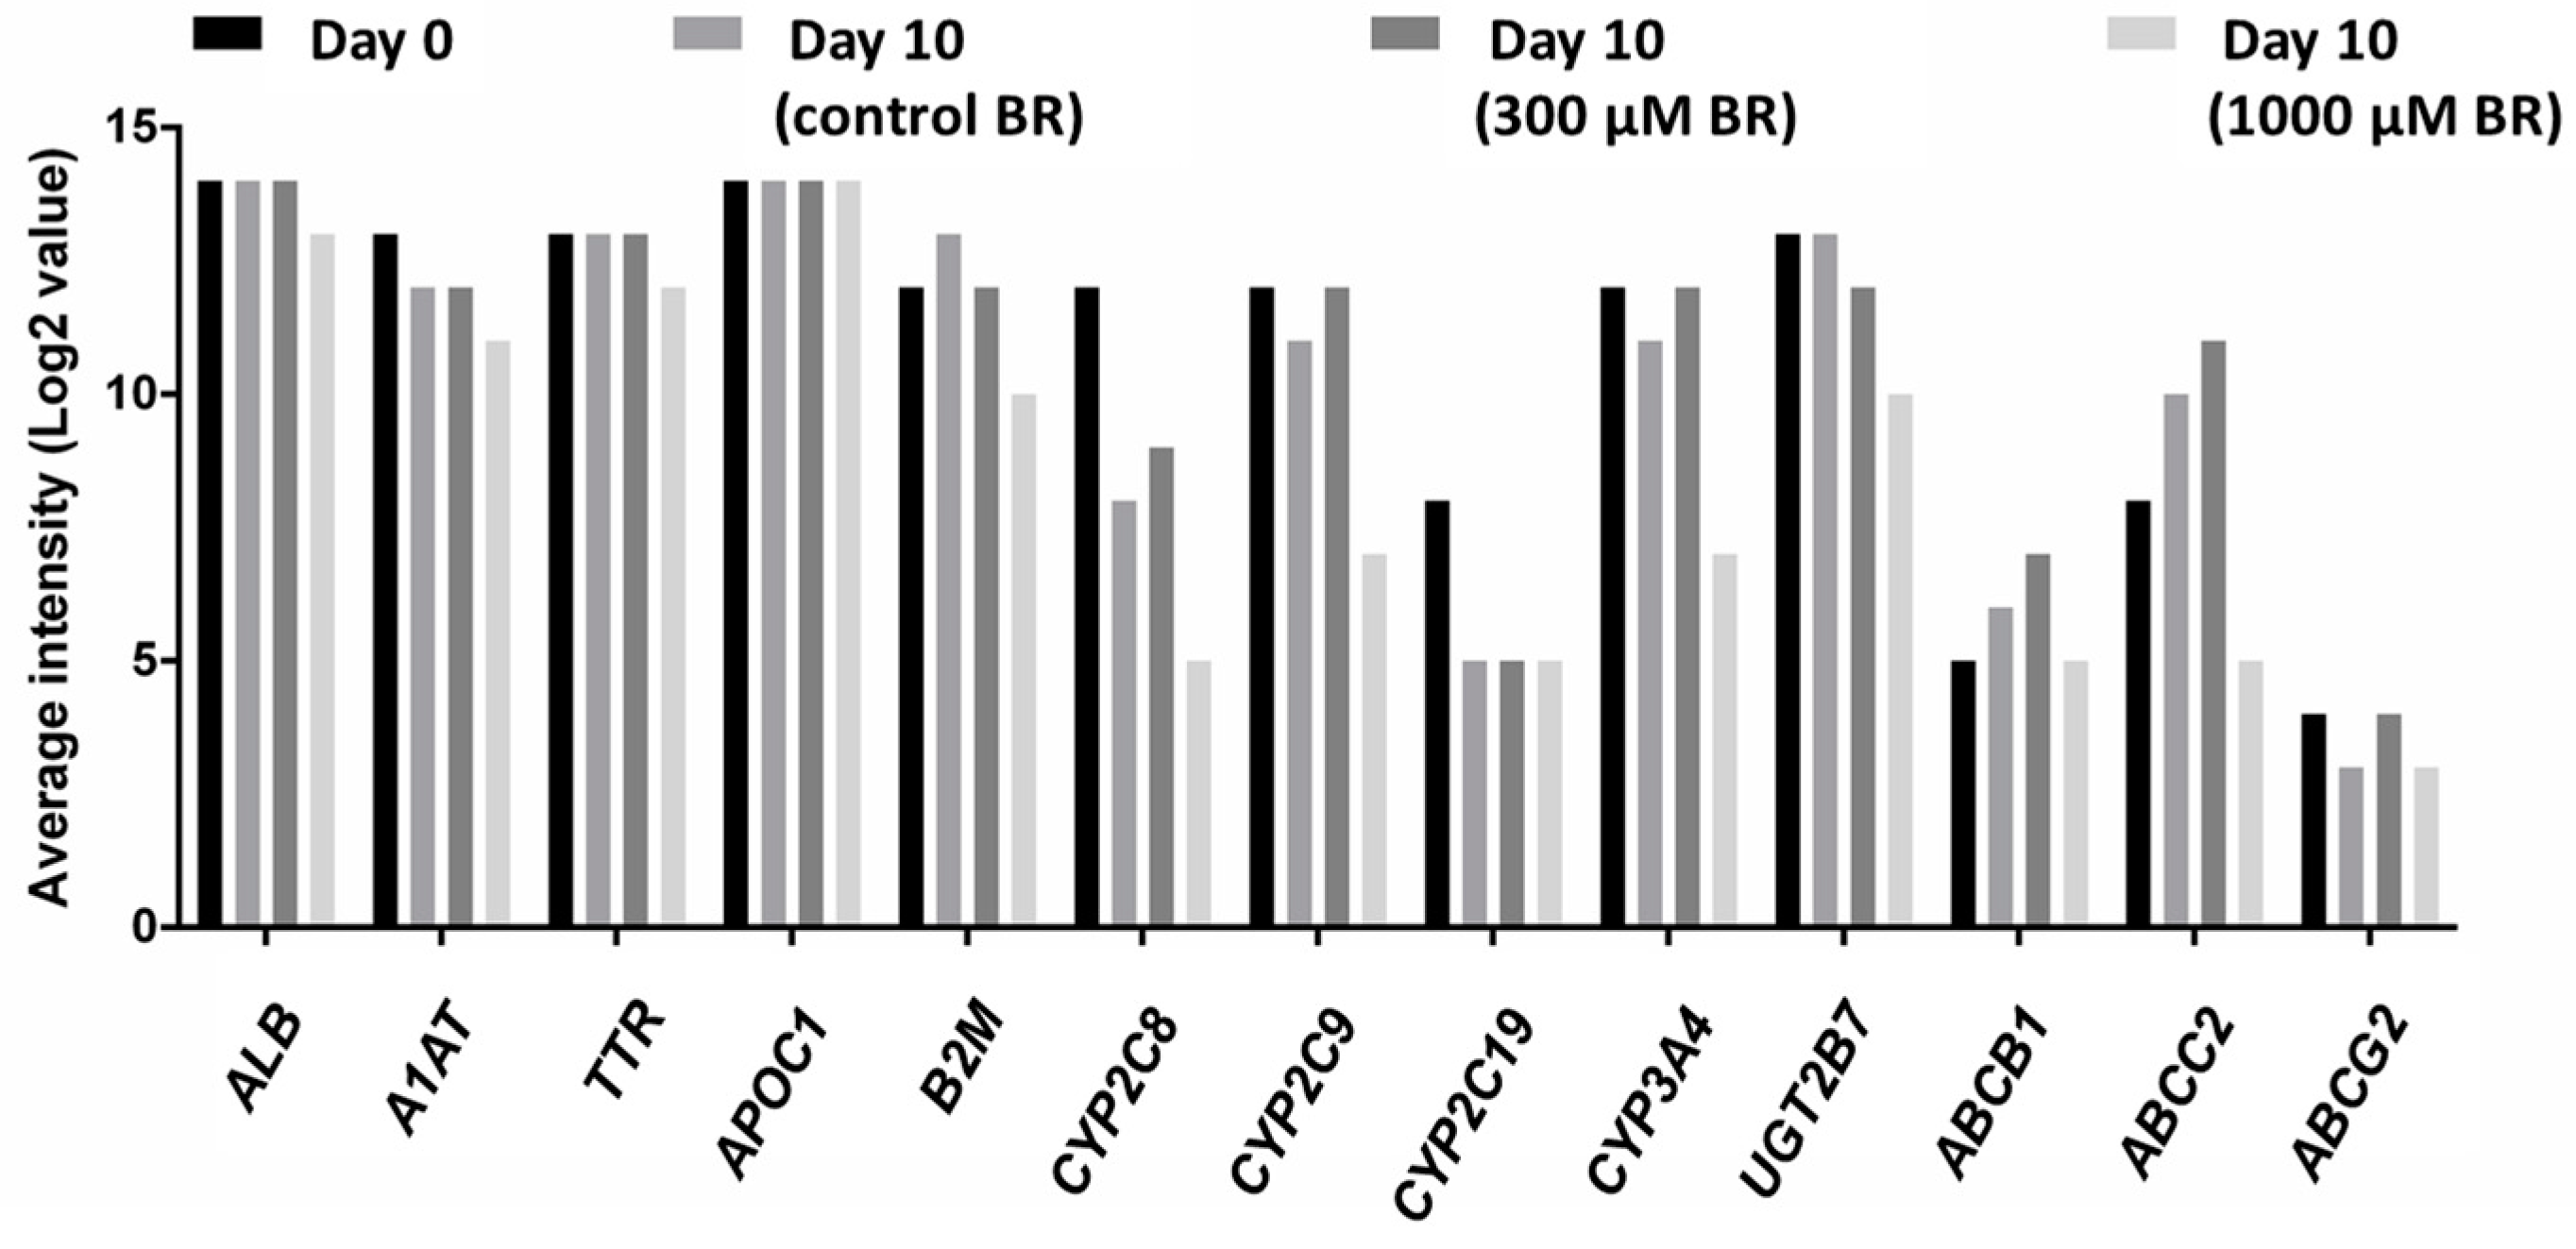
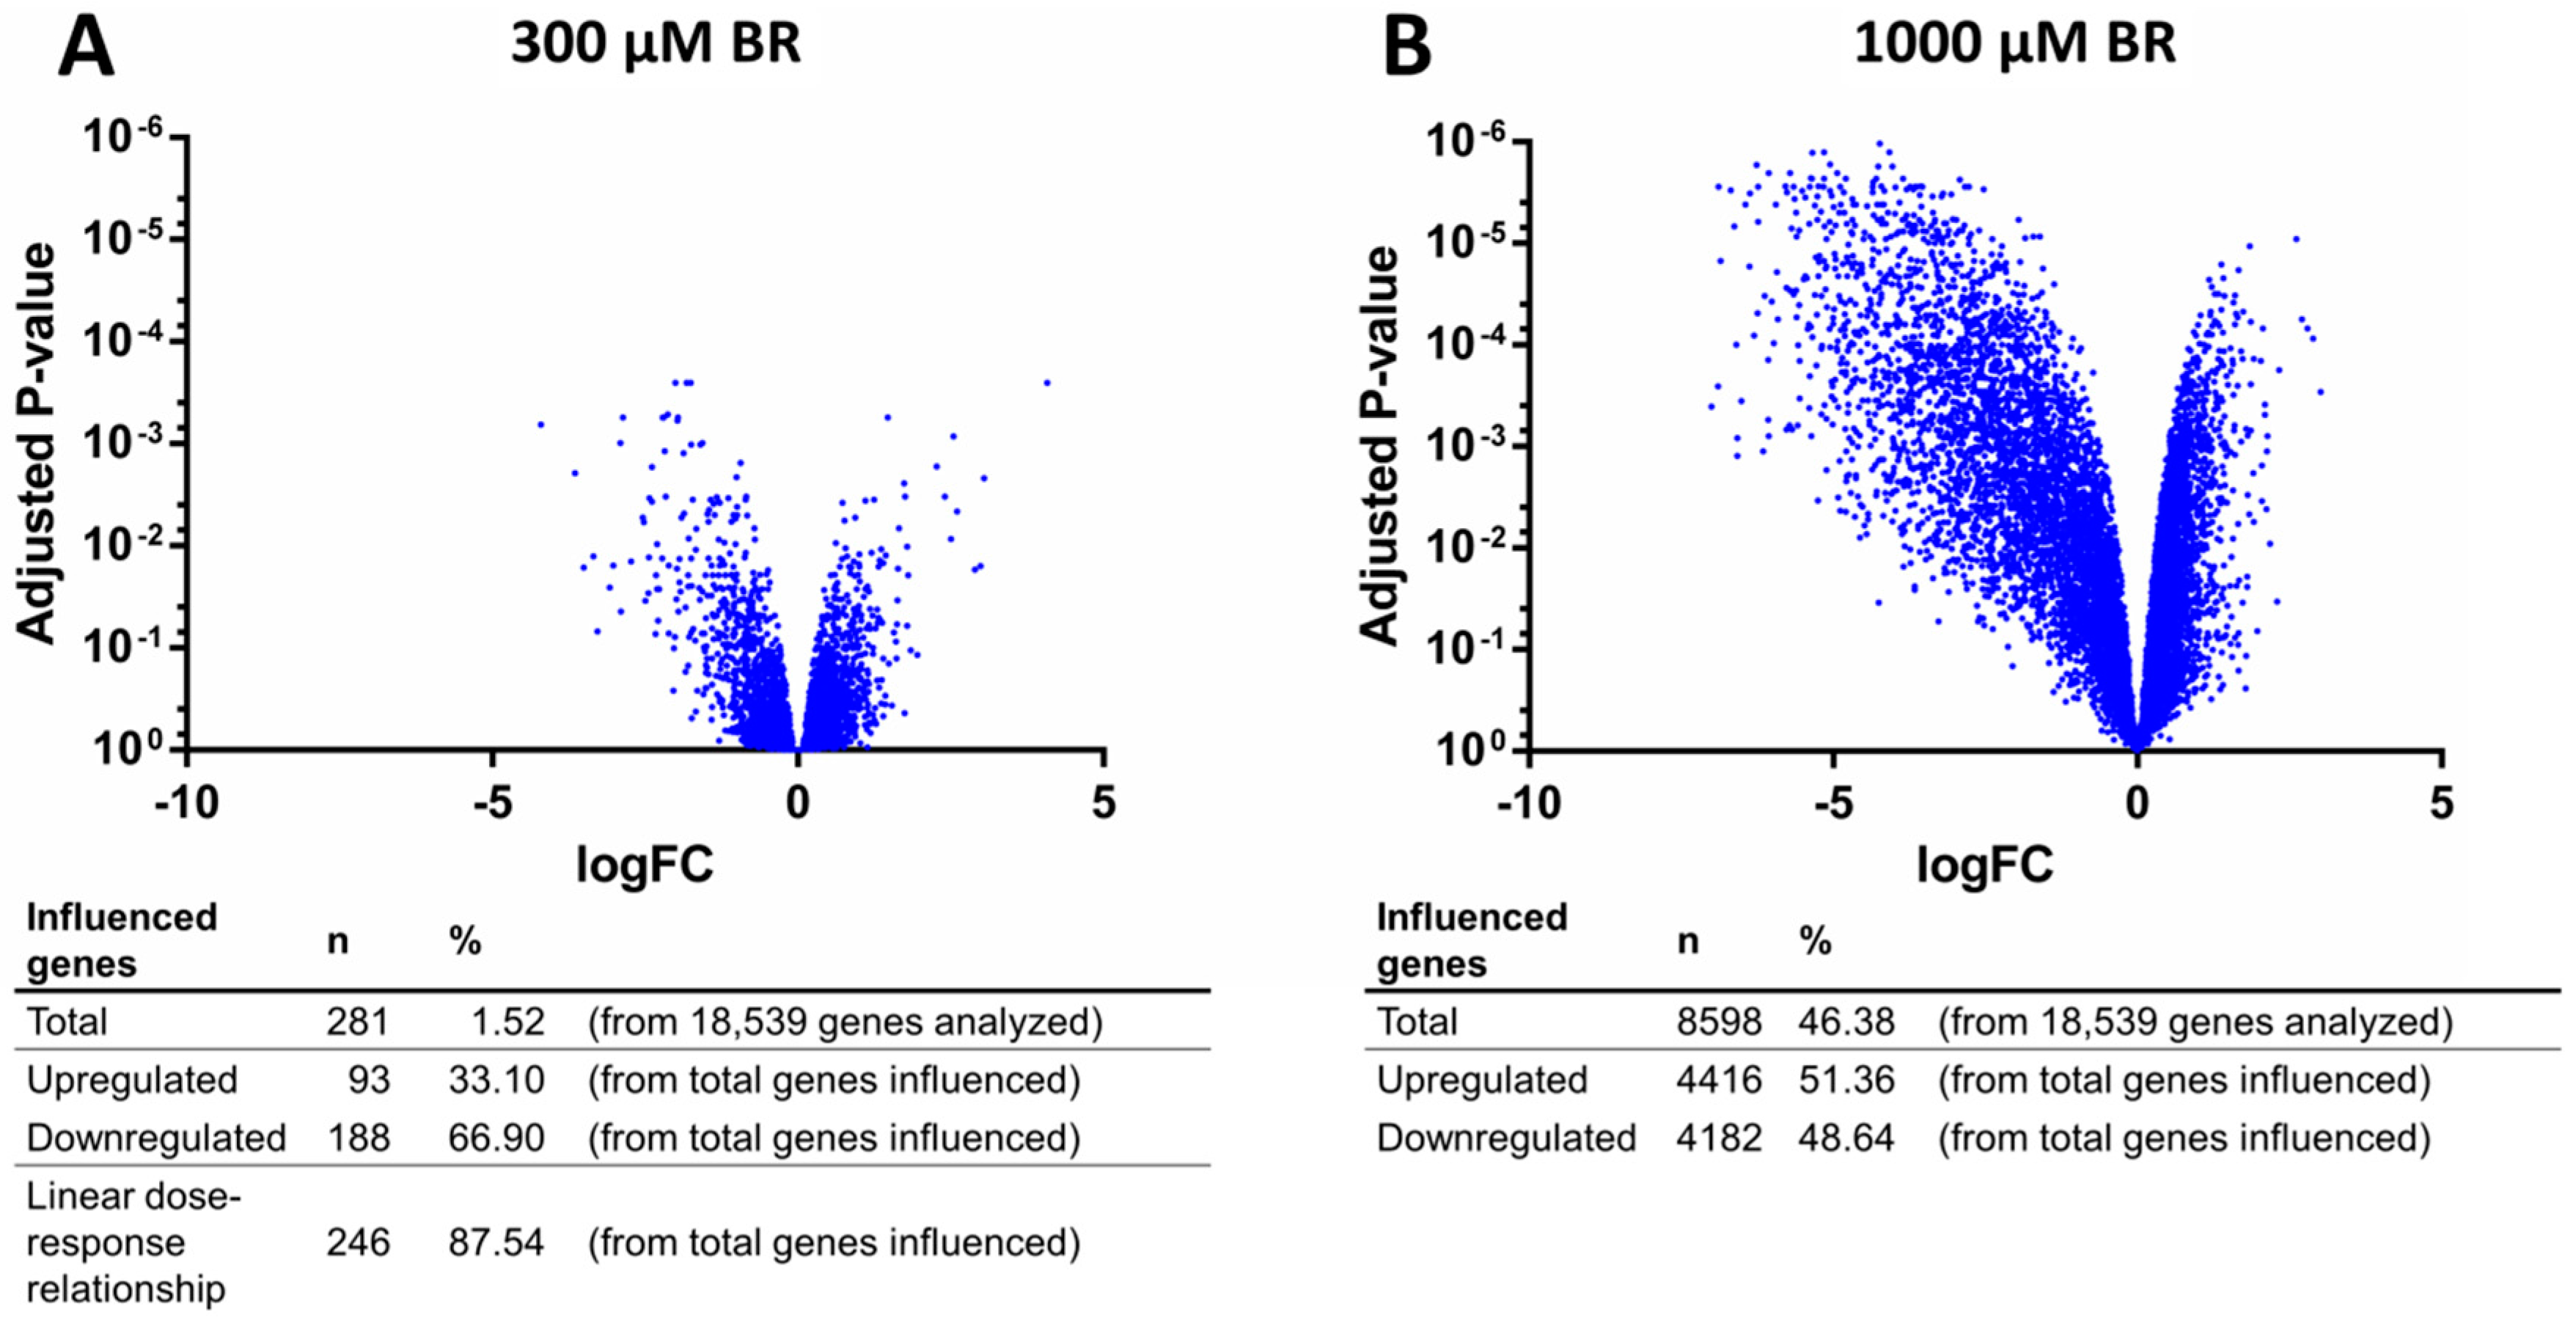
2.4. Analysis of Transcriptomic Data upon Drug Application

At the end of the experiment, total RNA was isolated and whole genome microarray analysis was performed to study specific gene expression profiles. Initial modeling was performed using the donor and dose group as fixed factors to test for possible donor effects. Only genes with an adjusted p-value < 0.05 were considered significant. This analysis highlighted only a modest number of genes, which differed between donors across the tested dose range, i.e., 11 genes or 0.06% of analyzed genes (Table S1). Relative average expression levels of selected basal hepatocyte function markers, and relevant drug metabolizing enzymes and transporters involved in the disposition and excretion of diclofenac are shown in Figure 7. The hepatic phenotype of primary human liver cells, assessed by expression levels of liver-specific marker genes over time, was well maintained in the system for the entire duration of the experiment and displayed good correlation with the expression levels in freshly isolated hepatocytes. Similarly, expression levels of drug metabolizing enzymes known to be important in the metabolism of diclofenac (CYP2C9, CYP3A4, UGT2B7, ATP-binding cassette B1 (ABCB1); ATP-binding cassette C2 (ABCC2), and ATP-binding cassette G2 (ABCG2)) showed a high and stable expression for the entire duration of the experiment, although a pronounced decrease was observed for CYP2C8 and CYP2C19 from Day 0 to 10 after cell inoculation (Figure 7).
Based on the limited inter-donor effects on overall transcription levels, a simplified model was applied to test the effect of diclofenac exposure by using the dose group as a single fixed factor to identify genes differentially affected between the samples tested at a specific dose compared to the control BR. Exposure of the liver cells to diclofenac at concentrations of 300 and 1000 µM resulted in gene expression changes in 281 genes (i.e., 1.52%), and 8598 genes (46.38%), respectively, as compared with the untreated control BR (Figure 8A,B). Whereas transcription in the 300 µM BR was primarily downregulated (188 out of 281 genes downregulated—i.e., 66.90%), in the 1000 µM BR approximately equivalent numbers of upregulated (4416 out of 8598 genes—i.e., 51.36%) and downregulated genes (4182 out of 8598 genes—i.e., 48.64%) were found. Nevertheless, transcriptional downregulation was significantly more pronounced, as evidenced by the strong relative-fold downregulation of the 50 most significantly affected genes in the 1000 µM BR group.
Of note, 246 out of 281 genes that differed significantly between the 300 µM BR and the control BR displayed a linear dose-response relationship resulting in an equivalent or greater relative fold change in expression in the 1000 µM BR (Figure 8A), underscoring the possibility of shared regulation pathways. An overview of the most significantly affected genes in the 300 µM BR and the 1000 µM BR is shown in Tables S2 and S3, respectively. To further study the tentative biological effects of diclofenac-induced transcriptional changes, a pathway analysis was performed based on the Gene Ontology (GO) database. In the 300 µM BR group (Table 1), transcriptional changes induced by diclofenac are mainly linked to various immune processes, including chemokine-related chemotaxis (GO:0002687), chemokine receptor binding (GO:0042379), protein activation cascades (GO:0072376) and regulation of leukocyte migration (GO:0002687). Contrastingly, in the 1000 µM BR (Table 2), the strongest effects on gene transcription were observed in pathways related to basal cell functions including regulation of cellular amino acid metabolic processes (GO:0006521), G1 DNA damage checkpoint proteins (GO:0044783), proteasome complex proteins (GO:0000502), oxidoreductase complex proteins (GO:1990204), and respiratory chain proteins (GO:0070469).
With regard to decreased urea production in the 1000 µM BR, a strong negative regulation for ornithine transcarbamoylase (OTC), mitochondrial carbamoyl-phosphate synthase 1 (CPS1), arginase 1 (ARG1), and argininosuccinate lyase (ASL) could be detected in the 1000 µM BR. Further, significant effects on the expression of cellular sensors of chemically induced oxidative and electrophilic stress nuclear factor (erythroid-derived 2)-like 2/kelch-like ECH-associated protein 1 (NRF2/KEAP1) as well as activating transcription factor 3 (ATF3) and growth differentiation factor 15 (GDF15) was observed in the 1000 µM BR, whereas these genes were not affected in bioreactors exposed to the lower dose of diclofenac. A complete overview of the magnitude of transcriptional changes expressed as the relative fold-changes in gene expression of individual genes is provided in the Table S4.

3. Discussion

Xenobiotics, including drugs, are typically biotransformed in hepatocytes to enhance their renal or biliary excretion. However, the parental drug itself and the formed potential toxic metabolites (i.e., biotoxification) can both lead to hepatotoxicity. Primary human liver cells cultured in a dynamic 3D bioreactor system could be useful to investigate hepatic drug effects in vitro with high predictivity. The data from untreated bioreactors (control BR) indicate a stable performance of the hepatocytes subsequent to an adaption phase of three days. This is in consistence with previous studies showing prolonged preservation of hepatocyte functionality in the 3D bioreactor as compared to 2D cultures [14]. A beneficial effect of co-cultivating pHH and non-parenchymal cells (Kupffer and endothelial cells) was also shown in a 3D human liver tissue model [26], emphasizing the importance of the microarchitecture of the liver to maintain cell viability.
To demonstrate the suitability of the bioreactor system for hepatotoxicity studies, diclofenac was selected as a model drug. The drug was applied at two different doses (300 or 1000 µM) over seven days to the system. Previous toxicity assays performed in conventional 2D cultures showed that these concentrations caused a rapid cell death [23,24]. In line with these previous reports, the present study shows a dose-dependent toxic effect of diclofenac based on combined metabolic data, immunohistochemical and gene expression analysis.
Glucose production and lactate production rates determined in the cultures as parameters of energy metabolism showed distinct differences in the cell response to diclofenac application. Whereas the time-course of glucose production rates over the culture time was similar in all bioreactors, with slightly lower values in the 1000 µM BR, lactate production rates showed a clear dose-dependent influence of drug exposure. In contrast to the control BR, which showed stable lactate production rates throughout the culture period, a significant decrease after diclofenac infusion was detected in both drug-treated groups, with reduction of lactate production by approx. 50% in the 300 µM BR, and nearly complete loss of lactate production in the 1000 µM BR. This might be caused by the alterations of mitochondrial functions induced by diclofenac [27]. The value of these basal metabolism parameters was previously confirmed by Prill et al. [28], who demonstrated the suitability of continuous glucose and lactate monitoring as an evaluation parameter for high-throughput microbioreactors. An additional option for measuring metabolic activities of the cells in the bioreactor can be seen in resazurin-based cell viability assays, like CellTiter-Blue® or alamarBlue®. It was previously shown that the resazurin assay can be repeatedly applied to bioreactor cultures with HepG2 or pHH [29]. However, other studies showed a toxic effect of resazurin upon long-term exposure [30,31], which could impair the effect of diclofenac exposure.
Further, a panel of liver enzymes (AST, ALT, GLDH and LDH) was measured. These enzymes are released upon membrane leakage in case of cell damage and their elevation in plasma is characteristic for liver injury [32,33]. In this study no distinct effects on liver enzyme release of drug application was observed. After a high initial release the rates decreased and reached stable values on a basal level from Day 5 onwards. This is in consistence with results from Wang et al. [34], who found an absence of enzyme release in rat hepatocytes treated with diclofenac in 2D cultures. The high release rates during the initial culture phase can most likely be attributed to cell stress as a consequence resulting from cell isolation. Liberation of large amounts of enzymes can result in an exhaustion of enzyme stores preventing further increase upon drug application. Only LDH release was significantly different between the 300 µM BR and the control BR, with lower levels for the 300 µM BR. This can be interpreted as a sign of a stabilizing metabolism with production of LDH under control conditions.
Active nitrogen elimination by the hepatocytes via deamination is indicated by stable urea production rates in the control BR and in the 300 µM BR. In contrast, urea production decreased over time in the 1000 µM BR demonstrating the harmful effect on cell metabolism of higher concentrations of diclofenac. This is in accordance with findings of Borlak et al. [35], who recently suggested urea as a robust marker to predict hepatocellular stress during in vitro preclinical studies. The disturbed detoxification of nitrogen is confirmed by the significant increase of the ammonia release observed in the 1000 µM BR with values elevated by five-fold compared to the control BR. The accumulation of the toxic base ammonia can further contribute to cell death upon toxic drug exposure. Thus, the results from biochemical parameters indicate that lactate production rate as a marker for energy metabolism and ammonia release in combination with the urea production rate as markers for nitrogen metabolism provide useful markers for evaluation of the cell response to toxic drug exposure.
Single application of diclofenac at a therapeutic dose of 75 mg leads to a maximum plasma concentration of 6.4 µM diclofenac [36]. In clinical reports hepatotoxicity of diclofenac was observed in some patients at a daily dose in the range of 75–200 mg applied over weeks to months [37,38,39]. In vitro concentrations tested with respect to hepatotoxicity range between 10 and 1000 µM, with a toxic effect of diclofenac being detected at concentrations between 180 and 1000 µM upon 24 h of exposure [23,24,25,26]. Messner et al. [26] reported an IC50 value of 178.6 µM after diclofenac treatment of liver microtissues over 14 days, while Bort et al. [23] and Lauer et al. [25] observed higher values, with an IC50 of 331 ± 7 µM and a TC50 of 222 ± 142 µM, respectively, which is in the range of the dose of 300 µM used in the present study. However, the direct comparison of data from different studies is difficult due to differences in the culture system, culture condition and assays applied for assessment of toxicity. In addition, potential adsorption processes to culture materials may influence the free concentration of drugs applied. This assumption is supported by the fact that the free diclofenac levels measured directly after application to the bioreactor system (Day 3, 0 h) amounted only to 15% of the expected concentration. Thus, the results indicate a significant loss of the substance in the system, probably due to drug adsorption to the capillary membranes of the bioreactor and/or binding to membrane-bound and soluble proteins [17].
After an initial decrease of the free diclofenac concentration in both bioreactors the free diclofenac concentration increased rapidly in the 1000 µM BR towards the starting concentration. In contrast, nearly constant conversion of diclofenac was observed in the 300 µM BR until the end of culture, amounting to around 60% of the initial drug concentration. The finding that the observed increase is more pronounced in the 1000 µM BR than in the 300 µM BR indicates an impaired cell metabolism in association with a decreased conversion of diclofenac, in addition to potential adsorption processes. While all metabolites under investigation could be detected in the culture perfusates, the time-course of metabolites showed a different behavior in 300 or 1000 µM BR. Time-courses of 4′-OH-diclofenac indicate that pHH in bioreactors actively metabolized diclofenac via CYP2C9 dependent oxidation, since a clear dose-dependent formation rate was detected with much higher values in the 1000 µM BR. This finding is consistent with observed metabolite profiles of excretory pathways in humans, indicating that the in vivo clearance in humans is with around 50% mainly based on the oxidative metabolism [16]. The primary metabolite 4′-OH-diclofenac can be further oxidized resulting in an electrophilic quinone imine, which may influence the redox cycling of the cells, produce oxidative stress and can covalently bind to various molecules because of its thiol reactivity [17]. As a consequence, disruption of the balance of cell metabolism can occur. Thus, the continuous decrease of 4′-OH-diclofenac formation observed in the 1000 µM BR may partly be caused by toxic effects of the secondary quinone imine product. Since covalent protein binding was not assessed in the current study, it cannot be confirmed that this proposed mechanism was indeed a contributing factor to the observed toxic effects of diclofenac in the bioreactor system. The formation of diclofenac-acyl-glucuronides and 4′-OH-diclofenac-acyl-glucuronides catalyzed by UGT2B7 and CYP2C8, respectively, showed a similar relatively stable time-course at the lower dose application, and a distinct decrease in the 1000 µM BR, confirming the toxic effect of high concentrations of diclofenac and its metabolites on the activities of drug metabolizing enzymes. Due to their labile ester bond acyl-glucuronides are capable of covalent binding to proteins, reducing their function [40] or even result in immune-mediated destruction of hepatocytes [41]. The high standard deviations especially in the results of diclofenac biotransformation could be potentially resulting from inter-donor variances in enzyme activities, e.g., CYP2C9 activity [42]. While such variances make the statistical evaluation of data from pHH difficult, they also provide the option to reproduce the range of functions and enzyme expression in different patients [2]. In contrast, hepatic cell lines like HepG2 display a reduced expression of CYP enzymes [43], which may impair the hepatotoxic response as previously shown by Rodrigues et al. [44].
Histological and immunohistochemical studies performed after 10 days of cultivation showed tissue-like aggregates of pHH with strand-like cell linings of non-parenchymal cells, confirming supportive conditions for liver cell reorganization in the bioreactor system. In addition, CYP2C9, which is mainly responsible for diclofenac metabolism [17], and also the transporter of the parent drug, namely BCRP [45], were well-preserved in bioreactors after cultivation. This physiological in vitro representation of in vivo liver tissue with a heterogeneous cell population made of parenchymal and non-parenchymal cells is important for clinical-relevant hepatotoxicity testing. It has been shown that the activation of inflammatory cells can enhance DILI [46]. In another study, a protective effect of cell populations like Kupffer cells against drug exposure was observed [47].
Stable preservation of hepatic markers in the bioreactor system was confirmed by microarray analyses showing that the hepatic phenotype of donor cells, assessed by expression levels of liver-specific marker genes (including albumin, α-1-antitrypsin, transthyretin, apolipoprotein C-I and β-2-microglobulin), was well-maintained in the system for the entire duration of the experiment and correlated to the expression levels in freshly isolated liver cells, in accordance with previous studies [14,15]. This is a major advantage over conventional 2D cultivation where a rapid and marked decrease of gene expression encoding for CYP was observed as compared to those expressed in freshly isolated human hepatocytes [4]. To further identify differential effects of diclofenac dose on overall cell function in the bioreactor system, a transcriptomics analysis was performed. Although distinct differences could be detected between control bioreactors and bioreactors exposed to increasing doses of diclofenac, it should be noted, however, that the current study may lack a bona fide time-dose response relation to allow lege artis delineation of potential mechanistic pathways underlying diclofenac toxicity in hepatocytes, and thus these data should be interpreted with caution. After seven days of continuous exposure to diclofenac, cells in the 300 µM BR displayed transcriptional changes in various immune processes, emphasizing the possible role of immune-mediated toxicity in the development of diclofenac induced liver injury [17]. In contrast, in the 1000 µM BR a broad range of basal cell function pathways displayed strong dysregulation (including G1 DNA damage checkpoint proteins, mitochondrial respiratory chain enzymes, and proteasome function), which likely reflects the overall toxic insult of long term exposure. Although these observed changes may likely not be relevant readouts for the initiating effects of diclofenac during initial exposure, the strong observed dose-dependent changes in the canonical toxicity pathways associated with diclofenac do indeed support a faithful representation of previously published pathways involved in the perfused 3D bioreactors [48].
These observations are also corroborated by Zhang et al. [49] who recently reported the use of the TG-GATES database to identify a set of four marker genes (early growth response protein 1 (EGR1), ATF3, GDF15 and fibroblast growth factor 21 (FGF21)) with the potential to serve as biomarkers for prediction of liver toxicity. In line with Zhang et al. [48,50], a pronounced transcriptional effect for ATF3 and GDF15 was observed in the 1000 µM BR, whereas these genes were not changed in the 300 µM group. Similarly, a distinct change in the expression of NRF2/KEAP1 was detected, which is in line with studies on HepG2 cells showing that oxidative stress and cytokine signaling based on the activation of the transcription factor NRF2 arise as a result of adverse drug reaction.

4. Materials and Methods

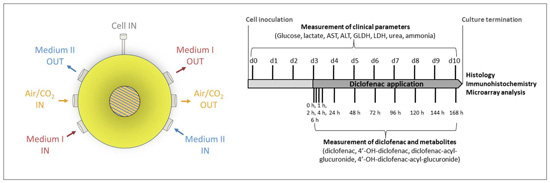
4.1. Bioreactor Technology

The used multi-compartment bioreactor consists of three independent but interwoven hollow-fiber capillary systems: two counter-currently perfused medium compartments and one gas compartment that serves for decentralized oxygenation (Figure 1). The cells are located in the fourth compartment, the space formed by the capillary network. A detailed description of the technology can be found elsewhere [15]. In modification of the previously described bioreactor model the bioreactor used in this study contains four capillary layers instead of two layers resulting in a cell compartment volume of 0.5 mL. After connection to a sterile tubing system, the bioreactors were operated in a perfusion device enabling the regulation of medium flow rates and temperature. An integrated electronically operated gas-mixing unit was used for the control of air and CO2-flow rates. Bioreactors, tubing systems and perfusion devices were manufactured by Stem Cell Systems, Berlin, Germany.

4.2. Isolation of Primary Human Liver Cells

Primary human liver cells were isolated from resected liver tissue from partial hepatectomies with written consent of the patients. The study was conducted in accordance with the Declaration of Helsinki, and the protocol was approved by the Ethics Committee of Charité—Universitätsmedizin Berlin (approval dated 11 April 2013; Project identification code: European Union’s Seventh Framework Programme (FP7/2007-2013EU)). Cell isolation was performed using a two-step collagenase perfusion technique [51] with modifications as described by Pfeiffer et al. [52]. Three cell preparations from individual donors with a viability between 79% and 84% were included in this study.

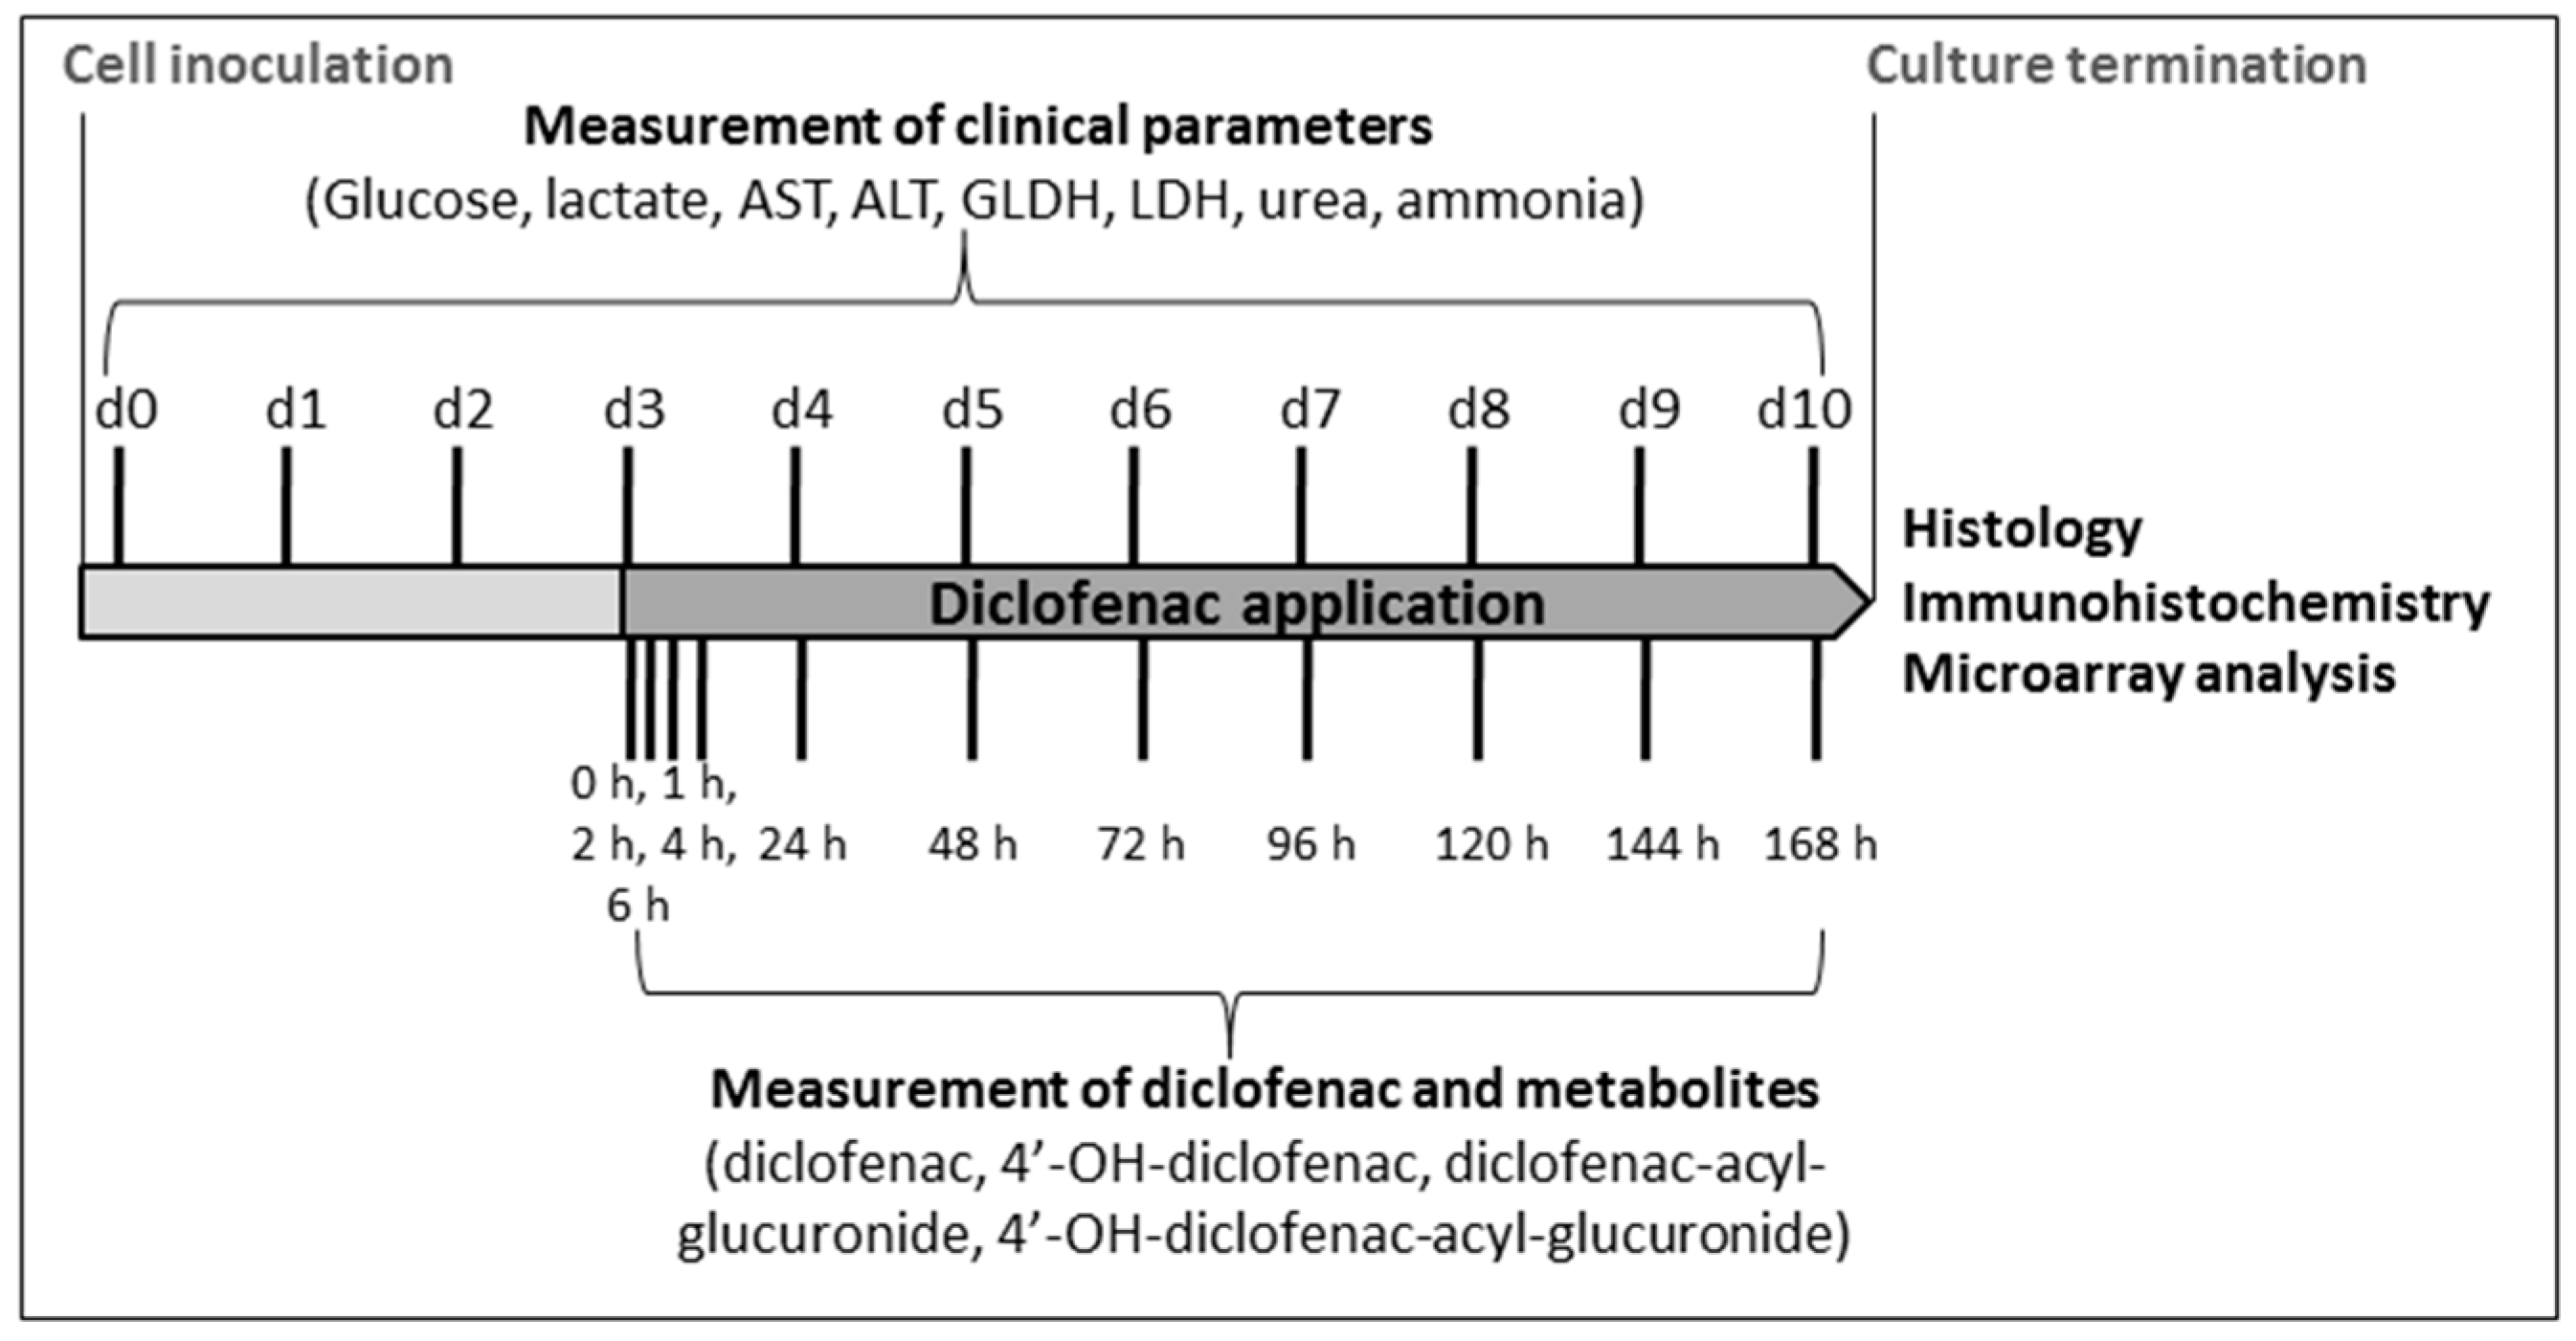
4.3. 3D Culture of Primary Human Liver Cells

At least 24 h prior to cell inoculation the bioreactors and connected tubing systems (total system volume: 14 mL) were filled with liver cell culture medium (Heparmed Vito143, Biochrom, Berlin, Germany). The culture medium was supplemented with 20 IU/L insulin, 5 mg/L transferrin, 3 mg/L glucagon, 100,000 U/L penicillin, and 100 mg/L streptomycin (all Biochrom) before use. A number of 4 × 10⁷ total cells from each cell preparation were suspended in up to 4 mL culture medium and inoculated into three parallel bioreactors. The perfusion parameters were set to 3 mL/min for the recirculation flow rate, 0.5 mL/h for the fresh medium flow rate and 5 mL/min for the gas flow rate. The pH value was measured on a daily basis or more frequently, if needed, with a clinical analyzer (ABL 700, Radiometer, Copenhagen, Denmark) and kept between 7.35 and 7.45 by varying the amount of CO2 in the range of 4% and 5.5%. The bioreactors were maintained at 37 °C over 10 days. On Day 3 of culture, the drug-free culture medium was exchanged with culture medium containing 300 µM (300 µM BR) or 1000 µM (1000 µM BR) diclofenac sodium salt (Sigma-Aldrich, St. Louis, MO, USA). The perfusion with diclofenac-containing medium was continued until the end of the culture period on Day 10. The third bioreactor (control BR), a non-treated control, was flushed as well and run in parallel without continuous diclofenac exposure.

4.4. Analysis of Clinical Parameters

For determination of the metabolic activity of the cells, samples from culture perfusates (for measurement of glucose, lactate, urea and enzyme release) or from the medium outlet (for ammonia measurement) were taken daily according to the time schedule shown in Figure 2. Measurements of glucose and lactate concentrations were performed with a blood gas analyzer (ABL 700, Radiometer). Urea and ammonia concentrations, as well as enzyme activities of AST, ALT, LDH and GLDH were determined with an automated clinical chemistry analyzer (Cobas® 8000, Roche Diagnostics GmbH, Mannheim, Germany). The calculation of daily production or release rates was performed on the basis of the total system volume and feed rate as described by Hoffmann et al. [14].

4.5. Analysis of Diclofenac and Its Metabolites

Following diclofenac application on culture Day 3, samples from the culture perfusates were taken at 0, 1, 2, 4, 6, 24, 48, 72, 96, 120, 144 and 168 h according to the time schedule shown in Figure 3 for quantification of the parent drug (diclofenac) and formed metabolites (4′-OH-diclofenac, diclofenac-acyl-glucuronide, and 4′-OH-diclofenac-acyl-glucuronide) by liquid chromatography-mass spectrometry/mass spectrometry (LC-MS/MS). Medium probes were mixed in a 1:1 ratio (v:v) either with dimethyl sulfoxide ((DMSO), Carl Roth, Karlsruhe, Germany) for analysis of 4′-OH-diclofenac or with DMSO containing 10% formic acid (Sigma-Aldrich) for analysis of acyl-glucuronide. Subsequently, samples were snap-frozen and stored at −80 °C until further analysis. Samples were injected using acetonitrile and ultrapure water as organic and aqueous mobile phases, respectively. Both mobile phases were fortified with 0.1% (v:v) formic acid. Separation was carried out using an Acquity UPLC column (BEH C18 (1.7 µm) 50 × 2.1 mm ID, column temperature = 50 °C) and eluted fractions were directly passed through a Xevo TQ-S tandem mass spectrometer (Waters Corp., Milford, MA, USA) operated in negative electrospray ionization mode. Acquired data were processed with Thermo Xcaliber software (Thermo Scientific, Waltham, MA, USA).

4.6. Histology and Immunohistochemistry

Upon termination of bioreactor cultures on Day 10 of culture, bioreactors were opened and sections of the capillary bed containing the cell material were taken. Samples were fixed in 4% formalin solution (Herbeta Arzneimittel, Berlin, Germany), dehydrated and embedded in paraffin. Slides of 2.5-µM thickness were deparaffinized and rehydrated. For histological analysis slides were shortly rinsed with distilled water, incubated for 20 min with Harris’ hematoxylin solution (Sigma-Aldrich), rinsed 3 min under running tap water and incubated for 2 min in eosin solution (Carl Roth). Finally slides were dehydrated and fixed. For immunohistochemistry, initial antigen retrieval was performed by incubation with 0.1 M citrate buffer in a pressure cooker for 15 min, followed by incubation of slides with blocking buffer (phosphate buffered saline (PBS; Life Technologies, Carlsbad, CA, USA) with 2% fetal calf serum (PAA, Pasching, Austria) and 2.5% bovine serum albumin (Sigma-Aldrich) for 1 h at room temperature. Subsequently the sections were incubated for 1 h with primary antibodies (1:100 dilution), followed by 1 h incubation with the secondary antibodies (1:1000 dilution). Monoclonal mouse antibodies against CK18 (ab668, Abcam, Cambridge, UK) or BCRP (ab3380, Abcam), and polyclonal rabbit antibodies against vimentin (sc-5565, Santa Cruz, Santa Cruz, CA, USA) or CYP2C9 (PAP091, Nosan, Yokohama, Japan) were used as primary antibodies. As secondary antibodies, fluorochrome-coupled anti-mouse IgG 488 (A11029; Life Technologies) and anti-rabbit IgG 594 (A11037; Life Technologies) were used. Counterstaining of nuclei was performed using bisbenzimide H 33342 trihydrochloride ((Hoechst 33342); Sigma-Aldrich).

4.7. Microarray Analysis

RNA was isolated from the freshly isolated human liver cells used for inoculation of the bioreactors on Day 0 and from bioreactor cultures after termination of the cultures on Day 10. The isolation was performed using RLT buffer (Qiagen, Hilden, Germany) with 1% 2-Mercaptoethanol (Sigma-Aldrich) in conjunction with the RNeasy mini kit (Qiagen). Next, cDNA targets were prepared and labeled using the IVT express kit and then hybridized on an Affymetrix® Human Genome U219 array plate in the GeneTitan® instrument (Affymetrix, Santa Clara, CA, USA) according to the manufacturer’s protocol. Gene expression microarray analysis of all time-points was performed using the Bioconductor package version 2.12 (working with R version 3.0.1, [53]). Grouping of the individual probes into gene-specific probe sets was based on Entrez Gene using the metadata package hgu219hsentrezg (cdf version 19.0.0, [54]), assigning probes to 18539 genes. The robust multi-array average algorithm (RMA, [55]) was applied for preprocessing (probewise background correction, normalization and probeset summarization). Differential gene expression at Day 10 of the bioreactor incubations was analyzed using limma [56,57] using donor ID and/or dose groups as fixed factors. Multiple testing correction was estimated using the method of Benjamini and Hochberg (False Discovery Rate (FDR)) [58]. Pathway information was retrieved from the Gene Ontology Consortium [59]. Pathway analysis is based on MLP [60] using the p-values of all genes from the differential analysis.

4.8. Statistics

Experiments were performed in triplicate and values are shown as means ± standard errors of the mean (SEM). Statistical analyzes were performed using GraphPad Prism 5.0 for Windows (GraphPad Software, San Diego, CA, USA). The influence of the drug dose (Day 3–10) on the metabolic activity of the cells in comparison to the control was analyzed by means of one-way analysis of variance (ANOVA) with Dunnett’s multiple comparison test. The course over time (Day 3–10) of diclofenac metabolism was analyzed by linear regression analysis. Differences were judged as follows: * = p < 0.05, ** = p < 0.01, *** = p < 0.001. For microarray analyses, genes with an adjusted p < 0.05 were considered as differentially expressed in all comparisons unless mentioned otherwise.

5. Conclusions

In conclusion, transcriptional data in line with functional readouts clearly showed a dose-response effect of diclofenac in the perfused bioreactor system. Thus, the data underscore the suitability of the perfused 3D bioreactor system to perform long-term toxicity studies in vitro. In addition, the structure of the bioreactor perfusion circuit allows for various flow modes mimicking the in vivo application of a drug. In case of diclofenac a protocol simulating the continuous application of a drug over a longer time period was established, but also toxicity studies with a single dose application are conceivable without supplying fresh medium and introducing a bolus of the drug to the perfusion circuit. In summary, the 3D bioreactor system represents a valuable tool for in vitro studies on hepatic drug toxicity in humans.

Supplementary Materials

Supplementary materials can be found at https://0-www-mdpi-com.brum.beds.ac.uk/1422-0067/17/4/584/s1.

Acknowledgments

The research leading to these results has received support from the Innovative Medicines Initiative (IMI) Joint Undertaking under grant agreement n° 115439, resources of which are composed of financial contribution from the European Union’s Seventh Framework Programme (FP7/2007-2013) and EFPIA companies in kind contribution, with additional financial support by Janssen Research & Development. This publication reflects only the author’s views and neither the IMI JU nor EFPIA nor the European Commission are liable for any use that may be made of the information contained therein. No funds for covering the costs to publish in open access were received.

Author Contributions

Fanny Knöspel and Frank Jacobs conceived and designed the experiments, performed the experiments and wrote the manuscript; Daniel Seehofer and Georg Damm contributed with the acquisition and quality analysis of fresh primary human hepatocytes, provided useful discussion and revised the manuscript; Nora Freyer, Marco Richter and Nadja Strahl performed bioreactor experiments, functional assays and histological studies and revised the manuscript; An De Bondt and Ilse van den Wyngaert performed the microarray experiments, evaluated and analyzed the data and revised the manuscript; Mario Monshouwer and Jan Snoeys contributed to the design of the study and preparation of the manuscript; and Katrin Zeilinger contributed to the design of experiments, evaluation of results and writing of the manuscript.

Conflicts of Interest

Janssen Research & Development contributed to the design of the study; to the collection, analysis and interpretation of data; to the writing of the manuscript, and to the decision to publish the results.

Abbreviations

2Dtwo-dimensional
3Dthree-dimensional
300 µM BR300 µM bioreactors
1000 µM BR1000 µM bioreactors
A1ATα-1-antitrypsin
ABCB1ATP-binding cassette B1
ABCC2ATP-binding cassette C2
ABCG2ATP-binding cassette G2
ALBalbumin
ALTalanine transaminase
ARG1arginase 1
APOC1apolipoprotein C-I
ASLargininosuccinate lyase
ASTaspartate transaminase
ATF3activating transcription factor 3
B2Mβ -2-microglobulin
BCRPbreast cancer resistance protein
CK 18cytokeratin 18
control BRcontrol bioreactors
CPS1mitochondrial carbamoyl-phosphate synthase 1
CYPcytochrome P450
DILIdrug-induced liver injury
DMSOdimethyl sulfoxide
FDRFalse Discovery Rate
GLDHglutamate dehydrogenase
GDF15growth differentiation factor 15
LDHlactate dehydrogenase
MSmass spectrometry
NRF2/KEAP1nuclear factor (erythroid-derived 2)-like 2/kelch-like ECH-associated protein 1
OTCornithine transcarbamoylase
pHHprimary human hepatocytes
SEMstandard errors of the mean
TTRtransthyretin
UDPuridine diphosphate
UGT2B7UDP glucuronosyltransferase 2B7

References

  1. Hay, M.; Thomas, D.W.; Craighead, J.L.; Economides, C.; Rosenthal, J. Clinical development success rates for investigational drugs. Nat. Biotechnol. 2014, 32, 40–51. [Google Scholar] [CrossRef] [PubMed]
  2. Li, A.P. Accurate prediction of human drug toxicity: A major challenge in drug development. Chem. Biol. Interact. 2004, 150, 3–7. [Google Scholar] [CrossRef] [PubMed]
  3. Iwahori, T.; Matsuura, T.; Maehashi, H.; Sugo, K.; Saito, M.; Hosokawa, M.; Chiba, K.; Masaki, T.; Aizaki, H.; Ohkawa, K.; et al. CYP3A4 inducible model for in vitro analysis of human drug metabolism using a bioartificial liver. Hepatology 2003, 37, 665–673. [Google Scholar] [CrossRef] [PubMed]
  4. Aninat, C.; Piton, A.; Glaise, D.; Le Charpentier, T.; Langouët, S.; Morel, F.; Guguen-Guillouzo, C.; Guillouzo, A. Expression of cytochromes P450, conjugating enzymes and nuclear receptors in human hepatoma HepaRG cells. Drug Metab. Dispos. 2006, 34, 75–83. [Google Scholar] [CrossRef] [PubMed]
  5. Baxter, M.; Withey, S.; Harrison, S.; Segeritz, C.P.; Zhang, F.; Atkinson-Dell, R.; Rowe, C.; Gerrard, D.T.; Sison-Young, R.; Jenkins, R.; et al. Phenotypic and functional analyses show stem cell-derived hepatocyte-like cells better mimic fetal rather than adult hepatocytes. J. Hepatol. 2015, 62, 581–589. [Google Scholar] [CrossRef] [PubMed]
  6. Li, A.P. Evaluation of adverse drug properties with cryopreserved human hepatocytes and the integrated discrete multiple organ co-culture (IdMOC(TM)) system. Toxicol. Res. 2015, 31, 137–149. [Google Scholar] [CrossRef] [PubMed]
  7. Gómez-Lechón, M.J.; Jover, R.; Donato, T.; Ponsoda, X.; Rodriguez, C.; Stenzel, K.G.; Klocke, R.; Paul, D.; Guillén, I.; Bort, R.; et al. Long-term expression of differentiated functions in hepatocytes cultured in three-dimensional collagen matrix. J. Cell. Physiol. 1998, 177, 553–562. [Google Scholar] [CrossRef]
  8. Rodríguez-Antona, C.; Donato, M.T.; Boobis, A.; Edwards, R.J.; Watts, P.S.; Castell, J.V.; Gómez-Lechón, M.J. Cytochrome P450 expression in human hepatocytes and hepatoma cell lines: Molecular mechanisms that determine lower expression in cultured cells. Xenobiotica 2002, 32, 505–520. [Google Scholar] [CrossRef] [PubMed]
  9. Schyschka, L.; Sánchez, J.J.; Wang, Z.; Burkhardt, B.; Müller-Vieira, U.; Zeilinger, K.; Bachmann, A.; Nadalin, S.; Damm, G.; Nussler, A.K. Hepatic 3D cultures but not 2D cultures preserve specific transporter activity for acetaminophen-induced hepatotoxicity. Arch. Toxicol. 2013, 87, 1581–1593. [Google Scholar] [CrossRef] [PubMed]
  10. Ohkura, T.; Ohta, K.; Nagao, T.; Kusumoto, K.; Koeda, A.; Ueda, T.; Jomura, T.; Ikeya, T.; Ozeki, E.; Wada, K.; et al. Evaluation of human hepatocytes cultured by three-dimensional spheroid systems for drug metabolism. Drug Metab. Pharmacokinet. 2014, 29, 373–378. [Google Scholar] [CrossRef] [PubMed]
  11. Khetani, S.R.; Bhatia, S.N. Microscale culture of human liver cells for drug development. Nat. Biotechnol. 2008, 26, 120–126. [Google Scholar] [CrossRef] [PubMed]
  12. Gerlach, J.C.; Encke, J.; Hole, O.; Müller, C.; Ryan, C.J.; Neuhaus, P. Bioreactor for a larger scale hepatocyte in vitro perfusion. Transplantation 1994, 58, 984–988. [Google Scholar] [CrossRef]
  13. Zeilinger, K.; Schreiter, T.; Darnell, M.; Söderdahl, T.; Lübberstedt, M.; Dillner, B.; Knobeloch, D.; Nüssler, A.K.; Gerlach, J.C.; Andersson, T.B. Scaling down of a clinical three-dimensional perfusion multicompartment hollow fiber liver bioreactor developed for extracorporeal liver support to an analytical scale device useful for hepatic pharmacological in vitro studies. Tissue Eng. C Methods 2011, 17, 549–556. [Google Scholar] [CrossRef] [PubMed]
  14. Hoffmann, S.A.; Müller-Vieira, U.; Biemel, K.; Knobeloch, D.; Heydel, S.; Lübberstedt, M.; Nüssler, A.K.; Andersson, T.B.; Gerlach, J.C.; Zeilinger, K. Analysis of drug metabolism activities in a miniaturized liver cell bioreactor for use in pharmacological studies. Biotechnol. Bioeng. 2012, 109, 3172–3181. [Google Scholar] [CrossRef] [PubMed]
  15. Lübberstedt, M.; Müller-Vieira, U.; Biemel, K.M.; Darnell, M.; Hoffmann, S.A.; Knöspel, F.; Wönne, E.C.; Knobeloch, D.; Nüssler, A.K.; Gerlach, J.C.; et al. Serum-free culture of primary human hepatocytes in a miniaturized hollow-fibre membrane bioreactor for pharmacological in vitro studies. J. Tissue Eng. Regen. Med. 2015, 9, 1017–1026. [Google Scholar] [CrossRef] [PubMed]
  16. Kumar, S.; Samuel, K.; Subramanian, R.; Braun, M.P.; Stearns, R.A.; Chiu, S.H.; Evans, D.C.; Baillie, T.A. Extrapolation of diclofenac clearance from in vitro microsomal metabolism data: Role of acyl glucuronidation and sequential oxidative metabolism of the acyl glucuronide. J. Pharmacol. Exp. Ther. 2002, 303, 969–978. [Google Scholar] [CrossRef] [PubMed]
  17. Boelsterli, U.A. Diclofenac-induced liver injury: A paradigm of idiosyncratic drug toxicity. Toxicol. Appl. Pharmacol. 2003, 192, 307–322. [Google Scholar] [CrossRef]
  18. Chalasani, N.; Björnsson, E. Risk factors for idiosyncratic drug-induced liver injury. Gastroenterology 2010, 138, 2246–2259. [Google Scholar] [CrossRef] [PubMed]
  19. Banks, A.T.; Zimmerman, H.J.; Ishak, K.G.; Harter, J.G. Diclofenac-associated hepatotoxicity: Analysis of 180 cases reported to the Food and Drug Administration as adverse reactions. Hepatology 1995, 22, 820–827. [Google Scholar] [CrossRef] [PubMed]
  20. Aithal, G.P. Diclofenac-induced liver injury: A paradigm of idiosyncratic drug toxicity. Expert Opin. Drug Saf. 2004, 3, 519–523. [Google Scholar] [CrossRef] [PubMed]
  21. Syed, M.; Skonberg, C.; Hansen, S.H. Mitochondrial toxicity of diclofenac and its metabolites via inhibition of oxidative phosphorylation (ATP synthesis) in rat liver mitochondria: Possible role in drug induced liver injury (DILI). Toxicol. Vitro 2016, 31, 93–102. [Google Scholar] [CrossRef] [PubMed]
  22. Masubuchi, N.; Makino, C.; Murayama, N. Prediction of in vivo potential for metabolic activation of drugs into chemically reactive intermediate: Correlation of in vitro and in vivo generation of reactive intermediates and in vitro glutathione conjugate formation in rats and humans. Chem. Res. Toxicol. 2007, 20, 455–464. [Google Scholar] [CrossRef] [PubMed]
  23. Bort, R.; Ponsoda, X.; Jover, R.; Gómez-Lechón, M.J.; Castell, J.V. Diclofenac toxicity to hepatocytes: A role for drug metabolism in cell toxicity. J. Pharmacol. Exp. Ther. 1999, 288, 65–72. [Google Scholar] [PubMed]
  24. Mueller, D.; Müller-Vieira, U.; Biemel, K.M.; Tascher, G.; Nüssler, A.K.; Noor, F. Biotransformation of diclofenac and effects on the metabolome of primary human hepatocytes upon repeated dose exposure. Eur. J. Pharm. Sci. 2012, 45, 716–724. [Google Scholar] [CrossRef] [PubMed]
  25. Lauer, B.; Tuschl, G.; Kling, M.; Mueller, S.O. Species-specific toxicity of diclofenac and troglitazone in primary human and rat hepatocytes. Chem. Biol. Interact. 2009, 179, 17–24. [Google Scholar] [CrossRef] [PubMed]
  26. Messner, S.; Agarkova, I.; Moritz, W.; Kelm, J.M. Multi-cell type human liver microtissues for hepatotoxicity testing. Arch. Toxicol. 2013, 87, 209–213. [Google Scholar] [CrossRef] [PubMed]
  27. Gómez-Lechón, M.J.; Ponsoda, X.; O’Connor, E.; Donato, T.; Castell, J.V.; Jover, R. Diclofenac induces apoptosis in hepatocytes by alteration of mitochondrial function and generation of ROS. Biochem. Pharmacol. 2003, 66, 2155–2167. [Google Scholar] [CrossRef] [PubMed]
  28. Prill, S.; Jaeger, M.S.; Duschl, C. Long-term microfluidic glucose and lactate monitoring in hepatic cell culture. Biomicrofluidics 2014, 8. [Google Scholar] [CrossRef] [PubMed]
  29. Mueller, D.; Tascher, G.; Damm, G.; Nüssler, A.K.; Heinzle, E.; Noor, F. Real-time in situ viability assessment in a 3D bioreactor with liver cells using resazurin assay. Cytotechnology 2013, 65, 297–305. [Google Scholar] [CrossRef] [PubMed]
  30. Riss, T.L.; Moravec, R.A.; Niles, A.L.; Benink, H.A.; Worzella, T.J.; Minor, L. Cell viability assays; 1 May 2013 [Updated 29 June 2015]. In Assay Guidance Manual; Sittampalam, G.S., Coussens, N.P., Nelson, H., Arkin, M., Auld, D., Austin, C., Bejcek, B., Glicksman, M., Inglese, J., Iversen, P.W., et al., Eds.; Eli Lilly & Company and the National Center for Advancing Translational Sciences: Bethesda, MD, USA, 2004. [Google Scholar]
  31. Pace, R.T.; Burg, K.J.L. Toxic effects of resazurin on cell cultures. Cytotechnology 2015, 67, 13–17. [Google Scholar] [CrossRef] [PubMed]
  32. Cassidy, W.M.; Reynolds, T.B. Serum lactic dehydrogenase in the differential diagnosis of acute hepatocellular injury. J. Clin. Gastroenterol. 1994, 19, 118–121. [Google Scholar] [CrossRef] [PubMed]
  33. Laine, L.; Goldkind, L.; Curtis, S.P.; Connors, L.G.; Yanqiong, Z.; Cannon, C.P. How common is diclofenac-associated liver injury? Analysis of 17,289 arthritis patients in a long-term prospective clinical trial. Am. J. Gastroenterol. 2009, 104, 356–362. [Google Scholar] [CrossRef] [PubMed]
  34. Wang, A.G.; Xia, T.; Yuan, J.; Yu, R.A.; Yang, K.D.; Chen, X.M.; Qu, W.; Waalkes, M.P. Effects of phenobarbital on metabolism and toxicity of diclofenac sodium in rat hepatocytes in vitro. Food Chem. Toxicol. 2004, 42, 1647–1653. [Google Scholar] [CrossRef] [PubMed]
  35. Borlak, J.; Chougule, A.; Singh, P.K. How useful are clinical liver function tests in in vitro human hepatotoxicity assays? Toxicol. Vitro 2014, 28, 784–795. [Google Scholar] [CrossRef] [PubMed]
  36. Hinz, B.; Chevts, J.; Renner, B.; Wuttke, H.; Rau, T.; Schmidt, A.; Szelenyi, I.; Brune, K.; Werner, U. Bioavailability of diclofenac potassium at low doses. Br. J. Clin. Pharmacol 2005, 59, 80–84. [Google Scholar] [CrossRef] [PubMed]
  37. Hackstein, H.; Mohl, W.; Püschel, W.; Stallmach, A.; Zeitz, M. Diclofenac-associated acute cholestatis hepatitis. Z. Gastroenterol. 1998, 36, 385–389. [Google Scholar] [PubMed]
  38. Breen, E.G.; McNicholl, J.; Cosgrove, E.; McCabe, J.; Stevens, F.M. Fatal hepatitis associated with diclofenac. Gut 1986, 27, 1390–1393. [Google Scholar] [CrossRef] [PubMed]
  39. Helfgott, S.M.; Sandberg-Cook, J.; Zakim, D.; Nestler, J. Diclofenac-associated hepatotoxicity. JAMA 1990, 264, 2660–2662. [Google Scholar] [CrossRef] [PubMed]
  40. Sallustio, B.C.; Holbrook, F.L. In vivo perturbation of rat hepatocyte canalicular membrane function by diclofenac. Drug Metab. Dispos. 2001, 29, 1535–1538. [Google Scholar] [PubMed]
  41. Kretz-Rommel, A.; Boelsterli, U.A. Cytotoxic activity of T cells and non-T cells from diclofenac-immunized mice against cultured syngeneic hepatocytes exposed to diclofenac. Hepatology 1995, 22, 213–222. [Google Scholar] [CrossRef] [PubMed]
  42. Ingelman-Sundberg, M. Pharmacogenetics of cytochrome P450 and its applications in drug therapy: The past, present and future. Trends Pharmacol. Sci. 2004, 25, 193–200. [Google Scholar] [CrossRef] [PubMed]
  43. Guguen-Guillouzo, C.; Guillouzo, A. General review on in vitro hepatocyte models and their applications. Methods Mol. Biol. 2010, 640, 1–40. [Google Scholar] [PubMed]
  44. Rodrigues, R.M.; Heymans, A.; de Boe, V.; Sachinidis, A.; Chaudhari, U.; Govaere, O.; Roskams, T.; Vanhaecke, T.; Rogiers, V.; de Kock, J. Toxicogenomics-based prediction of acetaminophen-induced liver injury using human hepatic cell systems. Toxicol. Lett. 2016, 240, 50–59. [Google Scholar] [CrossRef] [PubMed]
  45. Lagas, J.S.; van der Kruijssen, C.M.; van de Wetering, K.; Beijnen, J.H.; Schinkel, A.H. Transport of diclofenac by breast cancer resistance protein (ABCG2) and stimulation of multidrug resistance protein 2 (ABCC2)-mediated drug transport by diclofenac and benzbromarone. Drug Metab. Dispos. 2009, 37, 129–136. [Google Scholar] [CrossRef] [PubMed]
  46. Liu, Z.X.; Govindarajan, S.; Kaplowitz, N. Innate immune system plays a critical role in determining the progression and severity of acetaminophen hepatotoxicity. Gastroenterology 2004, 127, 1760–1774. [Google Scholar] [CrossRef] [PubMed]
  47. Campion, S.N.; Johnson, R.; Aleksunes, L.M.; Goedken, M.J.; van Rooijen, N.; Scheffer, G.L.; Cherrington, N.J.; Manautou, J.E. Hepatic Mrp4 induction following acetaminophen exposure is dependent on Kupffer cell function. Am. J. Physiol. Gastrointest. Liver Physiol. 2008, 295, G294–G304. [Google Scholar] [CrossRef] [PubMed]
  48. Herpers, B.; Wink, S.; Fredriksson, L.; Di, Z.; Hendriks, G.; Vrieling, H.; de Bont, H.; van de Water, B. Activation of the Nrf2 response by intrinsic hepatotoxic drugs correlates with suppression of NF-κB activation and sensitizes toward TNFα-induced cytotoxicity. Arch. Toxicol. 2015. [Google Scholar] [CrossRef] [PubMed]
  49. Zhang, J.D.; Berntenis, N.; Roth, A.; Ebeling, M. Data mining reveals a network of early-response genes as a consensus signature of drug-induced in vitro and in vivo toxicity. Pharmacogenom. J. 2014, 14, 208–216. [Google Scholar] [CrossRef] [PubMed]
  50. Fredriksson, L.; Herpers, B.; Benedetti, G.; Matadin, Q.; Puigvert, J.C.; de Bont, H.; Dragovic, S.; Vermeulen, N.P.; Commandeur, J.N.; Danen, E.; et al. Diclofenac inhibits tumornecrosisfactor-α-induced nuclearfactor-κB activation causing synergistic hepatocyte apoptosis. Hepatology 2011, 53, 2027–2041. [Google Scholar] [CrossRef] [PubMed]
  51. Damm, G.; Pfeiffer, E.; Burkhardt, B.; Vermehren, J.; Nüssler, A.K.; Weiss, T.S. Human parenchymal and non-parenchymal liver cell isolation, culture and characterization. Hepatol. Int. 2013, 7, 951–958. [Google Scholar] [CrossRef] [PubMed]
  52. Pfeiffer, E.; Kegel, V.; Zeilinger, K.; Hengstler, J.G.; Nüssler, A.K.; Seehofer, D.; Damm, G. Featured Article: Isolation, characterization, and cultivation of human hepatocytes and non-parenchymal liver cells. Exp. Biol. Med. 2015, 240, 645–656. [Google Scholar] [CrossRef] [PubMed]
  53. Gentleman, R.C.; Carey, V.J.; Bates, D.M.; Bolstad, B.; Dettling, M.; Dudoit, S.; Ellis, B.; Gautier, L.; Ge, Y.; Gentry, J.; et al. Bioconductor: Open software development for computational biology and bioinformatics. Genome Biol. 2004, 5, R80. [Google Scholar] [CrossRef] [PubMed] [Green Version]
  54. Dai, M.; Wang, P.; Boyd, A.D.; Kostov, G.; Athey, B.; Jones, E.G.; Bunney, W.E.; Myers, R.M.; Speed, T.P.; Akil, H.; et al. Evolving gene/transcript definitions significantly alter the interpretation of GeneChip data. Nucleic Acids Res. 2005, 33, e175. [Google Scholar] [CrossRef] [PubMed]
  55. Irizarry, R.A.; Hobbs, B.; Collin, F.; Beazer-Barclay, Y.D.; Antonellis, K.J.; Scherf, U.; Speed, T.P. Exploration, normalization, and summaries of high density oligonucleotide array probe level data. Biostatistics 2003, 4, 249–264. [Google Scholar] [CrossRef] [PubMed]
  56. Smyth, G.K. Linear models and empirical bayes methods for assessing differential expression in microarray experiments. Stat. Appl. Genet. Mol. Biol. 2004, 3, 1–28. [Google Scholar] [CrossRef] [PubMed]
  57. Ritchie, M.E.; Phipson, B.; Wu, D.; Hu, Y.; Law, C.W.; Shi, W.; Smyth, G.K. Limma powers differential expression analyses for RNA-sequencing and microarray studies. Nucleic Acids Res. 2015, 43, e47. [Google Scholar] [CrossRef] [PubMed]
  58. Hochberg, Y.; Benjamini, Y. More powerful procedures for multiple significance testing. Stat. Med. 1990, 9, 811–818. [Google Scholar] [CrossRef] [PubMed]
  59. Ashburner, M.; Ball, C.A.; Blake, J.A.; Botstein, D.; Butler, H.; Cherry, J.M.; Davis, A.P.; Dolinski, K.; Dwight, S.S.; Eppig, J.T.; et al. Gene ontology: Tool for the unification of biology. The Gene Ontology Consortium. Nat. Genet. 2000, 25, 25–29. [Google Scholar] [CrossRef] [PubMed]
  60. Raghavan, N.; de Bondt, A.M.; Talloen, W.; Moechars, D.; Göhlmann, H.W.; Amaratunga, D. The high-level similarity of some disparate gene expression measures. Bioinformatics 2007, 23, 3032–3038. [Google Scholar] [CrossRef] [PubMed]
Figure 1. Schematic illustration of the three-dimensional (3D) multi-compartment hollow-fiber bioreactor technology. The bioreactor consists of three independent bundles of hollow fiber membranes interwoven in four layers. Each layer is composed of alternately arranged medium and gas capillaries. The two medium-carrying bundles (red and blue) are perfused in a counter-current way to enhance mass exchange. The third bundle (orange) serves for gas supply of the cells cultured between the capillaries.
Ijms 17 00584 g001
Figure 2. Diclofenac pathways under investigation. The parent drug diclofenac can be hydroxylated by cytochrome P450 (CYP) isoform CYP2C9 to form 4′-OH-diclofenac or glucuronidated by uridine diphosphate (UDP)-glucuronosyltransferase-2B7 (UGT2B7) to form diclofenac-acyl-glucuronide, which can be further hydroxylated by CYP2C8 to 4′-OH-diclofenac-acyl-glucuronide.
Ijms 17 00584 g002
Figure 3. Experimental design. Overview of the time schedule of drug application and sampling in bioreactors run with primary human liver cells.
Ijms 17 00584 g003
Figure 4. Time-course of clinical parameters in bioreactors with primary human liver cells treated or non-treated with diclofenac. Release respectively production rates in 300 µM bioreactors (300 µM BR) (blue) or 1000 µM bioreactors (1000 µM BR) (red) or in the non-treated control bioreactors (control BR) (black) were determined before (from Day 0 until 3) and during diclofenac application (from Day 3 until 10): production rates of glucose (A) and lactate (B) were measured as indicators for the overall metabolic performance; lactate dehydrogenase (LDH, C) and aspartate transaminase (AST, D) were determined as indicators of potential cell damage; and urea production (E) and ammonia release (F) as parameters for nitrogen metabolism. Values were normalized to 106 inoculated cells. The influence of the drug dose (Day 3–10) on the metabolic activity of the cells in comparison to the control was analyzed by means of one-way analysis of variance (ANOVA) with Dunnett’s multiple comparison test and significant changes (* = p < 0.05, *** = p < 0.001) are indicated in the graphs (n = 3, mean ± SEM).
Ijms 17 00584 g004aIjms 17 00584 g004b
Figure 5. Conversion of diclofenac to specific metabolites in bioreactors with primary human liver cells: diclofenac concentrations (A); diclofenac decrease rates (B); 4′-OH-diclofenac concentrations (C); and 4′-OH-diclofenac formation rates (D) as well as mass spectrometry (MS) area units of diclofenac-acyl-glucuronide (E) and 4′-OH-diclofenac-acyl-glucuronide (F) were determined in 300 µM bioreactors (300 µM BR) (blue) or 1000 µM bioreactors (1000 µM BR) (red) from Day 3 to 10 of culture. Values were normalized to 106 inoculated cells. The course over time (Day 3–10) of diclofenac metabolism was analyzed by linear regression analysis and significant changes (* = p < 0.05, ** = p < 0.01, *** = p < 0.001) as well as respective regression coefficients are indicated in the graphs. (n = 3, mean ± SEM).
Ijms 17 00584 g005
Figure 6. Histological and immunohistochemical analysis of primary human liver cells cultured in bioreactors with or without diclofenac application: cell material from untreated control bioreactors (control BR) (A,D,G); 300 µM bioreactors (300 µM BR) (B,E,H); or 1000 µM bioreactors (1000 µM BR) (C,F,I) was investigated at the end of the experimental phase on Day 10 of culture. The upper row (AC) shows hematoxylin and eosin staining of cultures; the middle row (DF) shows CK18 (green) and vimentin (red); and the lower row (GI) shows BCRP (green) and CYP2C9 (red) immunoreactivity. Counterstaining of nuclei is shown in blue (scale bar = 50 µM).
Ijms 17 00584 g006
Figure 7. Microarray analysis of primary human liver cells cultured in bioreactors with or without diclofenac exposure. The graph shows average intensities of key genes involved in diclofenac metabolism and diclofenac-mediated toxicity determined in freshly isolated liver cells (Day 0) or cells cultured in bioreactors until Day 10 without diclofenac (control bioreactors (control BR)) or with diclofenac (300 µM bioreactors (300 µM BR)) or 1000 µM bioreactors (1000 µM BR)). Measured genes include albumin (ALB), α-1-antitrypsin (A1AT), transthyretin (TTR), apolipoprotein C-I (APOC1), β-2-microglobulin (B2M), selected cytochrome P450 (CYP) isoenzymes, uridine diphosphate (UDP) glucuronosyltransferase 2B7 (UGT2B7), ATP-binding cassette B1 (ABCB1), ATP-binding cassette C2 (ABCC2), and ATP-binding cassette G2 (ABCG2) (control BR (n = 6), 300 µM BR (n = 4), 1000 µM BR (n = 3)).
Ijms 17 00584 g007
Figure 8. Volcano plot representing the differential expression of all measured genes after exposure to diclofenac: the transcriptional effects of treatment in 300 µM bioreactors (300 µM BR) (A) or 1000 µM bioreactors (1000 µM BR) (B). The x- and y-axes represent the magnitude and the significance, respectively, of the transcriptional effect per gene (control bioreactors (control BR) (n = 4), 300 µM BR (n = 4), 1000 µM BR (n = 3), LogFC: Log2 fold change in expression as compared to control BR).
Ijms 17 00584 g008
Table 1. Gene Ontology (GO) gene sets most strongly affected upon treatment with a low dose of diclofenac (300 µM bioreactors).
RankGO IDSizep-ValueDescriptionParent
Gene Ontology Biological Processes
1GO:007237667 (90)6.0 × 10⁻³³Protein activation cascade
2GO:000695647 (69)1.8 × 10⁻³¹Complement activation1
3GO:001606494 (119)9.8 × 10⁻²⁹Immunoglobulin mediated immune response
4GO:000245543 (67)1.0 × 10⁻²⁷Humoral immune response mediated by circulating immunoglobulin3
5GO:001972497 (122)4.9 × 10⁻²⁷B cell mediated immunity3
6GO:000257683 (87)1.4 × 10⁻²⁶Platelet degranulation
7GO:000268789 (90)3.5 × 10⁻²⁶Positive regulation of leukocyte migration
8GO:000695831 (52)2.0 × 10⁻²²Complement activation, classical pathway1, 2, 3, 4, 5
9GO:000268879 (83)2.7 × 10⁻²¹Regulation of leukocyte chemotaxis
10GO:000269068 (69)2.8 × 10⁻¹⁸Positive regulation of leukocyte chemotaxis7, 9
Gene Ontology Cellular Component
1GO:003299437 (40)8.7 × 10⁻²⁵Protein-lipid complex
2GO:003435835 (38)1.8 × 10⁻²⁴Plasma lipoprotein particle1
3GO:004261312 (16)4.6 × 10⁻²⁴MHC class II protein complex
4GO:004261122 (27)1.6 × 10⁻²⁰MHC protein complex3
5GO:003198373 (82)1.1 × 10⁻¹⁹Vesicle lumen
6GO:006020572 (81)2.4 × 10⁻¹⁹Cytoplasmic membrane-bounded vesicle lumen5
7GO:003013448 (52)6.7 × 10⁻¹⁷ER to Golgi transport vesicle
8GO:001250738 (42)1.6 × 10⁻¹⁵ER to Golgi transport vesicle membrane7
9GO:003436423 (26)1.0 × 10⁻¹⁴High-density lipoprotein particle1, 2
10GO:003109160 (63)1.3 × 10⁻¹²Platelet α granule
Gene Ontology Molecular Functions
1GO:004237954 (58)2.8 × 10⁻⁹Chemokine receptor binding
2GO:000800943 (47)1.3 × 10⁻⁸Chemokine activity1
3GO:003017053 (56)5.3 × 10⁻⁷Pyridoxal phosphate binding
4GO:000382376 (107)2.0 × 10⁻⁶Antigen binding
5GO:004523617 (17)9.7 × 10⁻⁶CXCR chemokine receptor binding1, 2
6GO:002302615 (16)2.6 × 10⁻⁵MHC class II protein complex binding4
7GO:00602286 (6)3.1 × 10⁻⁵Phosphatidylcholine-sterol O-acyltransferaseactivator activity
8GO:003121015 (16)4.7 × 10⁻⁵Phosphatidylcholine binding
9GO:00198648 (12)1.1 × 10⁻⁴IgG binding
10GO:002302317 (19)1.6 × 10⁻⁴MHC protein complex binding4, 6
Table 2. Gene Ontology (GO) gene sets most strongly affected upon treatment with a high dose of diclofenac (1000 µM bioreactors).
RankGO IDSizep-ValueDescriptionParent
Gene Ontology Biological Processes
1GO:004259074 (79)1.2 × 10−46Antigen processing and presentation of exogenous peptide antigen via MHC class I
2GO:000247970 (75)2.1 × 10−36Antigen processing and presentation of exogenous peptide antigen via MHC class I, TAP-dependent1
3GO:000652159 (62)1.0 × 10⁻³¹Regulation of cellular amino acid metabolic process
4GO:003323879 (82)2.9 × 10⁻²⁶Regulation of cellular amine metabolic process
5GO:000257683 (87)8.9 × 10⁻¹⁹Platelet degranulation
6GO:004478375 (77)3.9 × 10⁻¹⁷G1 DNA damage check point
7GO:005143768 (72)6.7 × 10⁻¹⁷Positive regulation of ubiquitin-protein ligase activity
8GO:005135186 (94)1.4 × 10⁻¹⁶Positive regulation of ligase activity
9GO:005143663 (67)2.1 × 10⁻¹⁶Negative regulation of ubiquitin-protein ligase activity
10GO:005144381 (89)3.0 × 10⁻¹⁶Positive regulation of ubiquitin-protein transferase activity8
Gene Ontology Cellular Component
1GO:000050263 (66)3.6 × 10⁻²⁵Proteasome complex
2GO:199020478 (83)2.6 × 10⁻¹⁸Oxidoreductase complex
3GO:004320272 (73)2.5 × 10⁻¹⁶Lysosomal lumen
4GO:000577573 (77)1.4 × 10⁻¹⁵Vacuolar lumen3
5GO:003109160 (63)3.1 × 10⁻¹⁵Platelet α granule
6GO:007046965 (72)3.1 × 10⁻¹⁵Respiratory chain
7GO:000574659 (65)9.6 × 10⁻¹³Mitochondrial respiratory chain6
8GO:002262422 (24)3.9 × 10⁻¹²Proteasome accessory complex1
9GO:003190293 (99)3.1 × 10⁻¹¹Late endosome membrane
10GO:000583920 (20)1.6 × 10⁻¹⁰Proteasome core complex1
Gene Ontology Molecular Functions
1GO:000905589 (99)8.2 × 10⁻²¹Electron carrier activity
2GO:000374348 (52)1.1 × 10⁻¹⁴Translation initiation factor activity
3GO:001665187 (95)9.7 × 10⁻¹⁴Oxidoreductase activity, acting on NAD(P)H
4GO:001665549 (53)1.6 × 10⁻¹²Oxidoreductase activity, acting on NAD(P)H, quinon or similar compound as acceptor3
5GO:000813575 (83)2.9 × 10⁻¹¹Translation factor activity, nucleic acid binding
6GO:000429821 (21)4.3 × 10⁻⁸Threonine-type endopeptidase activity
7GO:007000321 (21)4.3 × 10⁻⁸Threonine-type peptidase activity6
8GO:001683045 (47)1.1 × 10⁻⁶Carbon-carbon lyase activity
9GO:000395436 (39)2.4 × 10⁻⁶NADH dehydrogenase activity3, 4
10GO:000813736 (39)2.4 × 10⁻⁶NADH dehydrogenase (ubiquinone) activity3, 4, 9

