Article

Characterization of Micro-RNA Changes during the Progression of Type 2 Diabetes in Zucker Diabetic Fatty Rats

1
Department of Translational Medicine and Clinical Pharmacology, Boehringer Ingelheim Pharma GmbH & Co. KG, 88397 Biberach an der Riss, Germany
2
Department of CardioMetabolic Diseases Research, Boehringer Ingelheim Pharma GmbH & Co. KG, 88397 Biberach an der Riss, Germany
*
Author to whom correspondence should be addressed.
Int. J. Mol. Sci. 2016, 17(5), 665; https://0-doi-org.brum.beds.ac.uk/10.3390/ijms17050665
Submission received: 11 March 2016 / Revised: 8 April 2016 / Accepted: 26 April 2016 / Published: 3 May 2016
(This article belongs to the Special Issue Liquid Biopsy for Clinical Application)

Abstract

:
The aim of the present pilot study was the identification of micro-RNA changes over time during the development and progression of type 2 diabetes (T2D) in Zucker diabetic fatty rats (ZDF rats). T2D is a complex metabolic disorder that is characterized, inter alia, by progressive failure of pancreatic β cells to produce insulin, but also by functional or morphological modifications of others organ, such as liver, adipose tissue and the cardiovascular system. Micro-RNAs are a novel class of biomarkers that have the potential to represent biomarkers of disease progression. In this study, the onset and progression of diabetes was followed in ZDF rats from six weeks until 17 weeks of age. After an initial phase of hyperinsulinemia, the animals developed T2D and lost the capacity to produce sufficient insulin. Circulating miRNAs were measured from plasma samples at four time points: pre-diabetes (six weeks of age), hyperinsulinemia (eight weeks), β cell failure (11 weeks) and late-stage diabetes (17 weeks) using TaqMan miRNA arrays. Bioinformatic analysis revealed distinct changes of circulating miRNAs over time. Several miRNAs were found to be increased over the course of the disease progression, such as miR-122, miR-133, miR-210 and miR-375. The most significantly decreased miRNAs were miR-140, miR-151-3p, miR-185, miR-203, miR-434-3p and miR-450a. Some of the miRNAs have also been identified in type 2 diabetic patients recently and, therefore, may have the potential to be useful biomarkers for the disease progression of T2D and/or the treatment response for anti-diabetic medications.

Graphical Abstract

1. Introduction

Type 2 diabetes (T2D) affects 285 million people worldwide (2010), and the numbers are projected to increase substantially in the years to come up to 366 million in 2030 [1,2]. Several effective drugs are available for the treatment of T2D with the generic metformin, sulfonylureas and thiazolidinediones and novel drugs, like Dipeptidyl peptidase-4 inhibitors (DPP-4i), Sodium-dependent glucose transporter inhibitors (SGLT2i), injectable Glucagon-like peptide-1 analogues (GLP-1a) or insulin. Despite the plethora of anti-diabetic medications, none of the available treatments is able to stop the progressive decline in pancreatic β cell mass and function and thereby stop the progression of T2D [3]. Because of this, many patients require combination treatment to prevent deterioration of glucose control over the years and later complications of T2D, like diabetic retinopathy or diabetic nephropathy [4]. In order to show the beneficial effects of new treatments for T2D on disease progression, clinical trials need to be performed over a long period of time up to five years of treatment. Early biomarkers that are sensitive and specific to predict the progression of T2D in patients are needed. Therefore, better knowledge in understanding the pathophysiological mechanisms will be crucial for designing new strategies to prevent and/or treat the progression of T2D.
Micro-RNAs (miRNAs) are small, 18–22 nucleotides in length, non-coding RNA molecules that modulate the differentiation, growth, apoptosis and proliferation of cells by interfering with protein synthesis by either inducing mRNA degradation or repressing translation [5,6]. Circulating miRNAs are remarkably stable due to resistance to degradation from endogenous RNase activity [7,8,9]. Several miRNAs are involved in the regulation of β cell differentiation, function and mass [10]. In particular, the direct involvement of miR-375 in insulin secretion via targeting myotrophin (MTPN) expression [11,12] and glucose homeostasis via targeting phosphoinositide-dependent protein kinase 1 (PDK-1) is well described [13,14]. Increased pancreatic miR-375 expression was reported in T2D patients [15] and also in animal models, such as ob/ob mice [16]. There are several other miRNAs, such as miR-7, miR-124a, miR-9, miR-34a and miR-195, that play a role in the regulation of insulin secretion and β cell development [17]. Defective β cells can release miRNAs into the bloodstream following pathophysiological conditions. Recently, Kong et al. [18] demonstrated significantly higher levels of miR-34a, miR-9, miR-29a, miR-30d, miR-124a, miR-146 and miR-375 in sera of newly-diagnosed T2D compared to people with normal glucose tolerance or pre-diabetes. Furthermore, plasma miRNA profiling of T2D patients showed loss of endothelial miR-126, probably resulting in impaired peripheral angiogenic signaling [19].
Alterations of miRNAs within the islets have also been reported in many animal models, such as obese models for T2D using ob/ob mice [16], db/db mice [20] and high fed diet-induced rat models [21] or the non-obese pre-diabetic non-obese diabetic mice model (NOD mice) [22] and the spontaneous T2D model using Goto-Kakazaki rats [23]. Mostly, these changes were analyzed at individual time points and not during disease progression. Furthermore, chemical induced models using streptozotocin (STZ) are widely used as pancreas injury models [24], and miR-375 has been found increased upon induction of diabetes [11].
Despite the fact that type 2 diabetes is a complex disease, which is strongly influenced by the lifestyle of Western societies with high caloric diets and reduced physical activity, as well as underlying genetic factors, it seems that certain miRNAs are clearly associated with type 2 diabetes, and further research is required to understand the causes and consequences.
The Zucker diabetic fatty (ZDF) rat model has become a gold standard to monitor disease progression of T2D, as many characteristics of human conditions are reflected [25]. The ZDF rats are characterized by a defect in the leptin pathway, which results in metabolic syndrome, obesity and T2D in early stages of development. The ZDF rat is an ideal model to observe the natural progression of T2D from initial hyperinsulinemia to failure of β cells and loss of insulin production and then progressive diabetes in aging animals. However, changes in miRNA expression profiles in plasma of ZDF rats during disease progression have never been explored.
In the present study, we aimed to identify changes in the plasma miRNA profile of ZDF rats during the natural progression of T2D. Most of the altered circulating miRNAs reflect changes in diabetes-related tissues, such as pancreas, liver, heart, skeletal muscle and adipose tissues. These miRNAs could potentially serve as prognostic markers of disease progression and potentially as treatment effect markers in T2D.

2. Results

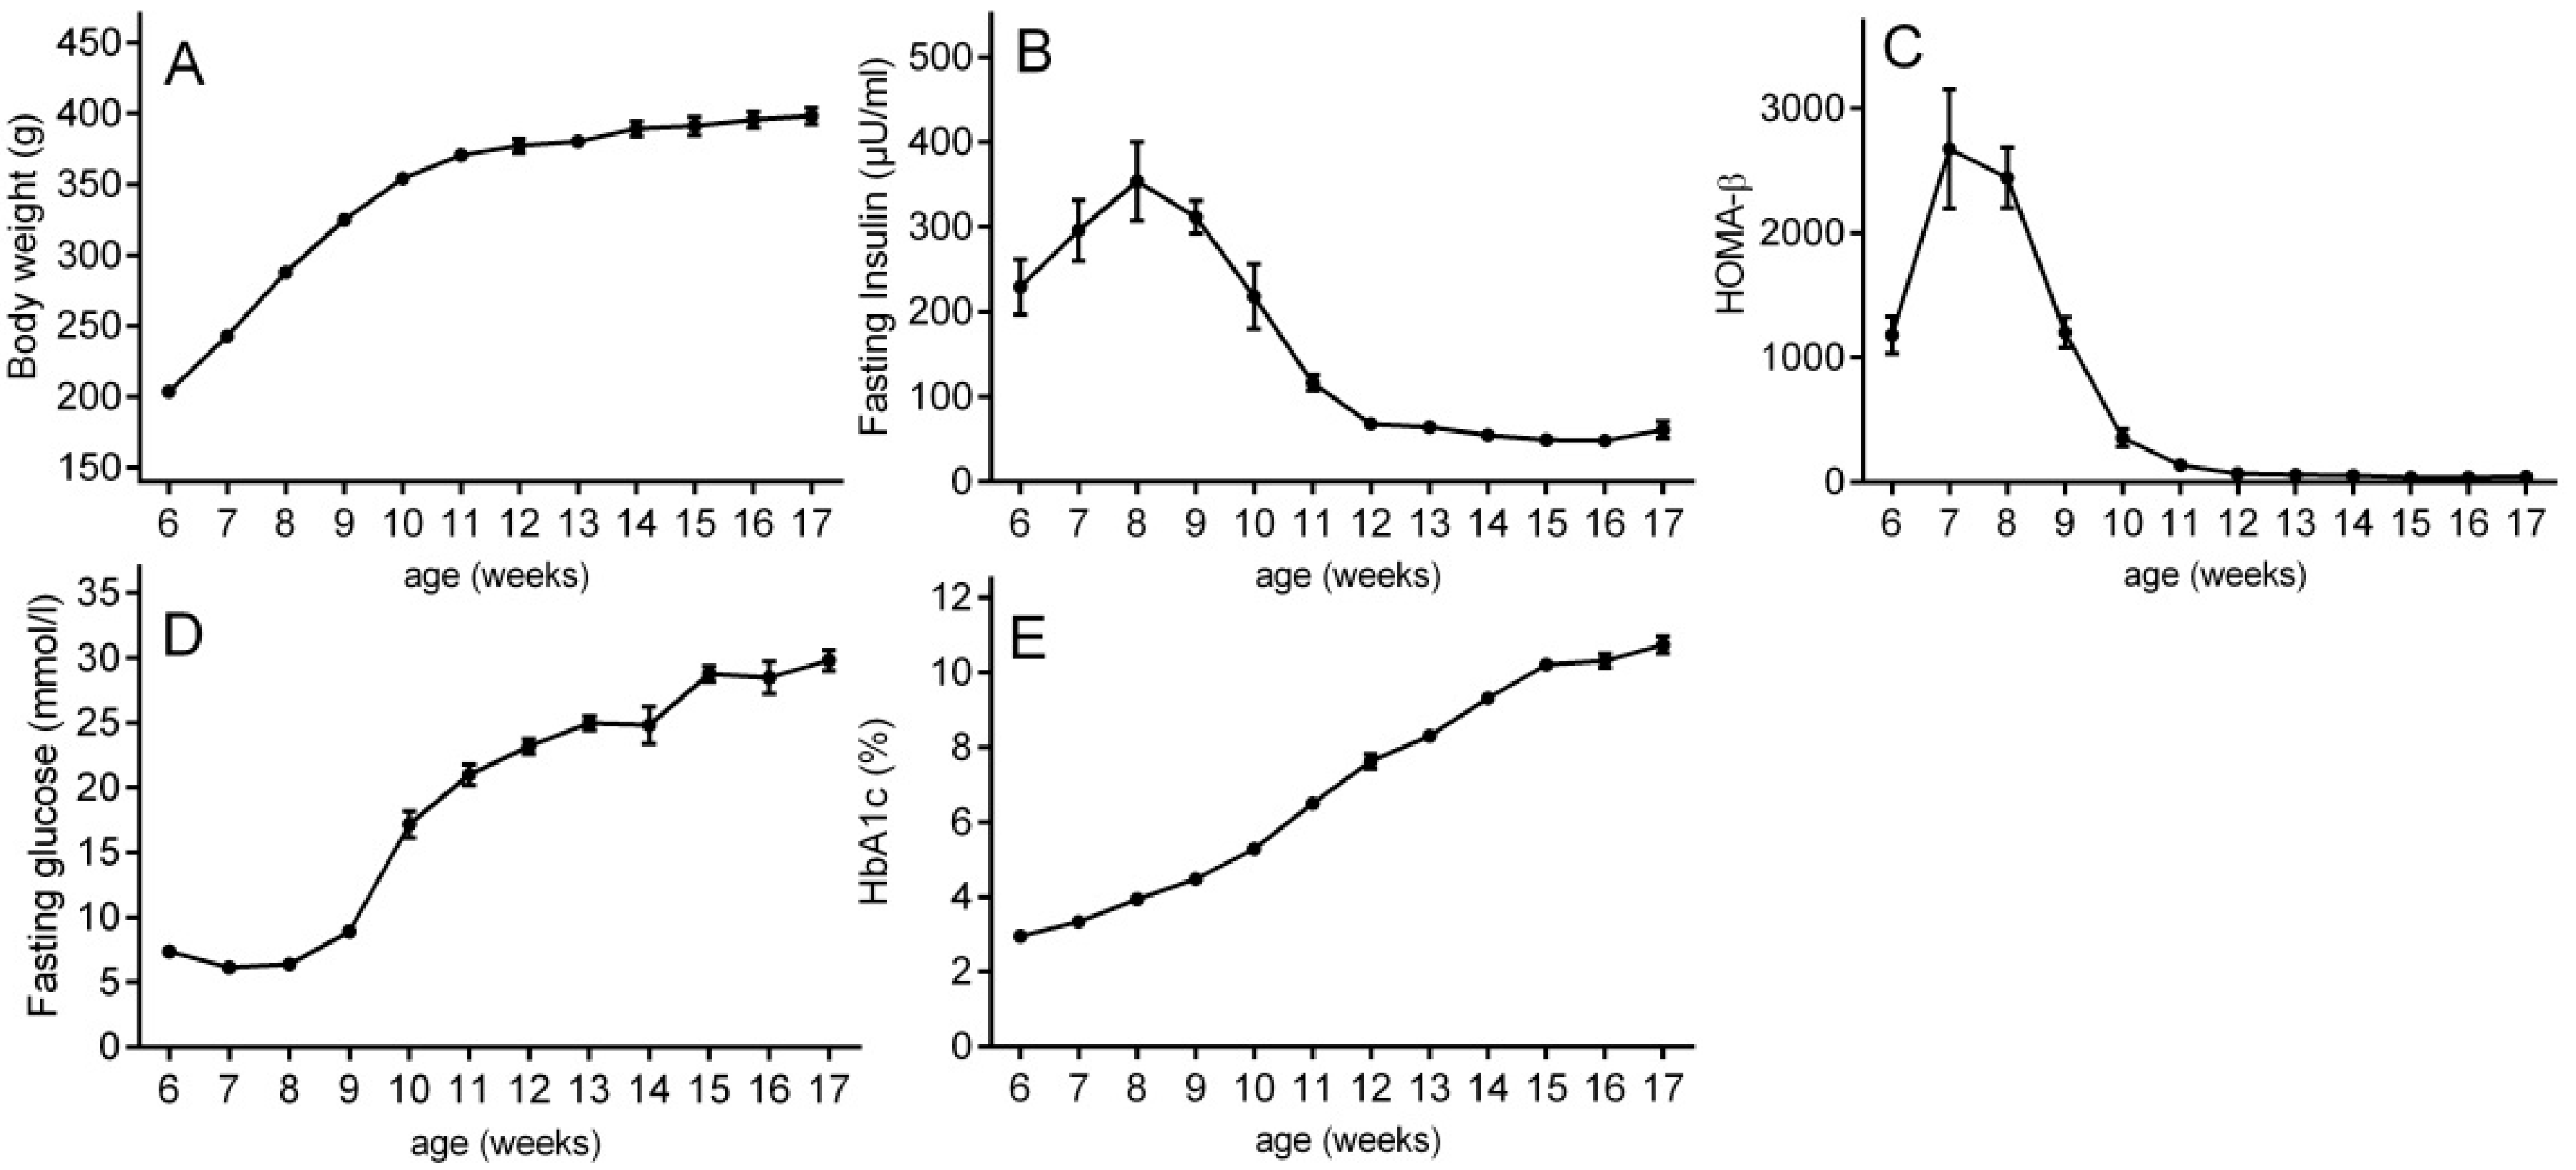
2.1. Type 2 Diabetes Progression in ZDF Rats

The present study characterizes the micro-RNA changes during natural progression of T2D in chow-fed, aging ZDF rats from six weeks of age to 17 weeks of age (n = 10). The body weight of ZDF rats increased from 6–12 weeks of age and reached a plateau around 12 weeks (Figure 1A). The ZDF rats showed initial fasting hyperinsulinemia at eight weeks of age to compensate for the increasing peripheral insulin resistance (Figure 1B). At around nine weeks of age, the capacity of β cells to secrete more insulin started to decline (Figure 1B). This decline in fasting insulin secretion continued until 11–12 weeks of age, when the β cells finally failed to secrete sufficient amounts of insulin and the animals became fully hyperglycemic and diabetic. The described course of β cell decompensation was further confirmed by HOMA-β, an index of β cell function (Figure 1C). Fasting hyperglycemia increased in parallel to the loss of insulin secretion from week 9–12 up to approximately 25 mM fasting glucose (Figure 1D). HbA1C levels rose steadily from week 6 over the entire course of the study (Figure 1E). Due to these results, the present study is ideally suited to characterize the longitudinal miRNA profile at different disease stages from (A) pre-diabetes (PD) (six-week-old ZDF rats) to (B) hyperinsulinemia (HI) (at eight weeks of age) to (C) β cell failure (BCF) (at 11 weeks of age) to (D) late-stage diabetes (LSD) (at 17 weeks of age).

2.2. Discovery of miRNA Profiles during Diabetes Disease Progression

For the discovery of free circulating micro-RNA in the plasma from the ZDF rats, plasma samples from the pre-diabetes group and from animals at the disease stages hyperinsulinemia, β cell failure and late-stage diabetes were used. All results were normalized to the respective pre-diabetes time point for the same group of animals. The analysis was performed as described in the Materials and Methods, and the results were subjected to bioinformatic assessment.

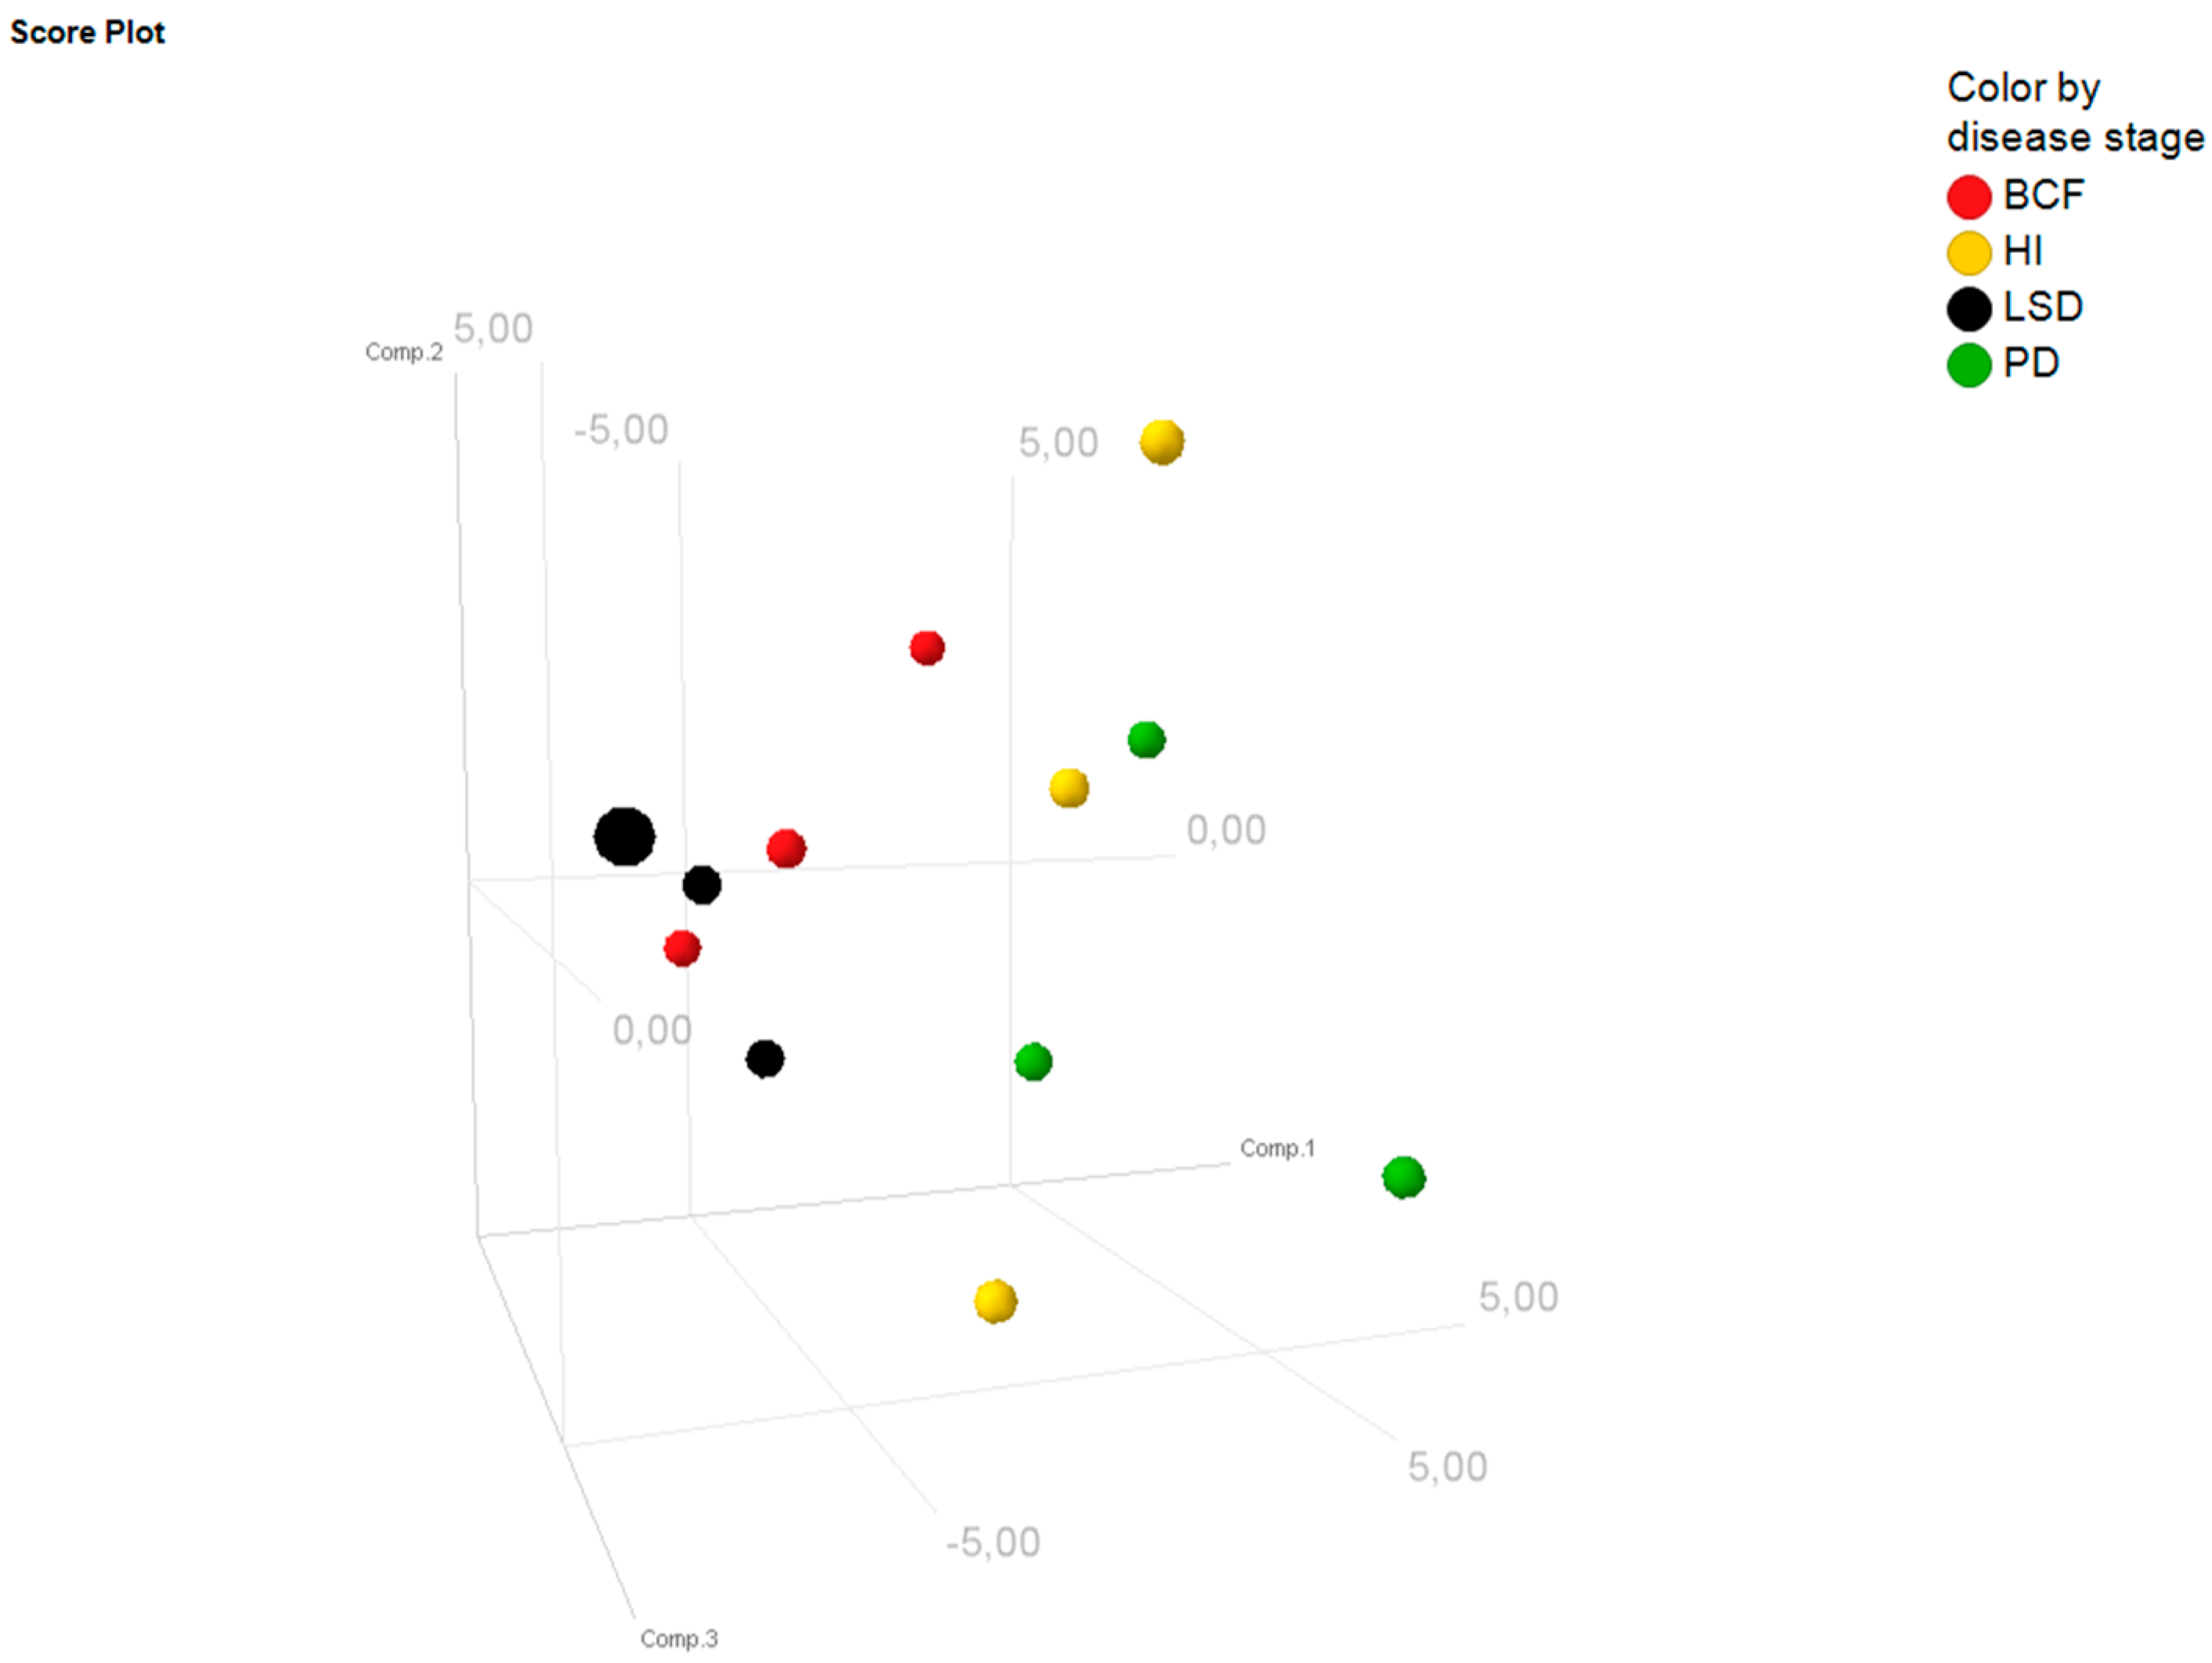
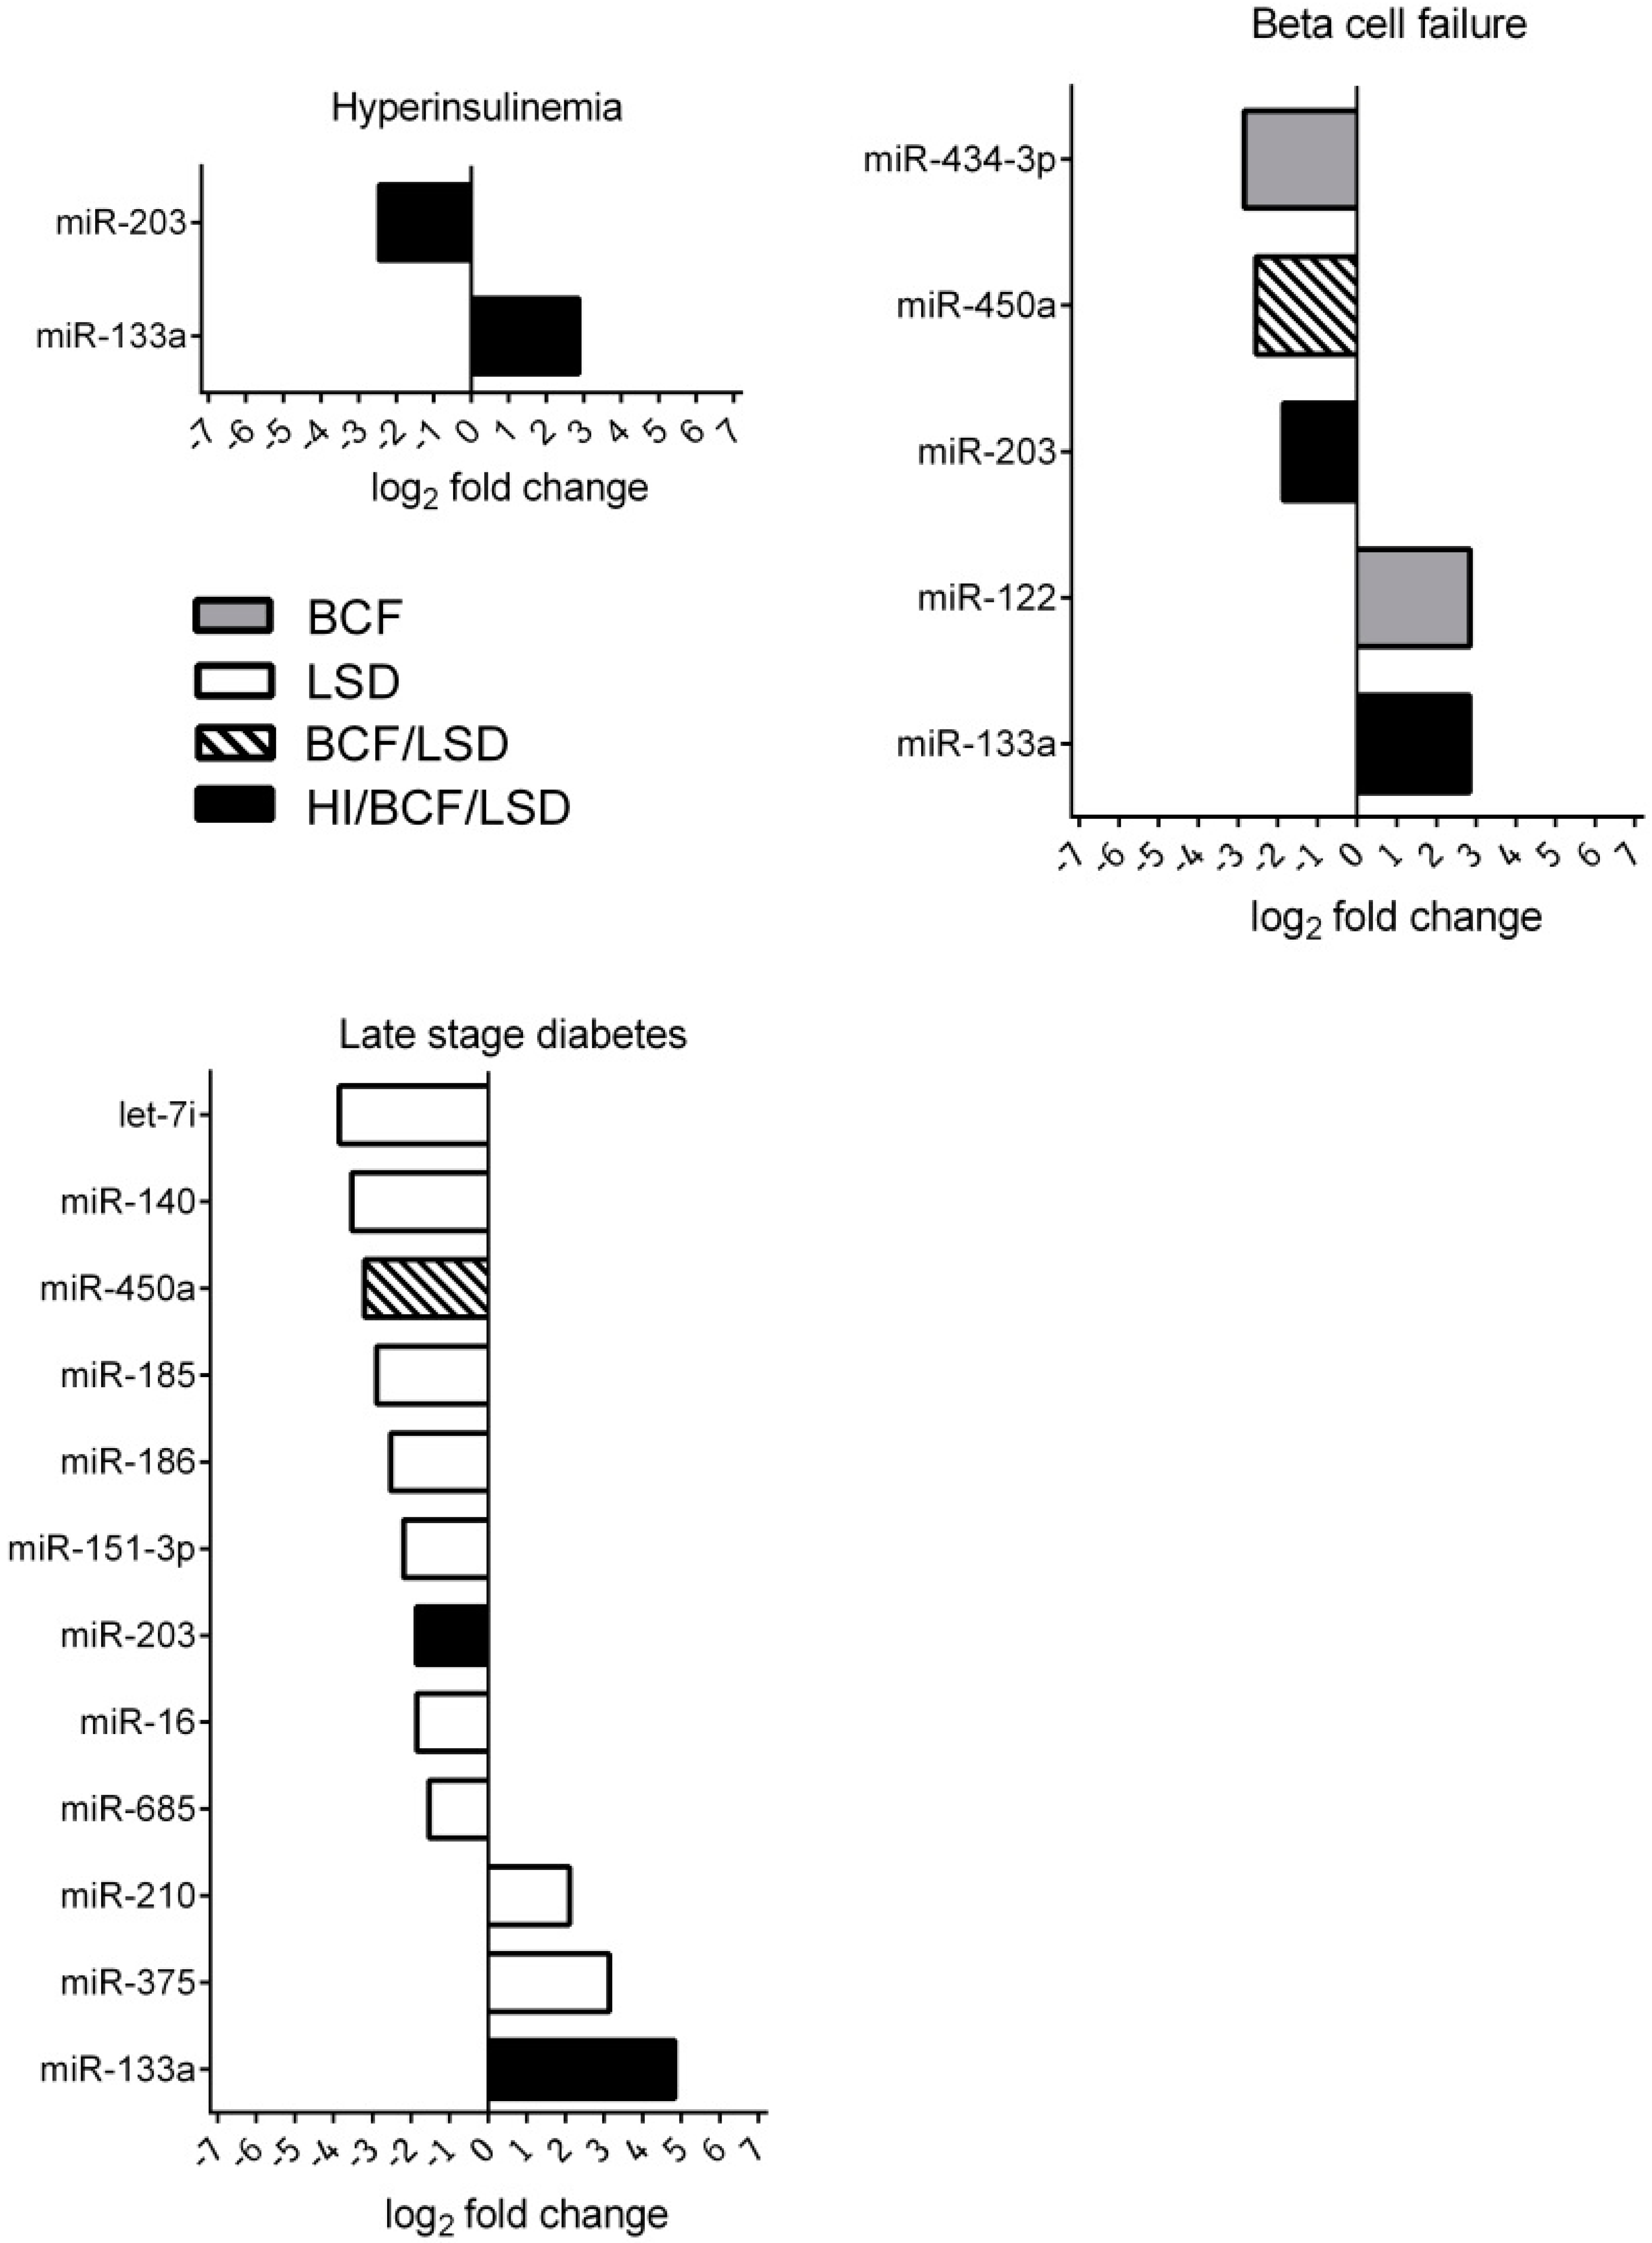
2.3. Bioinformatic Assessment of miRNA Changes in Plasma Samples of ZDF Rats

Principal component analysis (PCA) revealed that the overall expression profiles differed among the four different time points of disease progression (Figure 2). In contrast, the expression profiles were relatively similar among the three biological replicates, which indicate a significant change of miRNAs over the disease course and the consistency of the results at each time point. Overall, the PCA indicates a gradual change of miRNA levels during disease progression (Figure 2).
The total number of detected circulating miRNAs in plasma samples was 111. The numbers of altered circulating miRNAs at each time point are summarized in the Venn diagram (Figure 3). For the initial analysis, group-wise comparisons were performed for each time point to assess the significant changes compared to baseline (fold-change >2 and p < 0.05) (Figure 4). At initial hyperinsulinemia, the circulating level of miRNA-133 was significantly increased compared to the pre-diabetes stage, whereas the level of miR-203 was decreased (Figure 4 or Figure 5). When β cell failure occurred, the circulating level of miR-133a remained high, and additionally, the level of miR-122 was significantly increased, whereas miR-203, miR-450a and miR-434-3p were decreased at this time point (Figure 4). miRNAs, such as miR-434-3p and miR-122, were specifically changed at the time point of β cell functional failure (Figure 4). At late-stage diabetes, the circulating level of 12 miRNAs was specifically altered; the circulating level of miR-375, miR-210 and miR-133a was increased, and the circulating levels of let-7i, miR-140, miR-450a, miR-185, miR-186, miR-151-3p, miR-203, miR-16 and miR-685 were strongly diminished versus their levels at the pre-diabetes stage (Figure 4). Two miRNAs were significantly altered across all disease stages. The expression of miR-133a was persistently increased, and the level of miR-203 was persistently decreased (Figure 4).

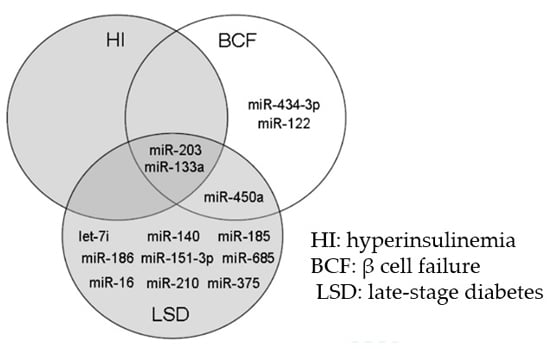
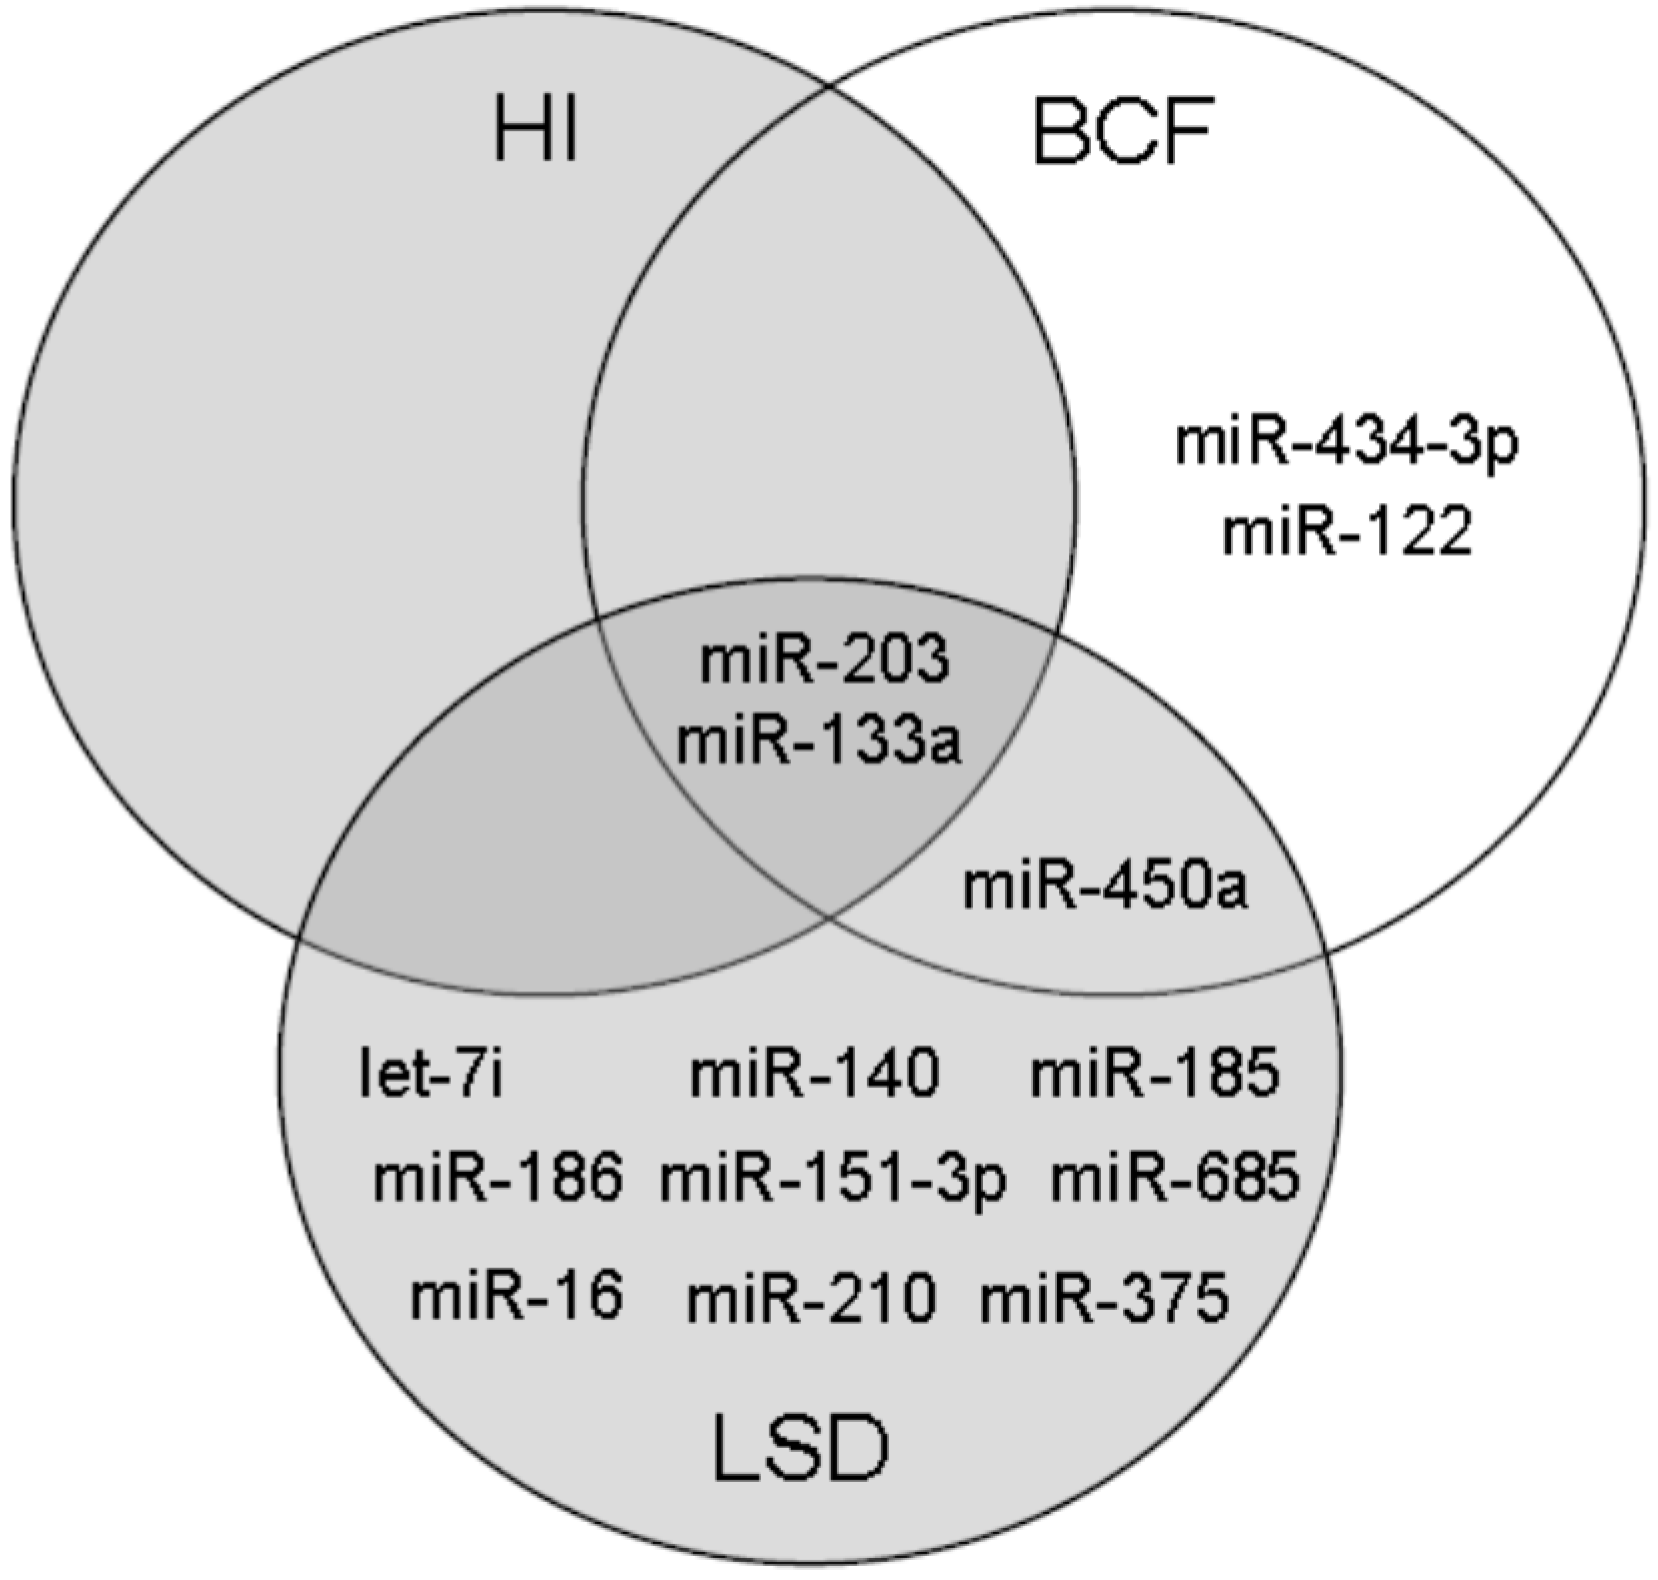
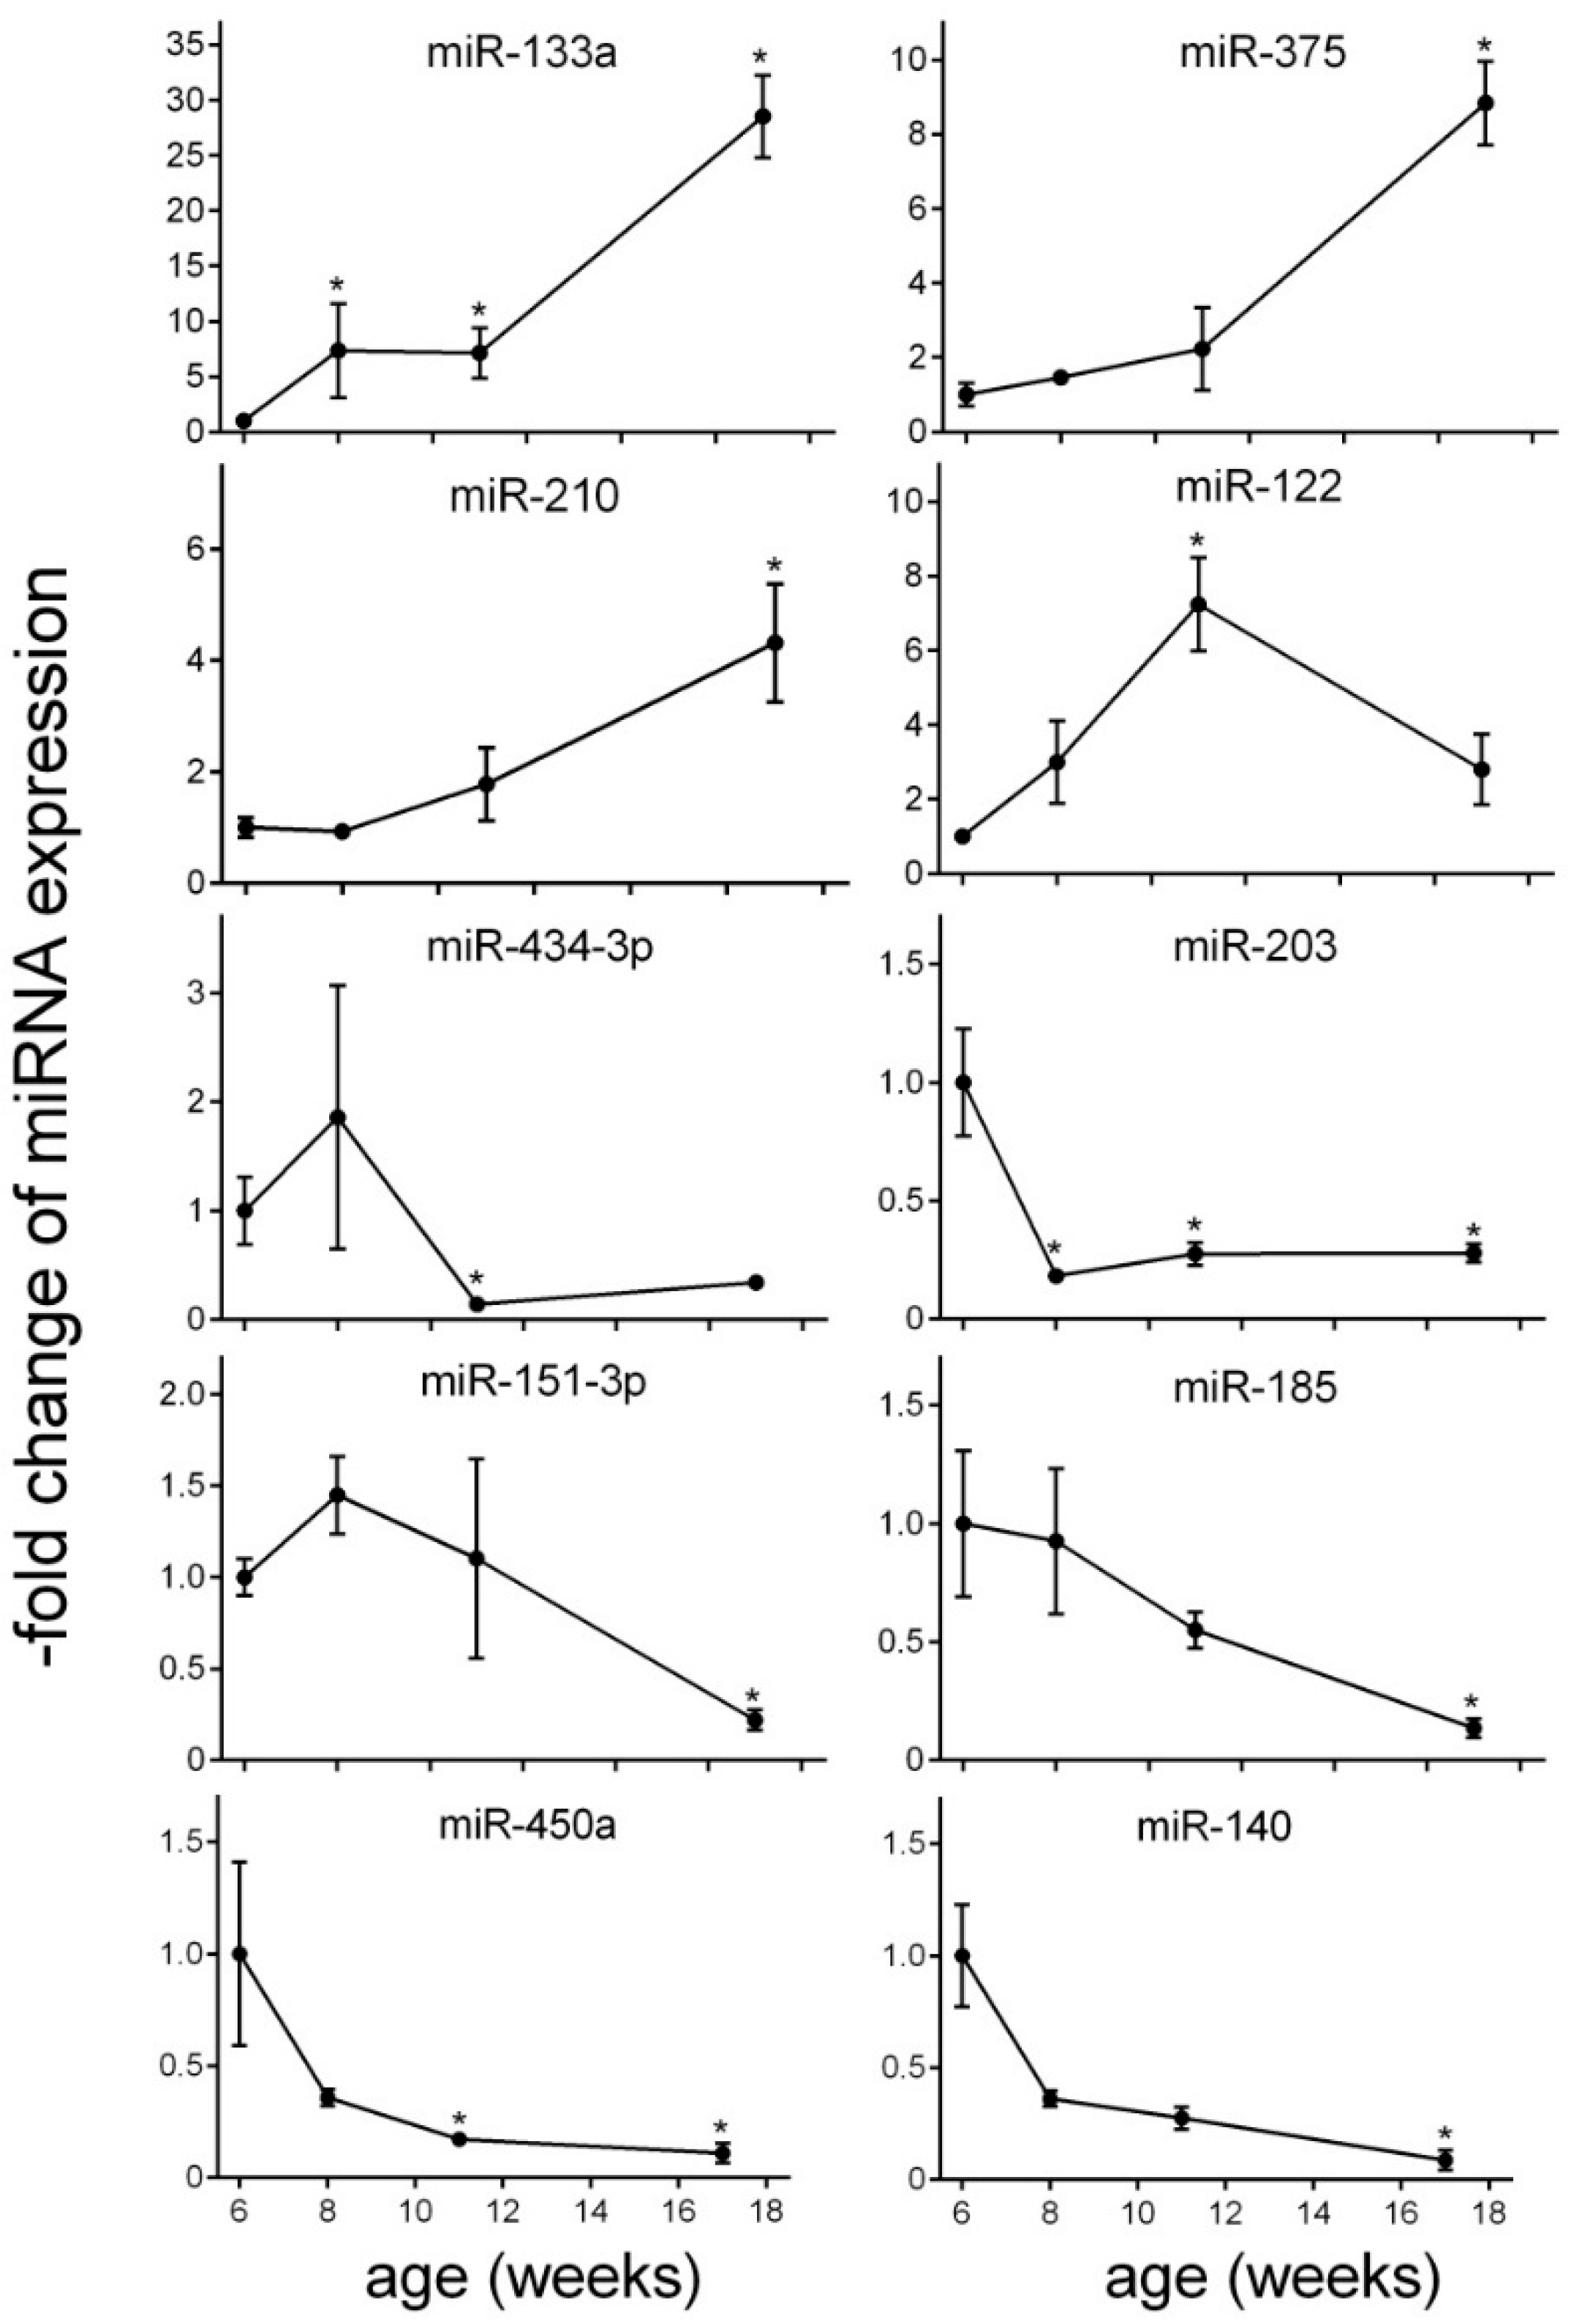
2.4. miRNA Changes during Disease Progression in ZDF Rats

In order to characterize the changes of circulating miRNA level over time during disease progression, an ANOVA was performed (F-statistic p-value < 0.05) (Table 1, Figure 5 and Figure S1). Overall, the blood level of 3 miRNA species is significantly elevated, namely miR-133a, miR-375 and miR-210. The highest augmentation of miRNA blood level was observed for miR-133a, which was approximately 28-fold higher at late-stage diabetes than at the pre-diabetes stage (Figure 5). Overall, a gradual elevation of circulating levels of miR-133a was observed over the disease course. The expression of miR-122 represented an exception reaching a peak already at β cell functional failure (approximately seven-fold elevation). Diminution in circulating levels was detected for miR-140, miR-151-3p, miR-185, miR-203, miR-434-3p and miR-450a (Figure 5). The blood level of miR-140 was more than 12-fold suppressed at late-stage diabetes (Figure 5). The profile of the circulating level of miR-185, miR-450a, miR-203 and miR-140 was characterized by a continuous decline over time compared to pre-diabetes. The miR-151-3p level were slightly increased at initial hyperinsulinemia and decreased at late-stage diabetes (Figure 5). The drop of miR-203 was already detected at hyperinsulinemia (Figure 5), and the level of this miRNA remained low at all time points compared to pre-diabetes. The level of miR-434-3p was reduced at BCF and LSD. The functions of the miRNAs based on published data and their experimentally-observed and/or predicted main target mRNAs are summarized in Table 1.

3. Discussion

The present study characterizes the changes in the free circulating level of micro-RNAs in blood during the natural progression of T2D in chow-fed, aging ZDF rats from pre-diabetes over initial hyperinsulinemia to β cell failure and late-stage diabetes. The rats show initial hyperinsulinemia at eight weeks of age to compensate for the insulin resistance. Then, the insulin secretion declined until 11–12 weeks of age, when the β cells finally fail to secrete sufficient amounts of insulin and the animals become fully hyperglycemic and diabetic, also represented by HOMA-β. During the progression of T2D, the numbers of significantly altered miRNA species are constantly increased from two miRNAs at HI (week 8 of age) to five miRNAs at BCF (week 11 of age) to 12 miRNAs at LSD (week 17 of age), indicating physiological responses to diabetic complications.
The circulating level of 10 miRNAs displayed significant alterations during the progression of the disease (Table 1). In general, the false discovery rate of the described 10 miRNAs in this study is between 1% and 3.5% (Table 1), and therefore, the identified miRNAs are very unlikely false positives.
Most of our identified plasma miRNAs are known to be modified in tissues known to play a role in diabetes, such as pancreas, liver, skeletal muscle and adipose tissues or in the cardiovascular system.
Based on previous work, the expression of the two increased miRNA species miR-375 and miR-210 and the three decreased miRNAs, miR-203, miR-185 and miR-450a, is involved in the regulation of insulin secretion and pancreatic β cell function [11,26,27,28]. Our study revealed a continuous elevation of circulating miR-375 levels. miR-375 is abundantly expressed in β cells and serves as a negative regulator of insulin secretion via targeting myotrophin expression [11]. Another important target of miR-375 is PDK1 in β cells, which results in a decrease of glucose regulation [13]. Recently, it was demonstrated that circulating miR-375 levels in mice only originated in a small proportion from β cells, but mainly from various neuroendocrine cells from lung, gastrointestinal tract, thyroid and adrenals [29]. This indicates that this miRNA is not a specific marker for β cell function in mice. Nevertheless, a markedly increased circulating miR-375 level in response to streptozotocin, indicating acute β cell injury, was described several times [24,29]. Therefore, the strong augmentation of miR-375 blood level (>8-fold) at late-stage diabetes in our study may still reflect ongoing β cell death. One limitation of our study is that we do not have serial tissue biopsies to compare the miRNA changes with histological changes, e.g., of the pancreas. Altered miR-375 level does not exclusively reflect T2D pathophysiology. Recently, it has been shown that miR-375 expression is decreased in pancreatic cancer, and overexpression of miR-375 impacts cell proliferation and apoptosis in pancreatic cancer cells [30,31]. Therefore, we can only hypothesize that miR-375 could reflect progressive β cell death. The repeated identification of miR-375 in diabetes models and the apparent high expression in β cells demands a further qualification of this potential type 2 diabetes progression biomarker in animals and, potentially, human studies. It needs to be determined whether miR-375 changes in plasma reflect expression changes of the miRNA in the pancreas at a constant rate of β cell death or if miR-375 reflects indeed the apoptosis of β cells.
miR-203 levels were strongly decreased at all time points during the progression of the disease. Therefore, miR-203 might be considered as an early indicator of type 2 diabetes onset in ZDF rats. In a recent study, decreased miR-203 and miR-210 expressions were detected in pancreatic islets of young pre-diabetic and diabetic db/db mice and in mice fed with a high fed diet [26] and were strongly associated with β cell dysfunction [20,22]. Therefore, a similar regulation of miR-203 was observed in db/db mice and high fat diet-fed mice (HFD mice) compared to our study. The study of Nesca et al., 2013, observed a decrease in miR-210 in pancreatic islets [26]. Our study revealed a continuous elevation of miR-210 blood level in ZDF rats. The observed increase in blood might be a result of modifications in organ function or morphology as increased circulating miR-210 levels were detected, e.g., under hypoxic conditions in cardiac tissue, and miR-210 expression increases during myocardial infarction in other studies [32].
Furthermore, our study showed significant alteration in the circulating level of miR-185 and miR-450a during the progression of the disease. While the role of miR-450a on the regulation of endocrine function or in diabetes is not clear to date, miR-185 plays an important role in the regulation of insulin secretion and β cell growth via targeting suppressor of cytokine signaling 3 (SOCS3) [27]. A significantly decreased miR-185 blood level was detected in patients with diabetes and in pancreatic islets of diabetic mouse models [27]. These findings point towards a functional role of miR-185 in diabetes progression. However, miR-185 can also block cardiac hypertrophy signaling and was discussed as a target for heart failure treatment [33]. Furthermore, miR-185 has been identified in several cancer types and may therefore not be a specific marker. Further elucidation of the role of miR-185 in humans is required.
The miR-133a displayed the strongest elevation during disease progression in our study. miR-133a is abundantly expressed in skeletal muscle and myocardial cells [34,35]. Overexpression of miR-133 in cardiomyocytes reduced GLUT4 expression and insulin-stimulated glucose uptake by targeting KLF15. Therefore, miR-133 may play an important role in the pathogenesis of insulin resistance in ZDF rats [36]. In addition, circulating plasma miR-133a levels are increased in patients with acute myocardial infarction and potentially serve as a marker for cardiomyocyte death [37]. It has been shown that aging ZDF rats have altered left ventricular chamber morphology and function at 16 weeks of age [38]. Therefore, miR-133 may be a potential biomarker to follow the consequences of disease progression at the level of skeletal muscle or cardiac muscles.
The miR-151-3p level was decreased at late-stage diabetes in ZDF rats. In a recent study, downregulation of miR-151-3p was demonstrated during later stages of transverse aortic constriction-induced cardiac hypertrophy in mice, reflecting its participation in heart dysfunction [39]. In our study, both the diminution of miR-151-3p and the strong increase in miR-133a level at late-stage diabetes could therefore be the consequence of heart muscle dysfunction.
At β cell failure, circulating miR-434-3p levels were strongly decreased. Due to high variability at HI, no conclusion can be drawn about the early time point. In aged mouse skeletal muscle, miR-434-3p levels were found to be decreased [40] and in ApoE-deficient mice during the disease progression of atherosclerosis [41]. Our findings suggest a role of miR-434-3p during the progression of type 2 diabetes in ZDF rats. However, the mechanisms behind this reduction are elusive and require further investigation.
Our miRNA profiling study revealed that miR-122 expression is increased in plasma of ZDF rats during disease progression of T2D. miR-122 is considered to be a highly sensitive and specific biomarker in blood, reflecting hepatocyte injury, as increased levels of miR-122 were described in various liver diseases, such as non-alcoholic steatohepatitis (NASH) [42]. In NASH patients and in animal models, circulating miR-122 levels are elevated in serum, whereas its expression is decreased in liver tissue [43,44]. The strong increase of miR-122 is consistent with the fatty liver that ZDF rats develop when reaching their body weight plateau [45].
The strongest diminished miRNA in blood was miR-140, reaching an approximately 12-fold reduction at late-stage diabetes. Decreased miR-140 levels are associated with impaired regulation of osteogenesis and adipogenesis [46]. Adipocyte differentiation is regulated by miR-140 via targeting the TGF-β signaling pathway. Diminution of circulating miR-140 might be the result of an upregulated TGF-β signaling pathway during disease progression. The decrease of miR-140 at initial hyperglycemia might correlate with the dysfunctional adipocytes in ZDF rats and the insulin resistance of ZDF rat adipocytes [47].
In recent years, many different profiling studies in humans and animal models have used various profiling platforms to detect miRNAs as potential biomarkers for the disease progression of type 2 diabetes. There are large numbers of altered miRNAs obtained from cultured cells, blood or tissues, which described potential early candidate markers of T2D [48,49,50]. The eight circulating miRNAs, miR-29a, miR-34a, miR-375, miR-103, miR-107, miR-132, miR-142-3p and miR-144, and the two tissue-specific miRNAs, miR-199a-3p and miR-223, were identified to be significantly altered in T2D across a meta-analysis of controlled profiling studies [51]. Apart from miR-375, none of these miRNAs were strongly and significantly changed in our study. However, for instance, miR-29a was found to be decreased during disease progression in our study, as expected, but did not reach the level of statistical significance. Therefore, both miR-29a and miR-375 could be assessed in future studies as potential translatable biomarkers. Some of the diabetes-associated miRNAs were below the detection limit in our study, such as miR-9, miR-96 and miR-148, indicating that back-translation from humans to ZDF rats may be difficult for these markers.
The assessment of circulating miRNAs has several analytical and technical challenges. Plasma samples can be contaminated with cell remnants form erythrocytes, leukocytes and platelets. Erythrocytes have high levels of miR-16 and miR-451, which correlate to the degree of hemolysis in plasma samples [52]. In particular, hemolysis affects miRNA quantification [52,53]. Due to the design of our study and the comparisons to the pre-diabetes time point, an influence of hemolysis on our results is not likely, but cannot be entirely ruled out. The inconsistent findings on possible associations of miRNA changes across the literature can also be partly caused by diverse normalization strategies, as normalization is a crucial step in any quantitative real-time PCR experiment [54,55]. In our study, global mean normalization was used, which is one of the most robust normalization approaches.
One limitation of the current study is that it does not include a ZDF lean control group to control for potential age-related miRNA changes in non-diabetic rats. We acknowledge the possibility that age-related changes could impact miRNA levels in plasma. However, it has to be taken into account that the life span of a normal rat is 1.5–3 years (78–156 weeks). In ZDF rats, the onset of diabetes occurs at a very young age, around 8–12 weeks. In our study, the rats were used until an age of 17 weeks, which corresponds to a young age in normal rats.
In principle, several reports have implicated miRNAs in cellular senescence and aging. Mostly, these changes were observed on tissue level [56]. The following miRNAs were found to be altered in aging rats mostly from 48 weeks–132 weeks of age in skeletal muscle, e.g., miR-22 [57], or in murine liver tissues, e.g., miR-669c and miR-709, miR-93 and miR-214 [58,59]. miR-34a is a potential plasma marker of brain aging identified in old mice, starting to increase approximately two-fold at an age of 48 weeks [60]. In addition, monitoring age-related miRNA in the circulation in humans revealed only modest fold changes, even when comparing to widely-separated groups of age. After multiple adjustments, plasma miR-126-3p was significantly higher, but less than two-fold elevated in the oldest healthy subjects (>75 years) compared to the youngest (<45 years) [61].
None of the above mentioned miRNAs were found to be significantly changed in the plasma of diabetic ZDF rats in the age range of 8–17 weeks in the current study. Taken together, it is not expected that the observed changes in plasma miRNAs in diabetic ZDF rats can be explained by senescence and aging.
The treatment effects of anti-diabetic drugs on miRNA expression are well described. Metformin leads to decreased circulating miR-140-5p (miR-140) and miR-122 levels in T2D patients [62]. In endothelial cells, the anti-angiogenic effect of miR-34a via targeting SIRT1 is modulated by metformin [63]. In diabetic nephropathy, the miRNA-29 family protects the kidney from fibrotic damage, and the DPP-4 inhibitor linagliptin has been shown to inhibit TGF-β-induced endothelial to mesenchymal transition (EndMT) by restoring the miRNA-29s’ levels [64]. Our study also revealed a suppressed miR-29a level during disease progression of T2D in ZDF rats, but this was not significant and, therefore, not included in our candidate list. Nevertheless, the miR-29 family might serve as a candidate for monitoring of treatment effects.
This pilot study provides a first insight into the altered circulating miRNA profile during the disease progression of ZDF rats, and the changes in the miRNA profile likely reflect pathophysiological complications in several tissues, such as pancreas, liver, skeletal muscle, cardiac muscle and adipose tissue. Further studies are needed to underline their potential as early treatment effect biomarkers, as previously described for miRNA-29s. These novel, non-invasive markers show promise as tools for the mechanistic investigation of early disease progression of T2D and potentially to monitor treatment effects. As miRNAs regulate a number of downstream targets, the identified changes may be able to additionally uncover disease mechanisms in the ZDF rat. Future studies should elucidate the functional implications of the observed plasma miRNA changes for each target tissue.

4. Materials and Methods

4.1. Animal Study

The longitudinal T2D progression study was performed at Bêtagenex in Laval, Québec, Canada. Male ZDF Leprfa/Crl (6 weeks old; Charles River Laboratories; L´Arbrescle Cedex, France) were housed in groups of 2 under pathogen-free conditions, controlled temperature on a regular 12-h light-dark cycle and received standard chow (Harland 2018) and water ad libitum. Animal experiments were conducted at the Centre Hospitalier de l´Universitć de Montréal and in accordance with the Policies and Guidelines of the Canadian Council for the Protection of Animals. The study code was BTX-BO002. All animals had an acclimation period of 5 days prior to the study start. Animals in the study were from 6 weeks of age until 17 weeks of age (n = 10). Body weight, 2-h-fasted glycemia, insulinemia and HbA1c were measured at baseline and then weekly from plasma or blood samples. For this, blood was taken from the tail vein of non-anaesthetized rats. All blood draws were carried out at the same time of the day following a 2-h food deprivation. Fasting glucose and fasting insulin were used to calculate the homeostasis model assessment of β cell function (HOMA-β). HOMA-β was calculated as (20 × fasting glucose (μU/mL)/fasting glucose (mmol/L) − 3.5).

4.2. miRNA Assessment: Isolation and Analysis

For the micro-RNA discovery analysis, pooled plasma from the ZDF rat samples was investigated. In detail, three plasma samples from the pre-diabetes group (PD) (6-weeks-old ZDF rats) and from animals aged 8, 11 and 17 weeks were used. Pooling was done according to insulin levels at baseline in a manner that reflects the overall mean in each pool. miRNA extraction of 150 μL pooled plasma (n = 3 pooled samples per group) was performed using the miRNeasy Serum/Plasma Kit (Qiagen, Hilden, Germany).
miRNA samples were normalized to 3.5 ng/μL and reverse-transcribed using the Megaplex Primer Rodent Pool A and the Taqman® Micro RNA Reverse Transcription Kit (Applied Biosystems by Thermo Fisher Scientific, Waltham, MA, USA) according to the manufacturer’s protocol. With content matched to Megaplex stem-looped Rodent RT primers, Megaplex PreAmp Rodent Pool A Primers are used for unbiased preamplification, as recommended by the vendor.
The expression of the miRNAs was screened using Taqman® Fast Advanced MasterMix (Applied Biosystems) and the rodent Taqman® miRNA Array, Card A V.2.0 (Applied Biosystems). The gene expression analysis was run on a SDS7900HT real-time PCR system (Applied Biosystems by Thermo Fisher Scientific); raw Ct (cycle threshold) values were calculated using the SDS software v2.4 (Applied Biosystems by Thermo Fisher Scientific) with automatic baseline and threshold settings. Data were normalized to global mean Ct. miRNAs with Ct values >32/undetermined were excluded. At least two of three replicates had to fulfill this criterion to be considered in the relative expression computation (2−∆∆Ct, comparative Ct method) [65].

4.3. Data Analysis

Data was analyzed using R Version 3.0.1 (R Core Team, 2013, Vienna, Austria). The Bioconductor package HTqSeq v1.16.0 [66] was used to QC the data. Data were normalized using global mean normalization [67], only taking into account miRNAs with Ct < 35 for global mean calculation. For further analysis, only those miRNAs with raw Ct < 32 in at least two samples of at least one group were considered. For differential expression analysis, limma v3.18.13 [68] was applied. Fold changes comparing week 8 versus baseline (week 6), week 11 versus baseline, as well as week 17 versus baseline are reported. p-values are the false discovery rate (FDR) adjusted as proposed by Benjamini and Hochberg [69]. miRNAs displaying an adjusted moderated F-statistic p-value ≤0.05 are considered significantly altered in the ANOVA (Figure 5). For group-wise comparisons, miRNAs are considered significantly changed if the respective fold change ≥2 and adjusted p-value ≤0.05 (Figure 4).

Supplementary Materials

Supplementary materials can be found at https://0-www-mdpi-com.brum.beds.ac.uk/1422-0067/17/5/665/s1.

Acknowledgments

The animal study was funded by Boehringer Ingelheim Pharma GmbH & Co. KG and was performed at Bêtagenex (Laval, Québec, Canada).

Author Contributions

Rolf Grempler, Denis Delic, Gerd Luippold and Eric Mayoux conceived of and designed the experiments. Claudia Eisele performed the experiments. Ramona Schmid, Rolf Grempler and Denis Delic analyzed the data. Rolf Grempler, Denis Delic, Eric Mayoux, Gerd Luippold, Claudia Eisele and Ramona Schmid wrote the paper.

Conflicts of Interest

The authors are employees of Boehringer Ingelheim Pharma GmbH & Co. KG.

Abbreviations

ACEAngiotensin-converting enzyme
ARBAngiotensin receptor blocker
BCFB cell failure
CADCoronary artery disease
EndMTEndothelial to mesenchymal transition
FDRFalse discovery rate
HIHyperinsulinemia
LSDLate-stage diabetes
miRNAMicro-RNA
MTPNMyotrophin
NASHNon-alcoholic steatohepatitis
PCAPrincipal component analysis
PDPre-diabetes
PDK-1Phosphoinositide-dependent protein kinase 1
SOCS3Suppressor of cytokine signaling 3
T2DType 2 diabetes
ZDFZucker diabetic fatty rats
CtCycle threshhold
DPP-4iDipeptidyl peptidase-4 inhibitors
HFD-miceHigh fat diet-fed mice
SGLT2iSodium-dependent glucose cotransporter-2 inhibitors
GLP-1aGlucagon-like peptide-1 analogues
NOD miceNon-obese diabetic mice
PMIDPubMed Identifier

References

  1. Wild, S.; Roglic, G.; Green, A.; Sicree, R.; King, H. Global prevalence of diabetes: estimates for the year 2000 and projections for 2030. Diabetes Care 2004, 27, 1047–1053. [Google Scholar] [CrossRef] [PubMed]
  2. Mathers, C.D.; Loncar, D. Projections of global mortality and burden of disease from 2002 to 2030. PLoS Med. 2006, 3, e442. [Google Scholar] [CrossRef] [PubMed]
  3. UK Prospective Diabetes Study Group. U.K. Prospective Diabetes Study 16: Overview of 6 Years’ Therapy of Type II Diabetes: A Progressive Disease; U.K. Prospective Diabetes Study Group: Oxford, UK, 1995; Volume 44, pp. 1249–1258. [Google Scholar]
  4. Klein, R. Hyperglycemia and microvascular and macrovascular disease in diabetes. Diabetes Care 1995, 18, 258–268. [Google Scholar] [CrossRef] [PubMed]
  5. Bartel, D.P. MicroRNAs: Genomics, biogenesis, mechanism, and function. Cell 2004, 116, 281–297. [Google Scholar] [CrossRef]
  6. Guo, H.; Ingolia, N.T.; Weissman, J.S.; Bartel, D.P. Mammalian microRNAs predominantly act to decrease target mRNA levels. Nature 2010, 466, 835–840. [Google Scholar] [CrossRef] [PubMed] [Green Version]
  7. Tsui, N.B.; Ng, E.K.; Lo, Y.M. Stability of endogenous and added RNA in blood specimens, serum, and plasma. Clin. Chem. 2002, 48, 1647–1653. [Google Scholar] [PubMed]
  8. Wang, K.; Zhang, S.; Marzolf, B.; Troisch, P.; Brightman, A.; Hu, Z.; Hood, L.E.; Galas, D.J. Circulating microRNAs, potential biomarkers for drug-induced liver injury. Proc. Natl. Acad. Sci. USA 2009, 106, 4402–4407. [Google Scholar] [CrossRef] [PubMed]
  9. Weber, J.A.; Baxter, D.H.; Zhang, S.; Huang, D.Y.; Huang, K.H.; Lee, M.J.; Galas, D.J.; Wang, K. The microRNA spectrum in 12 body fluids. Clin. Chem. 2010, 56, 1733–1741. [Google Scholar] [CrossRef] [PubMed]
  10. Guay, C.; Jacovetti, C.; Nesca, V.; Motterle, A.; Tugay, K.; Regazzi, R. Emerging roles of non-coding RNAs in pancreatic β-cell function and dysfunction. Diabetes Obes. Metab. 2012, 14 (Suppl. S3), 12–21. [Google Scholar] [CrossRef] [PubMed]
  11. Poy, M.N.; Eliasson, L.; Krutzfeldt, J.; Kuwajima, S.; Ma, X.; Macdonald, P.E.; Pfeffer, S.; Tuschl, T.; Rajewsky, N.; Rorsman, P.; et al. A pancreatic islet-specific microRNA regulates insulin secretion. Nature 2004, 432, 226–230. [Google Scholar] [CrossRef] [PubMed]
  12. Li, Y.; Xu, X.; Liang, Y.; Liu, S.; Xiao, H.; Li, F.; Cheng, H.; Fu, Z. miR-375 enhances palmitate-induced lipoapoptosis in insulin-secreting NIT-1 cells by repressing myotrophin (V1) protein expression. Int. J. Clin. Exp. Pathol. 2010, 3, 254–264. [Google Scholar] [PubMed]
  13. El Ouaamari, A.; Baroukh, N.; Martens, G.A.; Lebrun, P.; Pipeleers, D.; van Obberghen, E. miR-375 targets 3ʹ-phosphoinositide-dependent protein kinase-1 and regulates glucose-induced biological responses in pancreatic β-cells. Diabetes 2008, 57, 2708–2717. [Google Scholar] [CrossRef] [PubMed]
  14. Hashimoto, N.; Kido, Y.; Uchida, T.; Asahara, S.; Shigeyama, Y.; Matsuda, T.; Takeda, A.; Tsuchihashi, D.; Nishizawa, A.; Ogawa, W.; et al. Ablation of PDK1 in pancreatic β cells induces diabetes as a result of loss of β cell mass. Nat. Genet. 2006, 38, 589–593. [Google Scholar] [CrossRef] [PubMed]
  15. Zhao, H.; Guan, J.; Lee, H.M.; Sui, Y.; He, L.; Siu, J.J.; Tse, P.P.; Tong, P.C.; Lai, F.M.; Chan, J.C. Up-regulated pancreatic tissue microRNA-375 associates with human type 2 diabetes through β-cell deficit and islet amyloid deposition. Pancreas 2010, 39, 843–846. [Google Scholar] [CrossRef] [PubMed]
  16. Poy, M.N.; Hausser, J.; Trajkovski, M.; Braun, M.; Collins, S.; Rorsman, P.; Zavolan, M.; Stoffel, M. miR-375 maintains normal pancreatic α- and β-cell mass. Proc. Natl. Acad. Sci. USA 2009, 106, 5813–5818. [Google Scholar] [CrossRef] [PubMed]
  17. Chakraborty, C.; Doss, C.G.; Bandyopadhyay, S.; Agoramoorthy, G. Influence of miRNA in insulin signaling pathway and insulin resistance: Micro-molecules with a major role in type-2 diabetes. Wiley Interdiscip. Rev. RNA 2014, 5, 697–712. [Google Scholar] [CrossRef] [PubMed]
  18. Kong, L.; Zhu, J.; Han, W.; Jiang, X.; Xu, M.; Zhao, Y.; Dong, Q.; Pang, Z.; Guan, Q.; Gao, L.; et al. Significance of serum microRNAs in pre-diabetes and newly diagnosed type 2 diabetes: A clinical study. Acta Diabetol. 2011, 48, 61–69. [Google Scholar] [CrossRef] [PubMed]
  19. Zampetaki, A.; Kiechl, S.; Drozdov, I.; Willeit, P.; Mayr, U.; Prokopi, M.; Mayr, A.; Weger, S.; Oberhollenzer, F.; Bonora, E.; et al. Plasma microRNA profiling reveals loss of endothelial miR-126 and other microRNAs in type 2 diabetes. Circ. Res. 2010, 107, 810–817. [Google Scholar] [CrossRef] [PubMed]
  20. Lovis, P.; Roggli, E.; Laybutt, D.R.; Gattesco, S.; Yang, J.Y.; Widmann, C.; Abderrahmani, A.; Regazzi, R. Alterations in microRNA expression contribute to fatty acid-induced pancreatic β-cell dysfunction. Diabetes 2008, 57, 2728–2736. [Google Scholar] [CrossRef] [PubMed]
  21. Vatandoost, N.; Amini, M.; Iraj, B.; Momenzadeh, S.; Salehi, R. Dysregulated miR-103 and miR-143 expression in peripheral blood mononuclear cells from induced prediabetes and type 2 diabetes rats. Gene 2015, 572, 95–100. [Google Scholar] [CrossRef] [PubMed]
  22. Roggli, E.; Britan, A.; Gattesco, S.; Lin-Marq, N.; Abderrahmani, A.; Meda, P.; Regazzi, R. Involvement of microRNAs in the cytotoxic effects exerted by proinflammatory cytokines on pancreatic β-cells. Diabetes 2010, 59, 978–986. [Google Scholar] [CrossRef] [PubMed]
  23. Esguerra, J.L.; Bolmeson, C.; Cilio, C.M.; Eliasson, L. Differential glucose-regulation of microRNAs in pancreatic islets of non-obese type 2 diabetes model Goto-Kakizaki rat. PLoS ONE 2011, 6, e18613. [Google Scholar] [CrossRef] [PubMed]
  24. Erener, S.; Mojibian, M.; Fox, J.K.; Denroche, H.C.; Kieffer, T.J. Circulating miR-375 as a biomarker of β-cell death and diabetes in mice. Endocrinology 2013, 154, 603–608. [Google Scholar] [CrossRef] [PubMed]
  25. Shafrir, E.; Ziv, E. A useful list of spontaneously arising animal models of obesity and diabetes. Am. J. Physiol. Endocrinol. Metab. 2009, 296, E1450–E1452. [Google Scholar] [CrossRef] [PubMed]
  26. Nesca, V.; Guay, C.; Jacovetti, C.; Menoud, V.; Peyot, M.L.; Laybutt, D.R.; Prentki, M.; Regazzi, R. Identification of particular groups of microRNAs that positively or negatively impact on β cell function in obese models of type 2 diabetes. Diabetologia 2013, 56, 2203–2212. [Google Scholar] [CrossRef] [PubMed] [Green Version]
  27. Bao, L.; Fu, X.; Si, M.; Wang, Y.; Ma, R.; Ren, X.; Lv, H. MicroRNA-185 targets SOCS3 to inhibit β-cell dysfunction in diabetes. PLoS ONE 2015, 10, e0116067. [Google Scholar] [CrossRef] [PubMed]
  28. Takiguchi, S.; Suzuki, S.; Sato, Y.; Kanai, S.; Miyasaka, K.; Jimi, A.; Shinozaki, H.; Takata, Y.; Funakoshi, A.; Kono, A.; et al. Role of CCK-A receptor for pancreatic function in mice: A study in CCK-A receptor knockout mice. Pancreas 2002, 24, 276–283. [Google Scholar] [CrossRef] [PubMed]
  29. Latreille, M.; Herrmanns, K.; Renwick, N.; Tuschl, T.; Malecki, M.T.; McCarthy, M.I.; Owen, K.R.; Rulicke, T.; Stoffel, M. miR-375 gene dosage in pancreatic β-cells: Implications for regulation of β-cell mass and biomarker development. J. Mol. Med. 2015, 93, 1159–1169. [Google Scholar] [CrossRef] [PubMed]
  30. Zhou, J.; Song, S.; Cen, J.; Zhu, D.; Li, D.; Zhang, Z. MicroRNA-375 is downregulated in pancreatic cancer and inhibits cell proliferation in vitro. Oncol. Res. 2012, 20, 197–203. [Google Scholar] [CrossRef] [PubMed]
  31. Zhou, J.; Song, S.; He, S.; Zhu, X.; Zhang, Y.; Yi, B.; Zhang, B.; Qin, G.; Li, D. MicroRNA-375 targets PDK1 in pancreatic carcinoma and suppresses cell growth through the Akt signaling pathway. Int. J. Mol. Med. 2014, 33, 950–956. [Google Scholar] [PubMed]
  32. Huang, X.; Le, Q.T.; Giaccia, A.J. MiR-210-micromanager of the hypoxia pathway. Trends Mol. Med. 2010, 16, 230–237. [Google Scholar] [CrossRef] [PubMed]
  33. Kim, J.O.; Song, D.W.; Kwon, E.J.; Hong, S.E.; Song, H.K.; Min, C.K.; Kim do, H. miR-185 plays an anti-hypertrophic role in the heart via multiple targets in the calcium-signaling pathways. PLoS ONE 2015, 10, e0122509. [Google Scholar] [CrossRef] [PubMed]
  34. Chen, J.F.; Mandel, E.M.; Thomson, J.M.; Wu, Q.; Callis, T.E.; Hammond, S.M.; Conlon, F.L.; Wang, D.Z. The role of microRNA-1 and microRNA-133 in skeletal muscle proliferation and differentiation. Nat. Genet. 2006, 38, 228–233. [Google Scholar] [CrossRef] [PubMed]
  35. Wang, G.K.; Zhu, J.Q.; Zhang, J.T.; Li, Q.; Li, Y.; He, J.; Qin, Y.W.; Jing, Q. Circulating microRNA: A novel potential biomarker for early diagnosis of acute myocardial infarction in humans. Eur. Heart J. 2010, 31, 659–666. [Google Scholar] [CrossRef] [PubMed]
  36. Horie, T.; Ono, K.; Nishi, H.; Iwanaga, Y.; Nagao, K.; Kinoshita, M.; Kuwabara, Y.; Takanabe, R.; Hasegawa, K.; Kita, T.; et al. MicroRNA-133 regulates the expression of GLUT4 by targeting KLF15 and is involved in metabolic control in cardiac myocytes. Biochem. Biophys. Res. Commun. 2009, 389, 315–320. [Google Scholar] [CrossRef] [PubMed] [Green Version]
  37. Wang, F.; Long, G.; Zhao, C.; Li, H.; Chaugai, S.; Wang, Y.; Chen, C.; Wang, D.W. Plasma microRNA-133a is a new marker for both acute myocardial infarction and underlying coronary artery stenosis. J. Transl. Med. 2013, 11, 222. [Google Scholar] [CrossRef] [PubMed]
  38. Baynes, J.; Murray, D.B. Cardiac and renal function are progressively impaired with aging in Zucker diabetic fatty type II diabetic rats. Oxid. Med. Cell. Longev. 2009, 2, 328–334. [Google Scholar] [CrossRef] [PubMed]
  39. Sayed, D.; Hong, C.; Chen, I.Y.; Lypowy, J.; Abdellatif, M. MicroRNAs play an essential role in the development of cardiac hypertrophy. Circ. Res. 2007, 100, 416–424. [Google Scholar] [CrossRef] [PubMed]
  40. Kim, J.Y.; Park, Y.K.; Lee, K.P.; Lee, S.M.; Kang, T.W.; Kim, H.J.; Dho, S.H.; Kim, S.Y.; Kwon, K.S. Genome-wide profiling of the microRNA-mRNA regulatory network in skeletal muscle with aging. Aging 2014, 6, 524–544. [Google Scholar] [CrossRef] [PubMed]
  41. Shan, Z.; Yao, C.; Li, Z.L.; Teng, Y.; Li, W.; Wang, J.S.; Ye, C.S.; Chang, G.Q.; Huang, X.L.; Li, X.X.; et al. Differentially expressed microRNAs at different stages of atherosclerosis in ApoE-deficient mice. Chin. Med. J. 2013, 126, 515–520. [Google Scholar] [PubMed]
  42. Tryndyak, V.P.; Latendresse, J.R.; Montgomery, B.; Ross, S.A.; Beland, F.A.; Rusyn, I.; Pogribny, I.P. Plasma microRNAs are sensitive indicators of inter-strain differences in the severity of liver injury induced in mice by a choline- and folate-deficient diet. Toxicol. Appl. Pharmacol. 2012, 262, 52–59. [Google Scholar] [CrossRef] [PubMed]
  43. Pirola, C.J.; Fernandez Gianotti, T.; Castano, G.O.; Mallardi, P.; San Martino, J.; Mora Gonzalez Lopez Ledesma, M.; Flichman, D.; Mirshahi, F.; Sanyal, A.J.; Sookoian, S. Circulating microRNA signature in non-alcoholic fatty liver disease: From serum non-coding RNAs to liver histology and disease pathogenesis. Gut 2015, 64, 800–812. [Google Scholar] [CrossRef] [PubMed]
  44. Cheung, O.; Puri, P.; Eicken, C.; Contos, M.J.; Mirshahi, F.; Maher, J.W.; Kellum, J.M.; Min, H.; Luketic, V.A.; Sanyal, A.J. Nonalcoholic steatohepatitis is associated with altered hepatic MicroRNA expression. Hepatology 2008, 48, 1810–1820. [Google Scholar] [CrossRef] [PubMed]
  45. Godin, J.P.; Ross, A.B.; Cleroux, M.; Pouteau, E.; Montoliu, I.; Moser, M.; Kochhar, S. Natural carbon isotope abundance of plasma metabolites and liver tissue differs between diabetic and non-diabetic Zucker diabetic fatty rats. PLoS ONE 2013, 8, e74866. [Google Scholar] [CrossRef] [PubMed]
  46. Zhang, X.; Chang, A.; Li, Y.; Gao, Y.; Wang, H.; Ma, Z.; Li, X.; Wang, B. miR-140-5p regulates adipocyte differentiation by targeting transforming growth factor-β signaling. Sci. Rep. 2015, 5. [Google Scholar] [CrossRef] [PubMed]
  47. Szocs, Z.; Brunmair, B.; Stadlbauer, K.; Nowotny, P.; Bauer, L.; Luger, A.; Furnsinn, C. Age-dependent development of metabolic derangement and effects of intervention with pioglitazone in Zucker diabetic fatty rats. J. Pharmacol. Exp. Ther. 2008, 326, 323–329. [Google Scholar] [CrossRef] [PubMed]
  48. Bagge, A.; Clausen, T.R.; Larsen, S.; Ladefoged, M.; Rosenstierne, M.W.; Larsen, L.; Vang, O.; Nielsen, J.H.; Dalgaard, L.T. MicroRNA-29a is up-regulated in β-cells by glucose and decreases glucose-stimulated insulin secretion. Biochem. Biophys. Res. Commun. 2012, 426, 266–272. [Google Scholar] [CrossRef] [PubMed]
  49. Locke, J.M.; Harries, L.W. MicroRNA expression profiling of human islets from individuals with and without type 2 diabetes: Promises and pitfalls. Biochem. Soc. Trans. 2012, 40, 800–803. [Google Scholar] [CrossRef] [PubMed]
  50. Karolina, D.S.; Tavintharan, S.; Armugam, A.; Sepramaniam, S.; Pek, S.L.; Wong, M.T.; Lim, S.C.; Sum, C.F.; Jeyaseelan, K. Circulating miRNA profiles in patients with metabolic syndrome. J. Clin. Endocrinol. Metab. 2012, 97, E2271–E2276. [Google Scholar] [CrossRef] [PubMed]
  51. Zhu, H.; Leung, S.W. Identification of microRNA biomarkers in type 2 diabetes: A meta-analysis of controlled profiling studies. Diabetologia 2015, 58, 900–911. [Google Scholar] [CrossRef] [PubMed]
  52. McDonald, J.S.; Milosevic, D.; Reddi, H.V.; Grebe, S.K.; Algeciras-Schimnich, A. Analysis of circulating microRNA: Preanalytical and analytical challenges. Clin. Chem. 2011, 57, 833–840. [Google Scholar] [CrossRef] [PubMed]
  53. Duttagupta, R.; Jiang, R.; Gollub, J.; Getts, R.C.; Jones, K.W. Impact of cellular miRNAs on circulating miRNA biomarker signatures. PLoS ONE 2011, 6, e20769. [Google Scholar] [CrossRef] [PubMed]
  54. Vandesompele, J.; de Preter, K.; Pattyn, F.; Poppe, B.; Van Roy, N.; de Paepe, A.; Speleman, F. Accurate normalization of real-time quantitative RT-PCR data by geometric averaging of multiple internal control genes. Genome Biol. 2002, 3, 1–12. [Google Scholar] [CrossRef] [Green Version]
  55. Andersen, C.L.; Jensen, J.L.; Orntoft, T.F. Normalization of real-time quantitative reverse transcription-PCR data: a model-based variance estimation approach to identify genes suited for normalization, applied to bladder and colon cancer data sets. Cancer Res. 2004, 64, 5245–5250. [Google Scholar] [CrossRef] [PubMed]
  56. Smith-Vikos, T.; Slack, F.J. MicroRNAs and their roles in aging. J. Cell Sci. 2012, 125, 7–17. [Google Scholar] [CrossRef] [PubMed]
  57. Hamrick, M.W.; Herberg, S.; Arounleut, P.; He, H.Z.; Shiver, A.; Qi, R.Q.; Zhou, L.; Isales, C.M.; Mi, Q.S. The adipokine leptin increases skeletal muscle mass and significantly alters skeletal muscle miRNA expression profile in aged mice. Biochem. Biophys. Res. Commun. 2010, 400, 379–383. [Google Scholar] [CrossRef] [PubMed]
  58. Maes, O.C.; An, J.; Sarojini, H.; Wang, E. Murine microRNAs implicated in liver functions and aging process. Mech. Ageing Dev. 2008, 129, 534–541. [Google Scholar] [CrossRef] [PubMed]
  59. Li, N.; Muthusamy, S.; Liang, R.; Sarojini, H.; Wang, E. Increased expression of miR-34a and miR-93 in rat liver during aging, and their impact on the expression of Mgst1 and Sirt1. Mech. Ageing Dev. 2011, 132, 75–85. [Google Scholar] [CrossRef] [PubMed]
  60. Li, X.; Khanna, A.; Li, N.; Wang, E. Circulatory miR34a as an RNAbased, noninvasive biomarker for brain aging. Aging 2011, 3, 985–1002. [Google Scholar] [CrossRef] [PubMed]
  61. Olivieri, F.; Bonafe, M.; Spazzafumo, L.; Gobbi, M.; Prattichizzo, F.; Recchioni, R.; Marcheselli, F.; La Sala, L.; Galeazzi, R.; Rippo, M.R.; et al. Age- and glycemia-related miR-126-3p levels in plasma and endothelial cells. Aging 2014, 6, 771–787. [Google Scholar] [CrossRef] [PubMed]
  62. Ortega, F.J.; Mercader, J.M.; Moreno-Navarrete, J.M.; Rovira, O.; Guerra, E.; Esteve, E.; Xifra, G.; Martinez, C.; Ricart, W.; Rieusset, J.; et al. Profiling of circulating microRNAs reveals common microRNAs linked to type 2 diabetes that change with insulin sensitization. Diabetes Care 2014, 37, 1375–1383. [Google Scholar] [CrossRef] [PubMed]
  63. Arunachalam, G.; Lakshmanan, A.P.; Samuel, S.M.; Triggle, C.R.; Ding, H. Molecular interplay between microRNA-34a and sirtuin1 in hyperglycemia-mediated impaired angiogenesis in endothelial cells: Effects of metformin. J. Pharmacol. Exp. Ther. 2016, 356, 314–323. [Google Scholar] [CrossRef] [PubMed]
  64. Kanasaki, K.; Shi, S.; Kanasaki, M.; He, J.; Nagai, T.; Nakamura, Y.; Ishigaki, Y.; Kitada, M.; Srivastava, S.P.; Koya, D. Linagliptin-mediated DPP-4 inhibition ameliorates kidney fibrosis in streptozotocin-induced diabetic mice by inhibiting endothelial-to-mesenchymal transition in a therapeutic regimen. Diabetes 2014, 63, 2120–2131. [Google Scholar] [CrossRef] [PubMed]
  65. Livak, K.J.; Schmittgen, T.D. Analysis of relative gene expression data using real-time quantitative PCR and the 2−∆∆Ct Method. Methods 2001, 25, 402–408. [Google Scholar] [CrossRef] [PubMed]
  66. Dvinge, H.; Bertone, P. HTqPCR: High-throughput analysis and visualization of quantitative real-time PCR data in R. Bioinformatics 2009, 25, 3325–3326. [Google Scholar] [CrossRef] [PubMed]
  67. D’haene, B.; Mestdagh, P.; Hellemans, J.; Vandesompele, J. miRNA expression profiling: From reference genes to global mean normalization. Methods Mol. Biol. 2012, 822, 261–272. [Google Scholar] [PubMed]
  68. Smyth, G.K.; Michaud, J.; Scott, H.S. Use of within-array replicate spots for assessing differential expression in microarray experiments. Bioinformatics 2005, 21, 2067–2075. [Google Scholar] [CrossRef] [PubMed]
  69. Benjamini, Y.; Drai, D.; Elmer, G.; Kafkafi, N.; Golani, I. Controlling the false discovery rate in behavior genetics research. Behav. Brain Res. 2001, 125, 279–284. [Google Scholar] [CrossRef]
Figure 1. Development and progression of type 2 diabetes in ZDF rats from six weeks of age to 17 weeks of age. (A) Body weight; (B) fasting plasma insulin; (C) HOMA-β; (D) fasting plasma glucose; and (E) HbA1c were measured weekly following a 2-h food deprivation. Results are expressed as the mean ± SEM.
Ijms 17 00665 g001
Figure 2. Principal component analysis. Displayed are the first three major components from the principal component analysis for each replicate per time point: PD = pre-diabetes; HI = hyperinsulinemia; BCF = β cell failure; LSD = late-stage diabetes.
Ijms 17 00665 g002
Figure 3. Venn diagram. Numbers of altered miRNAs at hyperinsulinemia (HI), β cell failure (BCF) and late-stage diabetes (LSD) are summarized. Overlaps represent those miRNAs that are significantly changed at more than one time point.
Ijms 17 00665 g003
Figure 4. Significantly-altered circulating miRNAs (fold-change >2; p < 0.05) at individual time points during disease progression at hyperinsulinemia (HI), β cell failure (BCF) and late-stage diabetes (LSD) analyzed by qRT-PCR. Log2-fold changes of increased or decreased miRNA species at HI, BCF and LSD are indicated. Each time point was compared to the baseline (week 6 of age).
Ijms 17 00665 g004
Figure 5. Significantly-altered miRNAs during disease progression. Relative expression is given as the fold increase to baseline (PD). Significant differences to baseline are indicated by * (p < 0.05). Values represent the mean ± SEM.
Ijms 17 00665 g005
Table 1. Pathophysiological roles of deregulated miRNAs.
miRNAFC Week 2p-ValueFC Week 5p-ValueFC Week 11p-ValueFDRFunctionTarget mRNAPMID
Increased miRNA level
miR-133a7.360.0417.140.01828.540.0010.009abundantly expressed in heart; regulates expression of GLUT4 by targeting KLF15 and is involved in metabolic control in cardiac myocytesKLF15
IGF1R
19720047
miR-3751.460.7372.230.3748.840.0070.028abundantly expressed in pancreas; involved in pancreas development and β cell functionMTPN
PDK
15538371
miR-2100.920.881.770.424.320.0190.032involved in β cell dysfunctionHIF1α23842730
miR-1222.990.377.240.0152.790.1040.029liver-specific miRNA involved in cholesterol biosynthesis pathway; upregulated miRNA level in non-alcoholic steatohepatitis patients (NASH patients)HMGCR
AMPKα1
16258535
Decreased miRNA level
miR-434-3p1.860.6390.140.0180.340.1180.013decreased expression in aged mouse skeletal muscle; downregulated during progression of atherosclerosis25063768
23422117
miR-2030.180.0090.170.0180.280.0150.013downregulation of miR-203 results in increased β cell apoptosisTNFα23842730
miR-151-3p1.450.7371.10.8530.220.0340.029regulates slow muscle gene expressionATP2A225200835
miR-1850.930.8850.550.4310.140.0070.02targets suppressor of cytokine signalling 3 (SOCS3) to inhibit β cell dysfunction in diabetesSOCS325658748
miR-450a0.360.3590.170.0160.110.0060.013involved in the insulin secretion pathwayCCKAR
miR-1400.360.6120.270.1390.080.0070.028surgery-induced (but not diet-induced) weight loss led to a marked decrease of miR-140SMAD323396142
FC = fold change; FDR = false discovery rate; PMID = PubMed Identifier.

