
Morphometric Analysis of Recognized Genes for Autism Spectrum Disorders and Obesity in Relationship to the Distribution of Protein-Coding Genes on Human Chromosomes


Abstract
:
1. Introduction
2. Results and Discussion
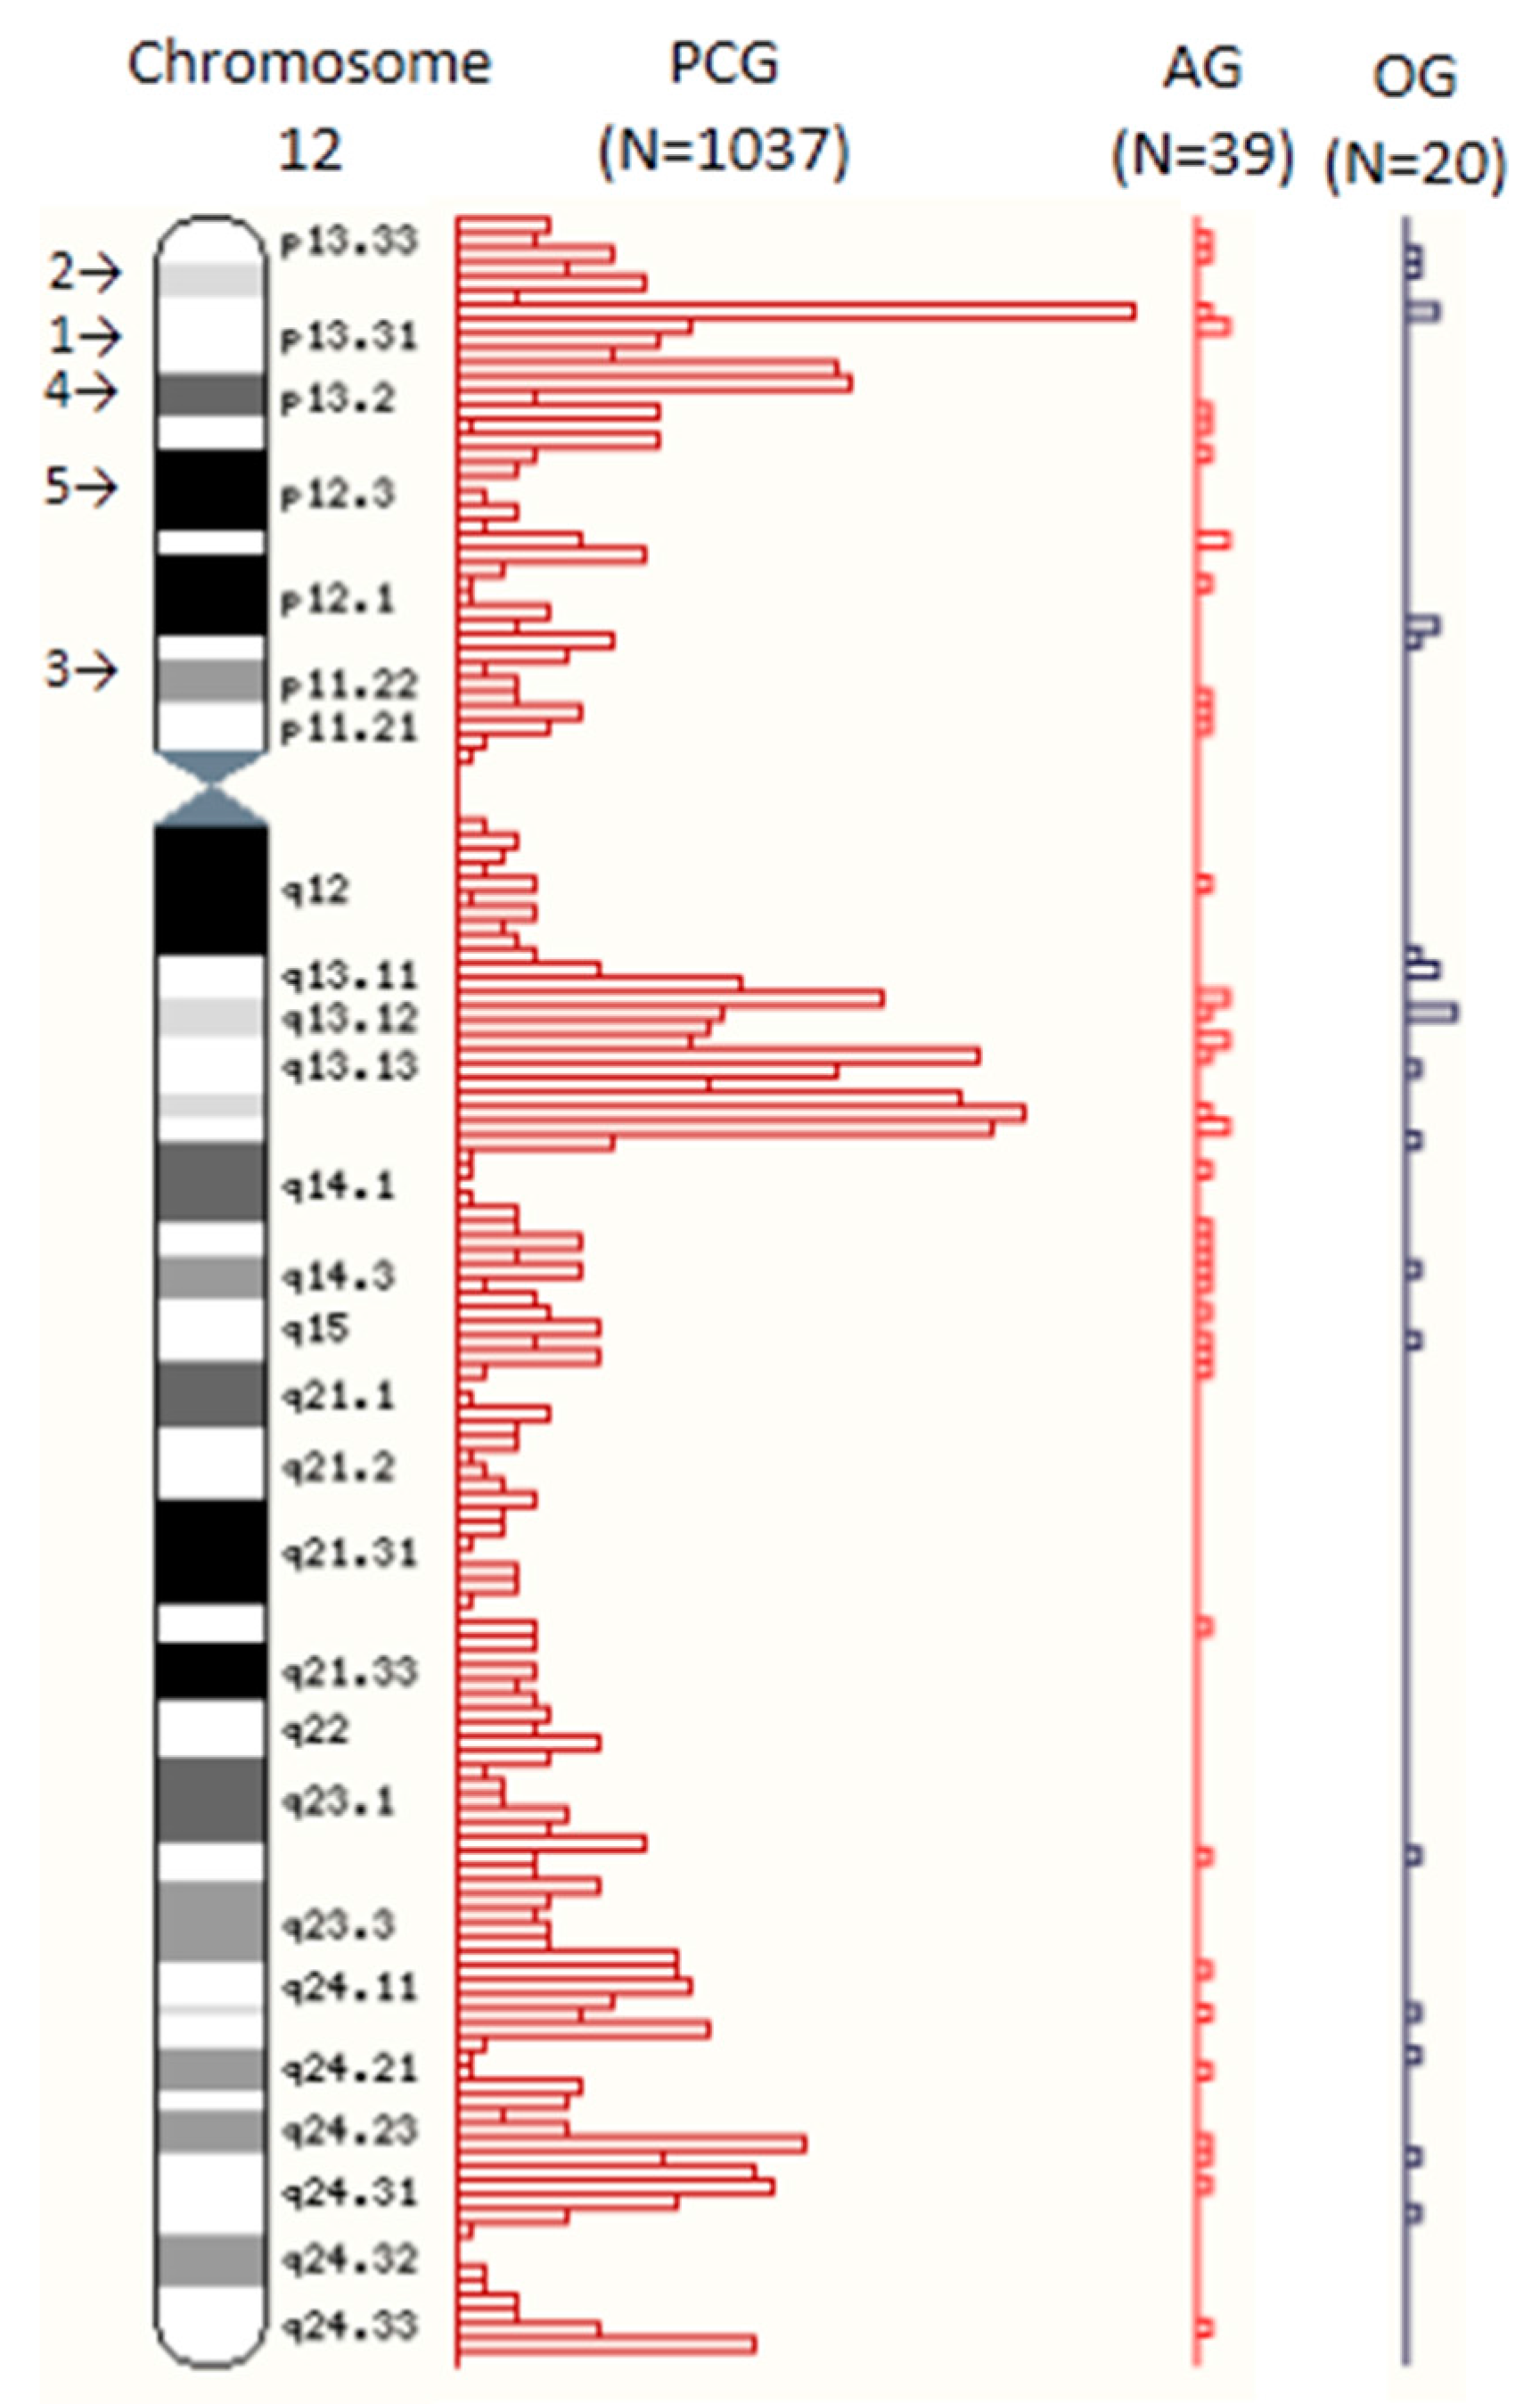
2.1. Gene Distributions
2.2. Chromatin Subtyping by Giemsa Band Intensity and Fragile Sites
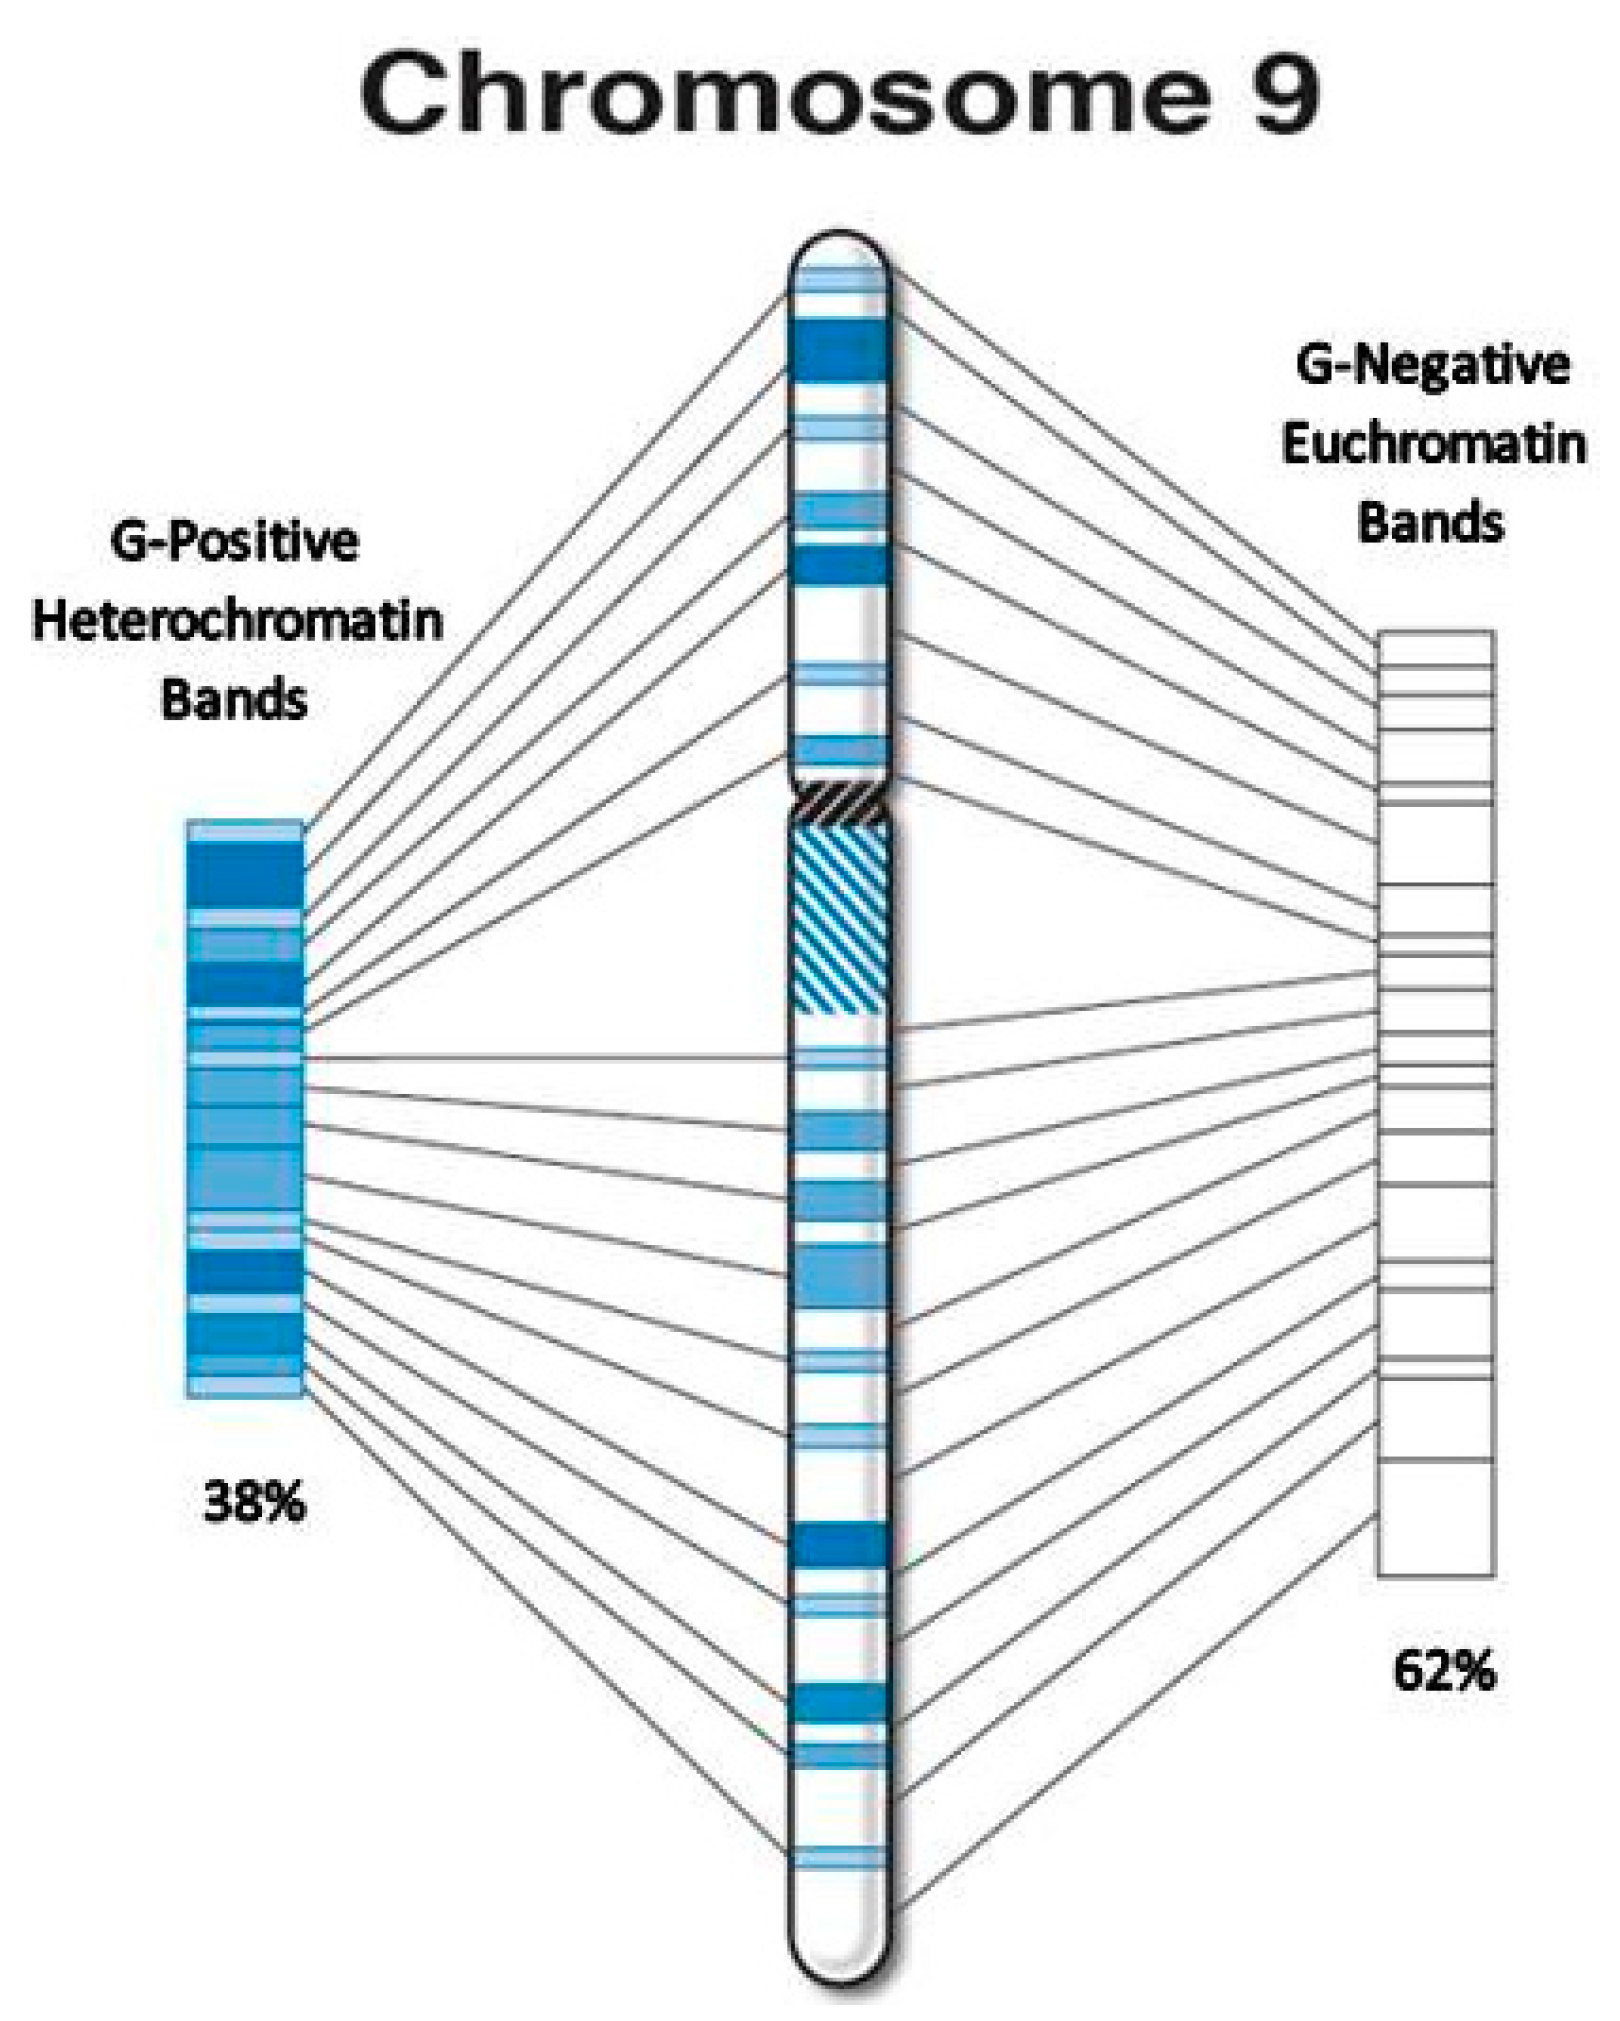
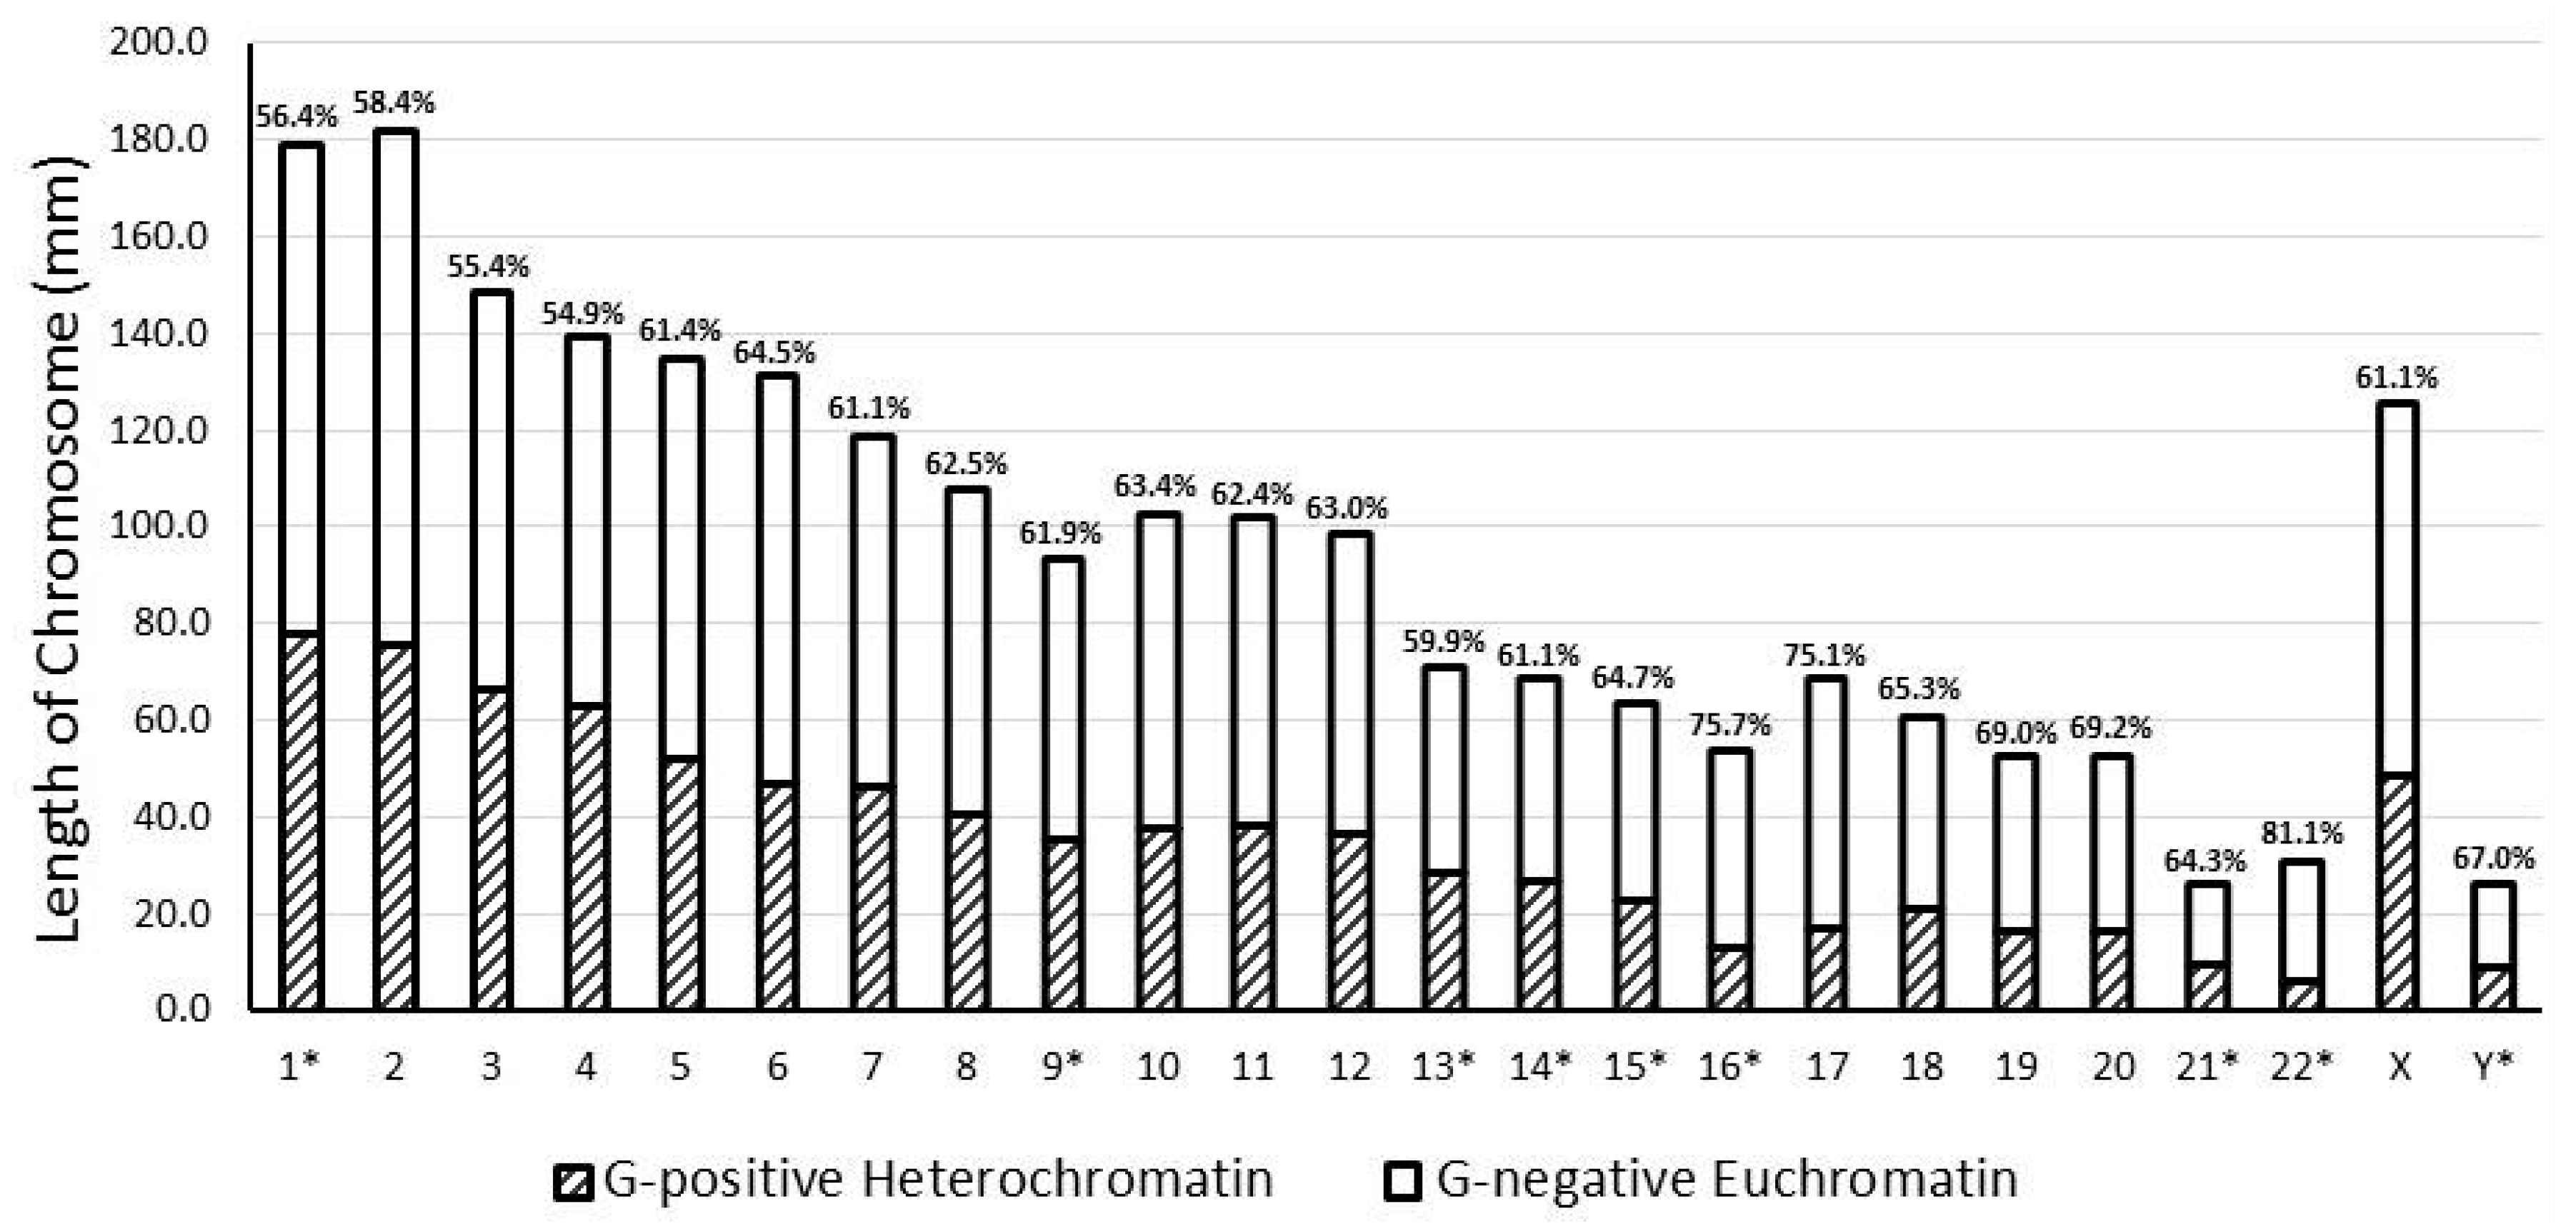
2.2.1. Chromatin Subtyping
2.2.2. Fragile Sites
3. Experimental Section
4. Conclusions
Acknowledgments
Author Contributions
Conflicts of Interest
Abbreviations
| ASD | Autism Spectrum Disorder |
| AT | Adenine-Thymine |
| CFS | Chromosome Fragile Sites |
| df | Degrees of Freedom |
| DNA | Deoxyribonucleic Acid |
| GC | Guanine-Cytosine |
| ISCN | International Society of Chromosome Nomenclature |
| OMIM | Online Inheritance of Man |
References
- Oberdoerffer, P.; Sinclair, D.A. The role of nuclear architecture in genomic instability and ageing. Nat. Rev. Mol. Cell Biol. 2007, 8, 692–702. [Google Scholar] [CrossRef] [PubMed]
- Zhang, Y.; Máté, G.; Müller, P.; Hillebrandt, S.; Krufczik, M.; Bach, M.; Kaufmann, R.; Hausmann, M.; Heermann, D.W. Radiation induced chromatin conformation changes analysed by fluorescent localization microscopy, statistical physics, and graph theory. PLoS ONE 2015, 10, e0128555. [Google Scholar] [CrossRef] [PubMed]
- Annunziato, A. DNA packaging: Nucleosomes and chromatin. Nat. Educ. 2008, 1, 26. [Google Scholar]
- Mello, M.L.S. Cytochemical properties of euchromatin and heterochromatin. Histochem. J. 1983, 15, 739–751. [Google Scholar] [CrossRef] [PubMed]
- Murakami, Y. Heterochromatin and Euchromatin. In Encyclopedia of Systems Biology; Dubitzky, W., Wolkenhauer, O., Yokota, H., Cho, K., Yokota, H., Eds.; Springer: New York, NY, USA, 2013; pp. 881–884. [Google Scholar]
- Hsieh, T.; Fischer, R.L. Biology of chromatin dynamics. Annu. Rev. Plant Biol. 2005, 56, 327–351. [Google Scholar] [CrossRef] [PubMed]
- Clamp, M.; Fry, B.; Kamal, M.; Xie, X.; Cuff, J.; Lin, M.F.; Kellis, M.; Lindblad-Toh, K.; Lander, E.S. Distinguishing protein-coding and noncoding genes in the human genome. Proc. Natl. Acad. Sci. USA 2007, 104, 19428–19433. [Google Scholar] [CrossRef] [PubMed]
- Harrow, J.; Nagy, A.; Reymond, A.; Alioto, T.; Patthy, L.; Antonarakis, S.E.; Guigó, R. Identifying protein-coding genes in genomic sequences. Genome Biol. 2009, 10. [Google Scholar] [CrossRef] [PubMed]
- Brown, T.; Robertson, F.W.; Dawson, B.M.; Hanlin, S.J.; Page, B.M. Individual variation of centric heterochromatin in man. Hum. Genet. 1980, 55, 367–373. [Google Scholar] [CrossRef] [PubMed]
- Kwon, S.H.; Workman, J.L. The changing faces of HP1: From heterochromatin formation and gene silencing to euchromatic gene expression. Bioessays 2011, 33, 280–289. [Google Scholar] [CrossRef] [PubMed]
- Belmont, A.S.; Dietzel, S.; Nye, A.C.; Strukov, Y.G.; Tumbar, T. Large scale chromatin structure and function. Curr. Opin. Cell Biol. 1999, 11, 307–311. [Google Scholar] [CrossRef]
- Fraser, F.C.; Nora, J. Genetics of Man; Lea and Febiger: Philadelphia, PA, USA, 1986. [Google Scholar]
- Dimitri, P.; Caizzi, R.; Giordano, E.; Carmela Accardo, M.; Lattanzi, G.; Biamonti, G. Constitutive heterochromatin: A surprising variety of expressed sequences. Chromosoma 2009, 118, 419–435. [Google Scholar] [CrossRef] [PubMed]
- Strachan, T.; Read, A. Human Molecular Genetics. Organization of the Human Genome. In Human Molecular Genetics, 4th ed.; Owen, E., Ed.; Garland Science: New York, NY, USA, 2010; pp. 255–295. [Google Scholar]
- Grewal, S.; Jia, S. Heterochromatin revisited. Nat. Rev. Genet. 2007, 8, 35–46. [Google Scholar] [CrossRef] [PubMed]
- Yasuhara, J.C.; Wakimoto, B.T. Oxymoron no more: The expanding world of heterochromatic genes. Trends Genet. 2006, 22, 330–338. [Google Scholar] [CrossRef] [PubMed]
- Trojer, P.; Reinberg, D. Facultative heterochromatin: Is there a distinctive molecular signature? Mol. Cell 2007, 28, 1–13. [Google Scholar] [CrossRef] [PubMed]
- Shaffer, L.G.; McGowan-Jordan, J.; Schmid, M. ISCN (2013): An International System for Human Cytogenetic Nomenclature; S Karger: Basel, Switzerland, 2013. [Google Scholar]
- Saccone, S.; Federico, C.; Solovei, I.; Croquette, M.F.; della Valle, G.; Bernardi, G. Identification of the gene-richest bands in human prometaphase chromosomes. Chromosome Res. 1999, 7, 379–386. [Google Scholar] [CrossRef] [PubMed]
- Whole Genome. Ensembl. Available online: http://uswest.ensembl.org/Homo_sapiens/Location/Genome?redirect=no (accessed on 20 December 2014).
- Flicek, P.; Amode, M.R.; Barrell, D.; Beal, K.; Billis, K.; Brent, S.; Carvalho-Silva, D.; Clapham, P.; Coates, G.; Fitzgerald, S.; et al. Ensembl 2014. Nucleic Acids Res. 2014, 42, D749–D755. [Google Scholar] [CrossRef] [PubMed]
- Ogden, C.L.; Carroll, M.D.; Curtin, L.R.; McDowell, M.A.; Tabak, C.J.; Flegal, K.M. Prevalence of overweight and obesity in the United States, 1999–2004. JAMA 2006, 295, 1549–1555. [Google Scholar] [CrossRef] [PubMed]
- Wingate, M.; Kirby, R.S.; Pettygrove, S.; Cunniff, C.; Schulz, E.; Ghosh, T.; Yeargin-Allsopp, M. Prevalence of autism spectrum disorder among children aged 8 years-autism and developmental disabilities monitoring network, 11 sites, United States, 2010. MMWR Surveill. Summ. 2014, 63, 1–21. [Google Scholar]
- Herman, G.E.; Henninger, N.; Ratliff-Schaub, K.; Pastore, M.; Fitzgerald, S.; McBride, K.L. Genetic testing in autism: How much is enough? Genet. Med. 2007, 9, 268–274. [Google Scholar] [CrossRef] [PubMed]
- Fagnani, C.; Silventoinen, K.; McGue, M.; Korkeila, M.; Christensen, K.; Rissanen, A.; Kaprio, J. Genetic influences on growth traits of BMI: A longitudinal study of adult twins. Obesity 2008, 16, 847–852. [Google Scholar]
- Butler, M.G.; McGuire, A.M.; Manzardo, A.M. Clinically relevant known and candidate genes for obesity and their overlap with human infertility and reproduction. J. Assist. Reprod. Genet. 2015, 32, 495–508. [Google Scholar] [CrossRef] [PubMed]
- Butler, M.G.; Rafi, S.K.; Manzardo, A.M. High-resolution chromosome ideogram representation of currently recognized genes for autism spectrum disorders. Int. J. Mol. Sci. 2015, 16, 6464–6495. [Google Scholar] [CrossRef] [PubMed]
- Rice, C. Prevalence of autism spectrum disorders-autism and developmental disabilities monitoring network, United States, 2006. MMWR Surveill. Summ. 2009, 58, 3–8. [Google Scholar]
- Marshall, C.R.; Noor, A.; Vincent, J.B.; Lionel, A.C.; Feuk, L.; Skaug, J.; Shago, M.; Moessner, R.; Pinto, D.; Ren, Y.; et al. Structural variation of chromosomes in autism spectrum disorder. Am. J. Hum. Genet. 2008, 82, 477–488. [Google Scholar] [CrossRef] [PubMed]
- Comings, D.E. Mechanism of chromosome banding and implications for chromosome structure. Annu. Rev. Genet. 1978, 12, 25–46. [Google Scholar] [CrossRef] [PubMed]
- Sumner, A.T. The nature and mechanisms of chromosome-banding. Cancer Genet. Cytogenet. 1982, 6, 59–87. [Google Scholar] [CrossRef]
- Wittekind, D.H.; Gehring, T. On the nature of Romanowsky-Giemsa staining and the Romanowsky-Giemsa effect. I. Model experiments on the specificity of Azure B-Eosin Y stain as compared with other thiazine dye-Eosin Y combinations. Histochem. J. 1985, 17, 263–289. [Google Scholar] [CrossRef] [PubMed]
- Bickmore, W.A. Karyotype Analysis and chromosome banding. eLS 2001. [Google Scholar] [CrossRef]
- Holmquist, G.P. Chromosome bands, their chromatin flavors, and their functional features. Am. J. Hum. Genet. 1992, 51, 17–37. [Google Scholar] [PubMed]
- Drouin, R.; Lemieux, N.; Richer, C.L. Chromosome condensation from prophase to late metaphase: Relationship to chromosome bands and their replication time. Cytogenet. Cell Genet. 1991, 57, 91–99. [Google Scholar] [CrossRef] [PubMed]
- Kosyakova, N.; Wiese, A.; Mrasek, K.; Claussen, U.; Leihr, T.; Nelle, H. The hierarchically organized splitting of chromosomal bands for all human chromosomes. Mol. Cytogenet. 2009, 2. [Google Scholar] [CrossRef] [PubMed]
- Wang, J.; Lunyak, V.V.; Jordan, I.K. Genome-wide prediction and analysis of human chromatin boundary elements. Nucleic Acid Res. 2012, 40, 511–529. [Google Scholar] [CrossRef] [PubMed]
- Fungtammasan, A.; Walsh, E.; Chiaromonte, F.; Eckert, K.A.; Makova, K.D. A genome-wide analysis of common fragile sites: What features determine chromosomal instability in the human genome? Genome Res. 2012, 22, 993–1005. [Google Scholar] [CrossRef] [PubMed]
- Butler, M.G. Frequency and distribution of chromosome fragile sites or lesions in males with mental retardation: A descriptive study. J. Tenn. Acad. Sci. 1998, 73, 87–99. [Google Scholar]
- Mrasek, K.; Schoder, C.; Teichmann, A.C.; Behr, K.; Franze, B.; Wilhelm, K.; Blaurock, N.; Claussen, U.; Liehr, T.; Weise, A. Global screening and extended nomenclature for 230 aphidicolin-inducible fragile sites, including 61 yet unreported ones. Int. J. Oncol. 2010, 36, 929–940. [Google Scholar] [PubMed]
- Smith, C.L.; Bolton, A.; Nguyen, G. Genomic and epigenomic instability, fragile sites, schizophrenia and autism. Curr. Genom. 2010, 11, 447–469. [Google Scholar] [CrossRef] [PubMed]
- Nazki, F.H.; Sameer, A.S.; Ganaie, B.A. Folate: Metabolism, genes, polymorphisms and the associated diseases. Gene 2014, 533, 11–20. [Google Scholar] [CrossRef] [PubMed]
- Thys, R.G.; Lehman, C.E.; Pierce, L.C.; Wang, Y.H. DNA secondary structure at chromosomal fragile sites in human disease. Curr. Genom. 2015, 16, 60–70. [Google Scholar] [CrossRef] [PubMed]
- Dillon, N.; Festenstein, R. Unravelling heterochromatin: Competition between positive and negative factors regulates accessibility. Trends Genet. 2002, 18, 252–258. [Google Scholar] [CrossRef]
- Rougeulle, C.; Chaumeil, J.; Sarma, K.; Allis, C.D.; Reinberg, D.; Avner, P.; Heard, E. Differential histone H3 lys-9 and lys-27 methylation profiles on the X chromosome. Mol. Cell. Biol. 2004, 24, 5475–5484. [Google Scholar] [CrossRef] [PubMed]
- Lan, L.; Nakajima, S.; Wei, L.; Sun, L.; Hsieh, C.L.; Sobol, R.W.; Bruchez, M.; van Houten, B.; Yasui, A.; Levine, A.S. Novel method for site-specific induction of oxidative DNA damage reveals differences in recruitment of repair proteins to heterochromatin and euchromatin. Nucleic Acids Res. 2013, 42, 2330–2345. [Google Scholar] [CrossRef] [PubMed]
- Sims, R.J.; Nishioka, K.; Reinberg, D. Histone lysine methylation: A signature for chromatin function. Trends Genet. 2003, 19, 629–639. [Google Scholar] [CrossRef] [PubMed]
- Ijdo, J.W.; Baldini, A.; Ward, D.C.; Reeders, S.T.; Wells, R.A. Origin of human chromosome 2: An ancestral telomere-telomere fusion. Proc. Natl. Acad. Sci. USA 1991, 88, 9051–9055. [Google Scholar] [CrossRef] [PubMed]
- Yunis, J.J.; Prakash, O. The origin of man: A chromosomal pictorial legacy. Science 1982, 215, 1525–1530. [Google Scholar] [CrossRef] [PubMed]
- Skawiński, W.; Parcheta, B. Polymorphism of the human Y chromosome: The evaluation of the correlation between the DNA content and the size of the heterochromatin and euchromatin. Clin. Genet. 1984, 25, 125–130. [Google Scholar] [CrossRef] [PubMed]
- Manzardo, A.M.; Henkhaus, R.S.; Butler, M.G. Global DNA promoter methylation in frontal cortex of alcoholics and controls. Gene 2012, 498, 5–12. [Google Scholar] [CrossRef] [PubMed]
- Schroeder, D.I.; Lott, P.; Korf, I.; LaSalle, J.M. Large-scale methylation domains mark a functional subset of neuronally expressed genes. Genome Res. 2011, 21, 1583–1591. [Google Scholar] [CrossRef] [PubMed]
- Roadmap Epigenomics Consortium. Integrative analysis of 111 reference human epigenomes. Nature 2015, 518, 317–330. [Google Scholar]


| Chromosome | Number of Bands | Total Length (mm) | % of Total Length of all Chromosomes | Total Euchromatin Length (mm) | % Euchromatin | Total Heterochromatin Length (mm) | % Heterochromatin | Ratio of Euchromatin/Heterochromatin |
|---|---|---|---|---|---|---|---|---|
| 1 * | 62 | 178.9 | 8.0 | 101.0 | 56.4 | 78.0 | 43.6 | 1.30 |
| 2 | 62 | 182.0 | 8.1 | 106.3 | 58.4 | 75.7 | 41.6 | 1.40 |
| 3 | 59 | 148.8 | 6.6 | 82.4 | 55.4 | 66.4 | 44.6 | 1.24 |
| 4 | 45 | 139.5 | 6.2 | 76.5 | 54.9 | 62.9 | 45.1 | 1.22 |
| 5 | 45 | 134.9 | 6.0 | 82.8 | 61.4 | 52.1 | 38.6 | 1.59 |
| 6 | 48 | 131.2 | 5.9 | 84.6 | 64.5 | 46.6 | 35.5 | 1.81 |
| 7 | 42 | 118.9 | 5.3 | 72.6 | 61.1 | 46.2 | 38.9 | 1.57 |
| 8 | 38 | 107.9 | 4.8 | 67.5 | 62.5 | 40.4 | 37.5 | 1.67 |
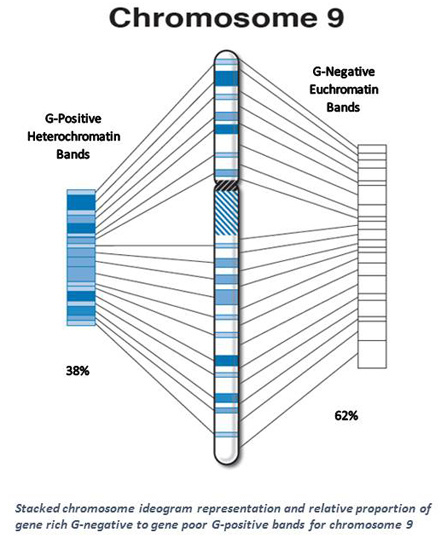
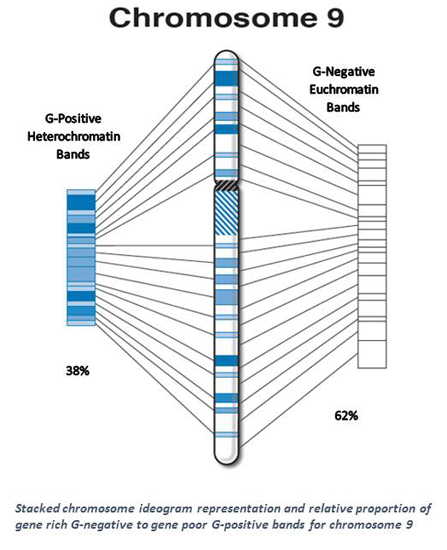
| 9 * | 38 | 93.6 | 4.2 | 58.0 | 61.9 | 35.6 | 38.1 | 1.63 |
| 10 | 40 | 102.9 | 4.6 | 65.2 | 63.4 | 37.7 | 36.6 | 1.73 |
| 11 | 34 | 102.1 | 4.6 | 63.7 | 62.4 | 38.4 | 37.6 | 1.66 |
| 12 | 39 | 98.8 | 4.4 | 62.3 | 63.0 | 36.6 | 37.0 | 1.70 |
| 13 * | 31 | 71.1 | 3.2 | 42.6 | 59.9 | 28.6 | 40.1 | 1.49 |
| 14 * | 27 | 68.6 | 3.1 | 41.9 | 61.1 | 26.7 | 38.9 | 1.57 |
| 15 * | 27 | 63.7 | 2.8 | 41.2 | 64.7 | 22.5 | 35.3 | 1.83 |
| 16 * | 22 | 54.0 | 2.4 | 40.9 | 75.7 | 13.1 | 24.3 | 3.11 |
| 17 | 22 | 68.7 | 3.1 | 51.6 | 75.1 | 17.1 | 24.9 | 3.02 |
| 18 | 18 | 60.5 | 2.7 | 39.5 | 65.3 | 21.0 | 34.7 | 1.88 |
| 19 | 15 | 52.4 | 2.3 | 36.2 | 69.0 | 16.3 | 31.1 | 2.22 |
| 20 | 18 | 52.8 | 2.4 | 36.6 | 69.2 | 16.3 | 30.8 | 2.25 |
| 21 * | 9 | 25.9 | 1.2 | 16.7 | 64.3 | 9.3 | 35.7 | 1.80 |
| 22 * | 11 | 30.8 | 1.4 | 25.0 | 81.1 | 5.8 | 18.9 | 4.28 |
| X | 38 | 125.3 | 5.6 | 76.6 | 61.1 | 48.7 | 38.9 | 1.57 |
| Y * | 8 | 26.4 | 1.2 | 17.7 | 67.0 | 8.7 | 33.0 | 2.03 |
| Total/Average | 798 | 2239.7 | 100.0 | 1389.1 | 56.4 | 850.7 | 43.6 | 1.63 |
| Chromosome | PCG Sum | % of Total PCG | PCG in Eu | % of PCG in Eu | PCG in Het | % of PCG in Het | AG Sum | % of Total AG | AG in Eu | % of AG in Eu | AG in Het | % of AG in Het | OG Sum | % of Total OG | OG in Eu | % of OG in Eu | OG in Het | % of OG in Het |
|---|---|---|---|---|---|---|---|---|---|---|---|---|---|---|---|---|---|---|
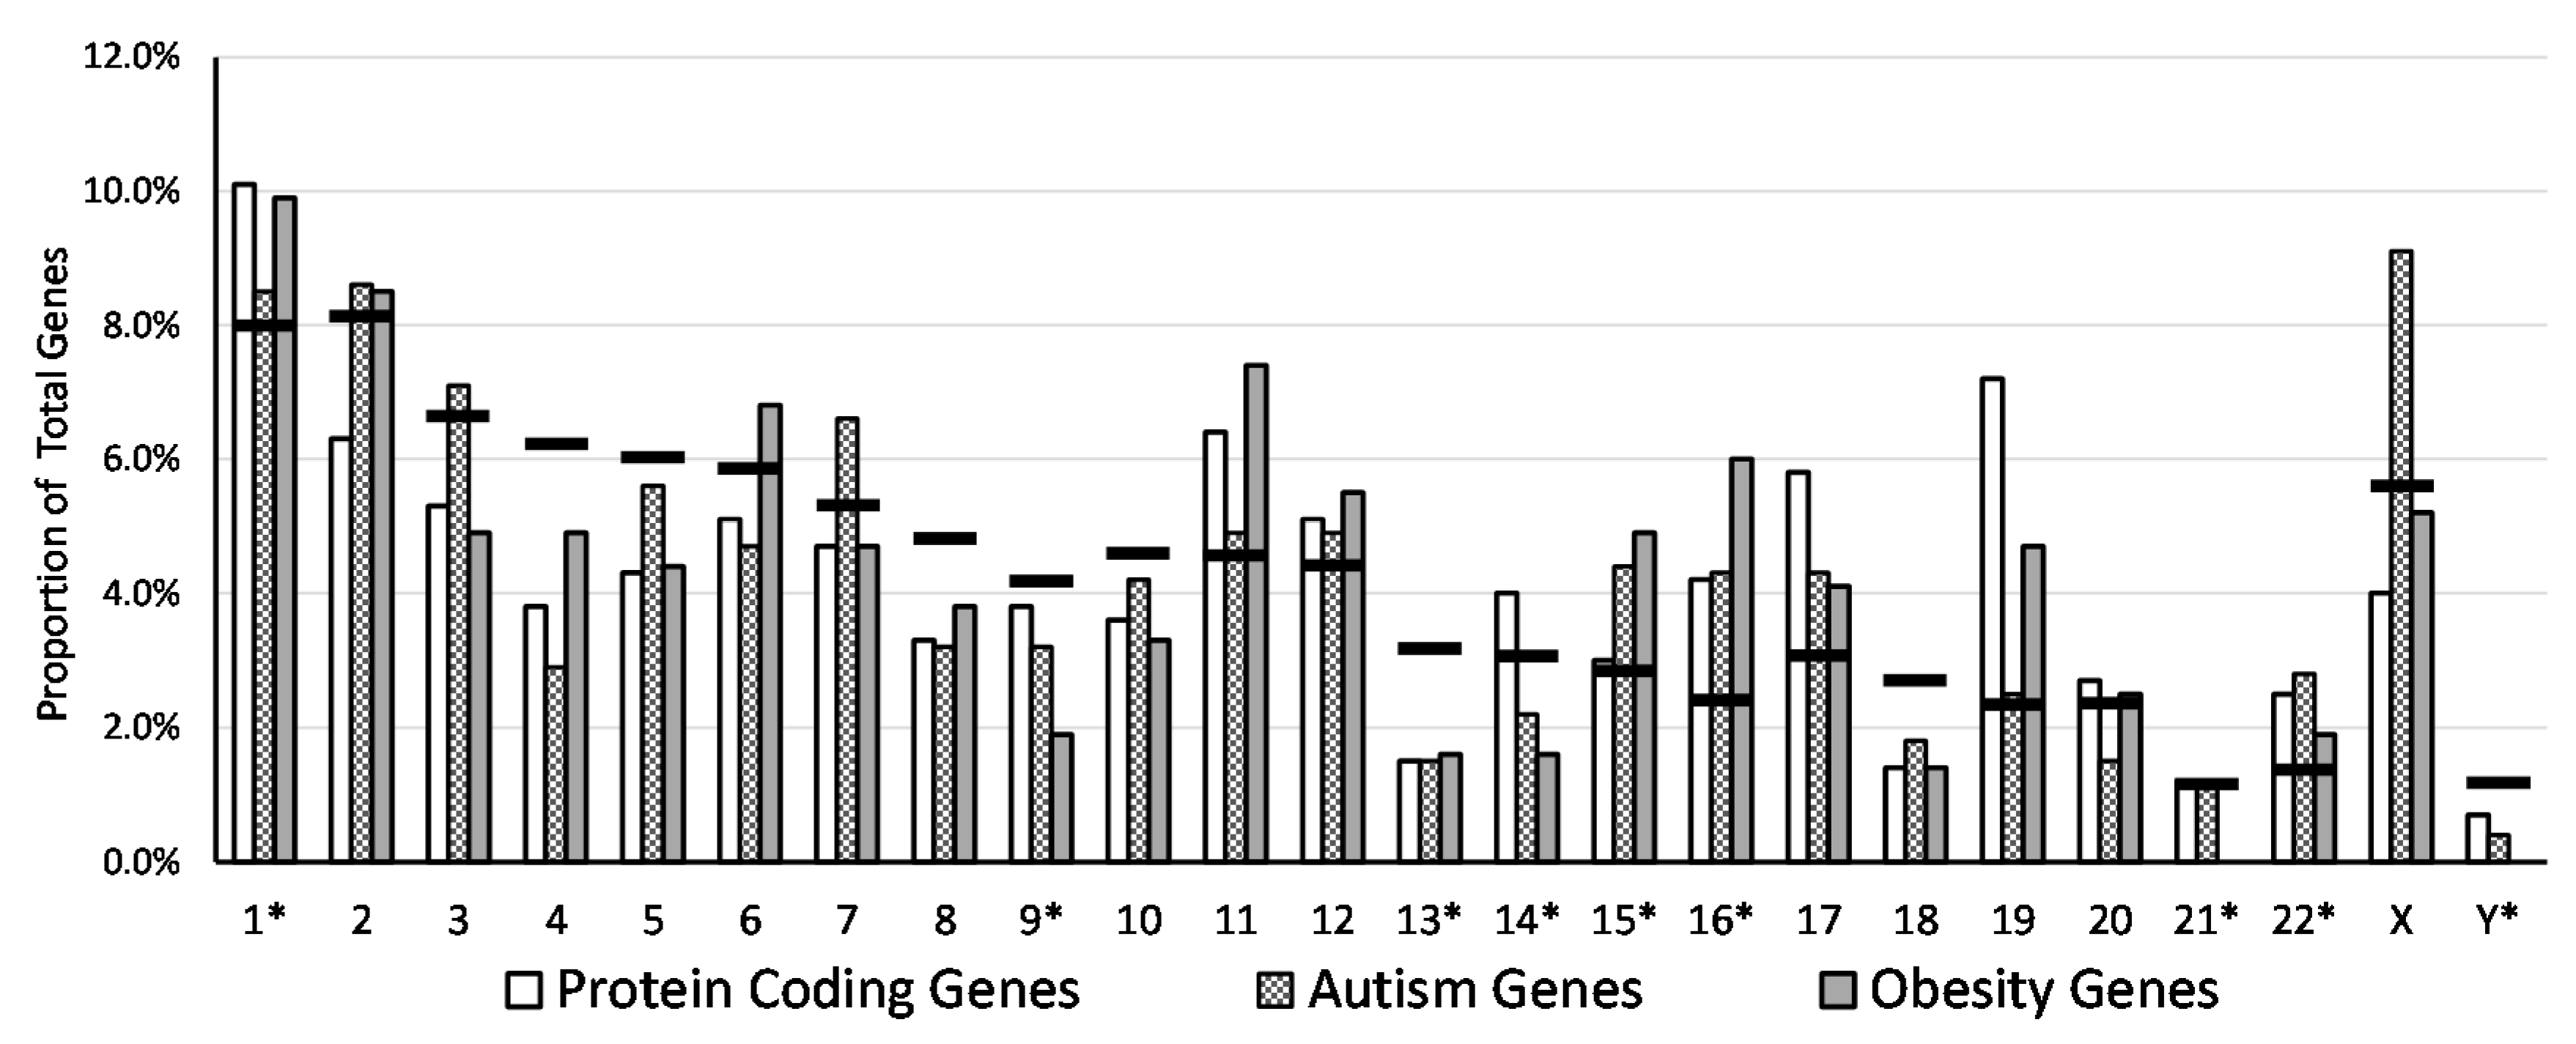
| 1 * | 2056 | 10.1 | 1259 | 61.2 | 797 | 38.8 | 67 | 8.5 | 32 | 47.8 | 35 | 52.2 | 36 | 9.9 | 19 | 52.8 | 17 | 47.2 |
| 2 | 1255 | 6.3 | 867 | 69.1 | 388 | 30.9 | 68 | 8.6 | 40 | 58.8 | 28 | 41.2 | 31 | 8.5 | 19 | 61.3 | 12 | 38.7 |
| 3 | 1069 | 5.3 | 623 | 58.3 | 446 | 41.7 | 55 | 7.1 | 28 | 50.9 | 27 | 49.1 | 18 | 4.9 | 11 | 61.1 | 7 | 38.9 |
| 4 | 763 | 3.8 | 467 | 61.2 | 296 | 38.8 | 23 | 2.9 | 16 | 69.6 | 7 | 30.4 | 18 | 4.9 | 12 | 66.7 | 6 | 33.3 |
| 5 | 864 | 4.3 | 513 | 59.4 | 351 | 40.6 | 44 | 5.6 | 29 | 65.9 | 15 | 34.1 | 16 | 4.4 | 12 | 75.0 | 4 | 25.0 |
| 6 | 1041 | 5.1 | 520 | 50.0 | 521 | 50.0 | 36 | 4.7 | 13 | 36.1 | 23 | 63.9 | 25 | 6.8 | 13 | 52.0 | 12 | 48.0 |
| 7 | 962 | 4.7 | 655 | 68.1 | 307 | 31.9 | 52 | 6.6 | 27 | 51.9 | 25 | 48.1 | 17 | 4.7 | 10 | 58.8 | 7 | 41.2 |
| 8 | 662 | 3.3 | 409 | 61.8 | 253 | 38.2 | 25 | 3.2 | 17 | 68.0 | 8 | 32.0 | 14 | 3.8 | 7 | 50.0 | 7 | 50.0 |
| 9 * | 769 | 3.8 | 529 | 68.8 | 240 | 31.2 | 25 | 3.2 | 17 | 68.0 | 8 | 32.0 | 7 | 1.9 | 5 | 71.4 | 2 | 28.6 |
| 10 | 737 | 3.6 | 401 | 54.4 | 336 | 45.6 | 33 | 4.2 | 15 | 45.5 | 18 | 54.5 | 12 | 3.3 | 5 | 41.7 | 7 | 58.3 |
| 11 | 1284 | 6.4 | 590 | 46.0 | 694 | 54.0 | 39 | 4.9 | 24 | 61.5 | 15 | 38.5 | 27 | 7.4 | 16 | 59.3 | 11 | 40.7 |
| 12 | 1037 | 5.1 | 610 | 58.8 | 427 | 41.2 | 39 | 4.9 | 25 | 64.1 | 14 | 35.9 | 20 | 5.5 | 14 | 70.0 | 6 | 30.0 |
| 13 * | 311 | 1.5 | 181 | 58.2 | 130 | 41.8 | 12 | 1.5 | 6 | 50.0 | 6 | 50.0 | 6 | 1.6 | 2 | 33.3 | 4 | 66.7 |
| 14 * | 807 | 4.0 | 550 | 68.2 | 257 | 31.8 | 17 | 2.2 | 8 | 47.1 | 9 | 52.9 | 6 | 1.6 | 4 | 66.7 | 2 | 33.3 |
| 15 * | 604 | 3.0 | 340 | 56.3 | 264 | 43.7 | 35 | 4.4 | 20 | 57.1 | 15 | 42.9 | 18 | 4.9 | 12 | 66.7 | 6 | 33.3 |
| 16 * | 852 | 4.2 | 622 | 73.0 | 230 | 27.0 | 34 | 4.3 | 23 | 67.6 | 11 | 32.4 | 22 | 6.0 | 12 | 54.5 | 10 | 45.5 |
| 17 | 1176 | 5.8 | 696 | 59.2 | 480 | 40.8 | 34 | 4.3 | 26 | 76.5 | 8 | 23.5 | 15 | 4.1 | 13 | 86.7 | 2 | 13.3 |
| 18 | 278 | 1.4 | 170 | 61.2 | 108 | 38.8 | 14 | 1.8 | 9 | 64.3 | 5 | 35.7 | 5 | 1.4 | 4 | 80.0 | 1 | 20.0 |
| 19 | 1422 | 7.2 | 708 | 49.8 | 714 | 50.2 | 20 | 2.5 | 10 | 50.0 | 10 | 50.0 | 17 | 4.7 | 6 | 35.3 | 11 | 64.7 |
| 20 | 539 | 2.7 | 337 | 62.5 | 202 | 37.5 | 12 | 1.5 | 6 | 50.0 | 6 | 50.0 | 9 | 2.5 | 5 | 55.6 | 4 | 44.4 |
| 21 * | 221 | 1.2 | 157 | 71.0 | 64 | 29.0 | 9 | 1.1 | 5 | 55.6 | 4 | 44.4 | 0 | 0.0 | 0 | 0.0 | 0 | 0.0 |
| 22 * | 487 | 2.5 | 301 | 61.8 | 186 | 38.2 | 22 | 2.8 | 17 | 77.3 | 5 | 22.7 | 7 | 1.9 | 2 | 28.6 | 5 | 71.4 |
| X | 811 | 4.0 | 503 | 62.0 | 308 | 38.0 | 72 | 9.1 | 40 | 55.6 | 32 | 44.4 | 19 | 5.2 | 8 | 42.1 | 11 | 57.9 |
| Y * | 138 | 0.7 | 75 | 54.3 | 63 | 45.7 | 3 | 0.4 | 2 | 66.7 | 1 | 33.3 | 0 | 0.0 | 0 | 0.0 | 0 | 0.0 |
| Total/Average | 20,145 | 100.0 | 12,083 | 60.0 | 8062 | 40.0 | 790 | 100.0 | 455 | 57.6 | 335 | 42.4 | 365 | 100.0 | 211 | 57.8 | 154 | 42.2 |
| Chromatin Type | Number of Bands | PCG Sum | % of Total PCG | AG Sum | % of Total AG | OG Sum | % of Total OG |
|---|---|---|---|---|---|---|---|
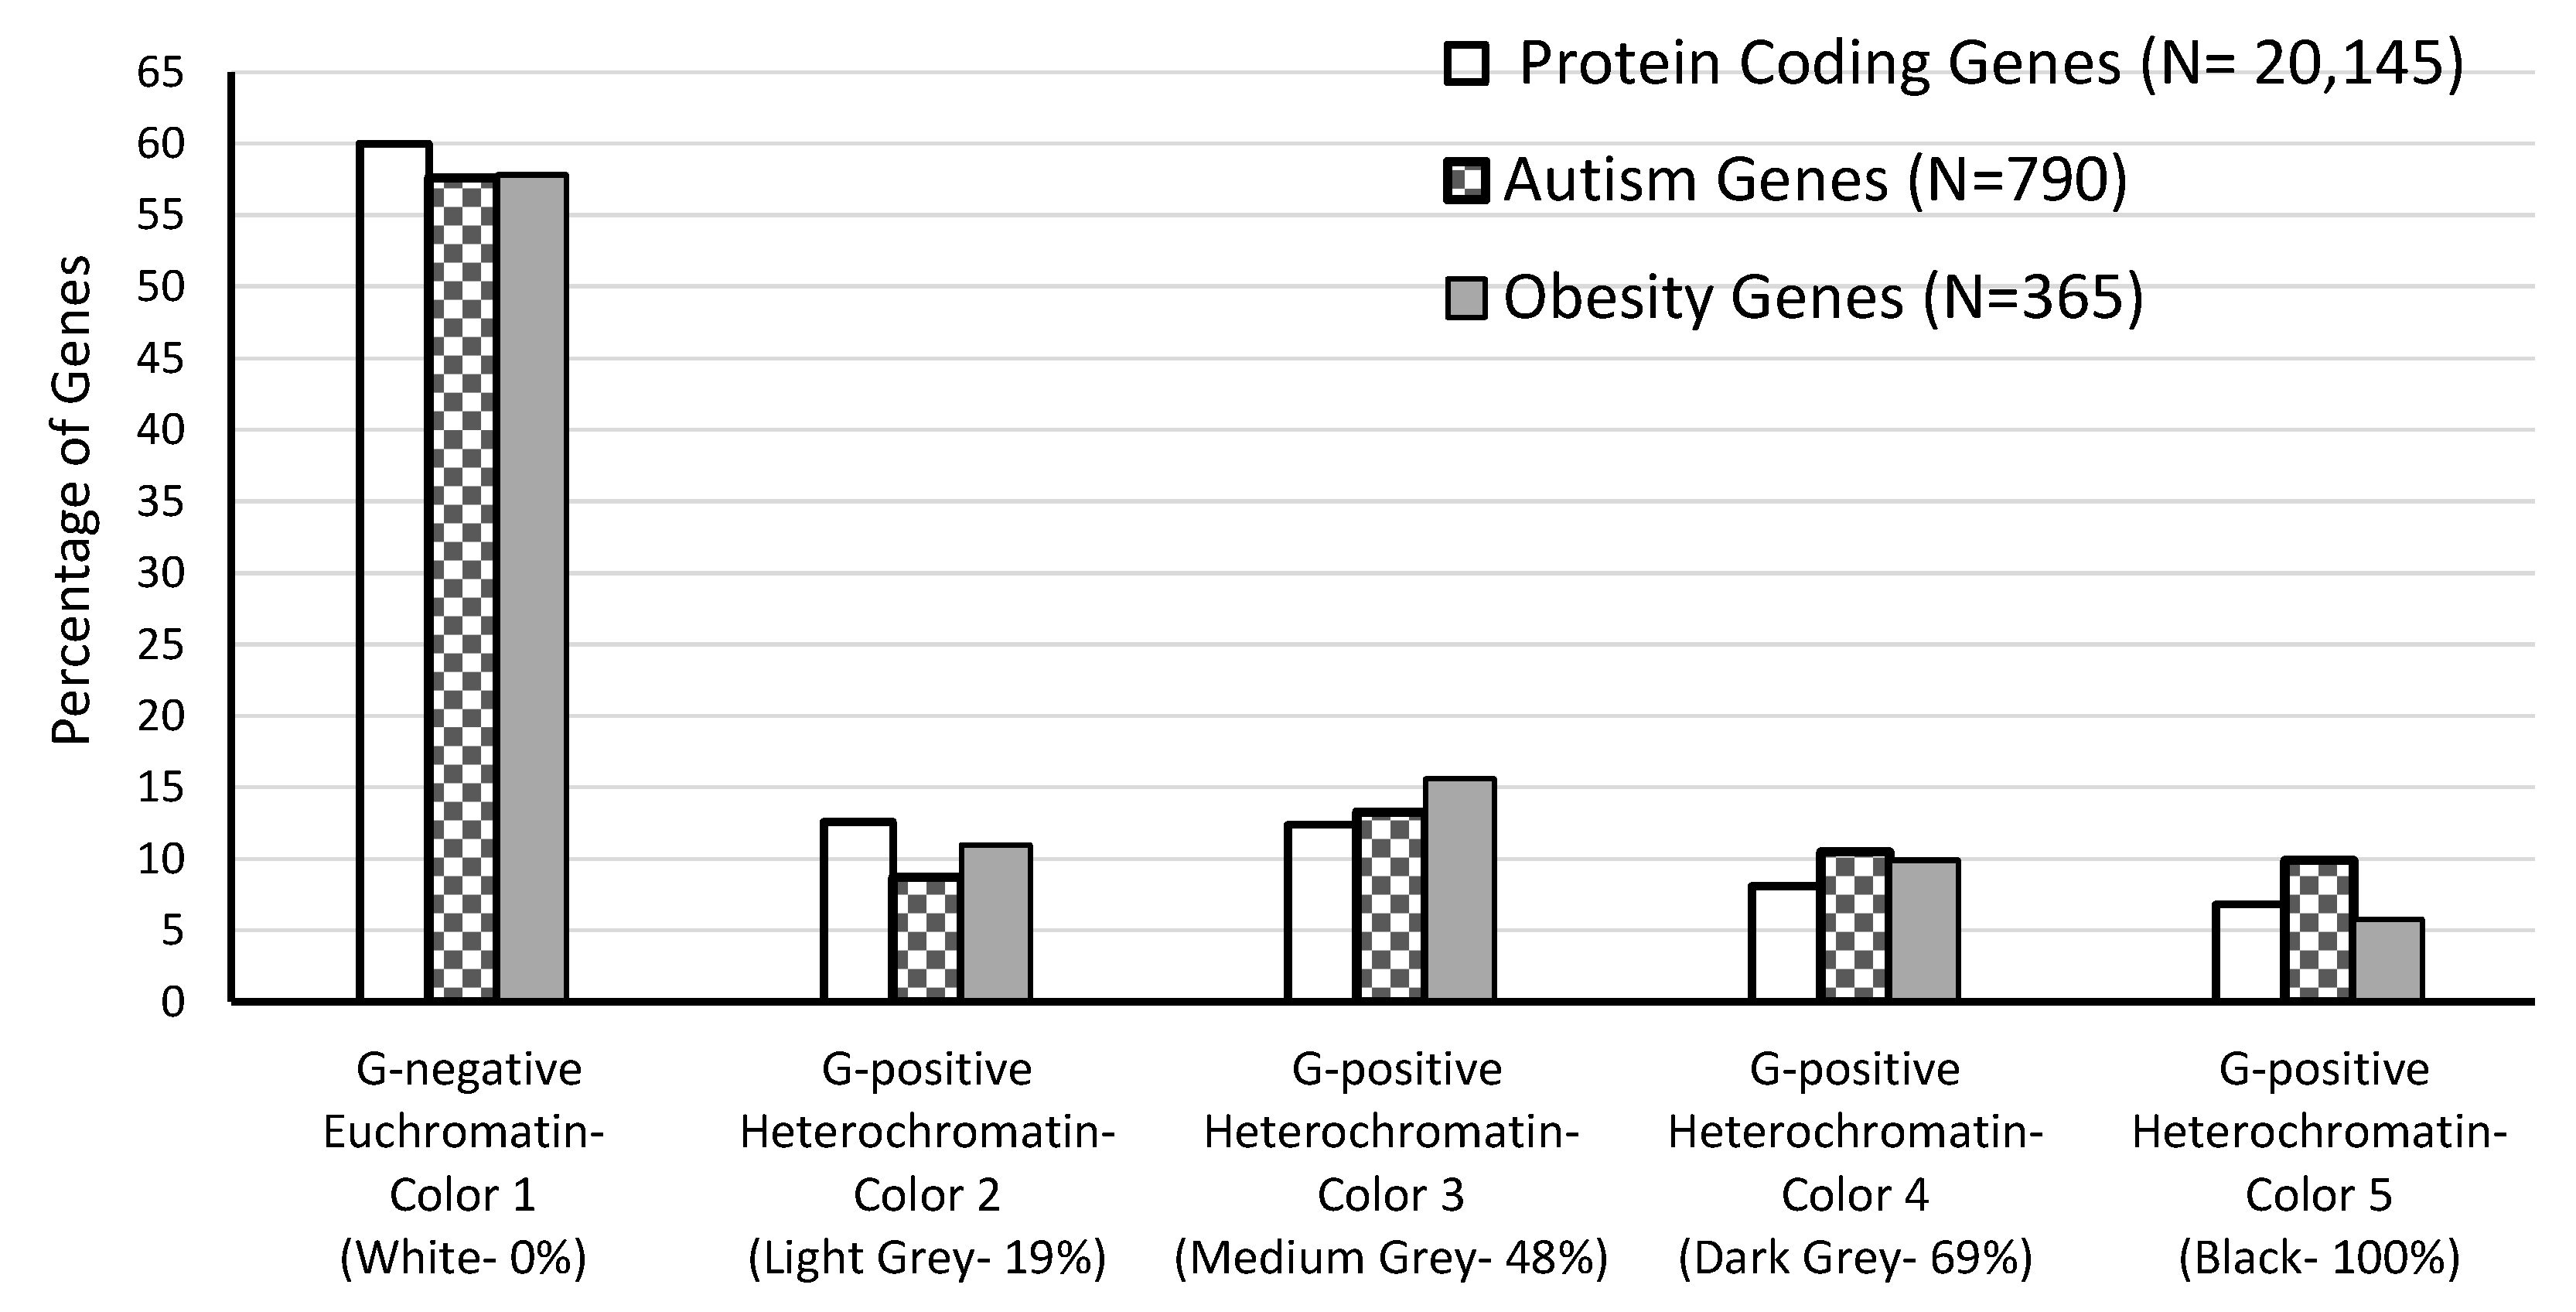
| G-negative Euchromatin (Color 1) | 417 | 12,083 | 60.0 | 455 | 57.6 | 211 | 57.8 |
| G-positive Heterochromatin (Colors 2–5) | 381 | 8062 | 40.0 | 335 | 42.4 | 154 | 42.2 |
| Heterochromatin-Color 2 | 89 | 2547 | 12.6 | 69 | 8.7 | 40 | 11.0 |
| Heterochromatin-Color 3 | 123 | 2499 | 12.4 | 105 | 13.3 | 57 | 15.6 |
| Heterochromatin-Color 4 | 88 | 1638 | 8.1 | 83 | 10.5 | 36 | 9.9 |
| Heterochromatin-Color 5 | 81 | 1378 | 6.8 | 78 | 9.9 | 21 | 5.8 |
| Total | 798 | 20,145 | 100.0 | 790 | 100.0 | 365 | 100.0 |
| Group | G-Negative Euchromatin Band | G-Positive Heterochromatin Bands | ||||||||
|---|---|---|---|---|---|---|---|---|---|---|
| Color 1 | Color 2 | Color 3 | Color 4 | Color 5 | ||||||
| Number of Genes | Percentage (z-Score) | Number of Genes | Percentage (z-Score) | Number of Genes | Percentage (z-Score) | Number of Genes | Percentage (z-Score) | Number of Genes | Percentage (z-Score) | |
| ASD | 455 | −3.8 (−0.82) | 69 | −30 (−2.97) * | 105 | +6.4 (+0.63) | 83 | +27.4 (+2.21) * | 78 | +42.4 (+3.14) * |
| Obesity | 211 | −3.4 (−0.51) | 40 | −12.1 (−0.82) | 57 | +25 (+1.69) | 36 | +19.6 (+1.07) | 21 | −17 (−0.86) |
| PCG | 12,083 | +0.2 (+0.23) | 2547 | +1.4 (+0.7) | 2499 | −0.7 (−0.35) | 1638 | −1.4 (−0.58) | 1378 | −1.4 (−0.51) |
| Chromosome | Length Rank | Ratio of Euchromatin/Heterochromatin | PCG Number Rank | AG Number Rank | OG Number Rank |
|---|---|---|---|---|---|
| 1 * | 2 | 1.30 | 1 | 3 | 1 |
| 2 | 1 | 1.40 | 4 | 2 | 2 |
| 3 | 3 | 1.24 | 6 | 4 | 8 |
| 4 | 4 | 1.22 | 15 | 16 | 9 |
| 5 | 5 | 1.59 | 10 | 6 | 13 |
| 6 | 6 | 1.81 | 7 | 9 | 4 |
| 7 | 8 | 1.57 | 9 | 5 | 11 |
| 8 | 9 | 1.67 | 12 | 14 | 15 |
| 9 * | 13 | 1.63 | 14 | 15 | 18 |
| 10 | 10 | 1.73 | 16 | 13 | 16 |
| 11 | 11 | 1.66 | 3 | 7 | 3 |
| 12 | 12 | 1.70 | 8 | 8 | 6 |
| 13 * | 14 | 1.49 | 21 | 21 | 20 |
| 14 * | 15 | 1.57 | 13 | 19 | 21 |
| 15 * | 17 | 1.83 | 18 | 10 | 10 |
| 16 * | 19 | 3.11 | 11 | 11 | 5 |
| 17 | 16 | 3.02 | 5 | 12 | 14 |
| 18 | 18 | 1.88 | 22 | 20 | 22 |
| 19 | 21 | 2.22 | 2 | 18 | 12 |
| 20 | 20 | 2.25 | 19 | 22 | 17 |
| 21 * | 23 | 1.80 | 23 | 23 | 23 |
| 22 * | 22 | 4.28 | 20 | 17 | 19 |
| X | 7 | 1.57 | 12 | 1 | 7 |
| Y * | 24 | 2.03 | 24 | 24 | 24 |
© 2016 by the authors; licensee MDPI, Basel, Switzerland. This article is an open access article distributed under the terms and conditions of the Creative Commons Attribution (CC-BY) license (http://creativecommons.org/licenses/by/4.0/).
Share and Cite
McGuire, A.B.; Rafi, S.K.; Manzardo, A.M.; Butler, M.G. Morphometric Analysis of Recognized Genes for Autism Spectrum Disorders and Obesity in Relationship to the Distribution of Protein-Coding Genes on Human Chromosomes. Int. J. Mol. Sci. 2016, 17, 673. https://0-doi-org.brum.beds.ac.uk/10.3390/ijms17050673
McGuire AB, Rafi SK, Manzardo AM, Butler MG. Morphometric Analysis of Recognized Genes for Autism Spectrum Disorders and Obesity in Relationship to the Distribution of Protein-Coding Genes on Human Chromosomes. International Journal of Molecular Sciences. 2016; 17(5):673. https://0-doi-org.brum.beds.ac.uk/10.3390/ijms17050673
Chicago/Turabian StyleMcGuire, Austen B., Syed K. Rafi, Ann M. Manzardo, and Merlin G. Butler. 2016. "Morphometric Analysis of Recognized Genes for Autism Spectrum Disorders and Obesity in Relationship to the Distribution of Protein-Coding Genes on Human Chromosomes" International Journal of Molecular Sciences 17, no. 5: 673. https://0-doi-org.brum.beds.ac.uk/10.3390/ijms17050673