1. Introduction
Characterizing the expressional levels of microRNA (miR) in various tissues and cell lines, and under different conditions, is increasingly performed by microarrays and quantitative PCR (qPCR) on purified miR [
1]. The choice of one or more housekeeping genes or miRs for normalization of qPCR data is crucial to avoid potential technical bias. The choice of suitable mRNAs or miRs for normalization should be carefully selected and validated for the specific sample type and experimental conditions to ensure the stable expression of these between sample groups and thereby correct normalization and data processing [
2,
3,
4]. Here, we use miR quantification from the insulin-producing cell line INS-1 to illustrate the importance of systematic optimization of RNA purification and quantitation of miRs from a specific sample type, including profiling and selection of suitable reference candidates.
The expression of miRs in pancreatic β cells is heavily influenced by a number of conditions [
5,
6,
7,
8]. In several studies on miRs in pancreatic β cells, traditionally used housekeeping genes, such as U6 and RNU6B, have been applied as endogenous controls for normalization, notably without any given justification for the choice of reference [
9,
10,
11,
12]. If quantification data are normalized to a reference gene which has not been tested for stability, this gene might vary systematically and hence introduce bias in the results. The present study is to our knowledge the first published systematic optimization of miR quantification in pancreatic β cells.
2. Results
2.1. Purification of miR-Enriched RNA from Pancreatic β Cells
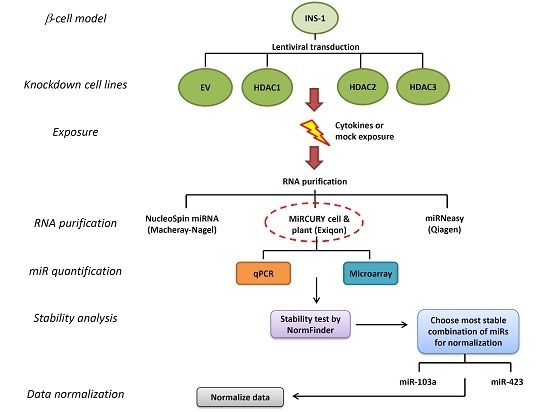
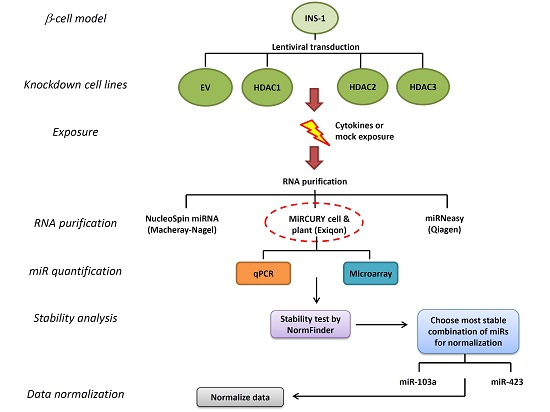
We wished to characterize miR expression in pancreatic β-cells under different conditions and chose the widely used pancreatic rat insulinoma β-cell line INS-1 [
13] for this purpose. We took advantage of INS-1 cells stably transfected with lentivirally transduced short hairpin RNA (shRNA) knockdown of histone deacetylases HDAC1, HDAC2, HDAC3, or empty vector (EV) shown previously to affect responses to inflammatory and metabolic stress [
14,
15], since knockdown of these key transcriptional regulators were expected to modify miR expression. These four different cell lines were harvested following exposure to interleukin-1 (IL-1) β and interferon (IFN) γ, known to affect both miR expression and mRNA expression of HDACs [
11,
16].
In order to obtain the best possible sample material, we compared the yield and quality of miR-enriched RNA obtained from four samples of INS-1 cells with three different purification kits. All three kits purify miR-enriched total RNA, enabling integrated analysis of mRNA from the same samples. The miRCURY cell and plant kit (Exiqon, Vedbaek, Denmark) was superior in yield and RNA purity and quality to the kits NucleoSpin miRNA (Macheray–Nagel, Düren, Germany) and miRNeasy (Qiagen, Hilden, Germany) (
Table 1), and the miRCURY kit was therefore chosen. Moreover, the kit was the easiest and quickest to use, and it did not, unlike the miRNeasy kit, entail use of any organic solvents.
2.2. Stability Analysis of Candidates for Normalization of qPCR-Based miR Array
To map the global repertoire of β-cell miR expression, RNA samples were subjected to a SYBR Green qPCR-based microRNA array, detecting 752 miRs and 6 suggested references. To evaluate the stability of the given references, their expression was analyzed with the NormFinder algorithm plugin for Microsoft Excel [
2]. NormFinder ranks a set of candidate mRNAs or miRs for optimal normalization according to their expression stability in a given sample set and given experimental design. When subjecting non-normalized expression values (2
−Ct) to analysis by NormFinder, one must designate to which group each sample belongs, the goal being to evaluate the stability across these groups. In this case, we had two options of grouping samples, that is, according to the transduced cell line (HDAC1, −2, −3 knockdown or EV) or exposure (with or without cytokines). We therefore analyzed the data twice using each of these groupings.
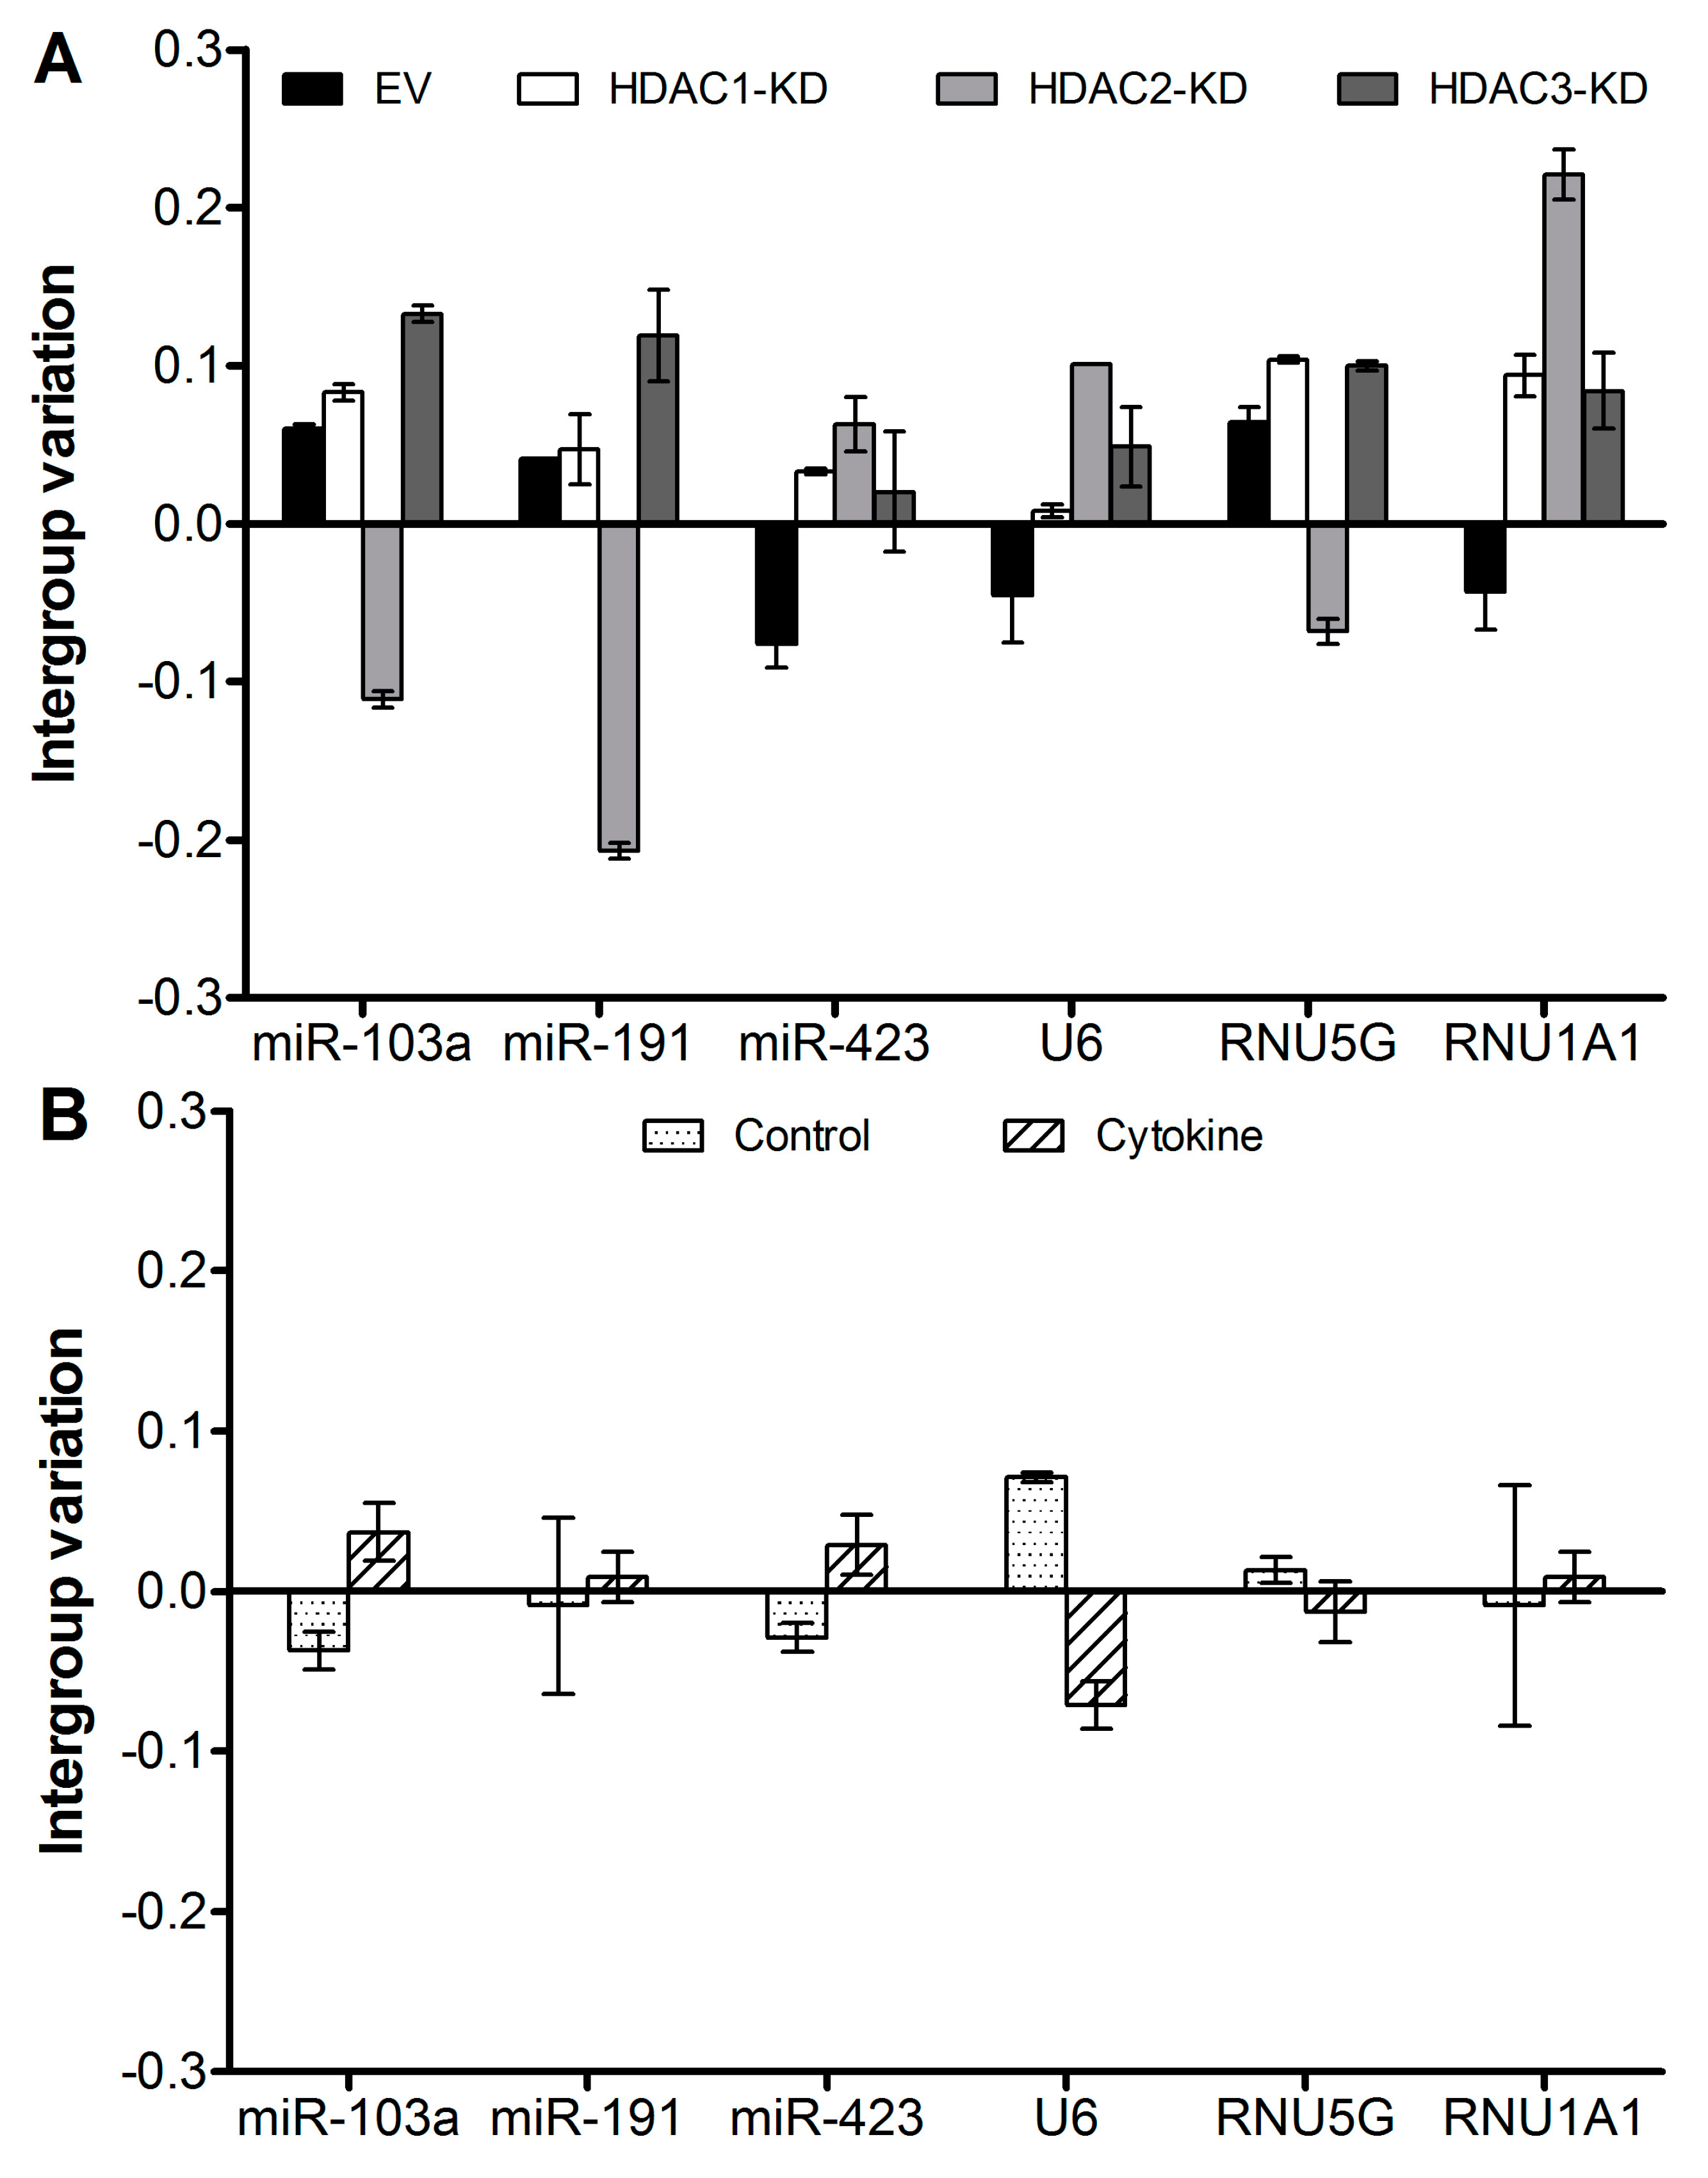
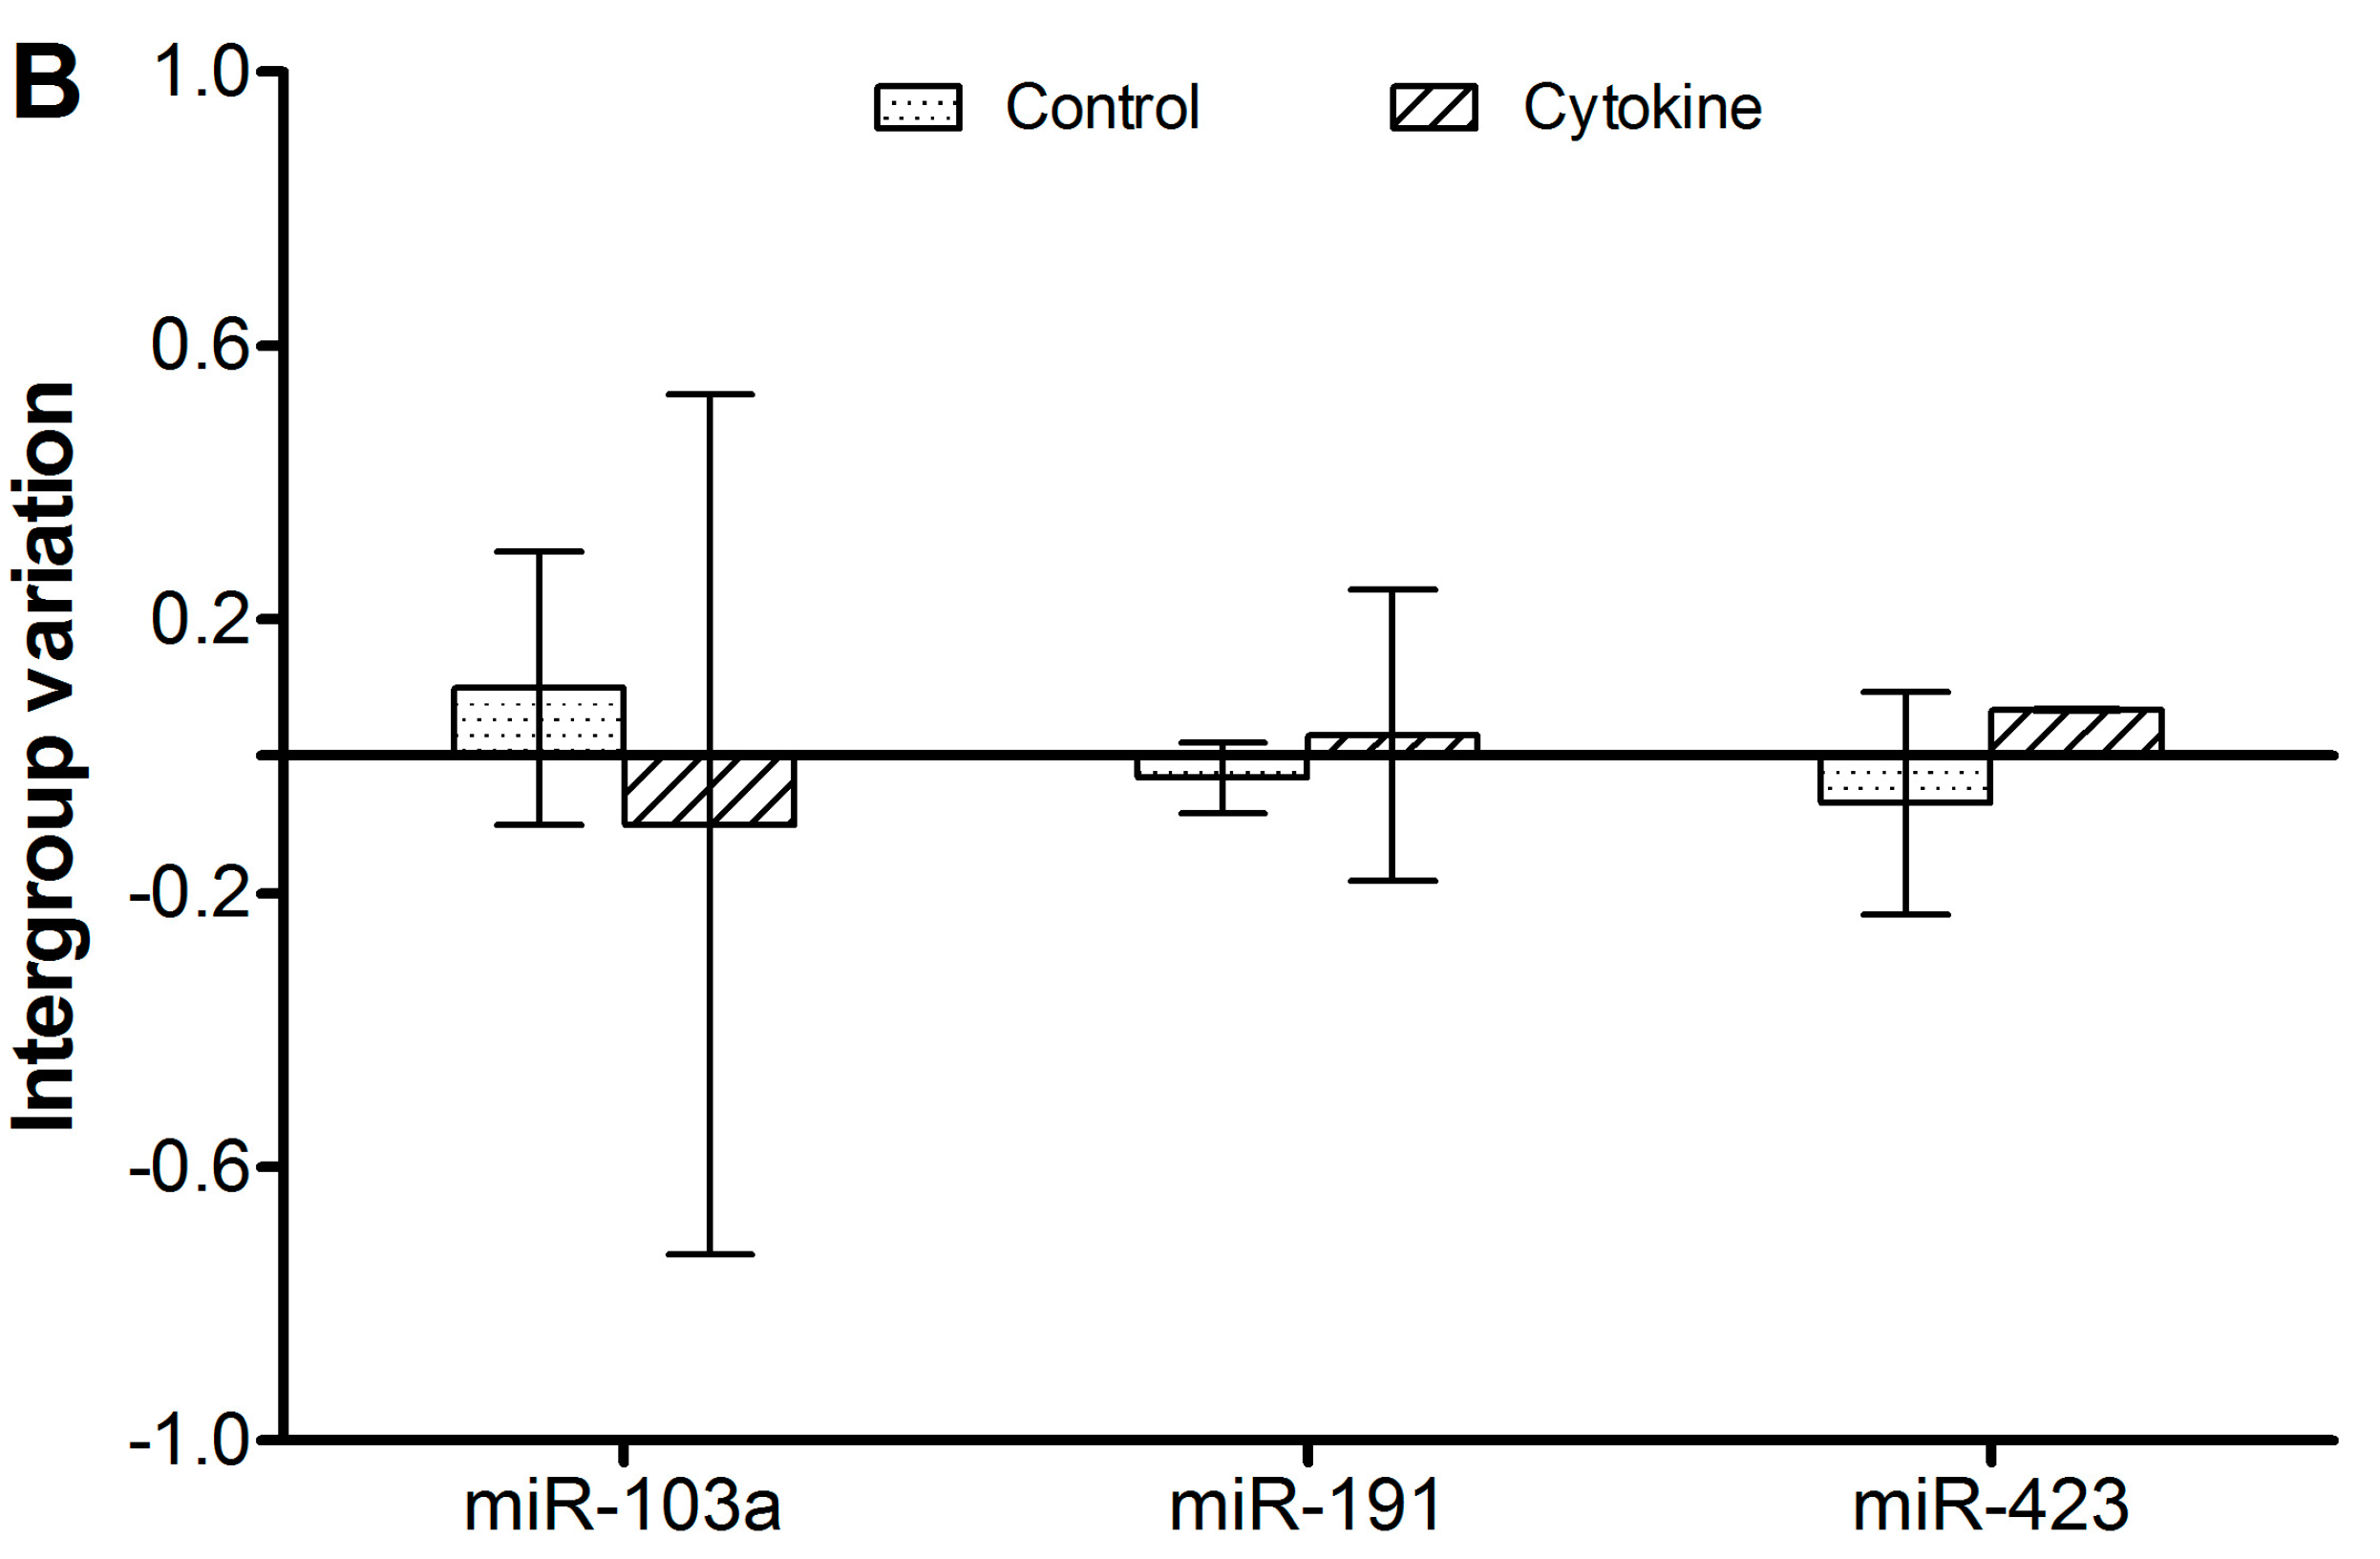
The NormFinder output is provided as arbitrary “stability values”, where the smallest stability value signifies the highest stability. The stability values take into account the
intergroup variation, which provides a measure of how much bias is introduced by normalizing to the given reference and of the
intragroup variation,
i.e., the confidence interval within each group.
Figure 1 shows the intergroup variation of the reference candidates from the array as confidence intervals, and
Table 2 shows the stability values. As seen in
Figure 1B, the intragroup variation can be larger than the intergroup variation, indicating either that expression levels are not very stable within the group or that the variation between the groups is even lower than the normal intragroup variation. As all values are arbitrary, it is not possible to discriminate between these two possibilities. However, this is subordinate, as both types of variation are accounted for when the NormFinder algorithm calculates the stability value.
Figure 1 and
Table 2 show that the stabilities of the six candidates are in a similar range. Of note, there are both miR and non-miR references among these six candidates, which does not seem to influence the stability. We suggest that it is preferable to use miR for normalization of miR quantification. Thereby, the targets and references can be characterized in parallel. If the techniques used should include any bias against miRs in general, the reference miR will be affected similarly.
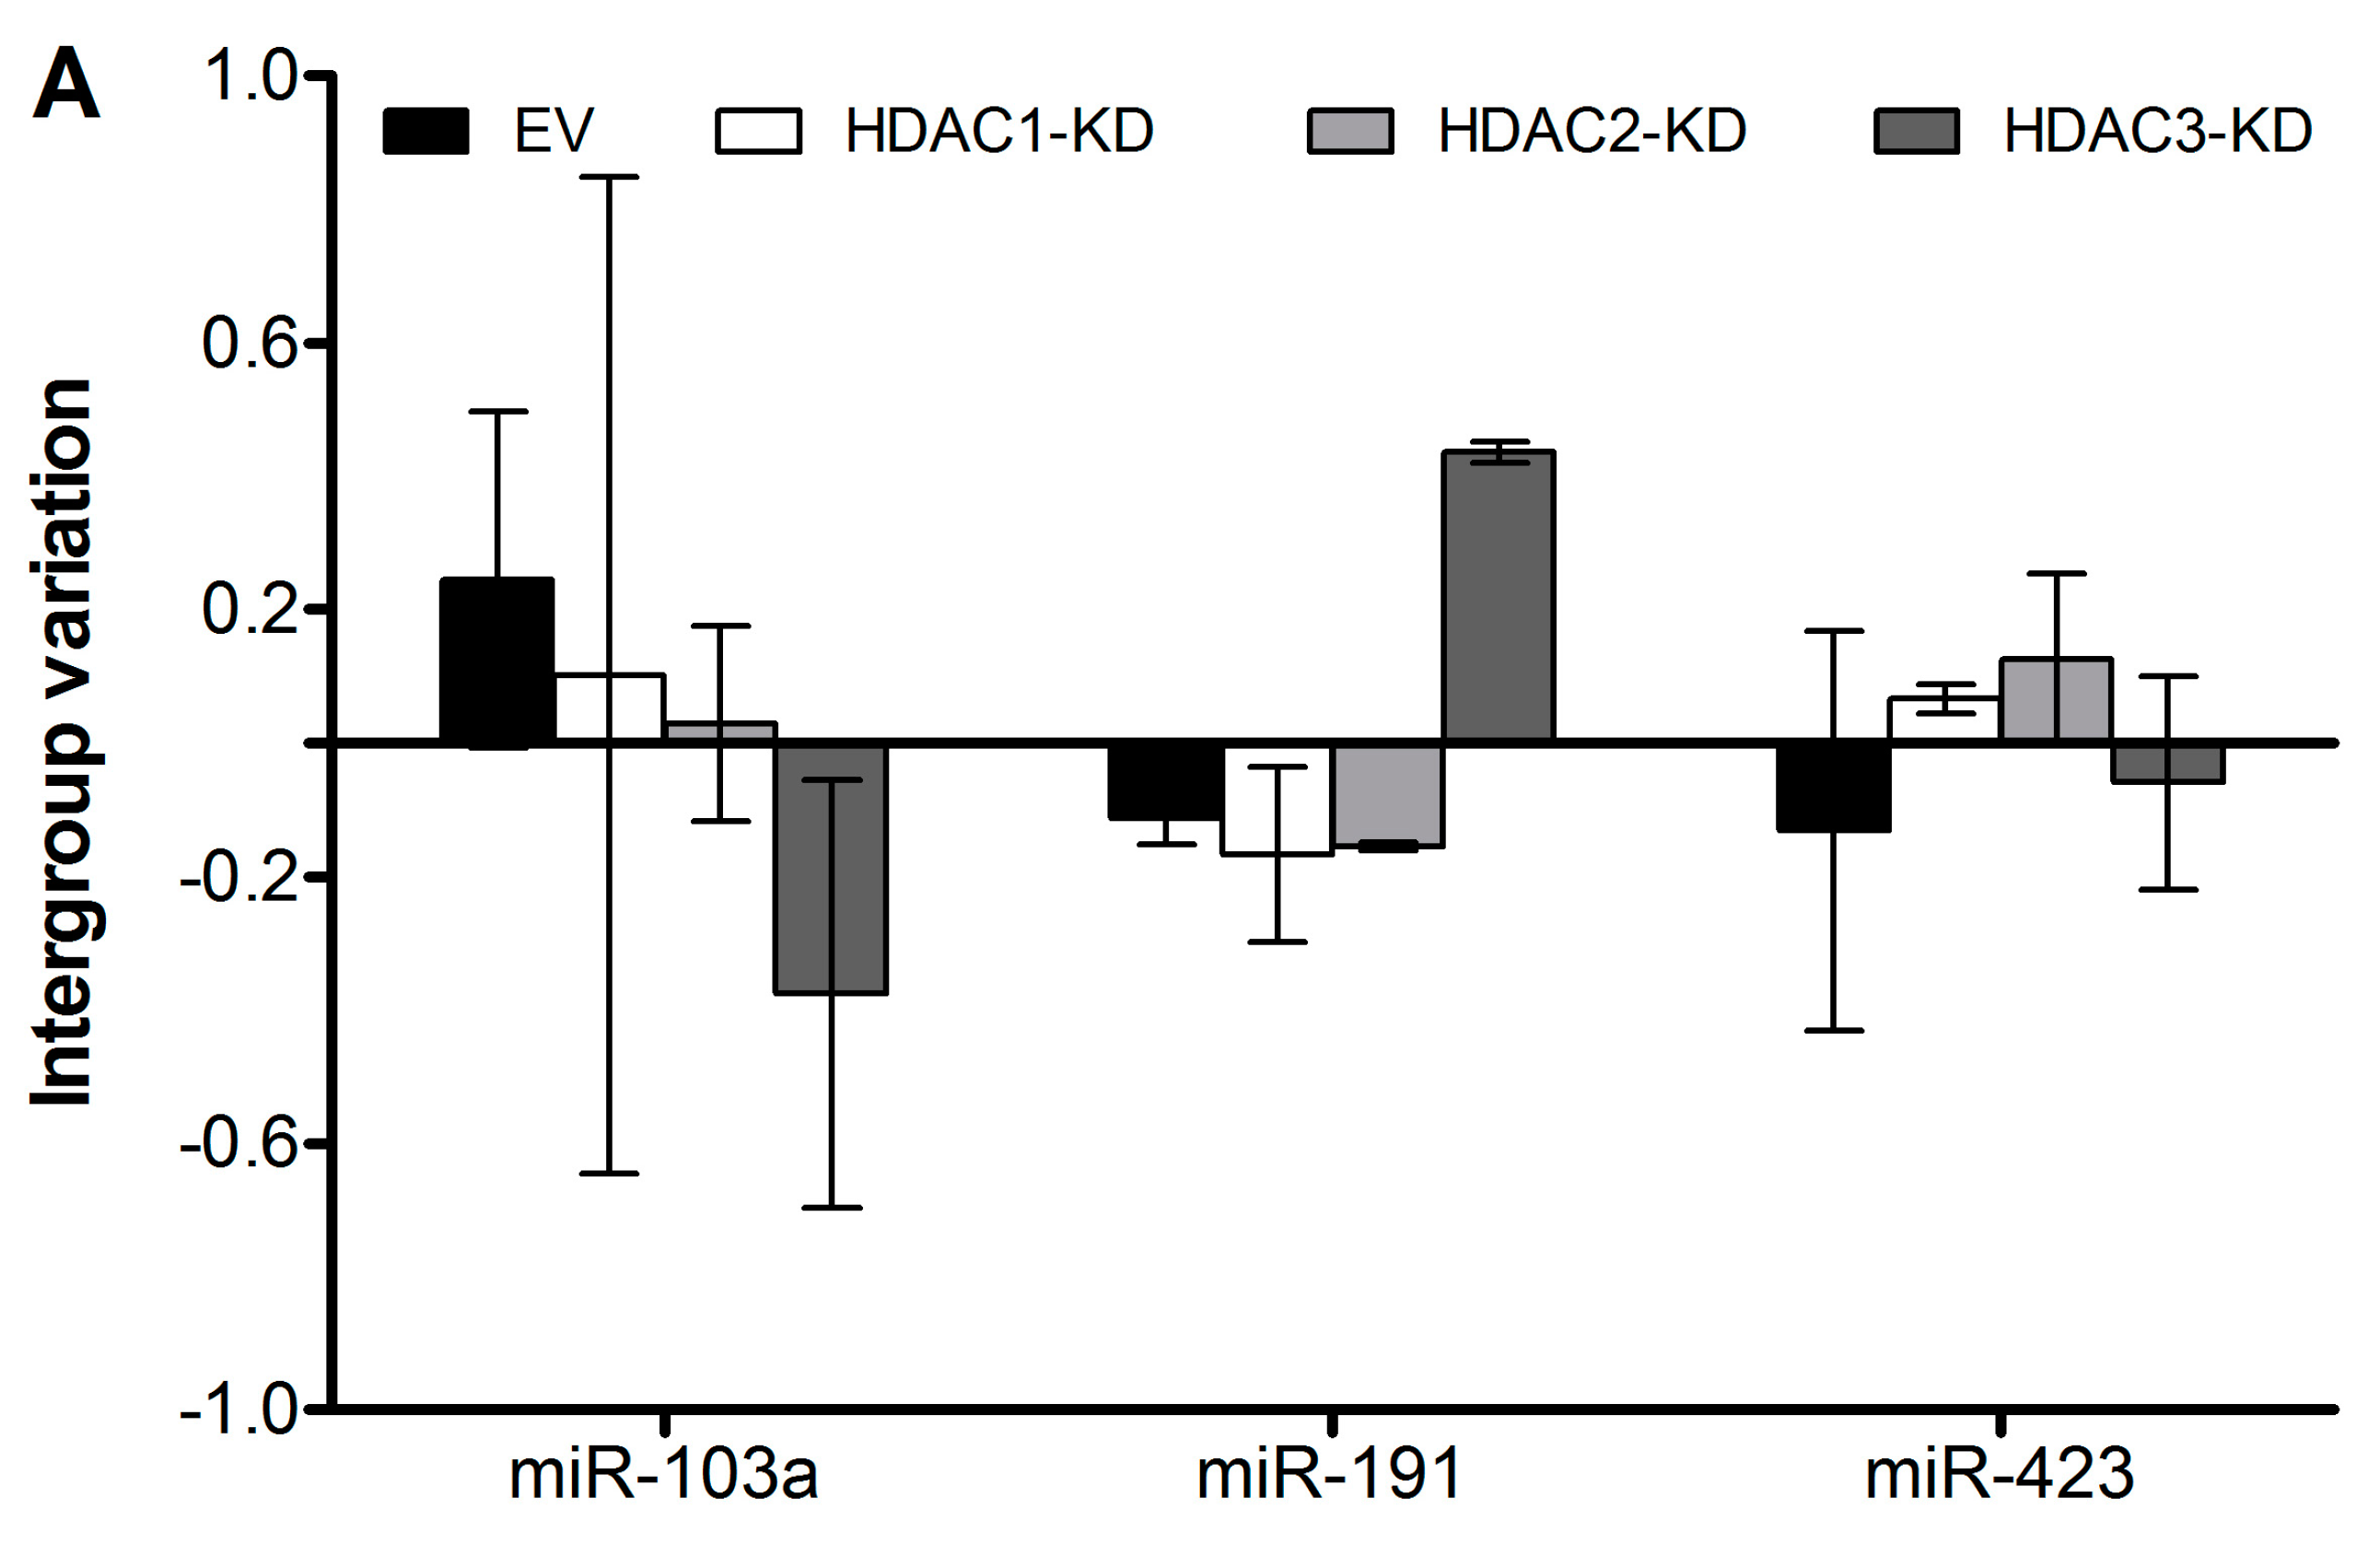
2.3. Stability Analysis of miR for Normalization of qPCR Quantification of Specific miR Expression
We next measured the expressional levels of the three reference miRs by specific qPCR and analyzed their stability with NormFinder, as shown in
Figure 2 and
Table 3. The stability values depict that miR-423 is the most stable of the three. However, it is recommended that more than one reference gene for normalization is used [
2,
3,
4], and NormFinder also gives the stability value of the best combination of two genes (
Table 3). Note that this might not include the miR with the lowest stability value, because normalization to the combination of two other miRs might compensate for the bias introduced by normalization to the individual miR. In this case, the best combination of two reference miRs differs according to how the samples are grouped, and the user must then make the choice depending on the research hypothesis in question.
2.4. Stability Ranking of All miR in qPCR-Based miR Array
Finally, we ranked all miR quantified in the array using NormFinder, of which the top ten and the bottom-ranking miRs are given in
Table 4. This shows that the difference between the most stable and the least stable miRs is very large when including all miRs, obviously including highly regulated miRs. Notably, two of the three miRs selected for this study, namely miR-103a and miR-423, figure in the top ten ranking miRs of the array in both groupings. This confirms that these two miRs are indeed stably expressed in both the array and specific qPCR quantifications, and a combination of these two miRs is appropriate for normalizing qPCR data from INS-1 cells in the conditions used here.
3. Discussion
In this study, we systematically analyzed the stability of several reference mRNAs and miRs for use in qPCR-based quantification of candidate miRs from INS-1 cells. Insulin-producing cell lines provide the advantage of representing only one islet cell subtype, but differ in many respects from primary islet β-cells. Further, since primary islets contain non-β endocrine and non-endocrine passenger cells, the RNA purification procedure for INS-1 cells may need separate optimization when isolating miR from intact islets.
For INS-1 cells, our efforts resulted in the choice of a normalization factor based on miR-103a and miR-423 for this particular setup, but this work more importantly outlines a broadly applicable example on how to choose the most stable miR(s) for normalization in relative quantification of specific qPCR. The same method can be applied for array-based expressional profiling. However, in most cases, using a global normalization procedure, such as the quantile method or the geometric mean, is more appropriate for this experiment type [
4,
17]. Nonetheless, analyzing the stability of a broad range of miRs from array data functions well as a screening method when searching for stably expressed miRs in a given experimental setup.
4. Materials and Methods
The rat insulinoma-derived β-cell line INS-1 is a standard model for studying β-cell function due to its responsiveness to glucose and degree of differentiation [
13]. The INS-1 cell line was a generous gift from Claes Wollheim (Department of Cell Physiology and Metabolism, University Medical Center, Geneva, Switzerland). INS-1 cell lines with stable lentiviral transduction of shRNAs entailing knockdowns of HDAC1, HDAC2, and HDAC3 or a mock transduction with the empty vector construct (EV) were produced, and knockdown was verified by real-time qPCR and Western blotting [
14]. Cells were maintained in RPMI-1640 medium with GlutaMAX, supplemented with 10% fetal calf serum, 100 U/mL penicillin, 10 μg/mL streptomycin, 50 μM β-mercaptoethanol, and 2.5 μg/mL puromycin. The cells were cultured at 37 °C in a humidified atmosphere containing 5% CO
2. Medium changes and cell passage were performed weekly. Cells were seeded in 6-well plates (1.5 mio cells/well) and left for two days prior to exposure to 150 pg/mL IL-1β and 0.1 ng/mL IFNγ for 6 h before harvest. The cells were lysed and microRNA-enriched total RNA purified according to the kit manufacturer’s protocols.
For microRNA array analysis, the SYBR Green-based microRNA Ready-to-Use PCR Panels (Exiqon, Vedbaek, Denmark) were used according to the manufacturer’s protocols.
For SYBR Green-based qPCR quantification of specific miRs, the Universal cDNA Synthesis Kit II and the ExiLENT SYBR® Green master mix (Exiqon) were used according to the manufacturer’s protocols with the following modifications based on careful optimizations: 20 ng/μL total RNA in 10-μL cDNA reactions and 40× cDNA dilutions in 10-μL qPCR reactions were used. Primer efficiencies were all in the range of 90%–105%.
For NormFinder analysis, software download and detailed description of use and data interpretation can be found at [
18].
5. Conclusions
A small effort in optimizing the normalization of the relative quantification of miRs will enhance data validity and is recommended for all studies.
Acknowledgments
Anna Lindeløv Vestergaard was funded by grants from the Danish Research Agency and the Novo Nordisk Foundation, Claus Heiner Bang-Berthelsen and Flemming Pociot from the Danish Strategic Research Council, Guy Wayne Novotny from European Communities Seventh Framework Programme FP7/2007-2013-FP-7-NMP-In Vivo imaging of β-cell Receptors by Applied Nano Technology (VIBRANT), Morten Lundh from Copenhagen career Ph.D. fellowship, and Thomas Mandrup-Poulsen from the Danish Research Agency, the Novo Nordisk Foundation, and the Desirée og Niels Ydes Fond.
Author Contributions
Anna Lindeløv Vestergaard, Maaike Blankestijn, Emil Marek Heymans Pallesen, Claus Heiner Bang-Berthelsen, Guy Wayne Novotny, Flemming Pociot, and Thomas Mandrup-Poulsen conceived and designed the experiments; Anna Lindeløv Vestergaard, Maaike Blankestijn, and Emil Marek Heymans Pallesen performed the experiments; Anna Lindeløv Vestergaard, Maaike Blankestijn, Jonathan Lucien Stahl, and Emil Marek Heymans Pallesen analyzed the data; Morten Lundh contributed reagents/materials/analysis tools; Anna Lindeløv Vestergaard, Maaike Blankestijn, Jonathan Lucien Stahl, and Thomas Mandrup-Poulsen wrote the paper.
Conflicts of Interest
The authors declare no conflict of interest.
References
- Mestdagh, P.; Hartmann, N.; Baeriswyl, L.; Andreasen, D.; Bernard, N.; Chen, C.; Cheo, D.; D’Andrade, P.; DeMayo, M.; Dennis, L.; et al. Evaluation of quantitative miRNA expression platforms in the microRNA quality control (miRQC) study. Nat. Methods 2014, 11, 809–815. [Google Scholar] [CrossRef] [PubMed]
- Andersen, C.L.; Jensen, J.L.; Orntoft, T.F. Normalization of real-time quantitative reverse transcription-PCR data: A model-based variance estimation approach to identify genes suited for normalization, applied to bladder and colon cancer data sets. Cancer Res. 2004, 64, 5245–5250. [Google Scholar] [CrossRef] [PubMed]
- Vandesompele, J.; de Preter, K.; Pattyn, F.; Poppe, B.; van Roy, N.; de Paepe, A.; Speleman, F. Accurate normalization of real-time quantitative RT-PCR data by geometric averaging of multiple internal control genes. Genome Biol. 2002, 3, RESEARCH0034. [Google Scholar] [CrossRef] [PubMed] [Green Version]
- Zeka, F.; Mestdagh, P.; Vandesompele, J. RT-qPCR-based quantification of small non-coding RNAs. Methods Mol. Biol. (Clifton N.J.) 2015, 1296, 85–102. [Google Scholar]
- Osmai, M.; Osmai, Y.; Bang-Berthelsen, C.H.; Pallesen, E.M.; Vestergaard, A.L.; Novotny, G.W.; Pociot, F.; Mandrup-Poulsen, T. MicroRNAs as regulators of β-cell function and dysfunction. Diabetes Metab. Res. Rev. 2016, 32, 334–349. [Google Scholar] [CrossRef] [PubMed]
- Eliasson, L.; Esguerra, J.L. Role of non-coding RNAs in pancreatic β-cell development and physiology. Acta Physiol. (Oxf. Engl.) 2014, 211, 273–284. [Google Scholar] [CrossRef] [PubMed]
- Filios, S.R.; Shalev, A. β-Cell microRNAs: Small but powerful. Diabetes 2015, 64, 3631–3644. [Google Scholar] [CrossRef] [PubMed]
- Guay, C.; Roggli, E.; Nesca, V.; Jacovetti, C.; Regazzi, R. Diabetes mellitus, a microRNA-related disease? Transl. Res. J. Lab. Clin. Med. 2011, 157, 253–264. [Google Scholar] [CrossRef] [PubMed]
- Melkman-Zehavi, T.; Oren, R.; Kredo-Russo, S.; Shapira, T.; Mandelbaum, A.D.; Rivkin, N.; Nir, T.; Lennox, K.A.; Behlke, M.A.; Dor, Y.; et al. miRNAs control insulin content in pancreatic β-cells via downregulation of transcriptional repressors. EMBO J. 2011, 30, 835–845. [Google Scholar] [CrossRef] [PubMed]
- Backe, M.B.; Novotny, G.W.; Christensen, D.P.; Grunnet, L.G.; Mandrup-Poulsen, T. Altering β-cell number through stable alteration of miR-21 and miR-34a expression. Islets 2014, 6, e27754. [Google Scholar] [CrossRef] [PubMed]
- Roggli, E.; Britan, A.; Gattesco, S.; Lin-Marq, N.; Abderrahmani, A.; Meda, P.; Regazzi, R. Involvement of microRNAs in the cytotoxic effects exerted by proinflammatory cytokines on pancreatic β-cells. Diabetes 2010, 59, 978–986. [Google Scholar] [CrossRef] [PubMed]
- Sebastiani, G.; Po, A.; Miele, E.; Ventriglia, G.; Ceccarelli, E.; Bugliani, M.; Marselli, L.; Marchetti, P.; Gulino, A.; Ferretti, E.; et al. MicroRNA-124a is hyperexpressed in type 2 diabetic human pancreatic islets and negatively regulates insulin secretion. Acta Diabetol. 2015, 52, 523–530. [Google Scholar] [CrossRef] [PubMed]
- Asfari, M.; Janjic, D.; Meda, P.; Li, G.; Halban, P.A.; Wollheim, C.B. Establishment of 2-mercaptoethanol-dependent differentiated insulin-secreting cell lines. Endocrinology 1992, 130, 167–178. [Google Scholar] [PubMed]
- Lundh, M.; Christensen, D.P.; Damgaard Nielsen, M.; Richardson, S.J.; Dahllof, M.S.; Skovgaard, T.; Berthelsen, J.; Dinarello, C.A.; Stevenazzi, A.; Mascagni, P.; et al. Histone deacetylases 1 and 3 but not 2 mediate cytokine-induced β cell apoptosis in INS-1 cells and dispersed primary islets from rats and are differentially regulated in the islets of type 1 diabetic children. Diabetologia 2012, 55, 2421–2431. [Google Scholar] [CrossRef] [PubMed]
- Wagner, F.F.; Lundh, M.; Kaya, T.; McCarren, P.; Zhang, Y.L.; Chattopadhyay, S.; Gale, J.P.; Galbo, T.; Fisher, S.L.; Meier, B.C.; et al. An isochemogenic set of inhibitors to define the therapeutic potential of histone deacetylases in β-cell protection. ACS Chem. Biol. 2016, 11, 363–374. [Google Scholar] [CrossRef] [PubMed]
- Lundh, M.; Christensen, D.P.; Rasmussen, D.N.; Mascagni, P.; Dinarello, C.A.; Billestrup, N.; Grunnet, L.G.; Mandrup-Poulsen, T. Lysine deacetylases are produced in pancreatic β cells and are differentially regulated by proinflammatory cytokines. Diabetologia 2010, 53, 2569–2578. [Google Scholar] [CrossRef] [PubMed]
- Lopez-Romero, P.; Gonzalez, M.A.; Callejas, S.; Dopazo, A.; Irizarry, R.A. Processing of agilent microRNA array data. BMC Res. Notes 2010, 3, 18. [Google Scholar] [CrossRef] [PubMed]
- NormFinder software. MOMA—Department of Molecular Medicine, Aarhus University. Available online: http://moma.dk/normfinder-software (accessed on 3 June 2016).
© 2016 by the authors; licensee MDPI, Basel, Switzerland. This article is an open access article distributed under the terms and conditions of the Creative Commons Attribution (CC-BY) license (http://creativecommons.org/licenses/by/4.0/).


 ,
, 


