Article

Selection of Suitable Reference Genes for Quantitative Real-Time PCR Normalization in Three Types of Rat Adipose Tissue

1
Department of Pharmacology, Basic Medical School of Wuhan University, 185, DongHu Road, Wuhan 430071, China
2
Department of Anesthesiology, Zhongnan Hospital of Wuhan University, Wuhan 430071, China
*
Author to whom correspondence should be addressed.
These authors contribute equally to this work.
Int. J. Mol. Sci. 2016, 17(6), 968; https://0-doi-org.brum.beds.ac.uk/10.3390/ijms17060968
Submission received: 18 April 2016 / Revised: 30 May 2016 / Accepted: 13 June 2016 / Published: 22 June 2016
(This article belongs to the Section Biochemistry)

Abstract

:
Quantitative real-time PCR (qRT-PCR) is the most classical technique in the field of gene expression study. This method requires an appropriate reference gene to normalize mRNA levels. In this study, the expression stability of four frequently-used reference genes in epididymal white adipose tissue (eWAT), inguinal beige adipose tissue (iBeAT) and brown adipose tissue (BAT) from obese and lean rats were evaluated by geNorm, NormFinder and BestKeeper. Based on the Minimum Information for Publication of Quantitative Real-Time PCR Experiments (MIQE) guidelines, the two most stable reference genes were recommended in each type of adipose tissue. Two target genes were applied to test the stability of the reference genes. The geNorm and NormFinder results revealed that GAPDH and 36B4 exhibited the highest expression stabilities in eWAT, while 36B4 and β-actin had the highest expression stabilities in iBeAT and BAT. According to the results of the BestKeeper analysis, 36B4 was the most stable gene in eWAT, iBeAT and BAT, in terms of the coefficient of variance. In terms of the coefficient of correlation, GAPDH, 36B4 and β-actin were the most stable genes in eWAT, iBeAT and BAT, respectively. Additionally, expected results and statistical significance were obtained using a combination of two suitable reference genes for data normalization. In conclusion, 36B4 and GAPDH, in combination, are the best reference genes for eWAT, while 36B4 and β-actin are two most suitable reference genes for both iBeAT and BAT. We recommend using these reference genes accordingly.

Graphical Abstract

1. Introduction

The gradually increasing prevalence of obesity has caused adipose tissue to be a focus. Adipose tissue, which has been divided into two main types, white adipose tissue (WAT) and brown adipose tissue (BAT), is a complex and highly active metabolic organ [1]. WAT, best known for its role in the storage of energy, is distributed mainly in visceral and subcutaneous sites. BAT is viewed as a key site of nonshivering thermogenesis and has been considered an attractive target for treating obesity and obesity-associated diseases [2]. Most BAT depots are located in the interscapular and perirenal regions in rodents and large mammals [3]. Recently, a third class of adipocytes was discovered in WAT, especially in inguinal WAT, and the cells were termed “beige” or “brown-like” adipocytes [3]. Interestingly, even though beige adipocytes exist in WAT, beige and brown adipocytes have similar morphology, in the form of multilocular lipid droplets, and a common ability to carry out thermogenesis [2]. In fact, increasing evidence suggested that WAT browning and BAT activation may be promising strategies for treating obesity [4,5,6]. However, there is still relatively little knowledge of the relations between WAT and BAT, especially at the molecular level. In order to study depot-related differences in mRNA expression in adipose tissue, a sensitive and specific technique, such as quantitative real-time polymerase chain reaction (qRT-PCR) is required [7].
Actually, qRT-PCR is a valuable tool for gene expression analysis and is used in many clinical and scientific research fields [8]. However, many studies have demonstrated that the results of qRT-PCR are affected by experimental operation, original sample amount, RNA integrity, cDNA quality and the efficiency of reverse transcription [9,10]. Thus, choosing a stable reference gene for data normalization is the most primary step of a qRT-PCR assay [11]. However, no universal reference gene has been confirmed, and reference genes are regulated by the certain experimental conditions [12]. Therefore, the stability of frequently-used reference genes is relative. From a survey of different studies of adipose tissue, qRT-PCR data were normalized to different reference genes, such as Glyceraldehyde-3-phosphate dehydrogenase (GAPDH) [13], β-actin [14], 18S [15] and acidic ribosomal phosphoprotein P0 (36B4) [16]. However, no research has studied the stability of frequently-used reference genes in different types of rat adipose tissue.
Since 2002, several mathematical algorithms, such as geNorm [17], NormFinder [10], and BestKeeper [18], have been applied to evaluate the expression stability of reference genes. GeNorm evaluates the most stable reference genes for normalization determined by the M value, which is calculated from the arithmetic mean of pairwise variations of each gene. NormFinder validates the expression stability of each reference gene and consider both intra- and intergroup variations for normalization. BestKeeper calculates the expression variability of reference genes based on the standard deviation (SD), coefficient of variance (CV) and coefficient of correlation. In the comprehensive ranking, the top ranked genes are recommended as reference genes for data normalization in similar experimental systems.
In 2009, the Minimum Information for Publication of Quantitative Real-Time PCR Experiments (MIQE) guidelines proposed that selecting multiple suitable reference genes for reliable normalization in qRT-PCR is necessary [
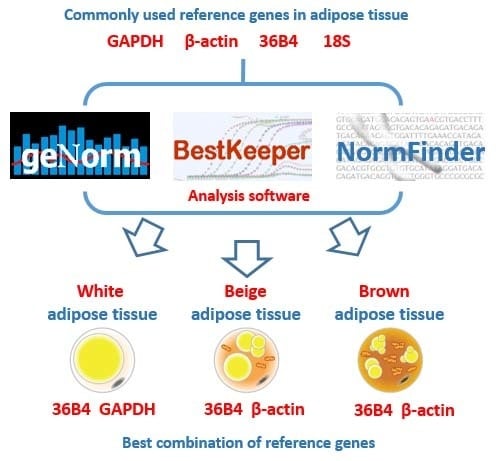
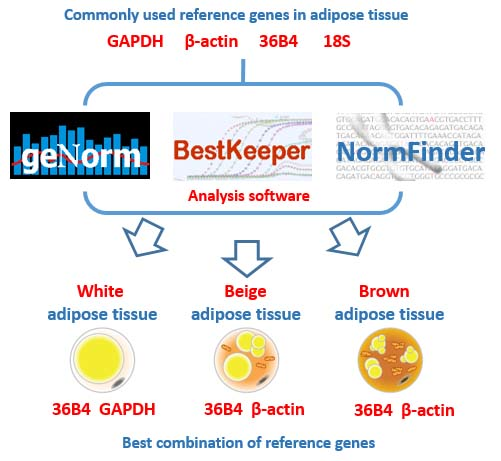
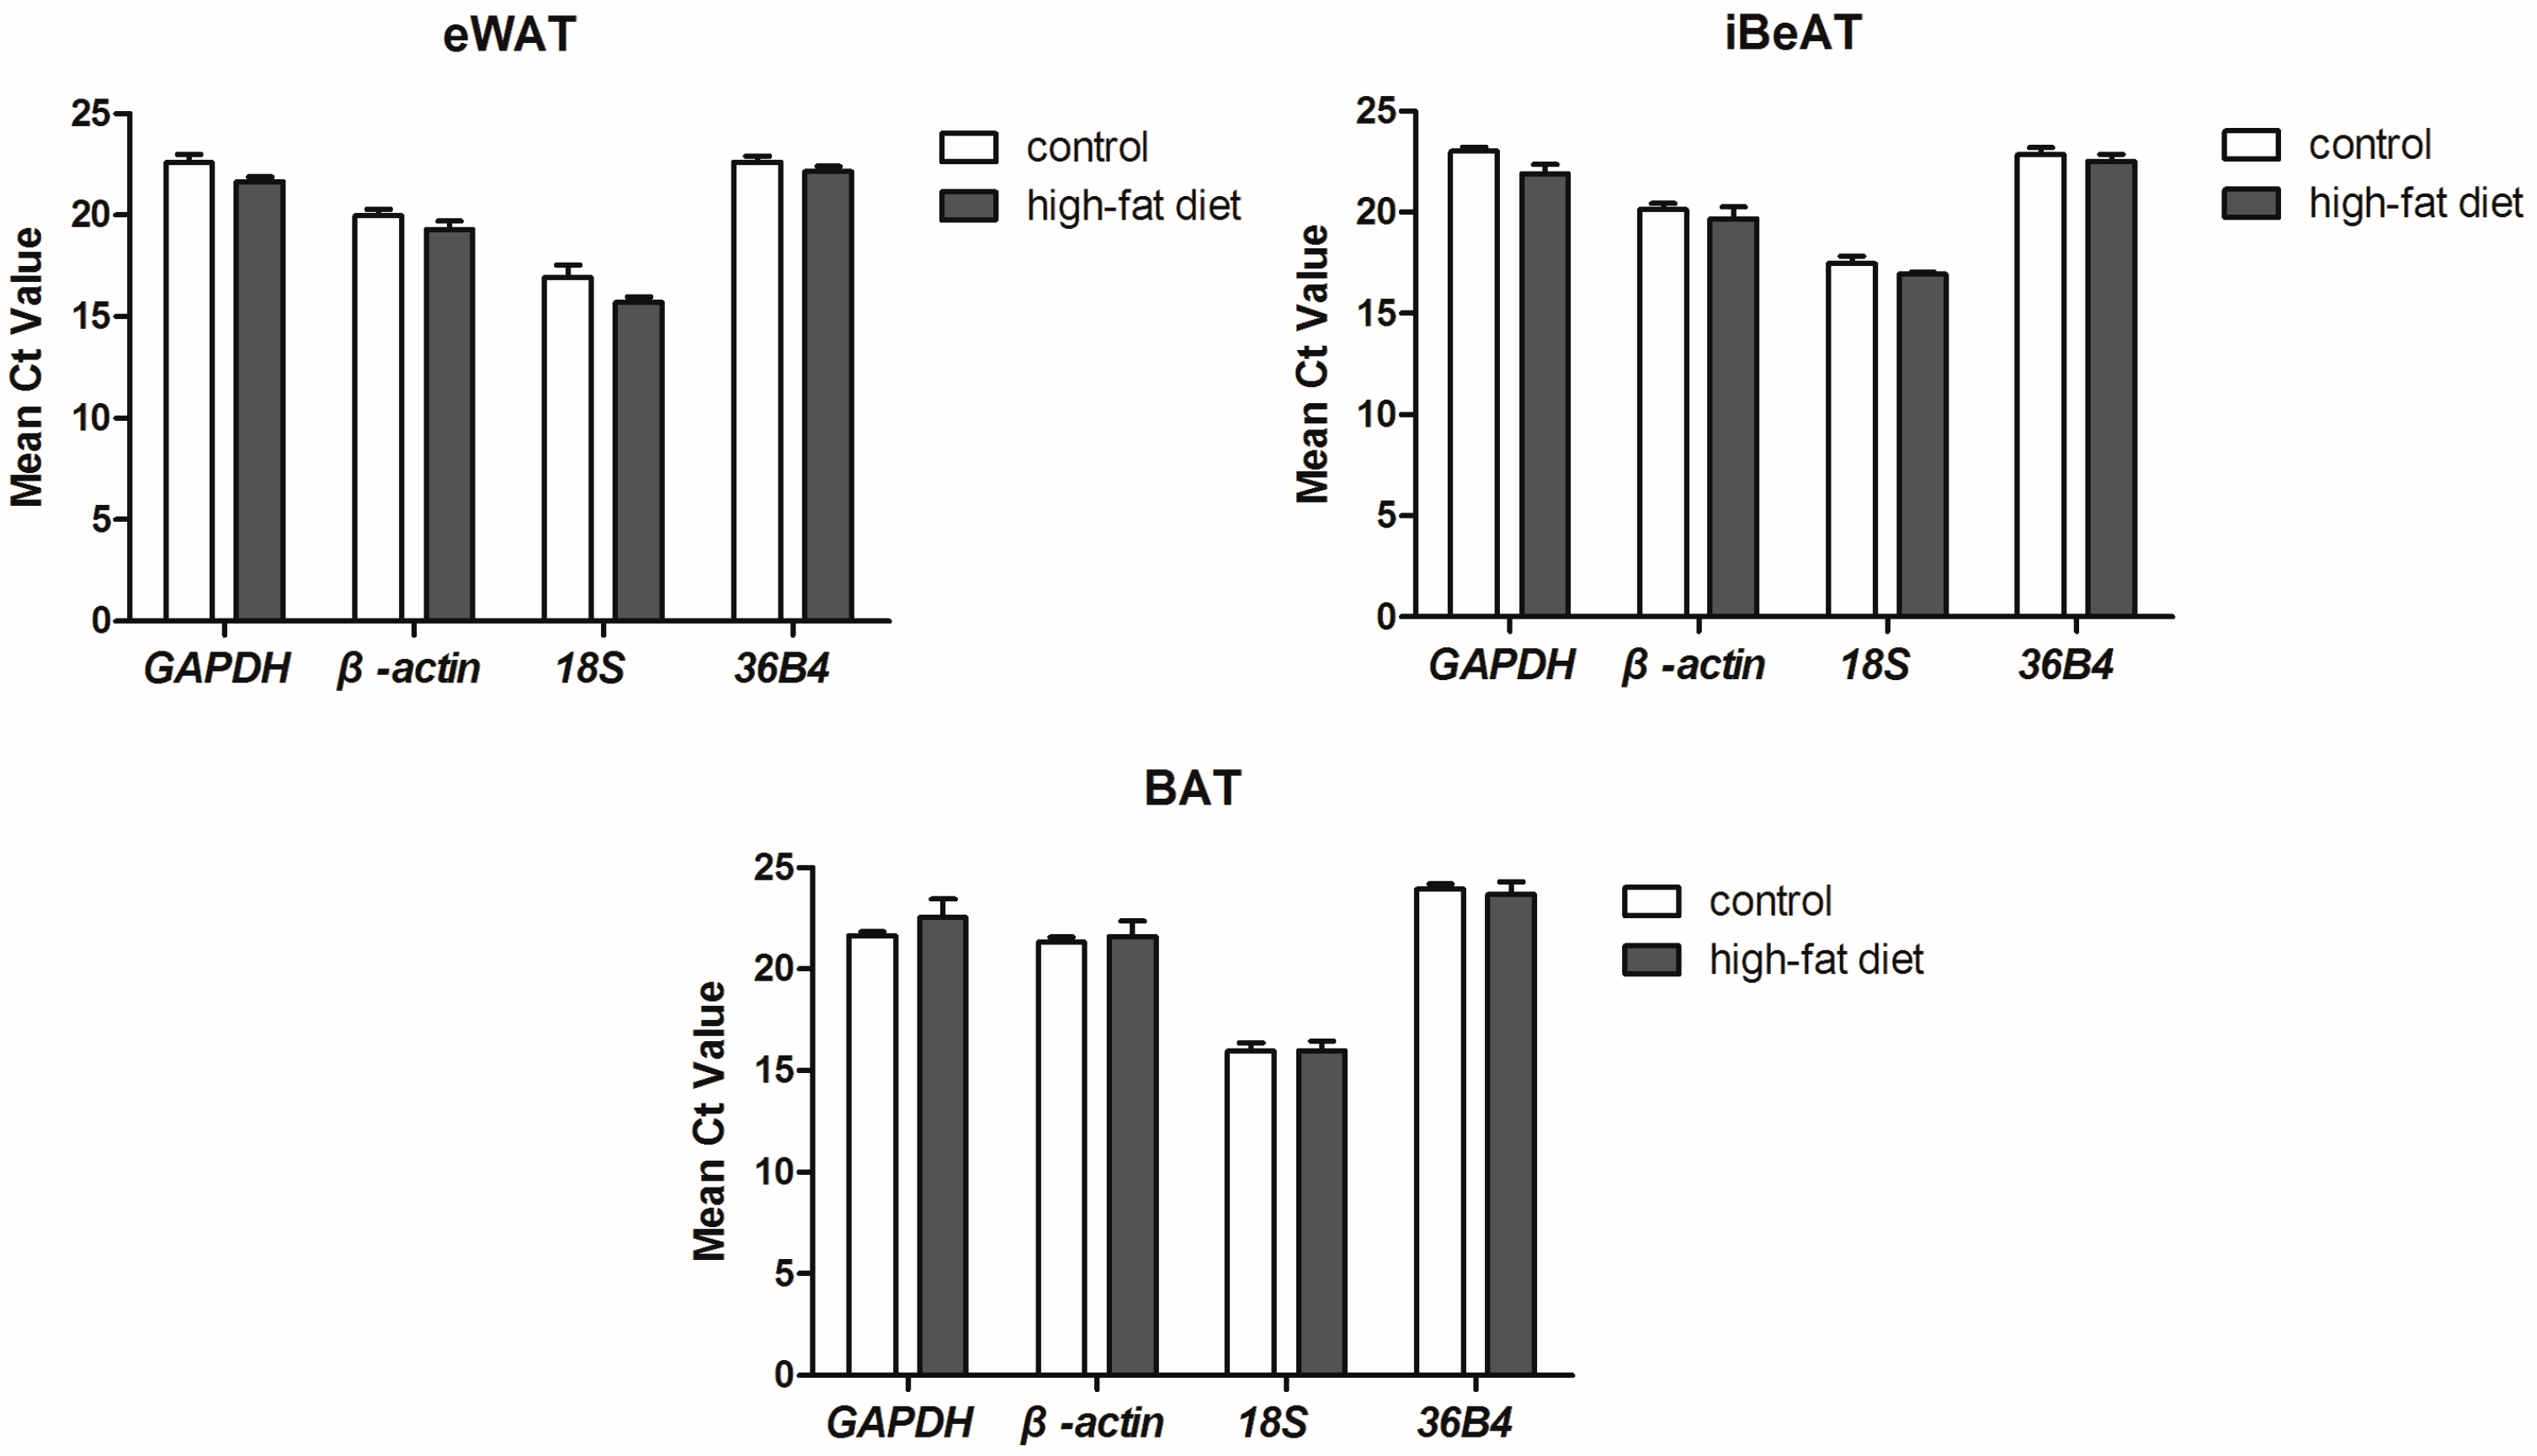
19]. Therefore, in this study, we used geNorm, NormFinder and BestKeeper to identify four commonly used reference genes in epididymal WAT (eWAT), inguinal beige adipose tissues (iBeAT) and brown adipose tissue (BAT) from obese and lean rats, and to identify the two most suitable reference genes for data normalization. Furthermore, we used two target genes to confirm how the different reference genes affect the final results.

2. Results

2.1. Body Weight and Abdomen Circumference

Compared to the control, rats with high-fat diets had a higher body weight (+23%, p < 0.01, Figure 1A) at 26 weeks old. Similarly, the abdomen circumference of rats with high-fat diets was significantly increased (+13%, p < 0.01, Figure 1B).

2.2. RNA Purity and Primer Specificity

The RNA purity, which was monitored by 260/280 absorbance (A260/A280) ratios, ranged from 1.86 to 2.01. Therefore, the purity of the isolated RNA from different types of adipose tissue (eWAT, iBeAT and BAT) in control and high-fat diet rats was satisfactory for further studies. The specificity of each primer pair was verified by melting curves analysis using a corresponding cDNA sample, only a single qRT-PCR product was amplified (Figure 1C).

2.3. Expression Levels of the Reference Genes

The cycle threshold (Ct) value of each reference gene was obtained from qRT-PCR analysis (Figure 2). No significant differences between control and high-fat diet groups were found for all four reference genes in three different types of adipose tissue. The mean Ct value of the reference genes ranged from 16 to 23 cycles, with 18S having the highest (16.42 ± 0.19) and 36B4 having the lowest (22.96 ± 0.18) transcript levels. The obtained Ct values were applied to evaluate the expression stability of the reference genes with the geNorm [17], NormFinder [10] and BestKeeper [18], respectively.

2.4. Expression Stability of the Reference Genes

2.4.1. GeNorm Analysis

The geNorm analysis (Figure 3A–C) demonstrated that all of the reference genes had an M value below 1.5, which is the maximum value for acceptable gene expression stability as defined by Vandesompele et al. [17]. The gene with the lowest M value has the most stable expression. As shown in Figure 3A, the ranking of M value in eWAT was as follows: GAPDH > 36B4 > β-actin> 18S. GAPDH (M = 0.77) and 36B4 (M = 0.80) were the two most stable reference genes, while 18S was the least stable reference gene in eWAT. The results obtained from geNorm in iBeAT and BAT were the same. Ranking was listed as follows: 36B4 > β-actin> 18S> GAPDH. 36B4 (M = 0.87; M = 0.63) and β-actin (M = 0.92; M = 0.64) were identified as the two most stable reference genes and GAPDH (M = 1.06; M = 0.82) was the least stable reference gene in iBeAT and BAT (Figure 3B,C).

2.4.2. NormFinder Analysis

By using the NormFinder method, lower stability values correspond to lower variation, and hence, higher expression stability of gene [10]. In our study, NormFinder analysis showed that GAPDH and 36B4 had the lowest stability values (0.127 and 0.217, respectively) and were the two most stable reference genes in eWAT, while 18S was ranked as the least stable gene (stability values of 0.906) (Figure 3D). However, in iBeAT and BAT, 36B4 and β-actin had the lowest stability values (0.348 and 0.448; 0.221 and 0.227, respectively) and were the most two stable reference genes, whereas GAPDH was the least stable gene (stability values of 0.608 and 0.493, respectively) (Figure 3E,F). The results of NormFinder analysis were highly consistent with the geNorm analysis.

2.4.3. BestKeeper Analysis

According to the BestKeeper analysis, it was unacceptable that genes show an SD higher than one [18]. Thus, in our study, 18S (SD = 1.05) in eWAT and GAPDH (SD = 1.12) in BAT were both eliminated (Table 1 and Table 2). Furthermore, β-actin was excluded for further analysis in iBeAT because it had the highest variation (CV = 4.45) (Table 3). The ranking of reference genes by CV has a subtle distinction from ranking by coefficient of correlation. Based on the results of CV calculation, the most stable gene to the least stable gene were ranked as follows: 36B4 > GAPGH > β-actin (eWAT) (Table 1); 36B4 > β-actin > 18S (BAT) (Table 2); 36B4 > GAPGH > 18S (iBeAT) (Table 3). However, when ordered by the coefficient of correlation, the results were as follows: GAPGH > 36B4 > β-actin (eWAT) (Table 1); β-actin > 36B4 > 18S (BAT) (Table 2); 36B4 > 18S > GAPDH (iBeAT) (Table 3). As a result, in this study, BestKeeper cannot provide a definite conclusion.

2.4.4. Comprehensive Ranking of the Reference Genes

Different rankings of the most suitable reference genes were obtained from geNorm, NormFinder and BestKeeper. This difference in ranking has also been mentioned in other articles [20,21,22]. Based on three different methods, each reference gene was ranked from 1 (most stable) to 4 (least stable). The arithmetic mean value of each gene was obtained, and the comprehensive stability ranking of the reference genes were shown in Table 4, Table 5 and Table 6. 36B4 exhibited a higher stability of gene expression in each type of adipose tissue (eWAT, iBeAT and BAT). In accordance with the MIQE guidelines, multiple reference genes for normalization in qRT-PCR were then proposed. In our study, the most two suitable reference genes for eWAT are GAPDH and 36B4, while 36B4 and β-actin are the most two suitable reference genes for both iBeAT and BAT (Table 4, Table 5 and Table 6).

2.5. Normalization of Two Target Genes with Reference Genes

To identify how different reference genes affect the final results, the gene for the adipose-derived cytokine leptin was normalized with the combination of most or least stable reference genes. As shown in Figure 4A,B, the mRNA levels of leptin in eWAT, when calculated with the combination of most stable reference genes (36B4 and GAPDH), were significantly increased (+97%, p = 0.029) in obese rats, while they were not significantly changed when calculated with the combination of least stable reference genes (β-actin and 18S). When using the combination of the most stable reference genes (36B4 and β-actin) for normalization, the mRNA levels of leptin in iBeAT were significantly higher (p = 0.018) in obese rats. However, when using the combination of least reference genes (18S and GAPDH) for normalization, the mRNA levels of leptin in iBeAT showed significantly less increases (p = 0.048) in obese rats.
Uncoupling protein 1 (UCP-1), a brown fat-specific gene, is an energy metabolism-related factor that plays a central regulator role in mitochondrial biogenesis and thermogenesis in BAT [23]. In our study, we observed significantly decreased (−59%, p = 0.005) mRNA levels of UCP-1 in obese rats when calculated with the combination of most stable reference genes (36B4 and β-actin). However, when calculated with the combination of least stable reference genes (18S and GAPDH), there were no significant changes (−43%, p = 0.070) in the UCP-1 mRNA levels in obese rats (Figure 4C). Therefore, a stable reference gene improves the accuracy of a gene expression study.

3. Discussion

In molecular biological research, gene expression analysis is one of the most frequently-used strategies in the field of gene study involved in signaling and metabolic pathways. It is of vital significance to select an appropriate reference gene for the normalization of gene expression. It is generally known that GAPDH and β-actin are the two most commonly-used reference genes. However, some researchers have identified that GAPDH and β-actin showed a significant variation in different cells, tissues and experimental conditions [24,25,26]. Furthermore, Catalan and his colleagues showed that GAPDH is a less appropriate reference gene in human omental and subcutaneous adipose tissue from obesity and type 2 diabetes patients, because of the variational expression [27]. Therefore, we identified the expression stability of four reference genes (GAPDH, β-actin, 36B4 and 18S) in three types of rat adipose tissue (eWAT, iBeAT and BAT) by using different software: geNorm, NormFinder and BestKeeper. In addition, in accordance with the MIQE guidelines, the two most suitable reference genes were recommended in each type of adipose tissue.
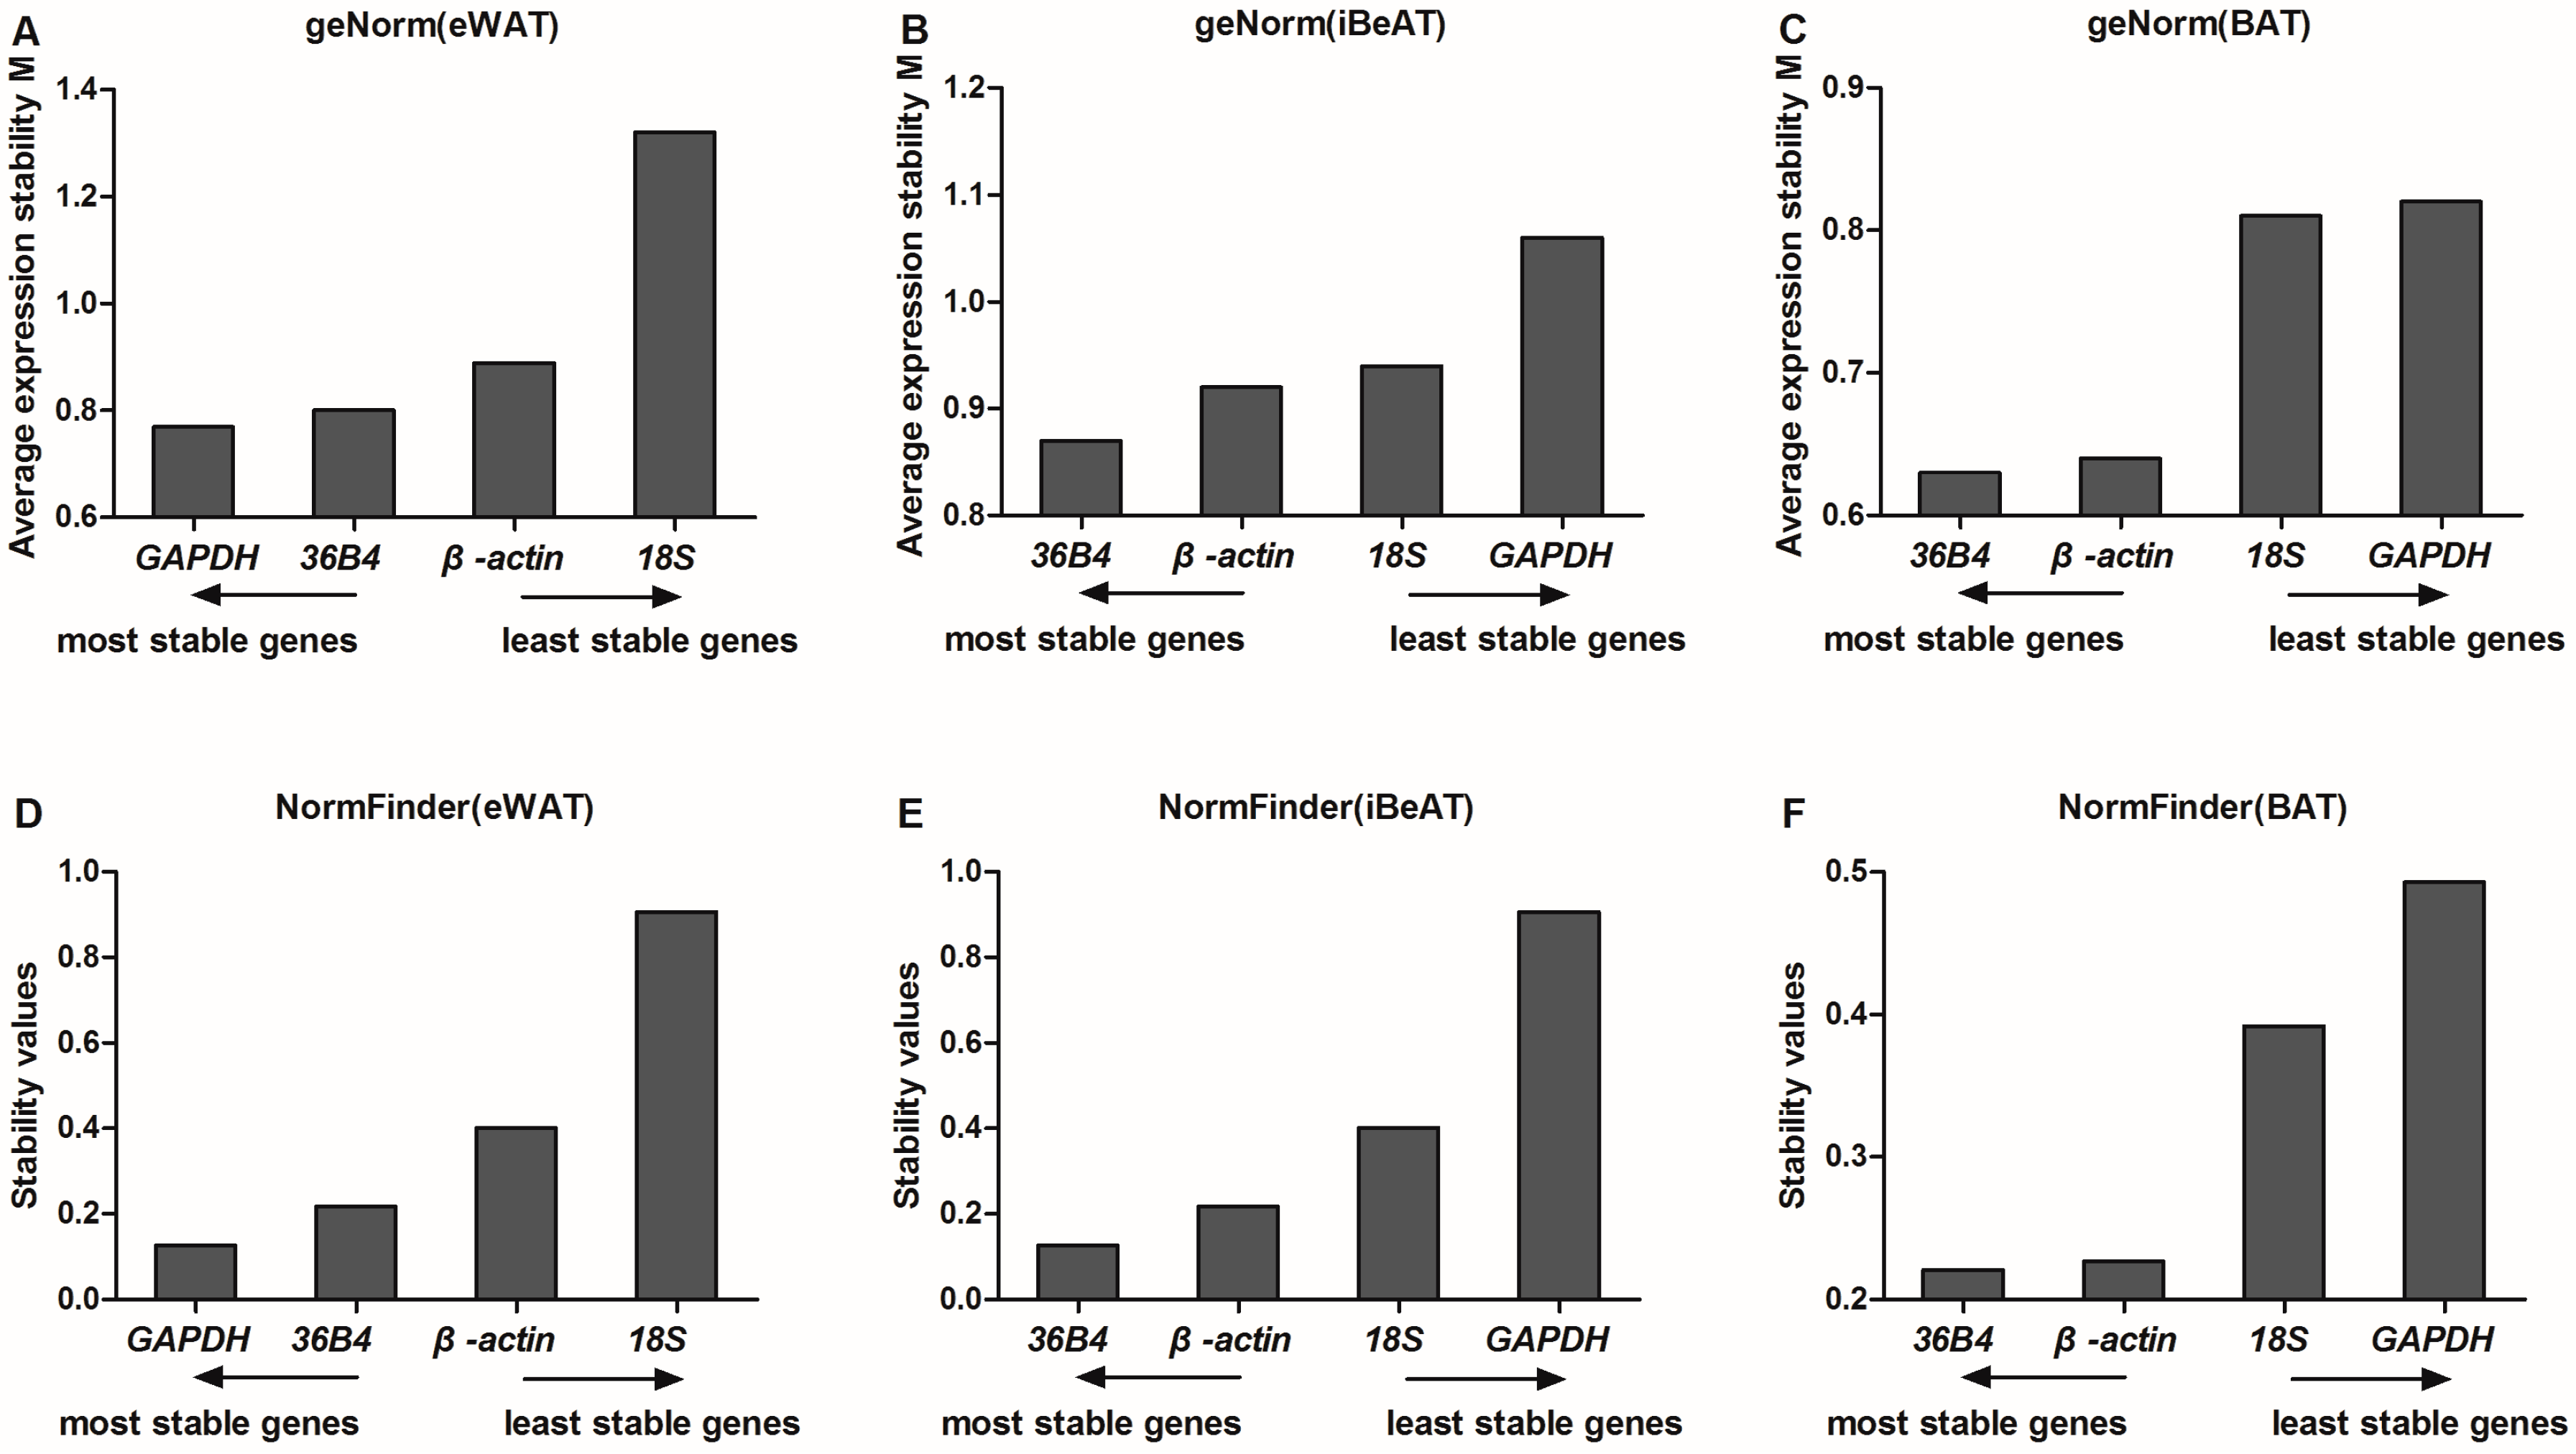
GeNorm software is one of the most commonly-used algorithms applied to evaluate reference gene expression stability via a pairwise comparison between one reference gene and each other reference gene from each sample [17]. In our study, GAPDH and 36B4 appeared to be the two most stable reference genes in eWAT among lean and obese rats. However, GAPDH was the least stable reference gene in both iBeAT and BAT. Therefore, GAPDH is not a universal reference gene in adipose tissue. This finding is consistent with a previous study by Akamine et al., who verified that GAPDH was not suitable as a universal reference gene in adipose tissue because of its inconsistent expression levels between WAT and BAT [28]. In our study, however, we found that 36B4 and β-actin had highest expression stability in both iBeAT and BAT. It is suggested that 36B4 is the universal reference gene in different types of adipose tissue.
Unlike geNorm, the NormFinder procedure directly and robustly estimates gene expression stability and ranks reference genes depend on the variation within the intra- and the inter-group. As Andersen mentioned in his report, the NormFinder procedure focuses on differences between sample subgroups, and the result is less affected by the correlated expression of the reference genes [10]. In our study, the results obtained from NormFinder analysis were quite consistent with the geNorm analysis. GAPDH is the most stable reference gene, followed by 36B4 in eWAT. 36B4 and β-actin were the most stable reference genes in both iBeAT and BAT.
BestKeeper is another traditional software that is used to assess the stability of gene expression. In the BestKeeper procedure, evaluating the stability of gene expression was co-determined by three essential criteria, which are the SD, CV and the coefficient of correlation [18]. In our study, 36B4 was the most stable gene in eWAT based on the CV value, while GAPDH and β-actin were ranked as the second and third, respectively; these results were different from the geNorm and NormFinder analysis. In terms of the coefficient of correlation, however, GAPDH was the most stable gene in eWAT. In addition, this result completely supports the geNorm and NormFinder analysis. In iBeAT, 36B4 had a highest expression stability based on both CV value and coefficient of correlation. This result was consistent with the geNorm and NormFinder analysis. In BAT, a difference was also observed based these two criteria. When ordered by CV value and coefficient of correlation, 36B4 and β-actin were the most stable genes, respectively.
To evaluate the different results from the three algorithms systematically, a comprehensive ranking of each reference gene was calculated. Results show that GAPDH was the most stable reference gene in eWAT, but it had the highest variability in both iBeAT and BAT. In addition, 36B4 was a highly stable gene in each type of adipose tissue, even though the results from the geNorm and NormFinder analyses had a tiny disparity with GAPDH in eWAT. For a realistic study of obesity, more than one type of adipose tissue should be considered. Based on new research, “browning” of WAT will become a new strategy for obesity treatment [4,29]. Therefore, considering the variety of experimental subjects and practicability, a relatively universal reference gene among each type of adipose tissue should be used. According to our study, 36B4 is the universal reference gene in adipose tissue. In accordance with the MIQE guidelines, however, the use of multiple reference genes for normalization in qRT-PCR were proposed. We recommend 36B4 and GAPDH as the best combination of reference genes for eWAT, and 36B4 and 
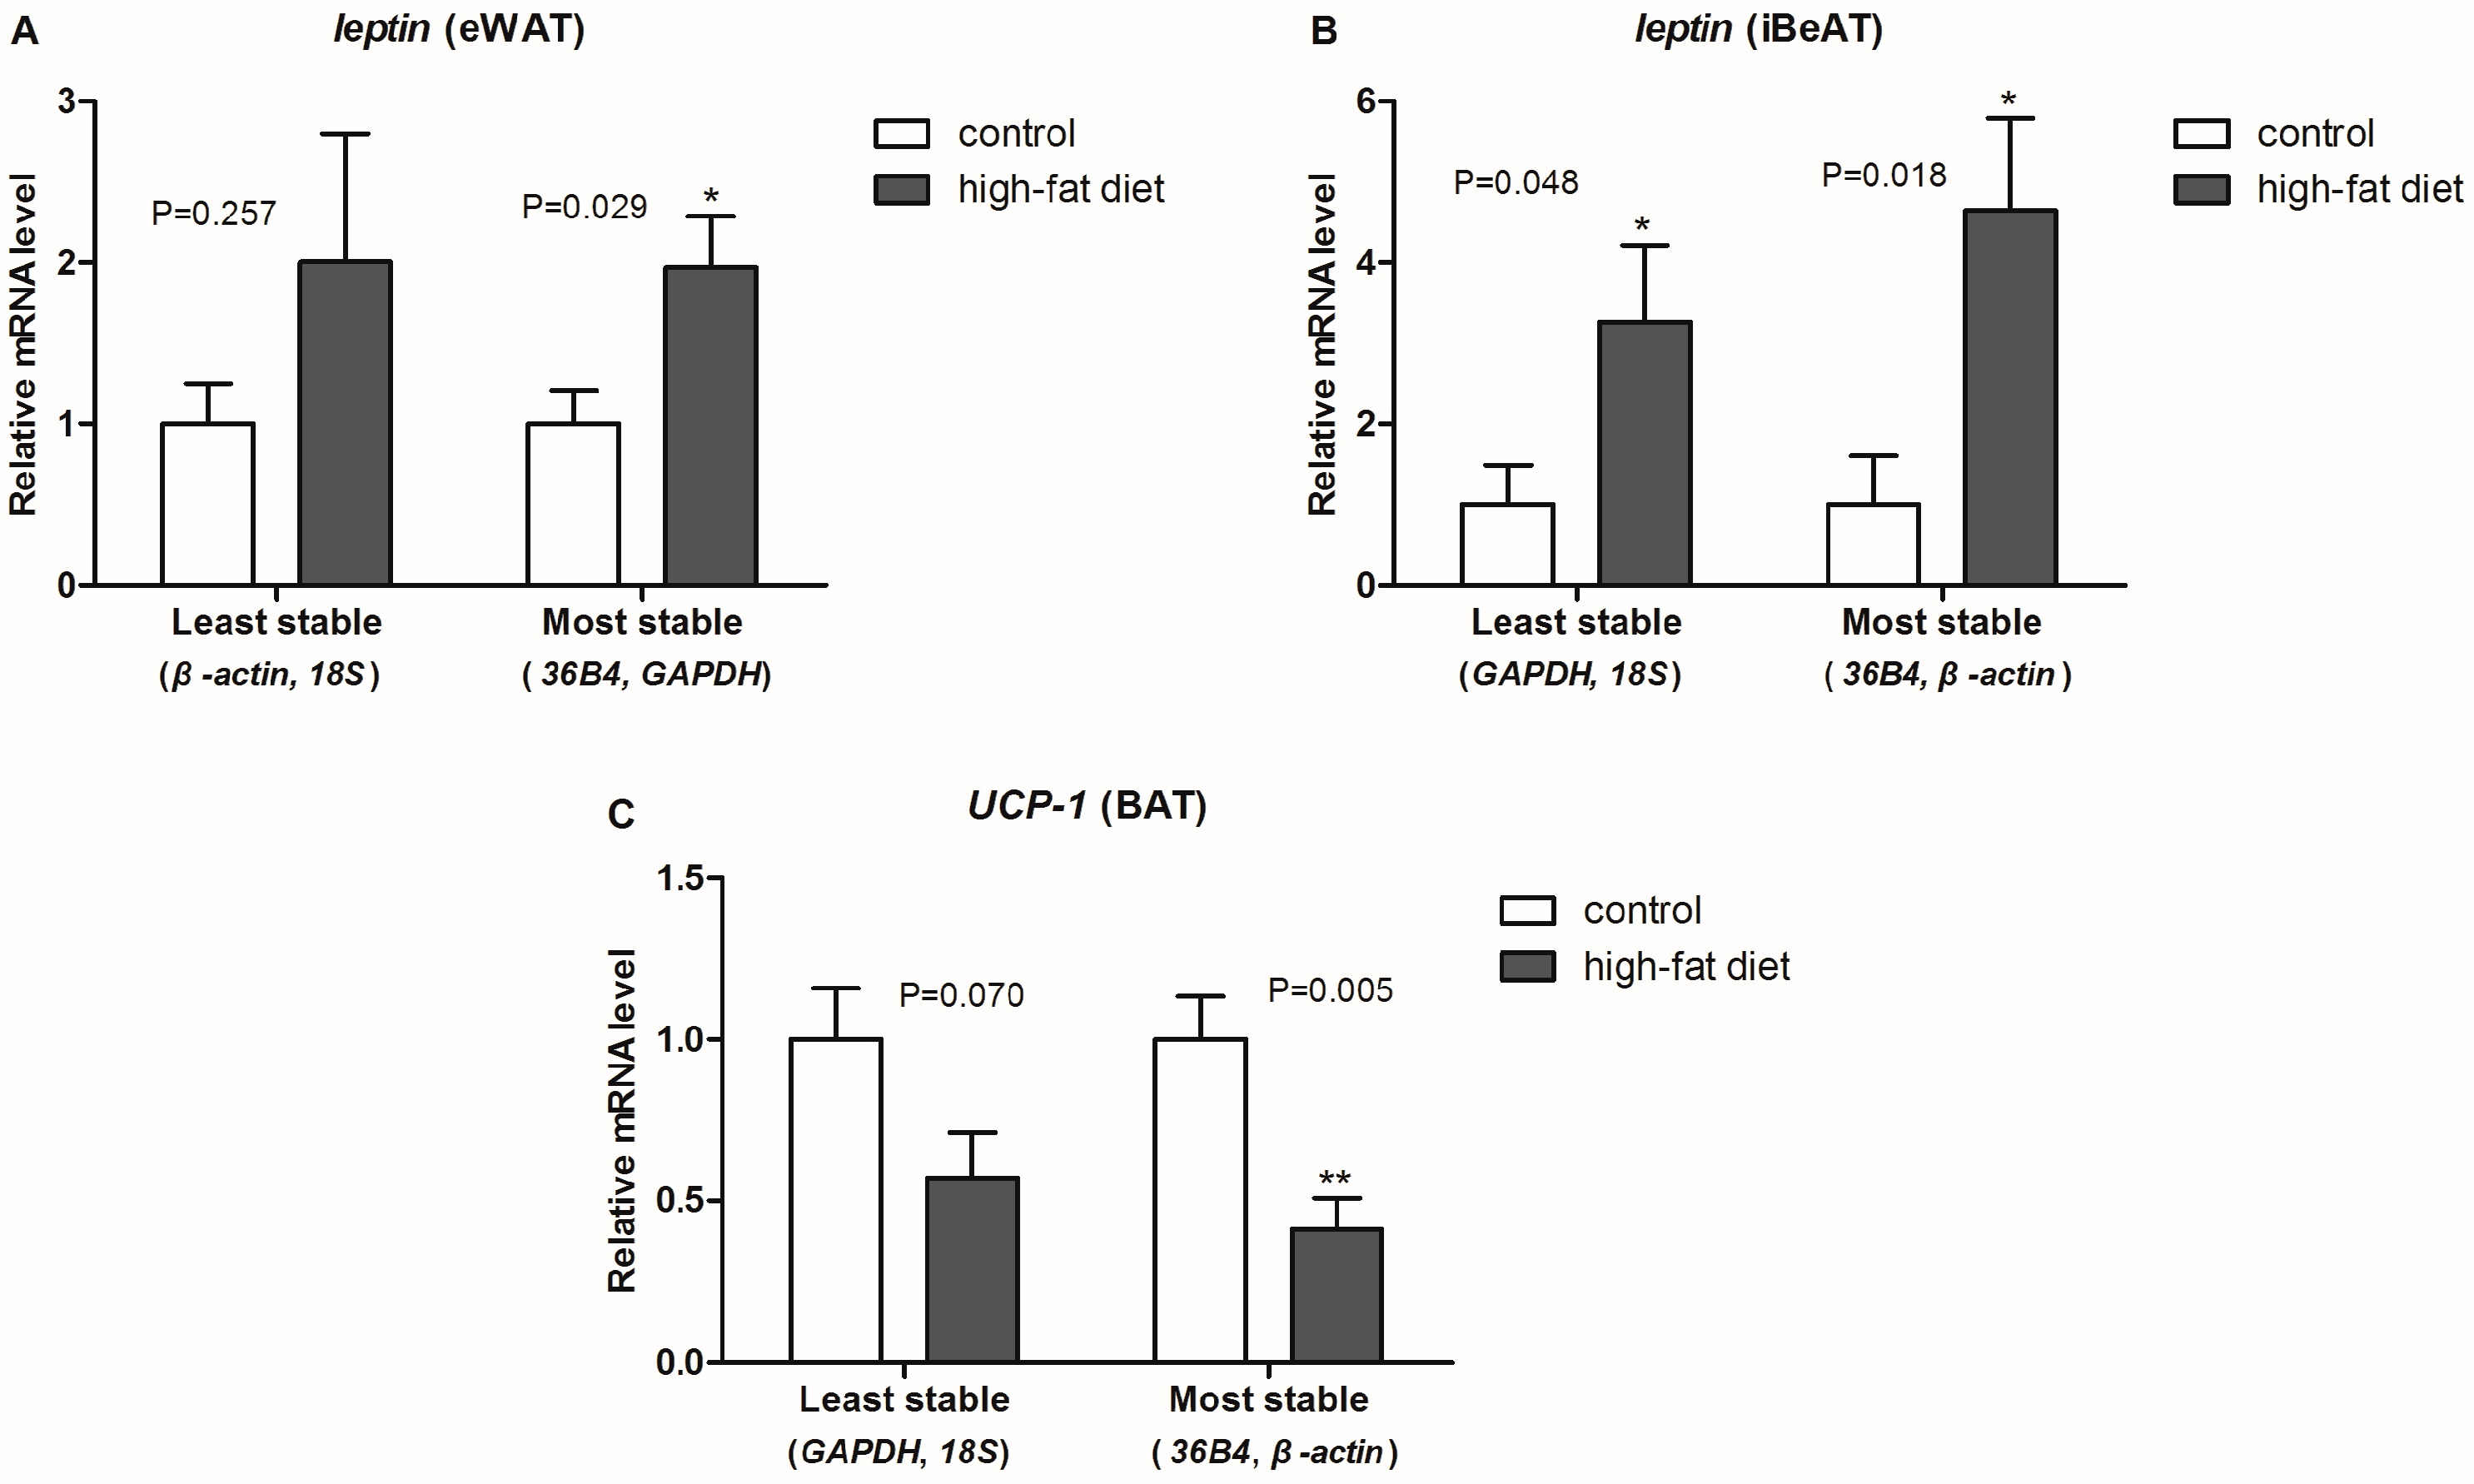
β-actin as the most suitable reference genes for both iBeAT and BAT. To further validate our assumptions in an actual experiment, we used either the combination of most or the least stable reference gene to normalize same target genes (e.g., leptin and UCP-1). As shown in Figure 4, expected results and statistical significance were obtained by normalizing with the two most stable reference genes. This result totally confirmed our assumptions.

4. Experimental Section

4.1. Animals

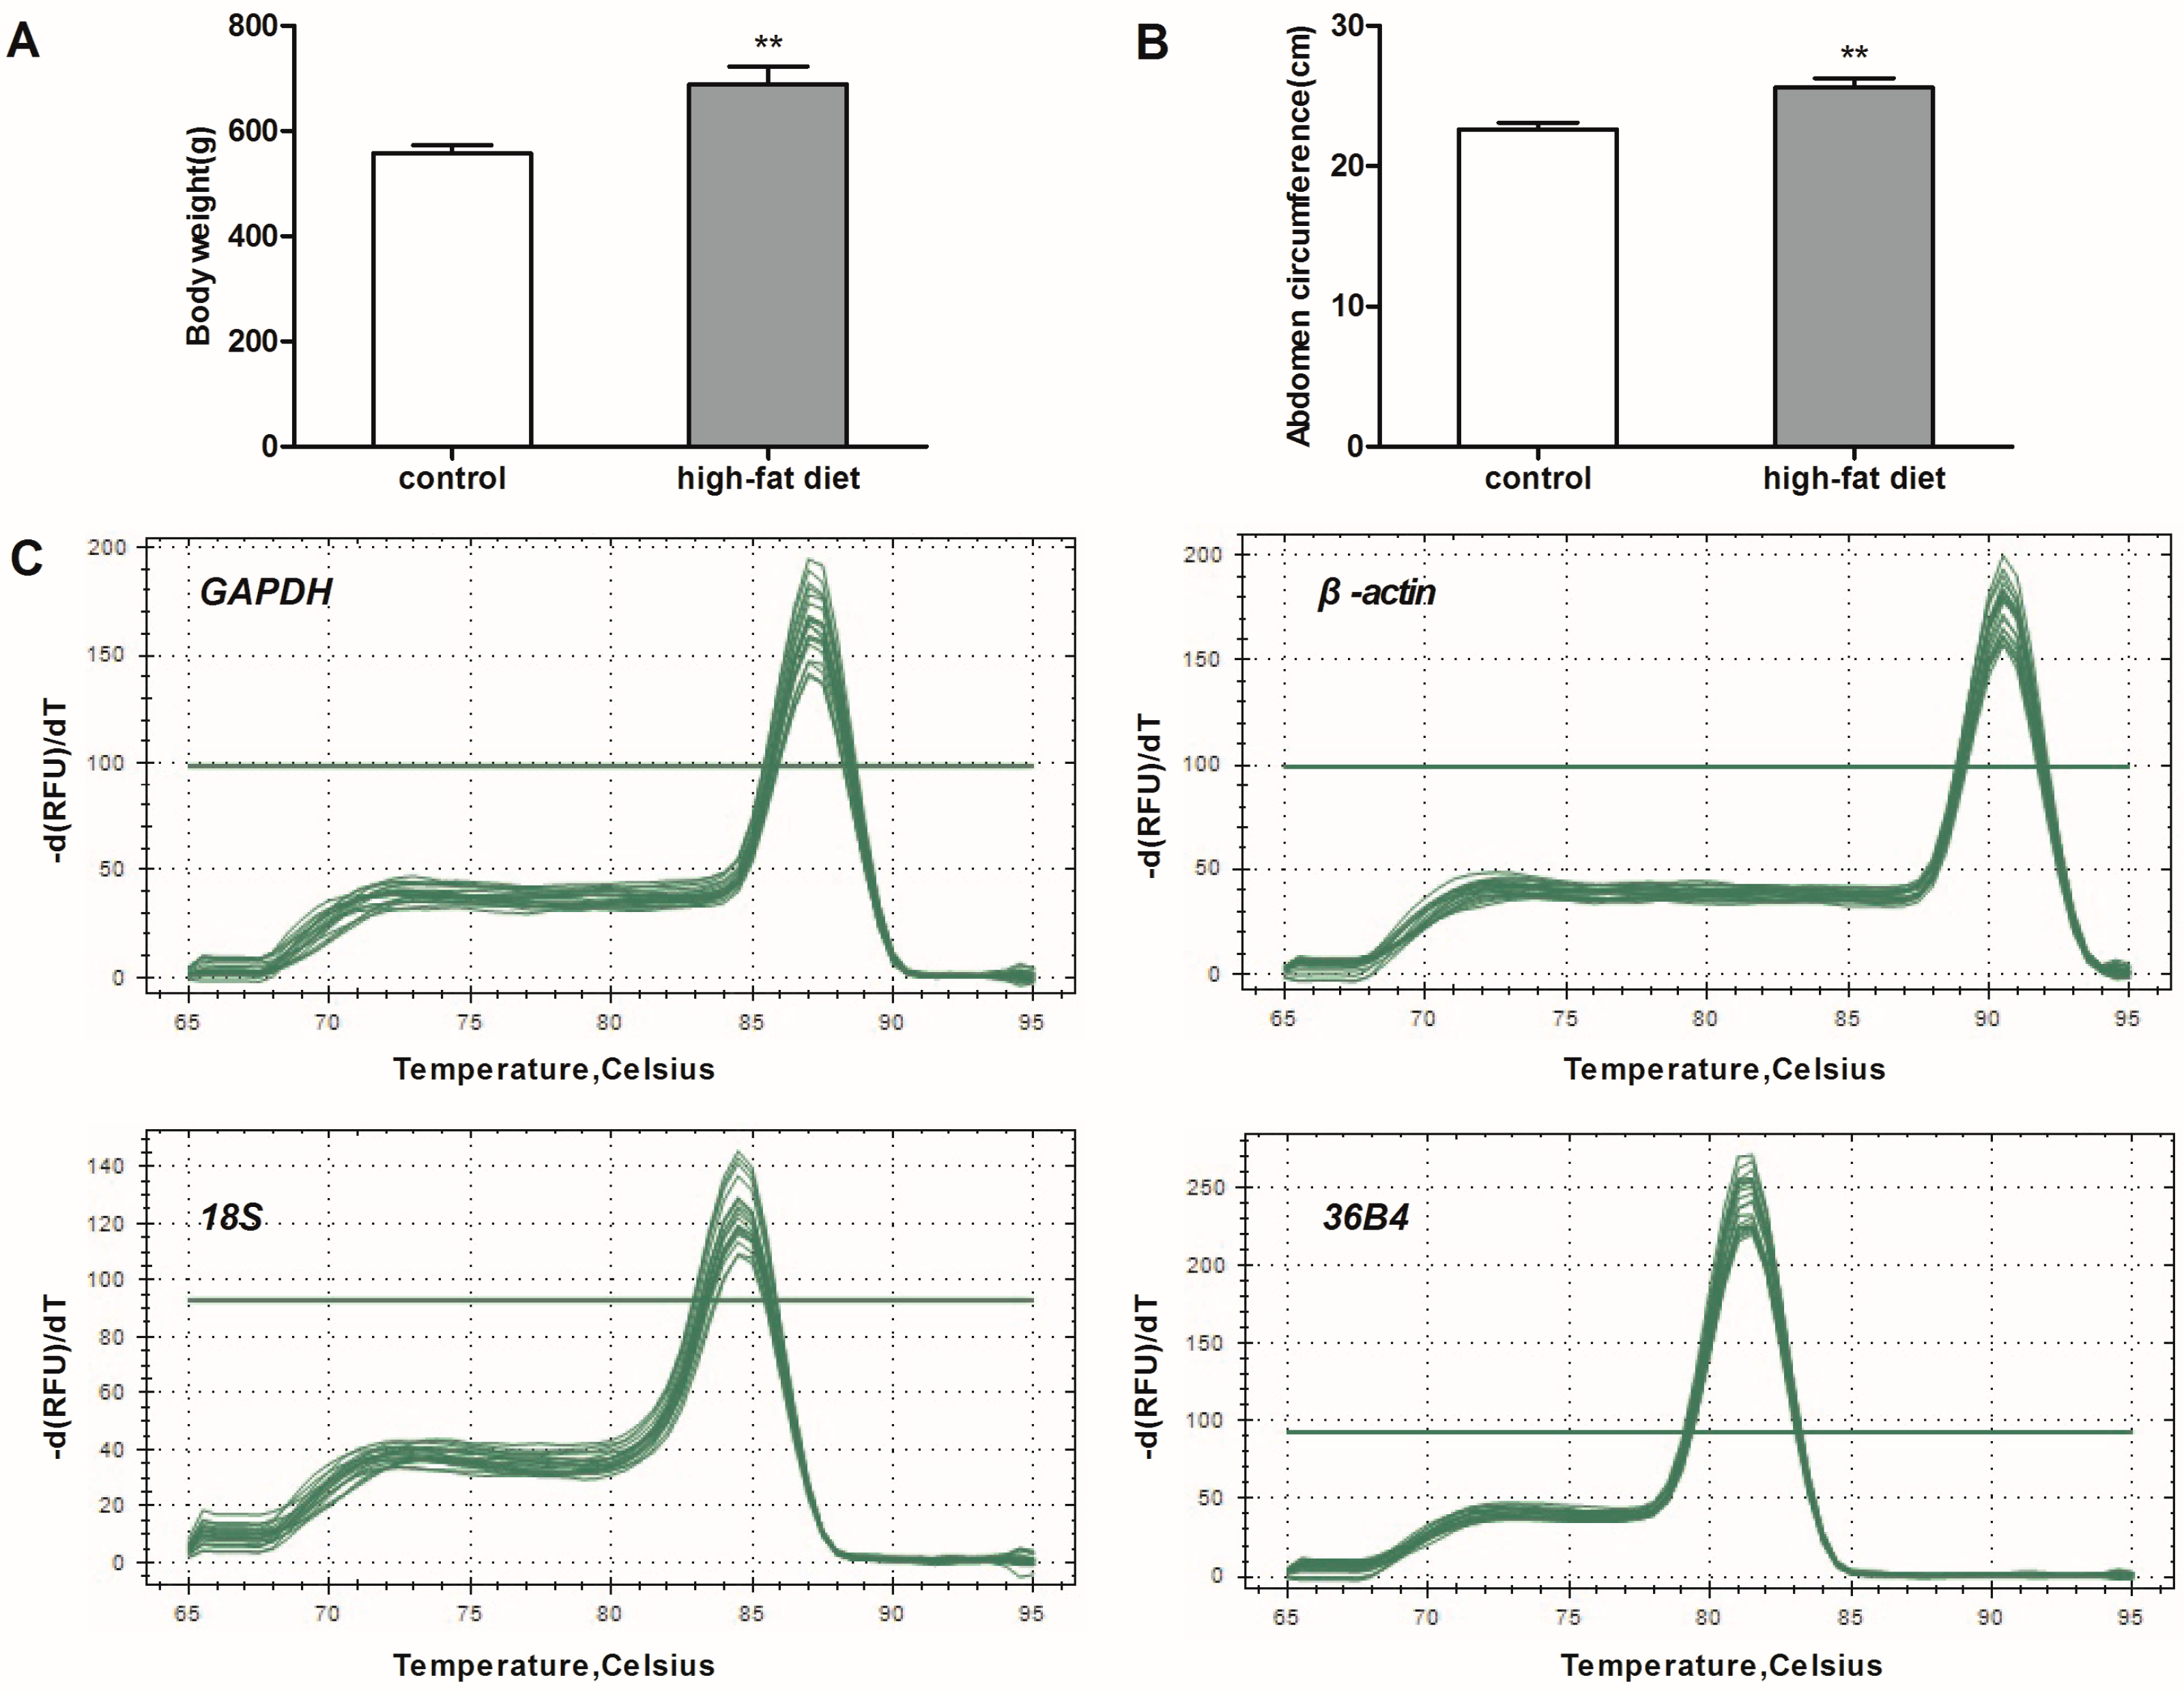
Six-week-old male Wistar rats weighing 150–200 g were provied by the Experimental Center of Hubei Medical Scientific Academy (No. 2008-0005, Wuhan, Hubei, China). Rats were maintained with 12 h light-dark cycles at 22–24 °C room temperature. Rats were randomly assigned to two groups: a high-fat diet group (n = 6) and a control group (n = 6). The rats in the control group were fed a standard chow diet and water ad libitum. Meanwhile, rats in high-fat diet group were fed a high-fat diet (45% calories from fat, D12451) for 20 weeks. The body weight of each rat was monitored weekly until 26 weeks of age. At the end of the experiment, rats fasted for 12 h and were then placed in a separate quiet room for anesthesia. After the disappearance of the righting reflex, the abdominal circumference of animal was measured. Rats were killed by rapid decapitation. eWAT, iBeAT and BAT were collected. Adipose tissues were immediately frozen in liquid nitrogen and later stored at −80 °C for subsequent experiments.

4.2. RNA Isolation, Quantification and cDNA Synthesis

The total RNA of eWAT, iBeAT and BAT were extracted using the Trizol instructed by the manufacturer’s protocol. The oil was removed by repeated centrifugation. The purity of the total RNA was performed on a NanoDrop 2000c spectrophotometer (Thermo Scientific, Wilmington, DE, USA). Only RNA samples with a 260/280 ratio between 1.8 and 2.1 were used in subsequent analyses. cDNA was synthesized from 1 μg of total RNA from eWAT, iBeAT and BAT in control and high-fat diet rats using the PrimeScript RT-PCR kit (Takara Biotech, Kusatsu, Japan) instructed by the manufacturer’s recommendations. After synthesis, the template for qRT-PCR was prepared for further studies by diluting the obtained cDNA tenfold with ultrapure water.

4.3. qRT-PCR

qRT-PCR was conducted on a StepOnePlus™ real-time PCR system (Applied BioSystems, Foster City, CA, USA). Each reaction contained 1 μL of cDNA template and 9 μL of the reaction mixture, which were used in the SYBR Green Core Reagent kit (Applied Biosystems, Foster City, CA, USA). Relative mRNA expression levels were calculated by the ΔΔCt method. The cycling condition is as follows: pre-denaturation, 95 °C for 30 s; denaturation, 95 °C for 10 s; annealing, 60 °C for 30 s; 40 cycles. Then, a melting curve was generated by increasing the temperature from 65 to 95 °C with continuous collection of the SYBR Green fluorescence signal. All primer sequences and relevant parameters about the genes are showed in Table 7.

4.4. Reference Gene Expression Stability Analysis

The initial qRT-PCR data were obtained from the StepOnePlus™ software (Applied BioSystems, Foster City, CA, USA) and put into an Excel datasheet. Then, statistical tools such as GeNorm [17], NormFinder [10] and BestKeeper Version [18] were used to evaluate the stability of gene expression.

4.5. Statistical Analysis

Data were presented as the mean ± SEM. Graphics were performed using Prism (GraphPad Software, Version 5.0, La Jolla, CA, USA). All results were evaluated using an unpaired Student’s t-test, and differences with p < 0.05 were regarded as statistically significant.

5. Conclusions

Combining all of the various software tested, MIQE guidelines and experimental verification, 36B4 and GAPDH were recommended as the optimal combination of reference genes for eWAT, and 36B4 and β-actin were found to be the optimal combination of reference genes for both iBeAT and BAT.

Acknowledgments

This work was supported by grants to You-E Yan from the National Natural Science Foundation of China (No. 81270950 and 81570792), the Hubei Provincial Natural Science Foundation of China (2015CFB183), and the Large-Scale Instrument and Equipment Sharing Foundation of Wuhan University.

Author Contributions

Wan-Xia Zhang and Jie Fan designed and conducted the experiments; Wan-Xia Zhang analyzed the data and wrote the manuscript; Jie Fan, Jing Ma, Yi-Song Rao and Li Zhang participated in study design, data interpretation and revision of the manuscript; You-E Yan, who had full access to all of the data in the study, is the guarantor of this work and takes responsibility for the integrity of the data and the accuracy of data analysis. All authors read and approved the final manuscript.

Conflicts of Interest

The authors declare no conflict of interest.

References

  1. Hilton, C.; Karpe, F.; Pinnick, K.E. Role of developmental transcription factors in white, brown and beige adipose tissues. Biochim. Biophys. Acta 2015, 1851, 686–696. [Google Scholar] [CrossRef] [PubMed]
  2. Harms, M.; Seale, P. Brown and beige fat: Development, function and therapeutic potential. Nat. Med. 2013, 19, 1252–1263. [Google Scholar] [CrossRef] [PubMed]
  3. Park, A.; Kim, W.K.; Bae, K.H. Distinction of white, beige and brown adipocytes derived from mesenchymal stem cells. World J. Stem Cells 2014, 6, 33–42. [Google Scholar] [CrossRef] [PubMed]
  4. Cao, L.; Choi, E.Y.; Liu, X.; Martin, A.; Wang, C.; Xu, X.; During, M.J. White to brown fat phenotypic switch induced by genetic and environmental activation of a hypothalamic-adipocyte axis. Cell Metab. 2011, 14, 324–338. [Google Scholar] [CrossRef] [PubMed]
  5. Wang, J.; Liu, R.; Wang, F.; Hong, J.; Li, X.; Chen, M.; Ke, Y.; Zhang, X.; Ma, Q.; Wang, R.; et al. Ablation of LGR4 promotes energy expenditure by driving white-to-brown fat switch. Nat. Cell Biol. 2013, 15, 1455–1463. [Google Scholar] [CrossRef] [PubMed]
  6. During, M.J.; Liu, X.; Huang, W.; Magee, D.; Slater, A.; McMurphy, T.; Wang, C.; Cao, L. Adipose VEGF links the white-to-brown fat switch with environmental, genetic, and pharmacological stimuli in male mice. Endocrinology 2015, 156, 2059–2073. [Google Scholar] [CrossRef] [PubMed]
  7. Gorzelniak, K.; Janke, J.; Engeli, S.; Sharma, A.M. Validation of endogenous controls for gene expression studies in human adipocytes and preadipocytes. Horm. Metab. Res. 2001, 33, 625–627. [Google Scholar] [CrossRef] [PubMed]
  8. Bustin, S.A.; Nolan, T. Pitfalls of quantitative real-time reverse-transcription polymerase chain reaction. J. Biomol. Tech. 2004, 15, 155–166. [Google Scholar] [PubMed]
  9. Bustin, S.A. Quantification of mRNA using real-time reverse transcription PCR (RT-PCR): Trends and problems. J. Mol. Endocrinol. 2002, 29, 23–39. [Google Scholar] [CrossRef] [PubMed]
  10. Andersen, C.L.; Jensen, J.L.; Orntoft, T.F. Normalization of real-time quantitative reverse transcription-PCR data: A model-based variance estimation approach to identify genes suited for normalization, applied to bladder and colon cancer data sets. Cancer Res. 2004, 64, 5245–5250. [Google Scholar] [CrossRef] [PubMed]
  11. Derveaux, S.; Vandesompele, J.; Hellemans, J. How to do successful gene expression analysis using real-time PCR. Methods 2010, 50, 227–230. [Google Scholar] [CrossRef] [PubMed]
  12. Radonic, A.; Thulke, S.; Mackay, I.M.; Landt, O.; Siegert, W.; Nitsche, A. Guideline to reference gene selection for quantitative real-time PCR. Biochem. Biophys. Res. Commun. 2004, 313, 856–862. [Google Scholar] [CrossRef] [PubMed]
  13. Li, T.; Guo, K.K.; Qu, W.; Han, Y.; Wang, S.S.; Lin, M.; An, S.S.; Li, X.; Ma, S.X.; Wang, T.Y.; et al. Important role of 5-hydroxytryptamine in glucocorticoid-induced insulin resistance in liver and intra-abdominal adipose tissue of rats. J. Diabetes Investig. 2016, 7, 32–41. [Google Scholar] [CrossRef] [PubMed]
  14. Chen, Y.; Xu, X.S.; Zhang, Y.Y.; Liu, K.; Huang, F.; Liu, B.L.; Kou, J.P. Diosgenin regulates adipokine expression in perivascular adipose tissue and ameliorates endothelial dysfunction via regulation of AMPK. J. Steroid Biochem. 2016, 155, 155–165. [Google Scholar] [CrossRef] [PubMed]
  15. Minakuchi, H.; Wakino, S.; Hosoya, K.; Sueyasu, K.; Hasegawa, K.; Shinozuka, K.; Yoshifuji, A.; Futatsugi, K.; Komatsu, M.; Kanda, T.; et al. The role of adipose tissue asymmetric dimethylarginine/dimethylarginine dimethylaminohydrolase pathway in adipose tissue phenotype and metabolic abnormalities in subtotally nephrectomized rats. Nephrol. Dial. Transplant. 2016, 31, 413–423. [Google Scholar] [CrossRef] [PubMed]
  16. Su, R.; Yan, J.; Yang, H. Transgenerational glucose intolerance of tumor necrosis factor with epigenetic alteration in rat perirenal adipose tissue induced by intrauterine hyperglycemia. J. Diabetes Res. 2016. [Google Scholar] [CrossRef] [PubMed]
  17. Vandesompele, J.; de Preter, K.; Pattyn, F.; Poppe, B.; van Roy, N.; de Paepe, A.; Speleman, F. Accurate normalization of real-time quantitative RT-PCR data by geometric averaging of multiple internal control genes. Genome Biol. 2002, 3. [Google Scholar] [CrossRef] [Green Version]
  18. Pfaffl, M.W.; Tichopad, A.; Prgomet, C.; Neuvians, T.P. Determination of stable housekeeping genes, differentially regulated target genes and sample integrity: BestKeeper—Excel-based tool using pairwise correlations. Biotechnol. Lett. 2004, 26, 509–515. [Google Scholar] [CrossRef] [PubMed]
  19. Bustin, S.A.; Benes, V.; Garson, J.A.; Hellemans, J.; Huggett, J.; Kubista, M.; Mueller, R.; Nolan, T.; Pfaffl, M.W.; Shipley, G.L.; et al. The MIQE guidelines: Minimum information for publication of quantitative real-time pcr experiments. Clin. Chem. 2009, 55, 611–622. [Google Scholar] [CrossRef] [PubMed]
  20. Wang, Q.; Ishikawa, T.; Michiue, T.; Zhu, B.L.; Guan, D.W.; Maeda, H. Stability of endogenous reference genes in postmortem human brains for normalization of quantitative real-time PCR data: Comprehensive evaluation using geNorm, NormFinder, and BestKeeper. Int. J. Leg. Med. 2012, 126, 943–952. [Google Scholar] [CrossRef] [PubMed]
  21. Zeng, C.J.; He, L.; Peng, W.P.; Ding, L.; Tang, K.Y.; Fang, D.H.; Zhang, Y. Selection of optimal reference genes for quantitative RT-PCR studies of boar spermatozoa cryopreservation. Cryobiology 2014, 68, 113–121. [Google Scholar] [CrossRef] [PubMed]
  22. Purohit, G.K.; Mahanty, A.; Mohanty, B.P.; Mohanty, S. Evaluation of housekeeping genes as references for quantitative real-time PCR analysis of gene expression in the murrel Channa striatus under high-temperature stress. Fish Physiol. Biochem. 2016, 42, 125–135. [Google Scholar] [CrossRef] [PubMed]
  23. Sugimoto, S.; Nakajima, H.; Kodo, K.; Mori, J.; Matsuo, K.; Kosaka, K.; Aoi, W.; Yoshimoto, K.; Ikegaya, H.; Hosoi, H. Miglitol increases energy expenditure by upregulating uncoupling protein 1 of brown adipose tissue and reduces obesity in dietary-induced obese mice. Nutr. Metab. 2014, 11. [Google Scholar] [CrossRef] [PubMed]
  24. Bustin, S.A. Absolute quantification of mRNA using real-time reverse transcription polymerase chain reaction assays. J. Mol. Endocrinol. 2000, 25, 169–193. [Google Scholar] [CrossRef] [PubMed]
  25. Nazari, F.; Parham, A.; Maleki, A.F. GAPDH, β-actin and β2-microglobulin, as three common reference genes, are not reliable for gene expression studies in equine adipose- and marrow-derived mesenchymal stem cells. J. Anim. Sci. Technol. 2015, 57, 18. [Google Scholar] [CrossRef] [PubMed]
  26. Glare, E.M.; Divjak, M.; Bailey, M.J.; Walters, E.H. β-Actin and GAPDH housekeeping gene expression in asthmatic airways is variable and not suitable for normalising mRNA levels. Thorax 2002, 57, 765–770. [Google Scholar] [CrossRef] [PubMed]
  27. Catalan, V.; Gomez-Ambrosi, J.; Rotellar, F.; Silva, C.; Rodriguez, A.; Salvador, J.; Gil, M.J.; Cienfuegos, J.A.; Fruhbeck, G. Validation of endogenous control genes in human adipose tissue: Relevance to obesity and obesity-associated type 2 diabetes mellitus. Horm. Metab. Res. 2007, 39, 495–500. [Google Scholar] [CrossRef] [PubMed]
  28. Akamine, R.; Yamamoto, T.; Watanabe, M.; Yamazaki, N.; Kataoka, M.; Ishikawa, M.; Ooie, T.; Baba, Y.; Shinohara, Y. Usefulness of the 5′ region of the cDNA encoding acidic ribosomal phosphoprotein P0 conserved among rats, mice, and humans as a standard probe for gene expression analysis in different tissues and animal species. J. Biochem. Biophys. Methods 2007, 70, 481–486. [Google Scholar] [CrossRef] [PubMed]
  29. Sepa-Kishi, D.M.; Ceddia, R.B. Exercise-mediated effects on white and brown adipose tissue plasticity and metabolism. Exerc. Sport Sci. Rev. 2016, 44, 37–44. [Google Scholar] [CrossRef] [PubMed]
Figure 1. Body weight, abdominal circumference and melting curves for the quantitative real-time polymerase chain reaction (qRT-PCR) products. (A) body weight (n = 6); (B) abdomen circumference (n = 6); (C) melting curves for the qRT-PCR products. The single sharp peak represents a specific qRT-PCR product. GAPDH: Glyceraldehyde-3-phosphate dehydrogenase; 36B4: acidic ribosomal phosphoprotein P0. ** p < 0.01 vs. control.
Ijms 17 00968 g001
Figure 2. Expression levels of the reference genes in different types of adipose tissues between control and high-fat diet groups (mean ± SEM, n = 6). GAPDH: Glyceraldehyde-3-phosphate dehydrogenase; 36B4: acidic ribosomal phosphoprotein P0; eWAT: epididymal white adipose tissue; iBeAT: inguinal beige adipose tissues; BAT: brown adipose tissue.
Ijms 17 00968 g002
Figure 3. Expression stability values and ranking of the reference genes in different types of adipose tissue by geNorm and NormFinder (n = 12). (AC) gene expression stability values (M) in epididymal white adipose tissue (eWAT), inguinal beige adipose tissues (iBeAT) and brown adipose tissue (BAT) by geNorm; (DF) gene expression stability values in eWAT, iBeAT and BAT by NormFinder. GAPDH: Glyceraldehyde-3-phosphate dehydrogenase; 36B4: acidic ribosomal phosphoprotein P0.
Ijms 17 00968 g003
Figure 4. Relative mRNA levels of two target genes in different adipose tissue. (mean ± SEM, n = 6). The relative mRNA levels of two target genes, normalized with the geometric means of the abundance of the most or least stable reference genes, in different adipose tissue. (A) the relative mRNA levels of leptin in epididymal white adipose tissue (eWAT); (B) the relative mRNA levels of leptin in inguinal beige adipose tissues (iBeAT); (C) the relative mRNA levels of uncoupling protein 1 (UCP-1) in brown adipose tissue (BAT). GAPDH: Glyceraldehyde-3-phosphate dehydrogenase; 36B4: acidic ribosomal phosphoprotein P0. * p < 0.05, ** p < 0.01 vs. control.
Ijms 17 00968 g004
Table 1. Expression stability of four reference gene in epididymal white adipose tissue (eWAT) evaluated by BestKeeper (n = 12).
GeneGeometric Mean (Ct)Arithmetic Mean (Ct)Minimum (Ct)Maximum (Ct)Standard Deviation (±Ct)Coefficient of Variance (% Ct)Correlation Coefficients (r)
36B422.3822.3921.2423.690.532.360.789
GAPDH22.1022.1120.7623.910.693.120.878
β-actin19.6019.6217.7720.990.763.860.788
18S16.2716.3114.6518.821.056.440.705
Table 2. Expression stability of four reference gene in brown adipose tissue (BAT) evaluated by BestKeeper (n = 12).
GeneGeometric Mean (Ct)Arithmetic Mean (Ct)Minimum (Ct)Maximum (Ct)Standard Deviation (±Ct)Coefficient of Variance (% Ct)Correlation Coefficients (r)
36B423.7823.8020.8925.260.783.260.960
β-actin21.4221.4618.4823.940.944.380.965
18S15.9315.9613.7417.990.754.680.933
GAPDH22.0322.0818.4524.901.125.060.953
Table 3. Expression stability of four reference gene in inguinal beige adipose tissues (iBeAT) evaluated by BestKeeper (n = 12).
GeneGeometric Mean (Ct)Arithmetic Mean (Ct)Minimum (Ct)Maximum (Ct)Standard Deviation (±Ct)Coefficient of Variance (% Ct)Correlation Coefficients (r)
36B422.6622.6820.9323.670.672.970.798
GAPDH22.4322.4519.9223.750.733.230.712
18S16.9716.9815.9918.410.663.870.751
β-actin19.8819.9117.8921.930.894.450.864
Table 4. Comprehensive ranking (eWAT).
Ranking OrdergeNormNormFinderBestKeeperComprehensive Ranking (Mean Rank Value)
CVr
1GAPDHGAPDH36B4GAPDHGAPDH (1.25)
236B436B4GAPDH36B436B4 (1.75)
3β-actinβ-actinβ-actinβ-actinβ-actin (3.00)
418S18S--18S (4.00)
Table 5. Comprehensive ranking (iBeAT).
Ranking OrderGeNormNormFinderBestKeeperComprehensive Ranking (Mean Rank Value)
CVr
136B436B436B436B436B4 (1.00)
2β-actinβ-actinGAPDH18Sβ-actin (2.00)
318S18S18SGAPDH18S (3.00)
4GAPDHGAPDH--GAPDH (4.00)
Table 6. Comprehensive ranking (BAT).
Ranking OrderGeNormNormFinderBestKeeperComprehensive Ranking (Mean Rank Value)
CVr
136B436B436B4β-actin36B4 (1.25)
2β-actinβ-actinβ-actin36B4β-actin (1.75)
318S18S18S18S18S (3.00)
4GAPDHGAPDH--GAPDH (4.00)
Table 7. Descriptions of reference genes and parameters derived from quantitative real-time polymerase chain reaction analysis.
GenesGene FunctionGene Accession NumberPrimer Sequence (Forward/Reverse)Tm (°C)Product (bp)Amplification Efficiency (%)R2
GAPDHglycolysis, glucose metabolismNM 017008.4TGCCACTCAGAAGACTGTGG/TTCAGCTCTGGGATGACCTT60 °C12999.10.994
18Sribosomal proteinNR 046237.1GGAGAGGGAGCCTGAGAAAC/CAATTACAGGGCCTCGAAAG60 °C128109.70.994
β-actinstructural constituent of cytoskeletonNM 031144.3ATGGATGACGATATCGCTGC/CTTCTGACCCATACCCACCA60 °C15093.40.994
36B4structural constituent of ribosomeXM 015505154.1CGACCTGGAAGTCCAACTAC/ATCTGCTGCATCTGCTTG60 °C109100.20.997
leptinregulates food intake and energy metabolismNM 013076.3TTTCACACACGCAGTCGGTATC/GGTCTGGTCCATCTTGGACAAA60 °C10199.20.997
UCP-1participate in nonshivering thermogenesisNM 012682.2GCCTCTACGATACGGTCCAA/TGCATTCTGACCTTCACCAC60 °C14593.40.997

