
Revisiting the Lamotrigine-Mediated Effect on Hippocampal GABAergic Transmission

 ,
,
Abstract
:
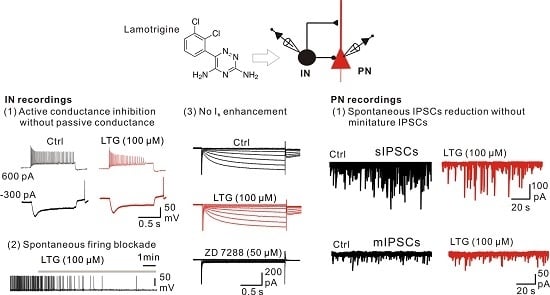
1. Introduction
2. Results
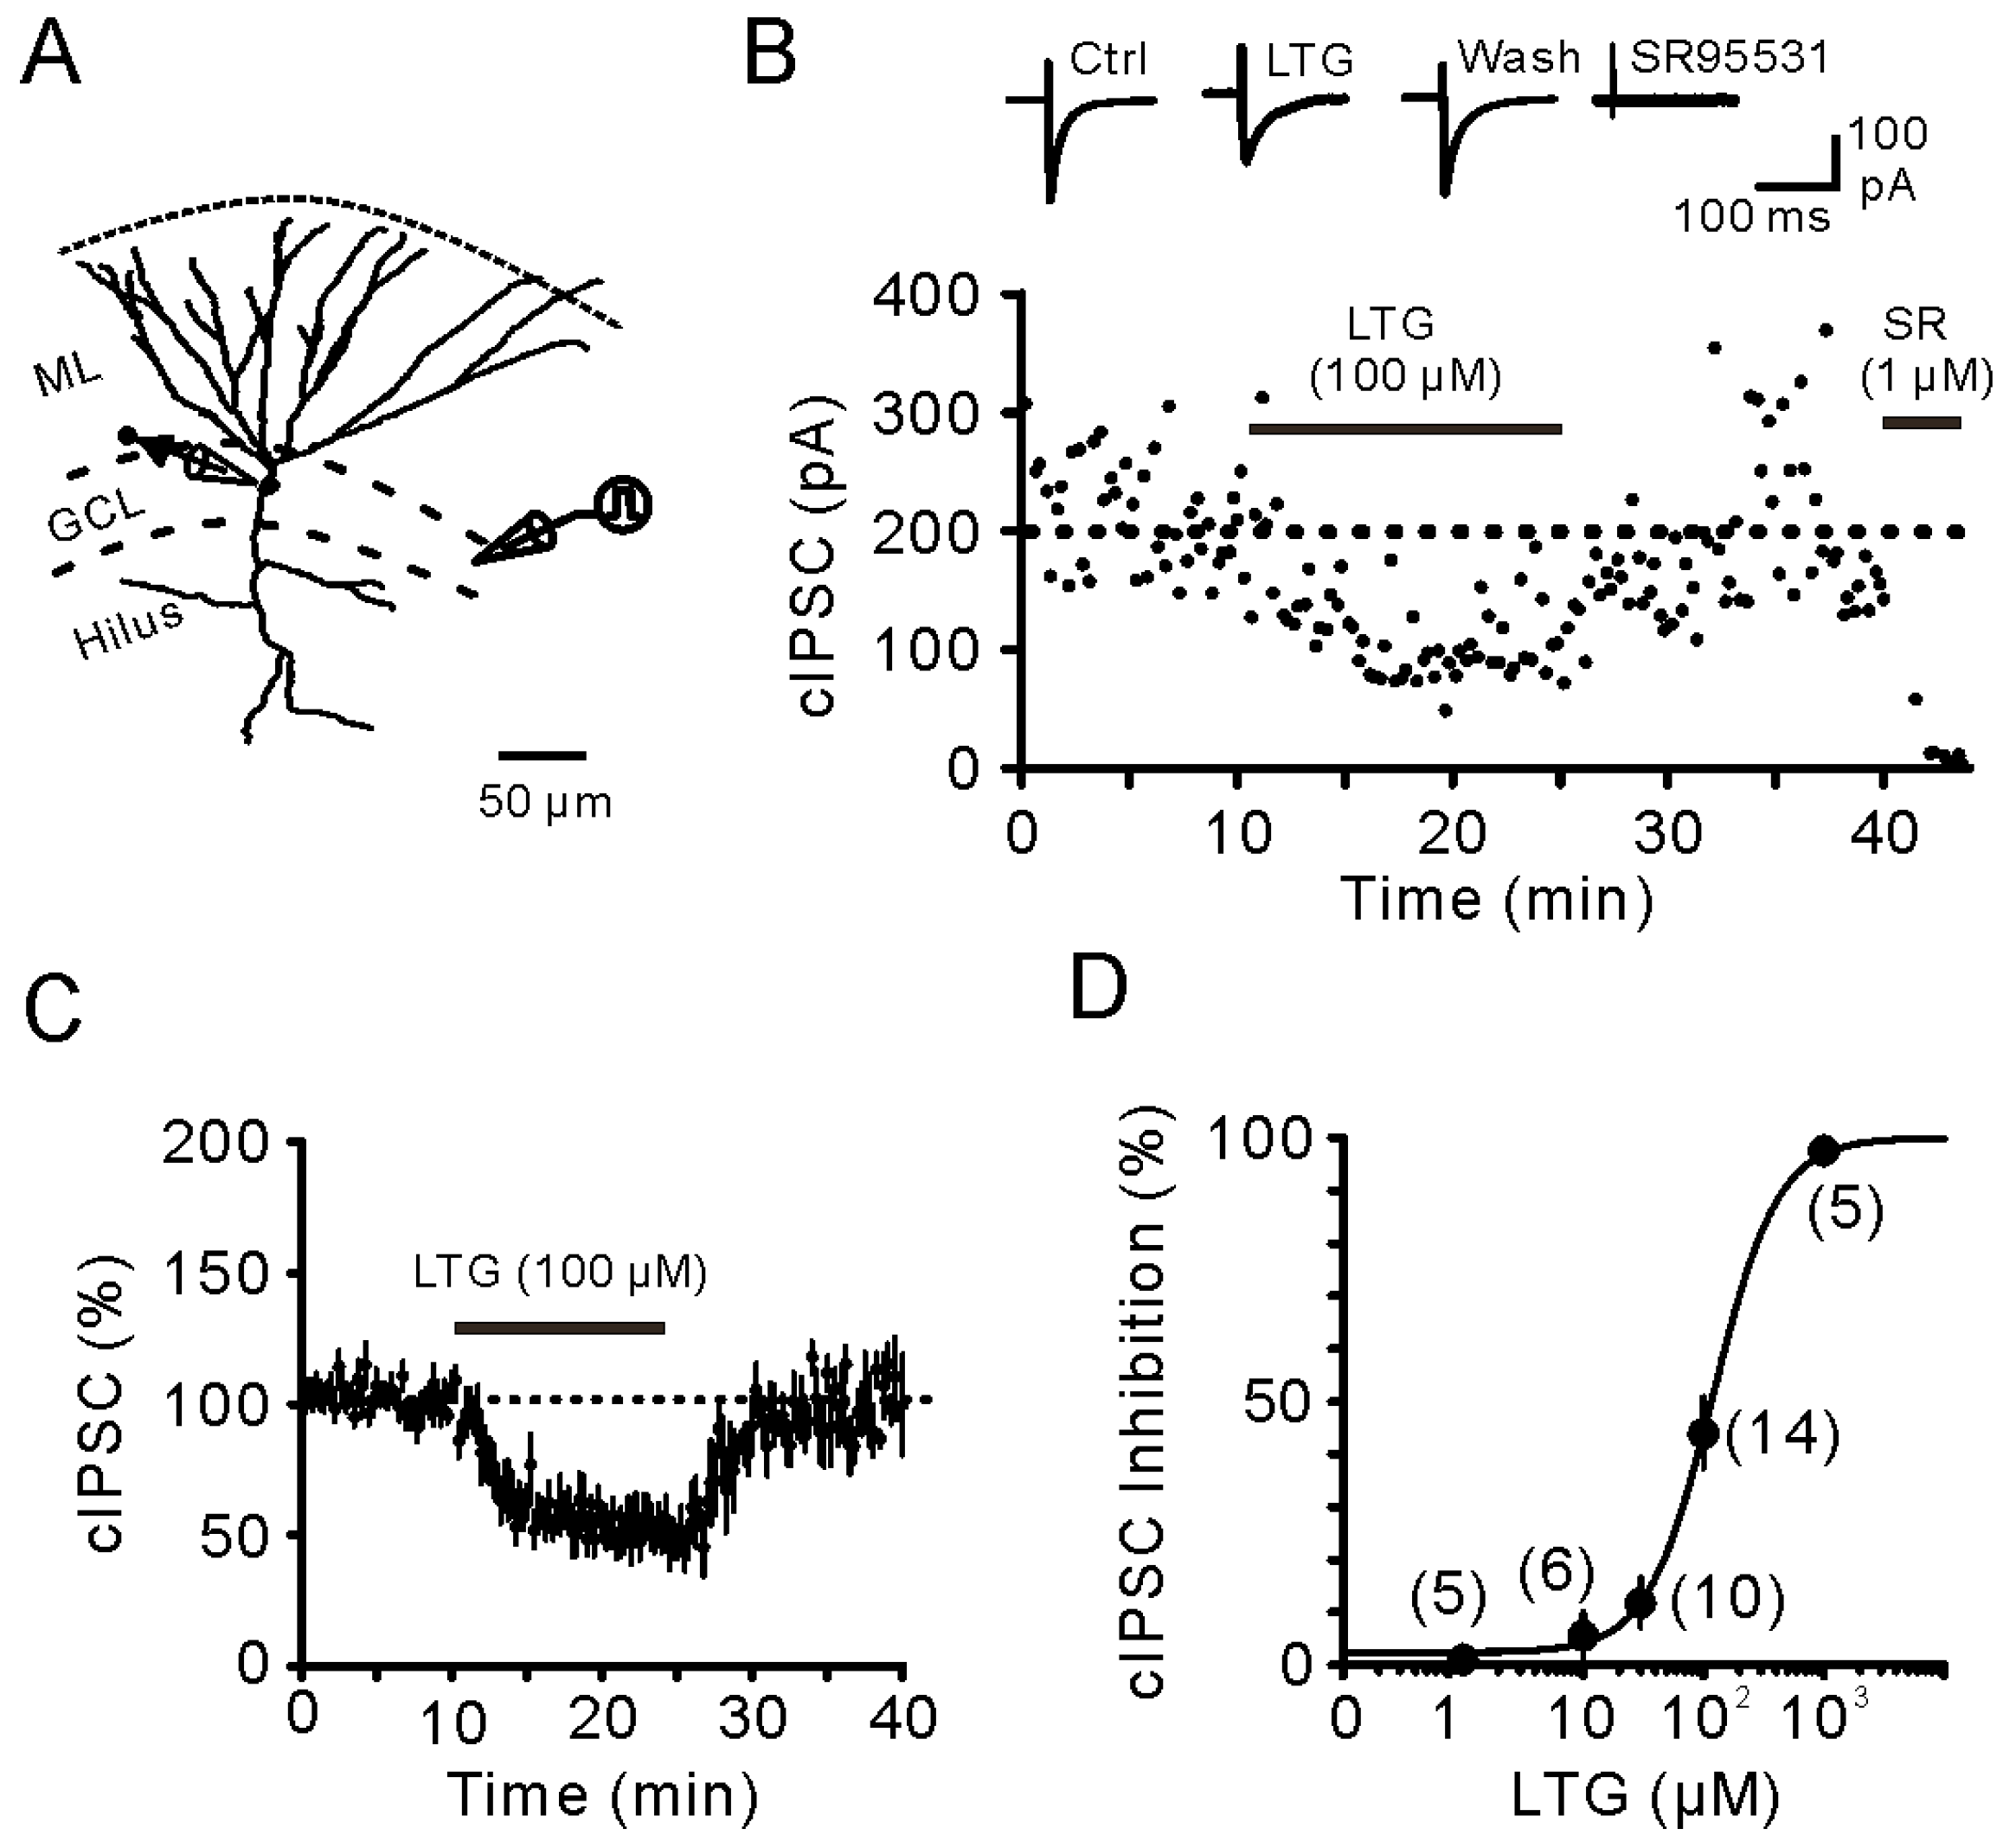
2.1. Bath Application of LTG Resulted in the Reduction of Compound IPSCs
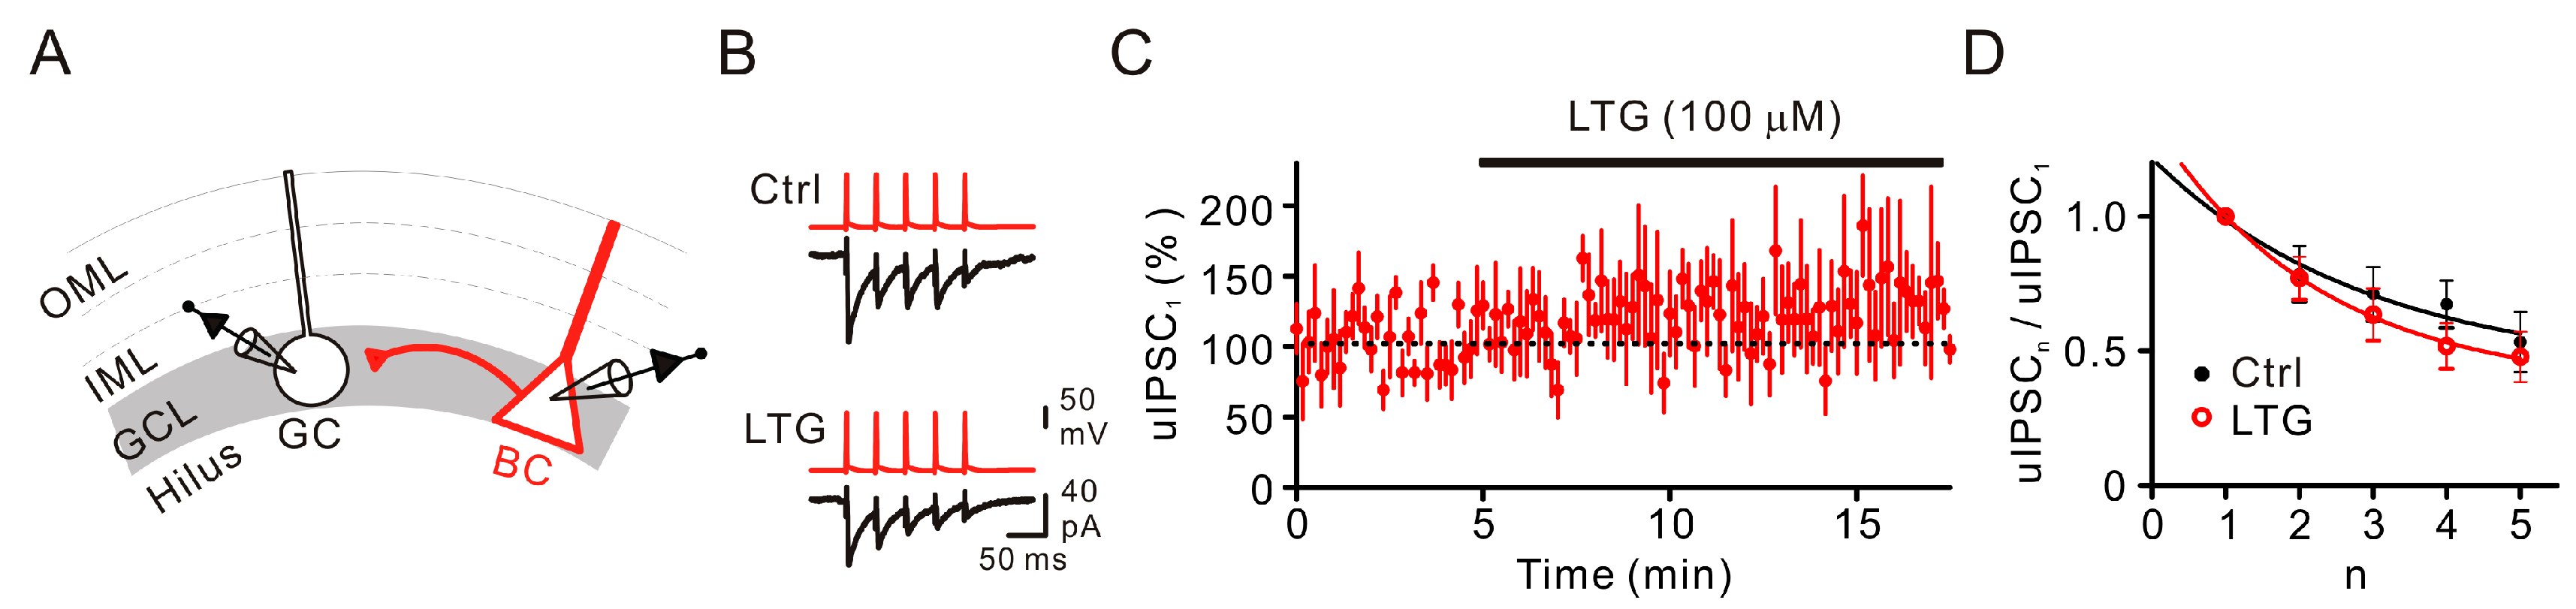
2.2. LTG Had No Effects on Unitary IPSCs
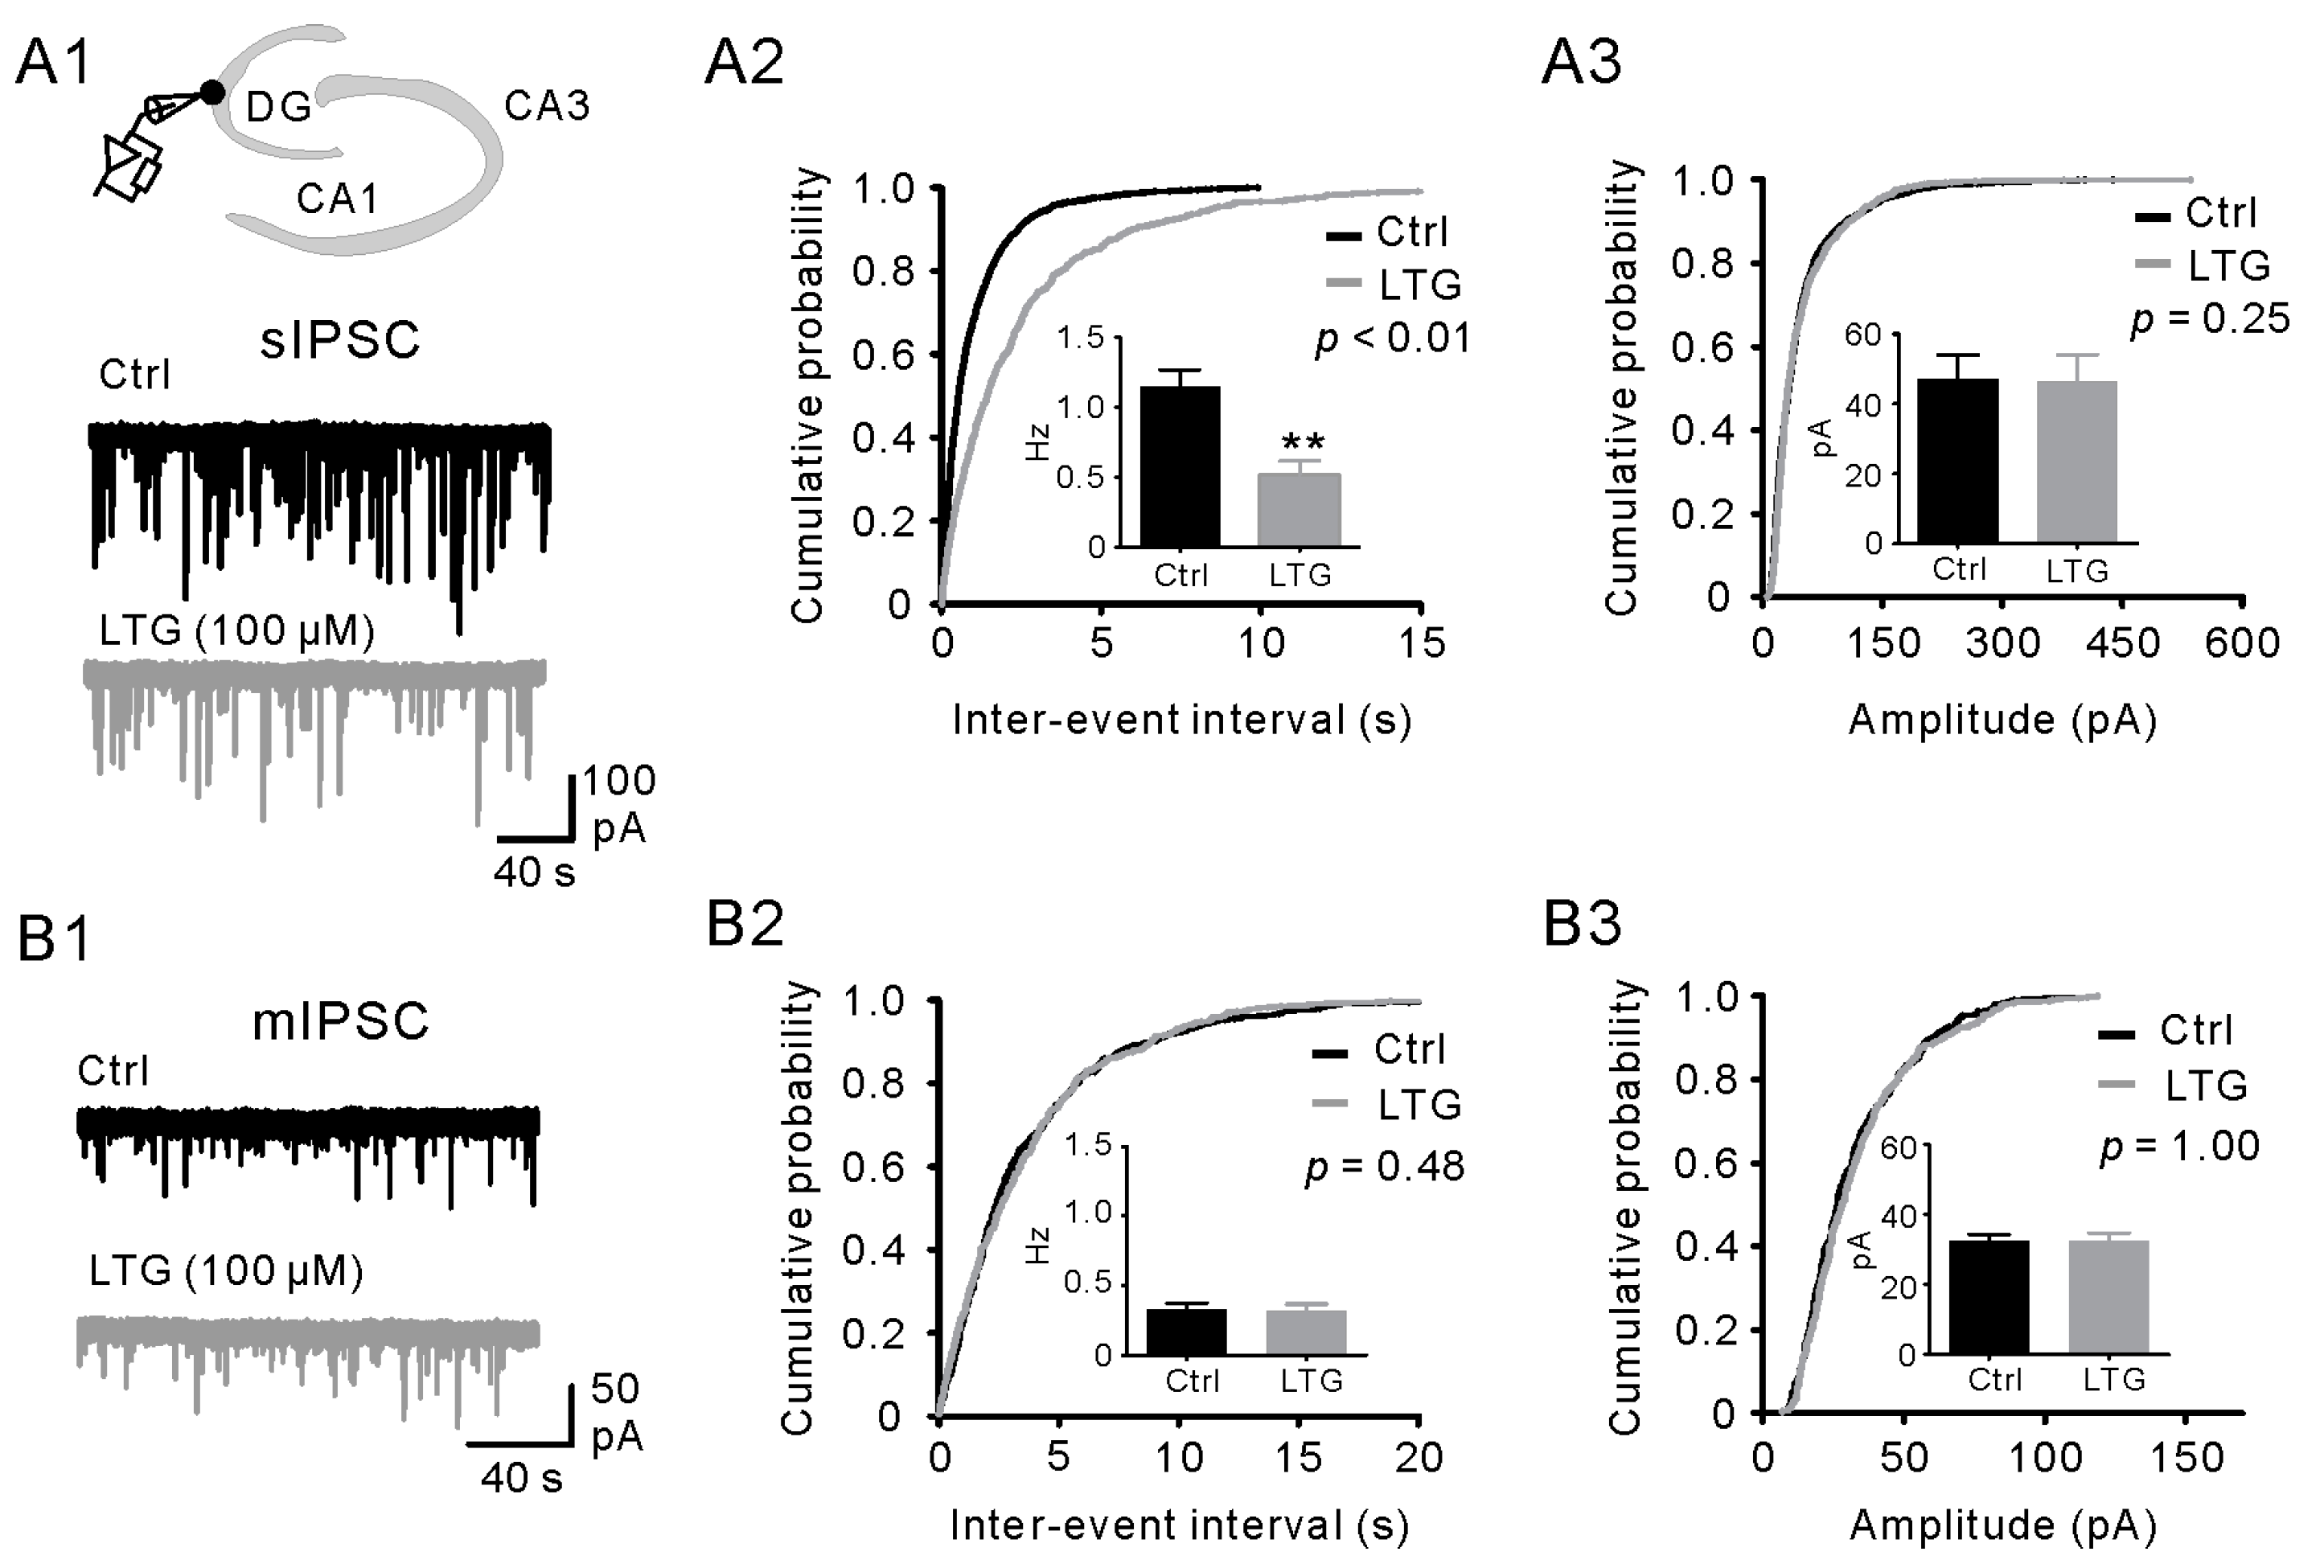
2.3. LTG Decreased sIPSCs, but Not mIPSCs
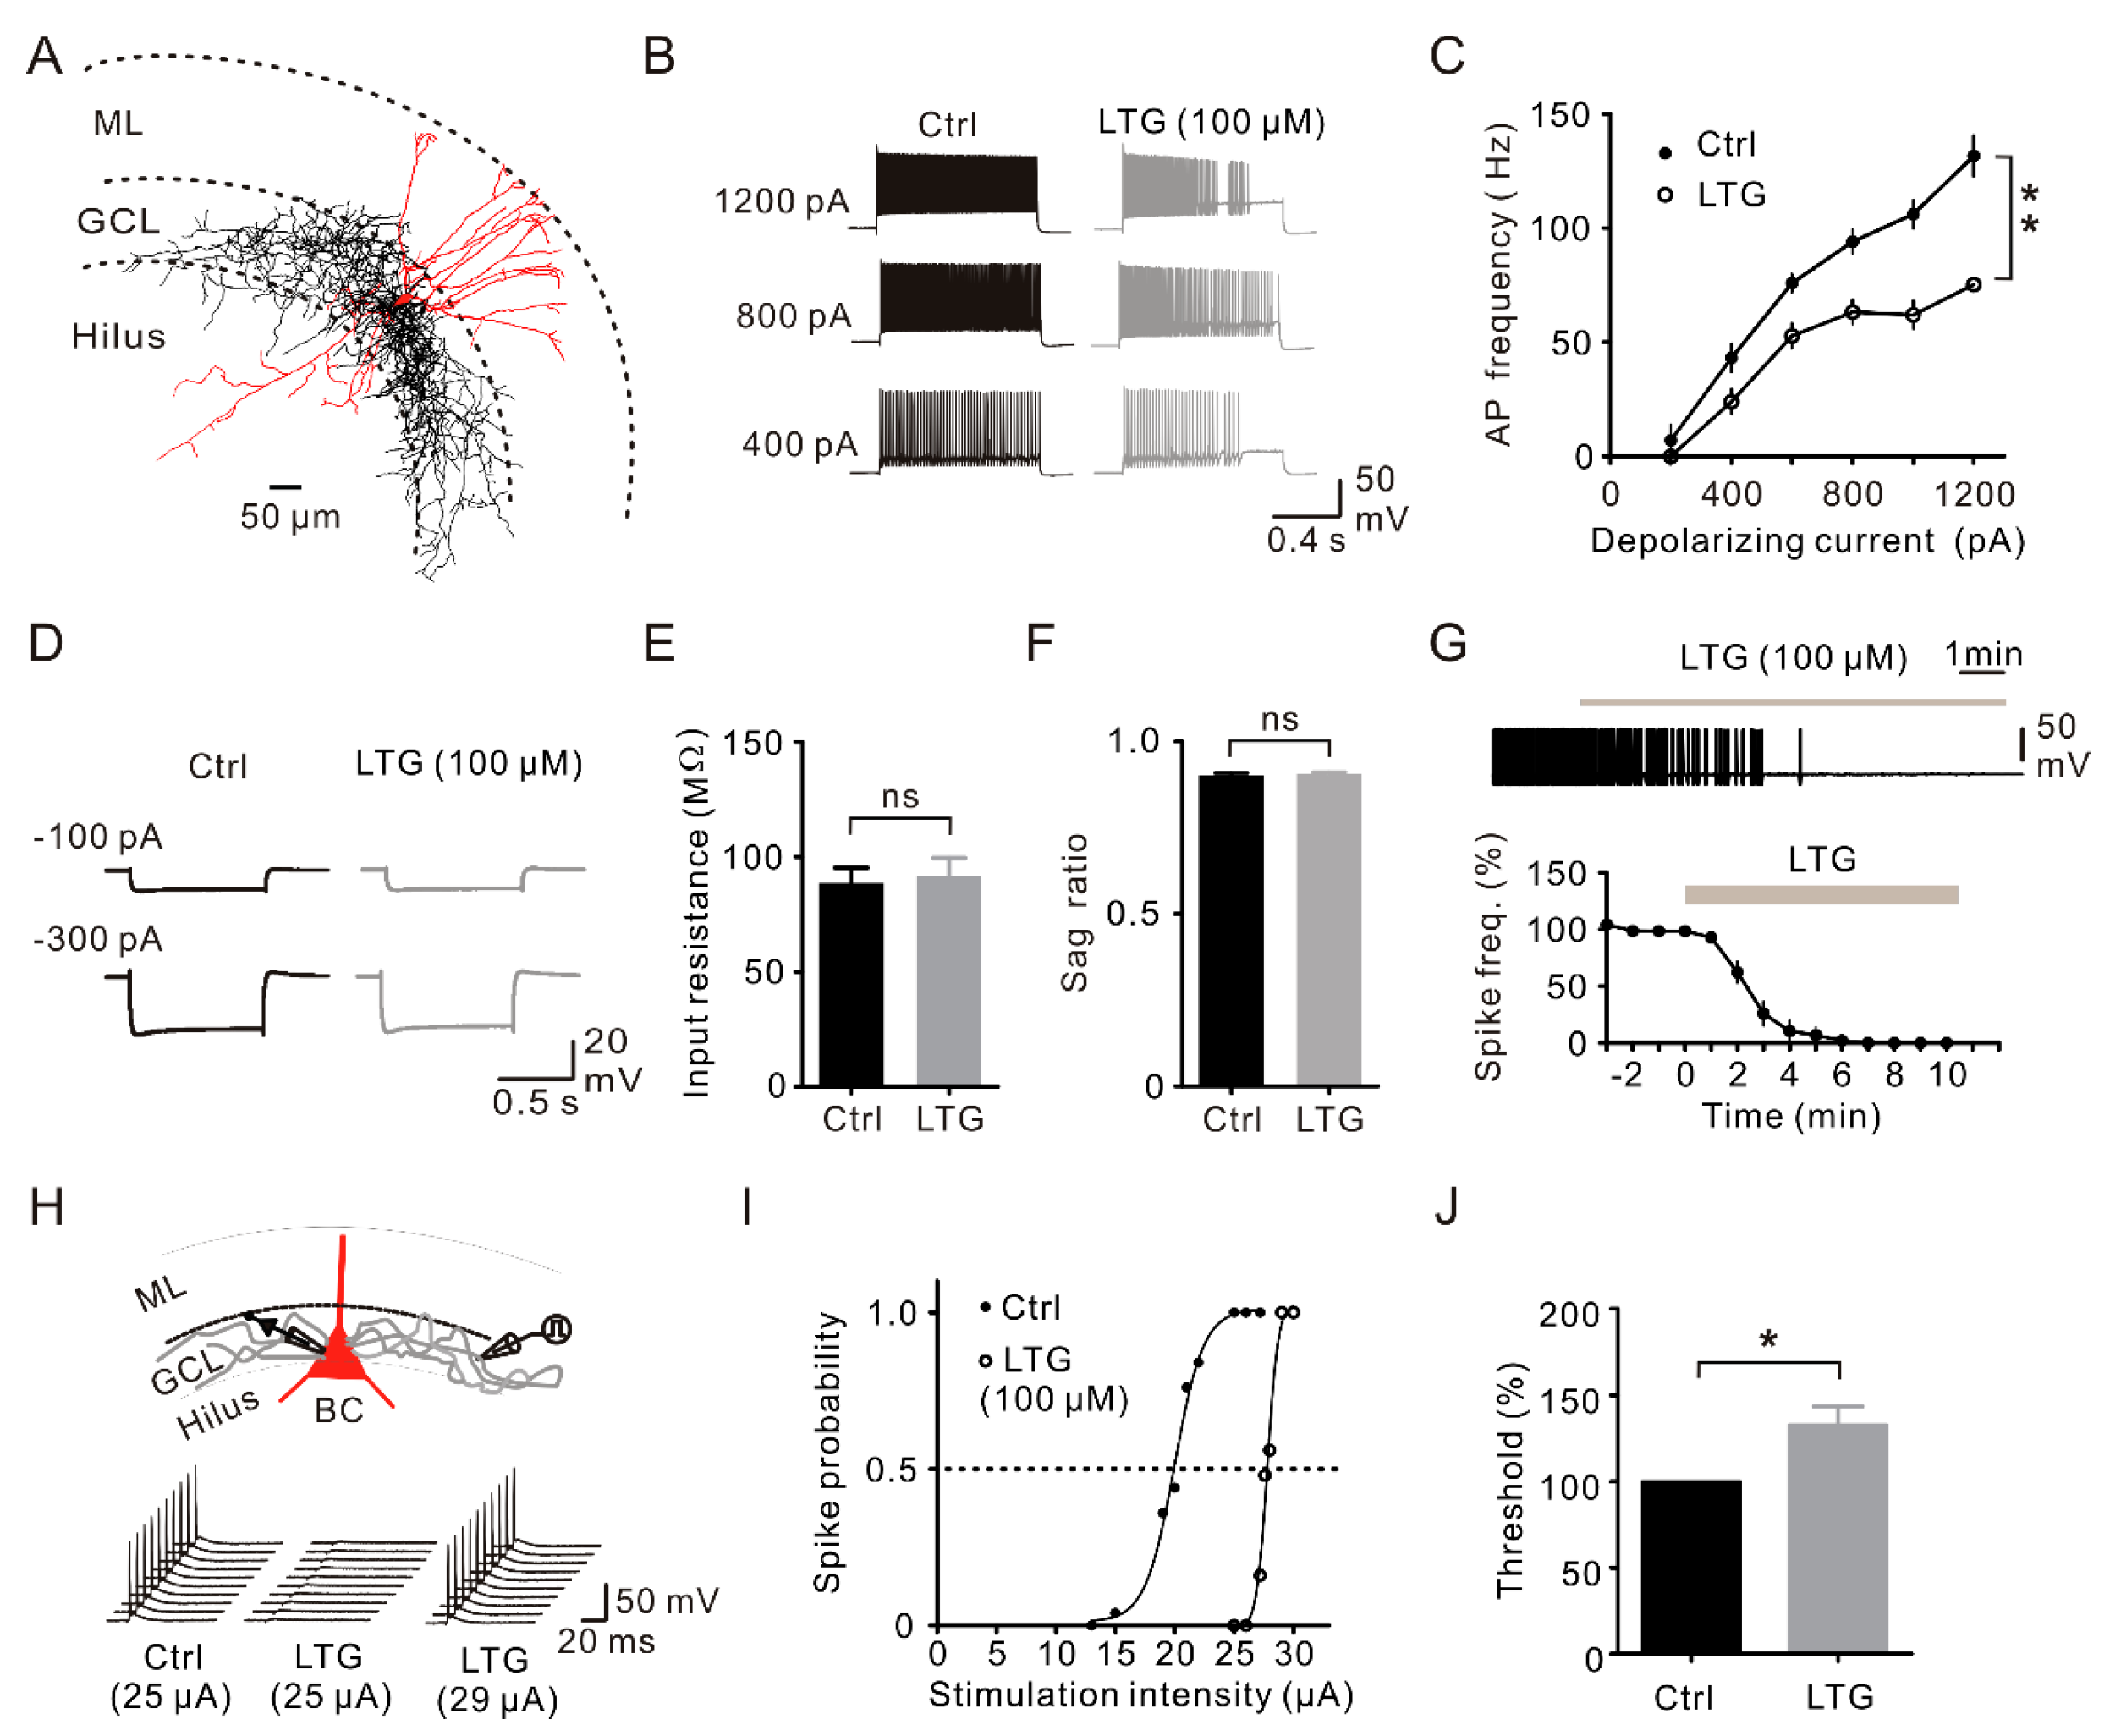
2.4. LTG Inhibited the Axonal and Cellular Excitability of BCs in the DG
2.5. LTG Suppressed sIPSCs Rather than mIPSCs in CA1 PCs
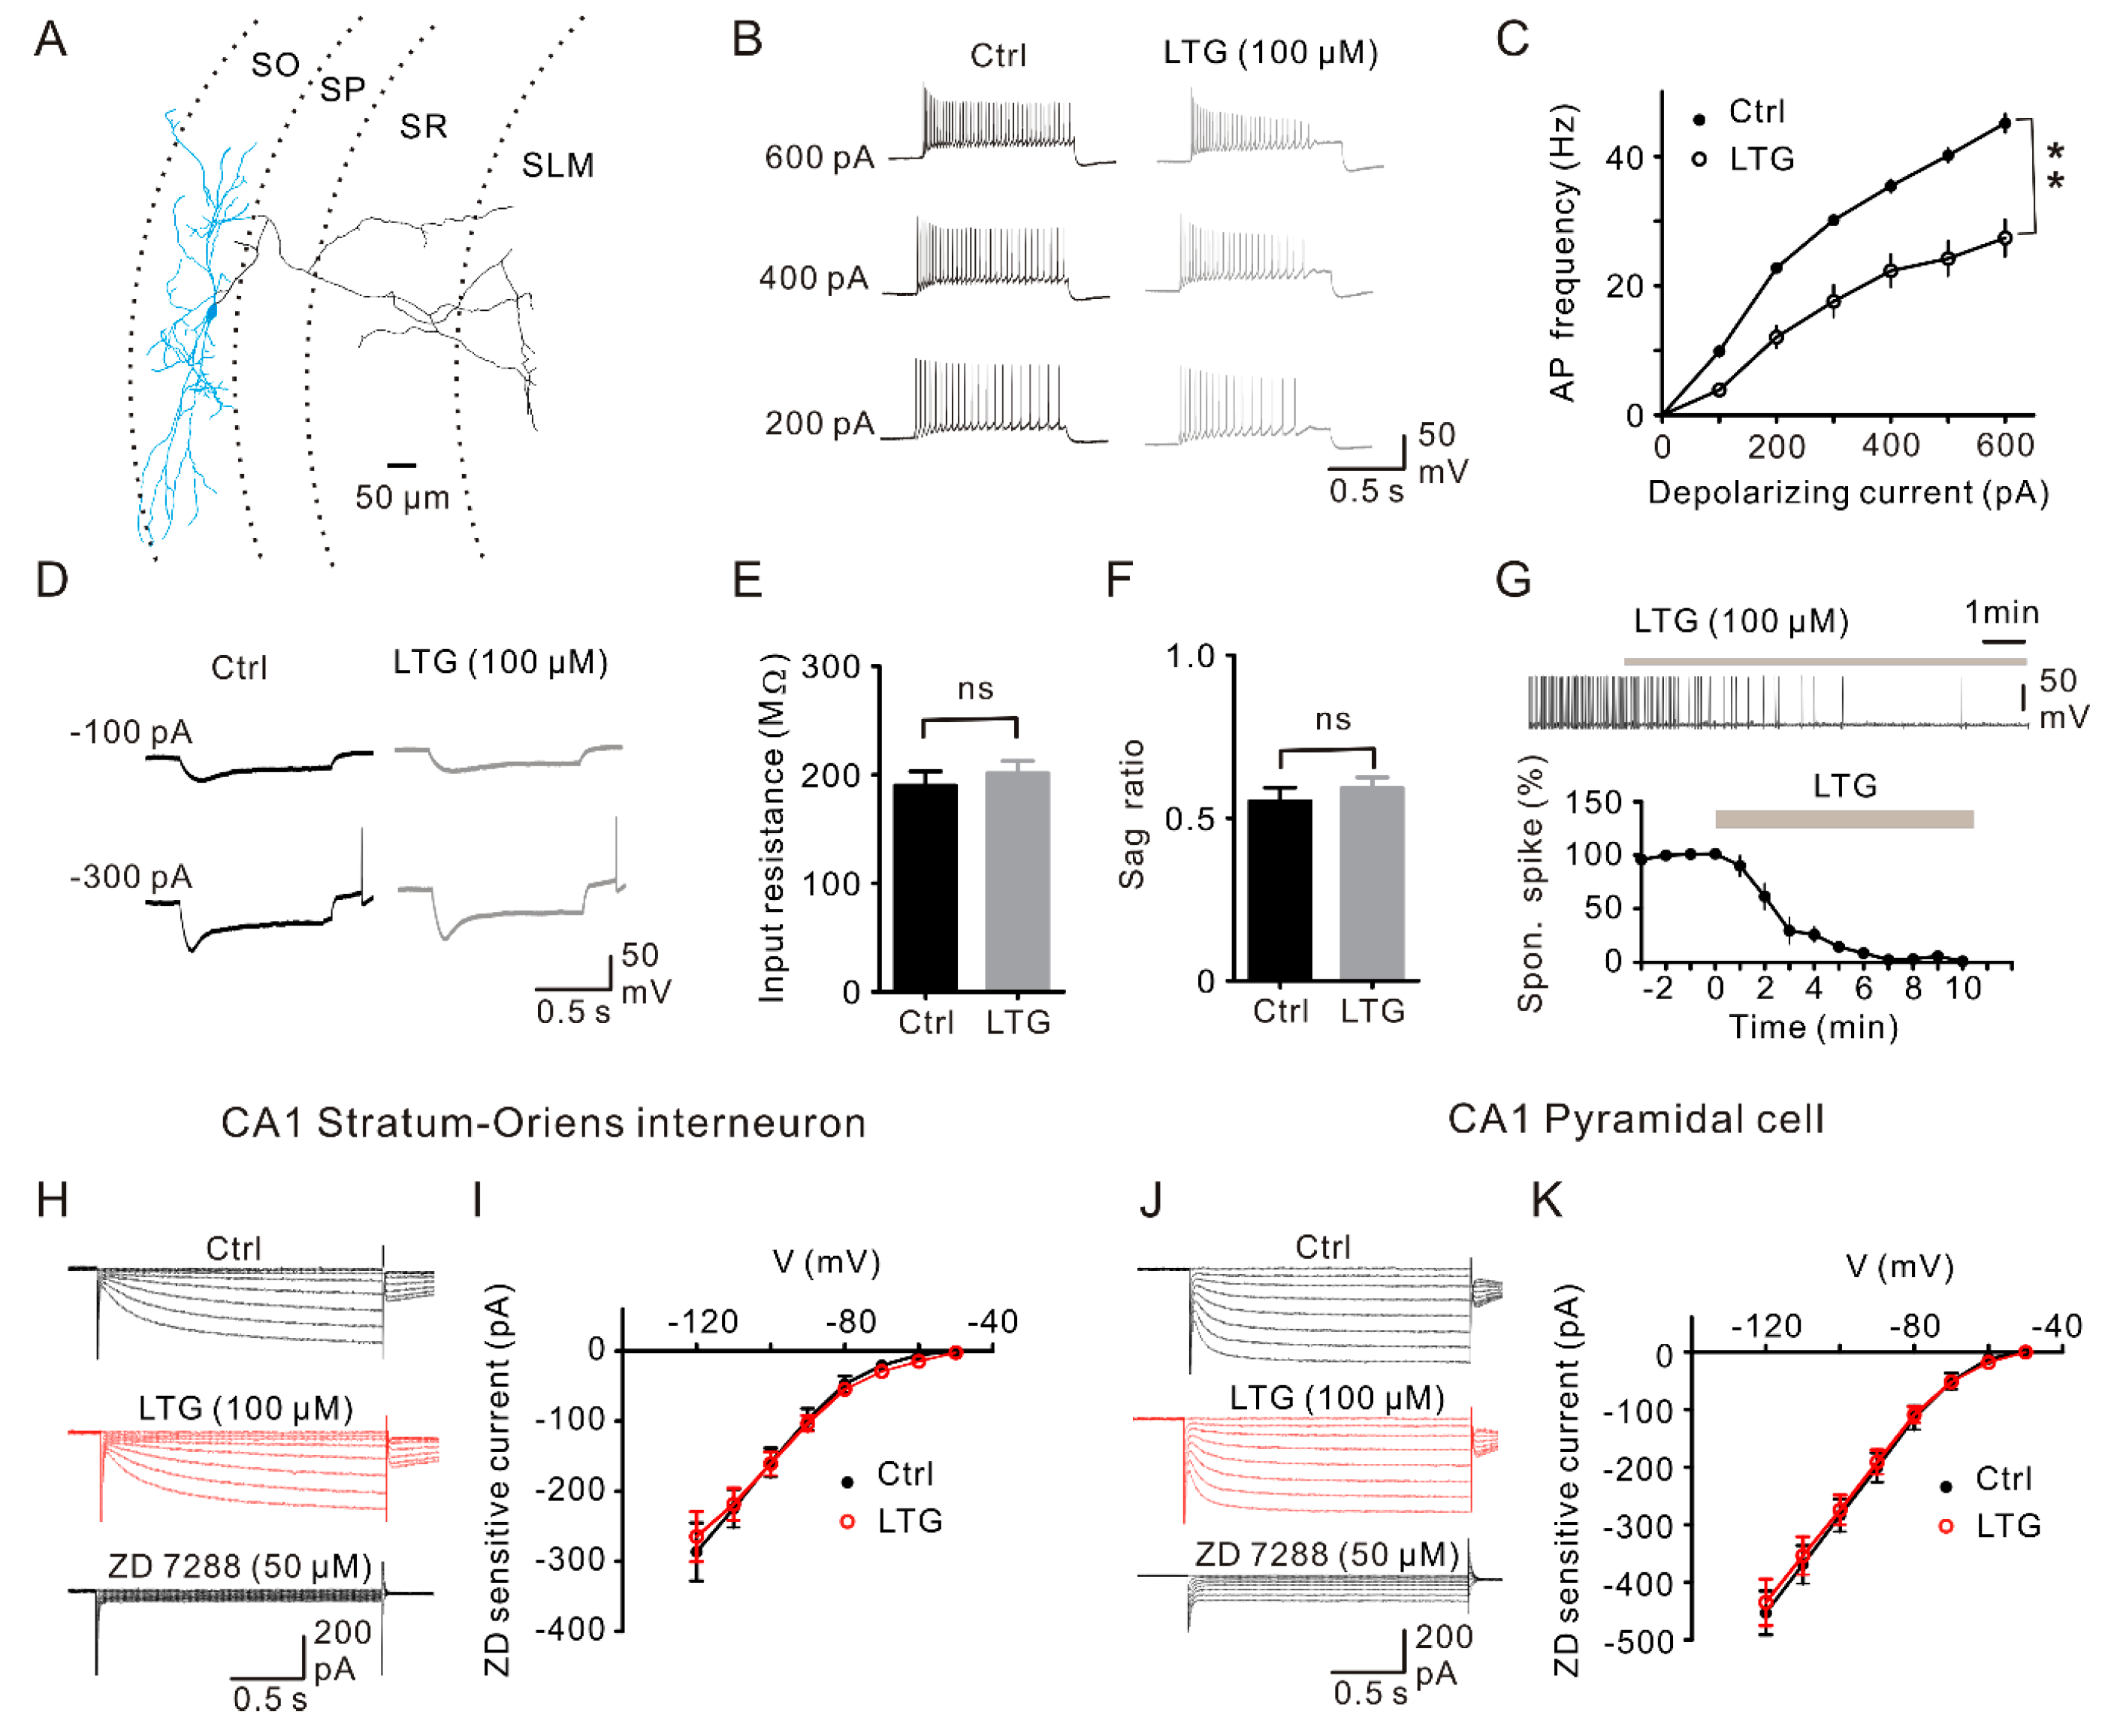
2.6. LTG Inhibited the Excitability of CA1 O-LM INs without Affecting the Ih
3. Discussion
4. Materials and Methods
4.1. Acute Brain Slice Preparation
4.2. Electrophysiology
4.3. Morphological Identification
4.4. Solutions and Drugs
4.5. Data Analysis and Statistics
Supplementary Materials
Acknowledgments
Author Contributions
Conflicts of Interest
Abbreviations
| LTG | lamotrigine |
| IN | interneuron |
| HCN | hyperpolarization-activated cyclic nucleotide |
| BC | basket cell |
| GC | granule cell |
| IPSC | inhibitory postsynaptic current |
| PC | pyramidal cell |
| Ih | hyperpolarization-activated current |
| AED | antiepileptic drug |
| AP | action potential |
| ACSF | artificial cerebrospinal fluid |
| KA | kynurenic acid |
| DG | dentate gyrus |
References
- Fitton, A.; Goa, K.L. Lamotrigine: An update of its pharmacology and therapeutic use in epilepsy. Drugs 1995, 50, 691–713. [Google Scholar] [CrossRef] [PubMed]
- LaRoche, S.M.; Helmers, S.L. The new antiepileptic drugs: Scientific review. JAMA 2004, 291, 605–614. [Google Scholar] [CrossRef] [PubMed]
- Vajda, F.J.; Dodd, S.; Horgan, D. Lamotrigine in epilepsy, pregnancy and psychiatry—A drug for all seasons? J. Clin. Neurosci. 2013, 20, 13–16. [Google Scholar] [CrossRef] [PubMed]
- Prica, C.; Hascoet, M.; Bourin, M. Antidepressant-like effect of lamotrigine is reversed by veratrine: A possible role of sodium channels in bipolar depression. Behav. Brain Res. 2008, 191, 49–54. [Google Scholar] [CrossRef] [PubMed]
- Geddes, J.R.; Calabrese, J.R.; Goodwin, G.M. Lamotrigine for treatment of bipolar depression: Independent meta-analysis and meta-regression of individual patient data from five randomised trials. Br. J. Psychiatry 2009, 194, 4–9. [Google Scholar] [CrossRef] [PubMed]
- Tränkner, A.; Sander, C.; Schönknecht, P. A critical review of the recent literature and selected therapy guidelines since 2006 on the use of lamotrigine in bipolar disorder. Neuropsychiatr. Dis. Treat. 2013, 9, 101–111. [Google Scholar] [PubMed]
- Cheung, H.; Kamp, D.; Harris, E. An in vitro investigation of the action of lamotrigine on neuronal voltage-activated sodium channels. Epilepsy Res. 1992, 13, 107–112. [Google Scholar] [PubMed]
- Xie, X.M.; Lancaster, B.; Peakman, T.; Garthwaite, J. Interaction of the antiepileptic drug lamotrigine with recombinant rat brain type IIA N+ channels and with native Na+ channels in rat hippocampal neurones. Pfluegers Arch. 1995, 430, 437–446. [Google Scholar] [CrossRef]
- Kuo, C.C.; Lu, L. Characterization of lamotrigine inhibition of Na+ channels in rat hippocampal neurones. Br. J. Pharmacol. 1997, 121, 1231–1238. [Google Scholar] [CrossRef] [PubMed]
- Rogawski, M.A.; Röscher, W. The neurobiology of antiepileptic drugs. Nat. Rev. Neurosci. 2004, 5, 553–564. [Google Scholar] [CrossRef] [PubMed]
- Cunningham, M.O.; Jones, R.S.G. The anticonvulsant, lamotrigine, decreases spontaneous glutamate release but increases spontaneous GABA release in the rat entorhinal cortex in vitro. Neuropharmacology 2000, 39, 2139–2146. [Google Scholar] [CrossRef]
- Greenhill, S.D.; Jones, R.S.G. Diverse antiepileptic drugs increase the ratio of background synaptic inhibition to excitation and decrease neuronal excitability in neurons of the rat entorhinal cortex in vitro. Neuroscience 2010, 167, 456–474. [Google Scholar] [CrossRef] [PubMed]
- Peng, B.W.; Justice, J.A.; Zhang, K.; He, X.H.; Sanchez, R.M. Increased basal synaptic inhibition of hippocampal area CA1 pyramidal neurons by an antiepileptic drug that enhances IH. Neuropsychopharmacology 2010, 35, 464–472. [Google Scholar] [CrossRef] [PubMed]
- Poolos, N.P.; Migliore, M.; Johnston, D. Pharmacological upregulation of h-channels reduces the excitability of pyramidal neuron dendrites. Nat. Neurosci. 2002, 5, 767–774. [Google Scholar] [CrossRef] [PubMed]
- Maccaferri, G.; McBain, C.J. The hyperpolarization-activated current (Ih) and its contribution to pacemaker activity in rat CA1 hippocampal stratum oriens-alveus interneurons. J. Physiol. 1996, 497, 119–130. [Google Scholar] [CrossRef] [PubMed]
- Maccaferri, G. Stratum oriens horizontal interneuron diversity and hippocampal network dynamics. J. Physiol. 2005, 562, 73–80. [Google Scholar] [CrossRef] [PubMed]
- Zemankovics, R.; Káli, S.; Paulsen, O.; Freund, T.F.; Hájos, N. Differences in subthreshold resonance of hippocampal pyramidal cells and interneurons: The role of h-current and passive membrane characteristics. J. Physiol. 2010, 588, 2109–2132. [Google Scholar] [CrossRef] [PubMed]
- Soltesz, I.; Smetters, D.K.; Mody, I. Tonic inhibition originates from synapses close to the soma. Neuron 1995, 14, 1273–1283. [Google Scholar] [CrossRef]
- Aponte, Y.; Lien, C.C.; Reisinger, E.; Jonas, P. Hyperpolarization-activated cation channels in fast-spiking interneurons of rat hippocampus. J. Physiol. 2006, 574, 229–243. [Google Scholar] [CrossRef] [PubMed]
- Southan, A.P.; Morris, N.P.; Stephens, G.J.; Robertson, B. Hyperpolarization activated currents in presynaptic terminals of mouse cerebellar basket cells. J. Physiol. 2000, 526, 91–97. [Google Scholar] [CrossRef] [PubMed]
- Elgueta, C.; Köhler, J.; Bartos, M. Persistent discharges in dentate gyrus perisoma inhibiting interneurons require hyperpolarization-activated cyclic nucleotide-gated channel activation. J. Neurosci. 2015, 35, 4131–4139. [Google Scholar] [CrossRef] [PubMed]
- Kraushaar, U.; Jonas, P. Efficacy and stability of quantal GABA release at a hippocampal interneuron-principal neuron synapse. J. Neurosci. 2000, 20, 5594–5607. [Google Scholar] [PubMed]
- Liu, Y.C.; Cheng, J.K.; Lien, C.C. Rapid dynamic changes of dendritic inhibition in the dentate gyrus by presynaptic activity patterns. J. Neurosci. 2014, 34, 1344–1357. [Google Scholar] [CrossRef] [PubMed]
- Bartos, M.; Vida, I.; Jonas, P. Synaptic mechanisms of synchronized gamma oscillations in inhibitory interneuron networks. Nat. Rev. Neurosci. 2007, 8, 45–56. [Google Scholar] [CrossRef] [PubMed]
- Weng, J.Y.; Lin, Y.C.; Lien, C.C. Cell type-specific expression of acid-sensing ion channels in hippocampal interneurons. J. Neurosci. 2010, 30, 6548–6558. [Google Scholar] [CrossRef] [PubMed]
- Martina, M.; Jonas, P. Functional differences in Na channel gating between fast-spiking interneurons and principal neurons of rat hippocampus. J. Physiol. 1997, 505, 593–603. [Google Scholar] [CrossRef] [PubMed]
- Lien, C.C.; Martina, M.; Schultz, J.; Ehmke, H.; Jonas, P. Gating, modulation, and subunit composition of voltage-gated K+ channels in dendritic inhibitory interneurons of rat hippocampus. J. Physiol. 2002, 538, 405–419. [Google Scholar] [CrossRef] [PubMed]
- Lupica, C.R.; Bell, J.A.; Hoffman, A.F.; Watson, P.L. Contribution of the hyperpolarization-activated current I(h) to membrane potential and GABA release in hippocampal interneurons. J. Neurophysiol. 2001, 86, 261–268. [Google Scholar] [PubMed]
- Griguoli, M.; Maul, A.; Nguyen, C.; Giorgetti, A.; Carloni, P.; Cherubini, E. Nicotine blocks the hyperpolarization-activated current Ih and severely impairs the oscillatory behavior of oriens-lacunosum moleculare interneurons. J. Neurosci. 2010, 30, 10773–10783. [Google Scholar] [CrossRef] [PubMed]
- Magee, J.C. Dendritic hyperpolarization-activated currents modify the integrative properties of hippocampal CA1 pyramidal neurons. J. Neurosci. 1998, 18, 7613–7624. [Google Scholar] [PubMed]
- Biel, M.; Wahl-Schott, C.; Michalakis, S.; Zong, X. Hyperpolarization-activated cation channels: From genes to function. Physiol. Rev. 2009, 89, 847–885. [Google Scholar] [CrossRef] [PubMed]
- Lees, G.; Leach, M.J. Studies on the mechanism of action of the novel anticonvulsant lamotrigine (Lamictal) using primary neuroglial cultures from rat cortex. Brain Res. 1993, 612, 190–199. [Google Scholar] [CrossRef]
- Leach, M.J.; Marden, C.M.; Miller, A.A. Pharmacological studies on lamotrigine, a novel potential antiepileptic drug: II. Neurochemical studies on the mechanism of action. Epilepsia 1986, 27, 490–497. [Google Scholar] [CrossRef] [PubMed]
- Leach, M.J.; Baxter, M.G.; Critchley, M.A.E. Neurochemical and behavioral aspects of lamotrigine. Epilepsia 1991, 32, S4–S8. [Google Scholar] [CrossRef] [PubMed]
- Braga, M.F.; Aroniadou-Anderjaska, V.; Post, R.M.; Li, H. Lamotrigine reduces spontaneous and evoked GABAA receptor-mediated synaptic transmission in the basolateral amygdala: Implications for its effects in seizure and affective disorders. Neuropharmacology 2002, 42, 522–529. [Google Scholar] [CrossRef]
- Pothmann, L.; Müller, C.; Averkin, R.G.; Bellistri, E.; Miklitz, C.; Uebachs, M.; Remy, S.; Menendez de la Prida, L.; Beck, H. Function of inhibitory micronetworks is spared by Na+ channel-acting anticonvulsant drugs. J. Neurosci. 2014, 34, 9720–9735. [Google Scholar] [CrossRef] [PubMed]
- Hefft, S.; Jonas, P. Asynchronous GABA release generates long-lasting inhibition at a hippocampal interneuron–principal neuron synapse. Nat. Neurosci. 2005, 8, 1319–1328. [Google Scholar] [CrossRef] [PubMed]
- Hu, H.; Jonas, P. A supercritical density of Na+ channels ensures fast signaling in GABAergic interneuron axons. Nat. Neurosci. 2014, 17, 686–693. [Google Scholar] [CrossRef] [PubMed]
- Lee, C.Y.; Fu, W.M.; Chen, C.C.; Su, M.J.; Liou, H.H. Lamotrigine inhibits postsynaptic AMPA receptor and glutamate release in the dentate gyrus. Epilepsia 2008, 49, 888–897. [Google Scholar] [CrossRef] [PubMed]
- Martina, M.; Vida, I.; Jonas, P. Distal initiation and active excitatory and inhibitory propagation of action potentials in interneuron dendrites. Science 2000, 287, 295–300. [Google Scholar] [CrossRef] [PubMed]
- Zucker, R.S.; Regehr, W.G. Short-term synaptic plasticity. Annu. Rev. Physiol. 2002, 64, 355–405. [Google Scholar] [CrossRef] [PubMed]
- Hefft, S.; Kraushaar, U.; Geiger, J.R.P.; Jonas, P. Presynaptic short-term depression is maintained during regulation of transmitter release at a GABAergic synapse in rat hippocampus. J. Physiol. 2002, 539, 201–208. [Google Scholar] [CrossRef] [PubMed]
- Klausberger, T.; Somogyi, P. Neuronal diversity and temporal dynamics: The unity of hippocampal circuit operations. Science 2008, 321, 53–57. [Google Scholar] [CrossRef] [PubMed]
- Bezaire, M.J.; Soltesz, I. Quantitative assessment of CA1 local circuits: Knowledge base for interneuron-pyramidal cell connectivity. Hippocampus 2013, 23, 751–785. [Google Scholar] [CrossRef] [PubMed]
- Pouille, F.; Scanziani, M. Routing of spike series by dynamic circuits in the hippocampus. Nature 2004, 429, 717–723. [Google Scholar] [CrossRef] [PubMed]


© 2016 by the authors; licensee MDPI, Basel, Switzerland. This article is an open access article distributed under the terms and conditions of the Creative Commons Attribution (CC-BY) license (http://creativecommons.org/licenses/by/4.0/).
Share and Cite
Huang, Y.-Y.; Liu, Y.-C.; Lee, C.-T.; Lin, Y.-C.; Wang, M.-L.; Yang, Y.-P.; Chang, K.-Y.; Chiou, S.-H. Revisiting the Lamotrigine-Mediated Effect on Hippocampal GABAergic Transmission. Int. J. Mol. Sci. 2016, 17, 1191. https://0-doi-org.brum.beds.ac.uk/10.3390/ijms17071191
Huang Y-Y, Liu Y-C, Lee C-T, Lin Y-C, Wang M-L, Yang Y-P, Chang K-Y, Chiou S-H. Revisiting the Lamotrigine-Mediated Effect on Hippocampal GABAergic Transmission. International Journal of Molecular Sciences. 2016; 17(7):1191. https://0-doi-org.brum.beds.ac.uk/10.3390/ijms17071191
Chicago/Turabian StyleHuang, Yu-Yin, Yu-Chao Liu, Cheng-Ta Lee, Yen-Chu Lin, Mong-Lien Wang, Yi-Ping Yang, Kaung-Yi Chang, and Shih-Hwa Chiou. 2016. "Revisiting the Lamotrigine-Mediated Effect on Hippocampal GABAergic Transmission" International Journal of Molecular Sciences 17, no. 7: 1191. https://0-doi-org.brum.beds.ac.uk/10.3390/ijms17071191