
Composition of Lignin-to-Liquid Solvolysis Oils from Lignin Extracted in a Semi-Continuous Organosolv Process

Abstract
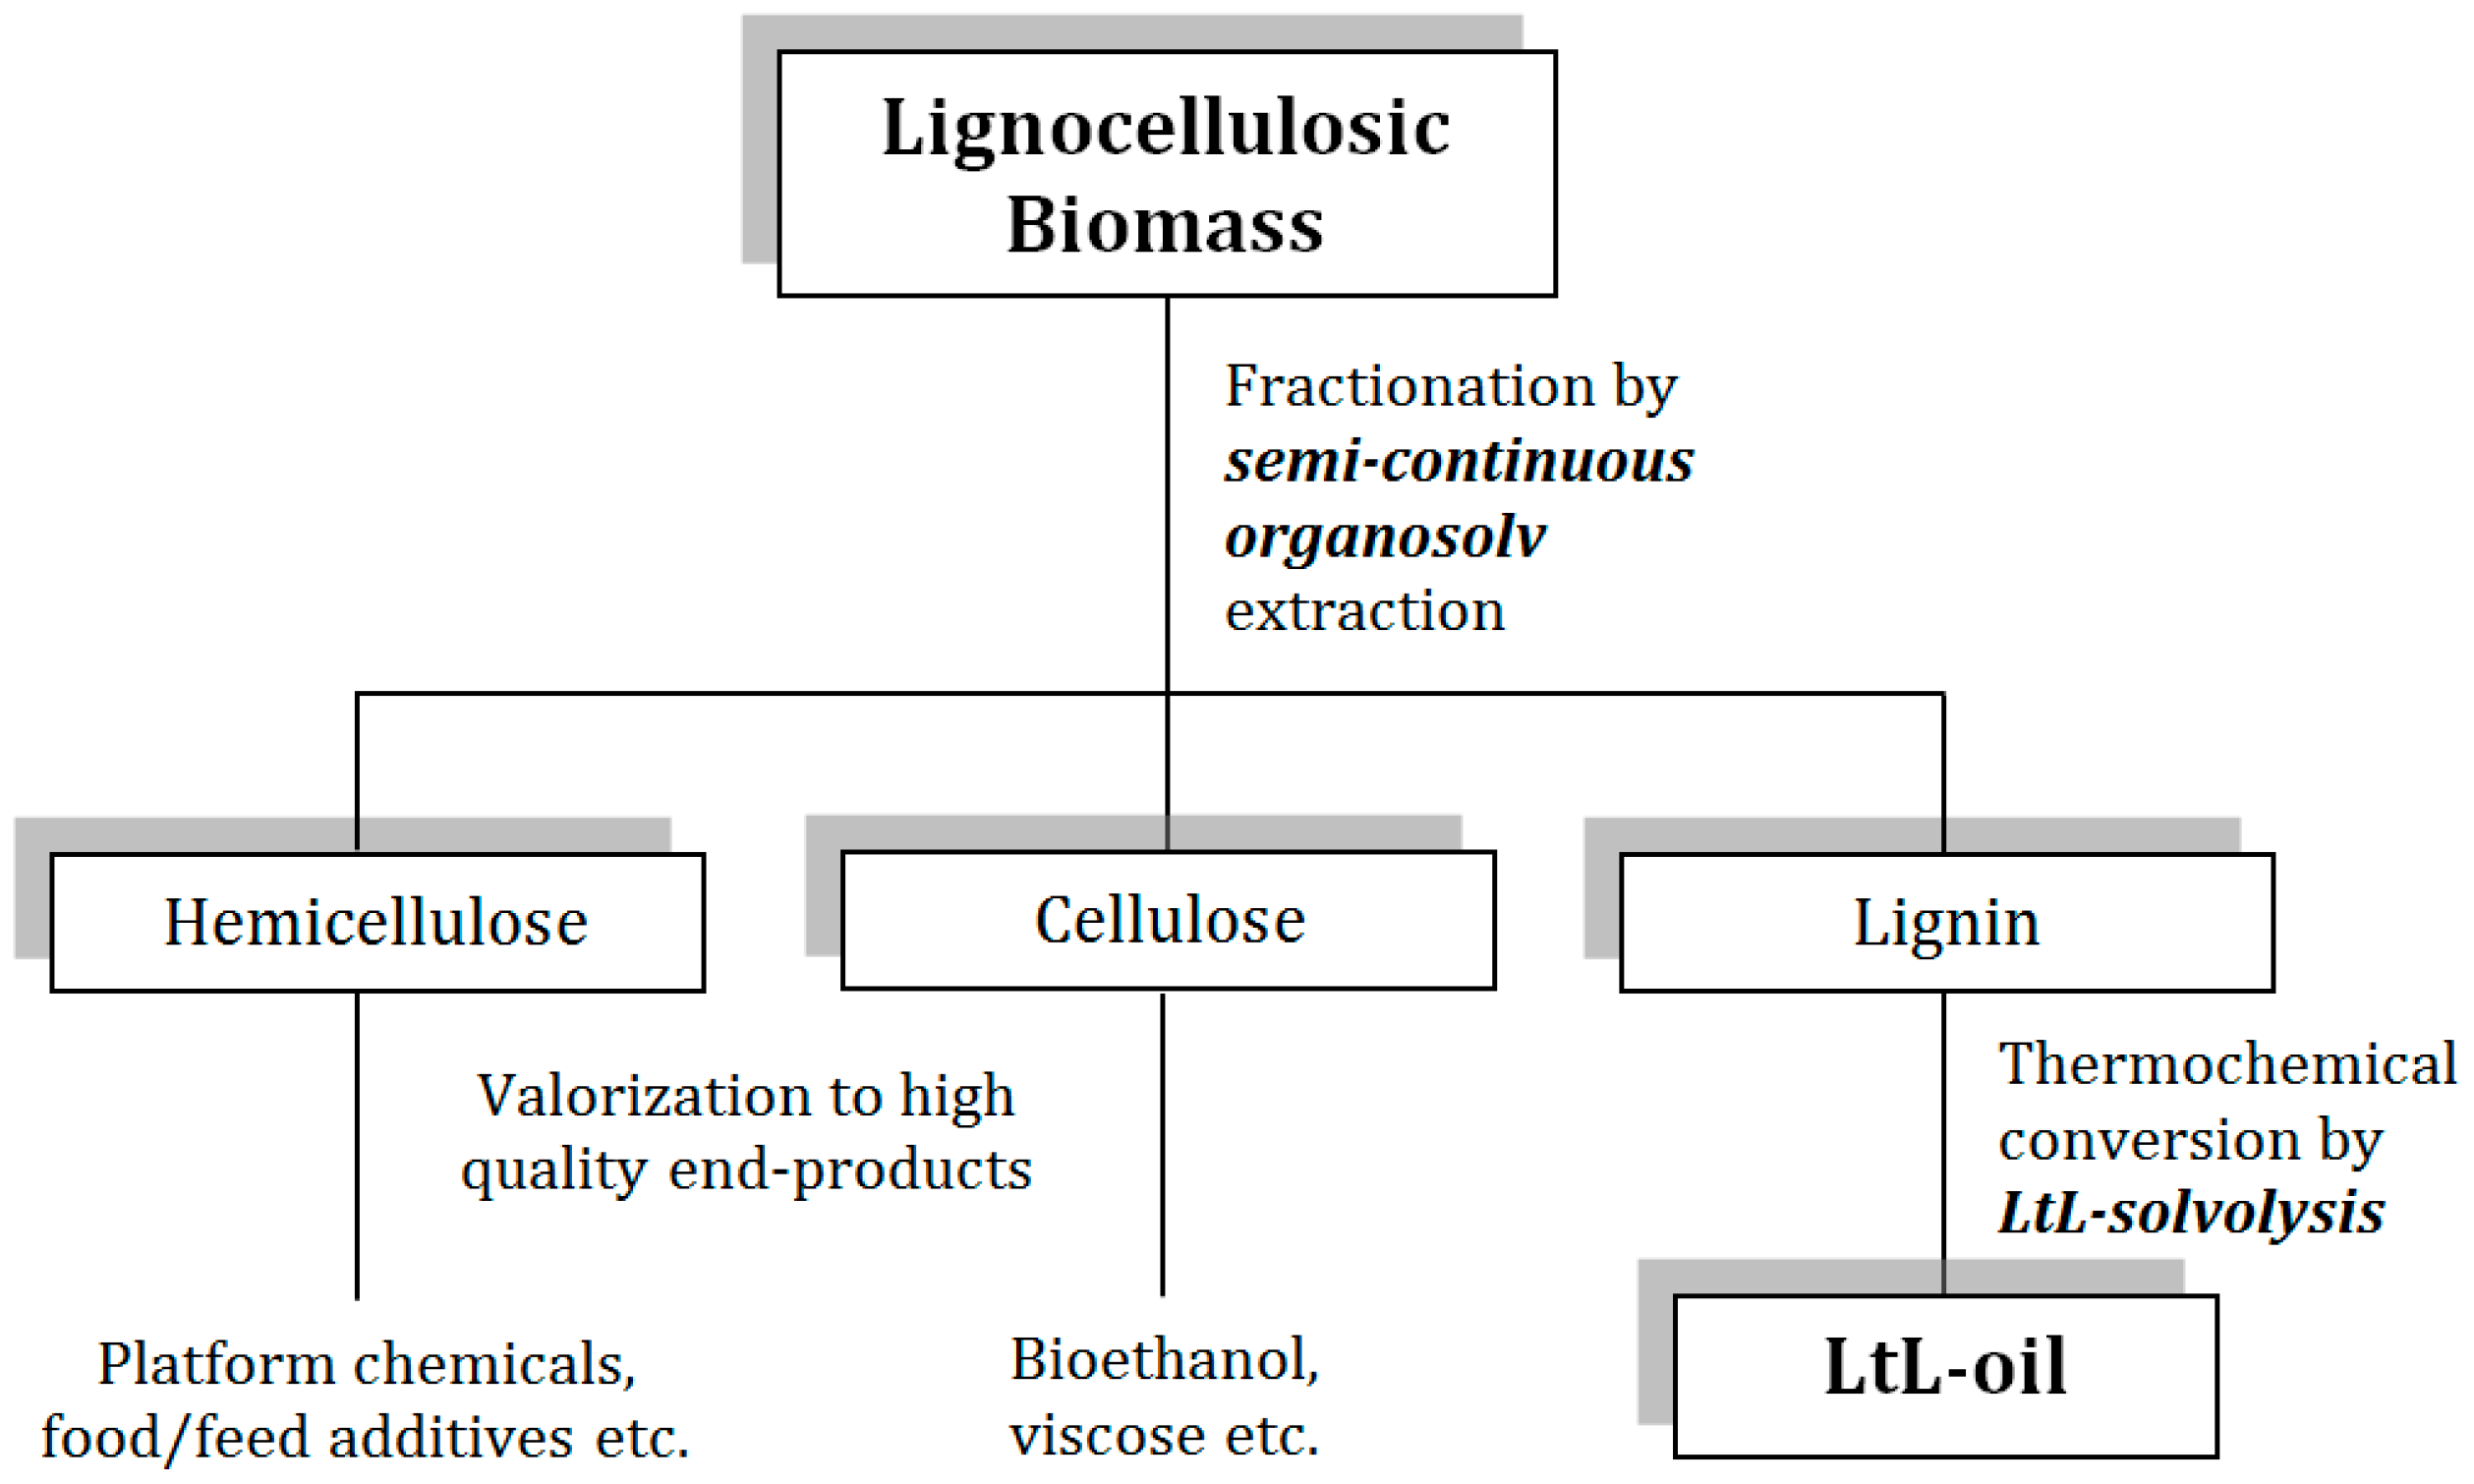
:1. Introduction
2. Results
2.1. Organosolv Fractionation and Product Purity
2.2. LtL-Solvolysis
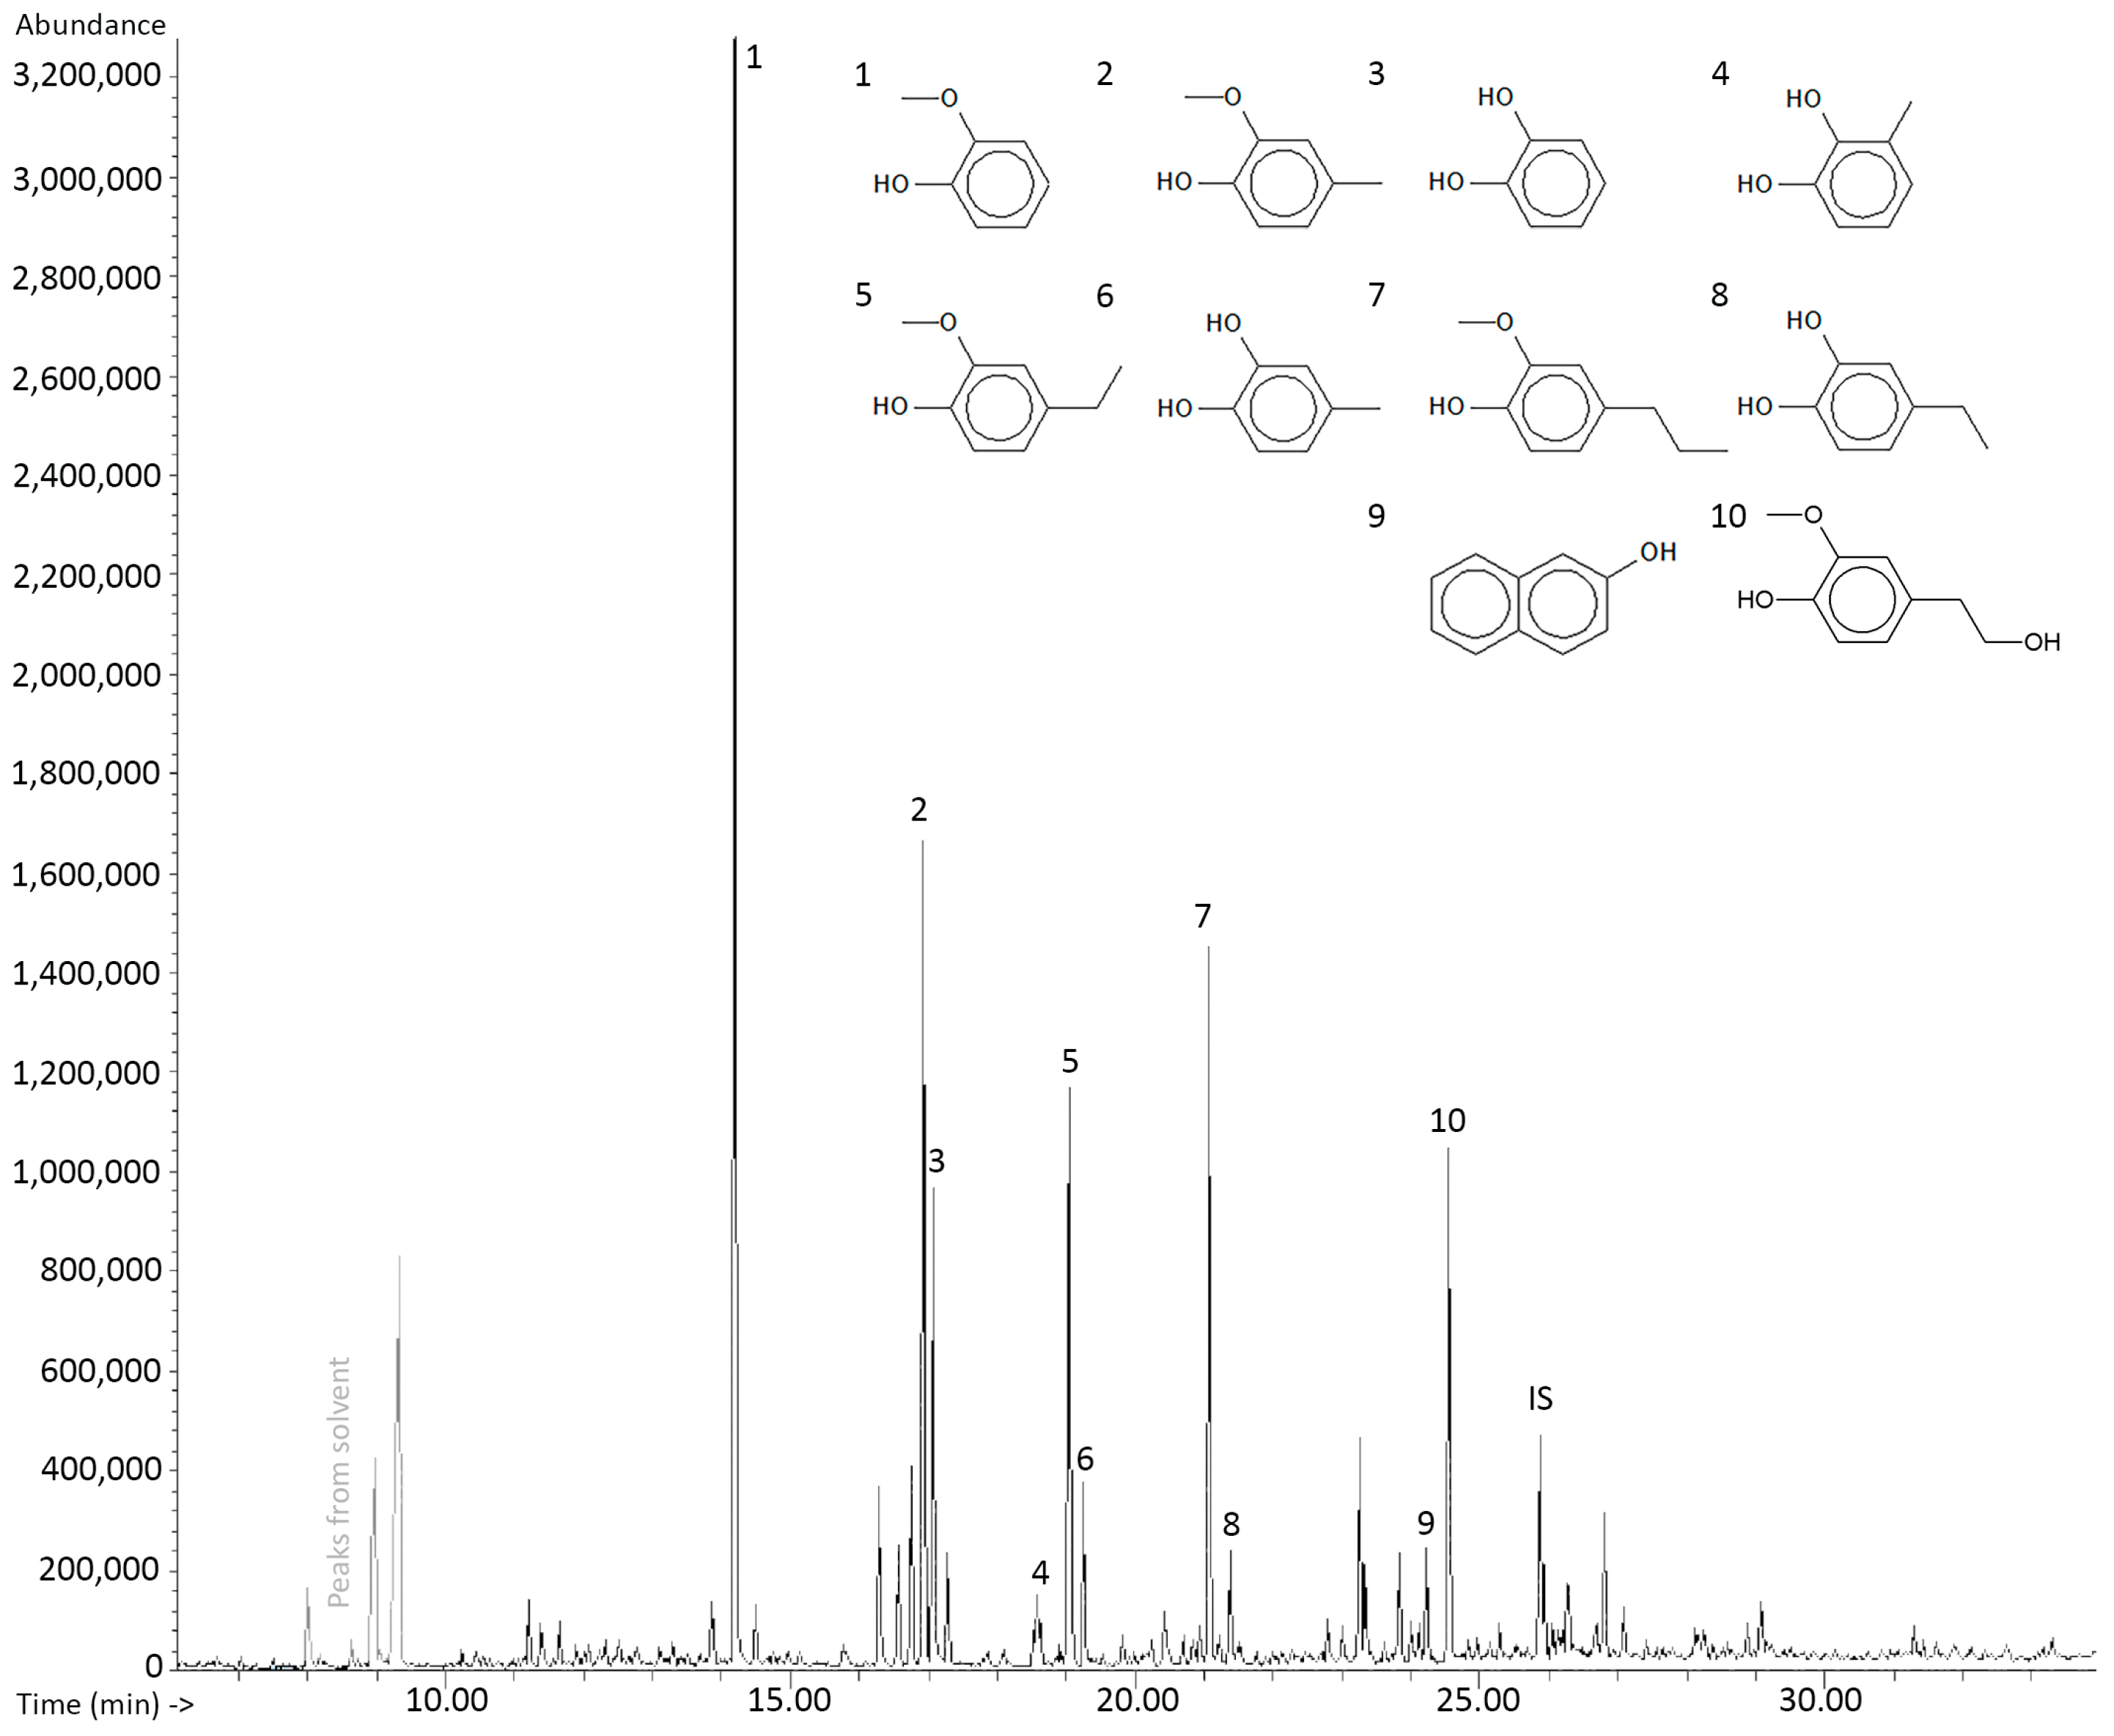
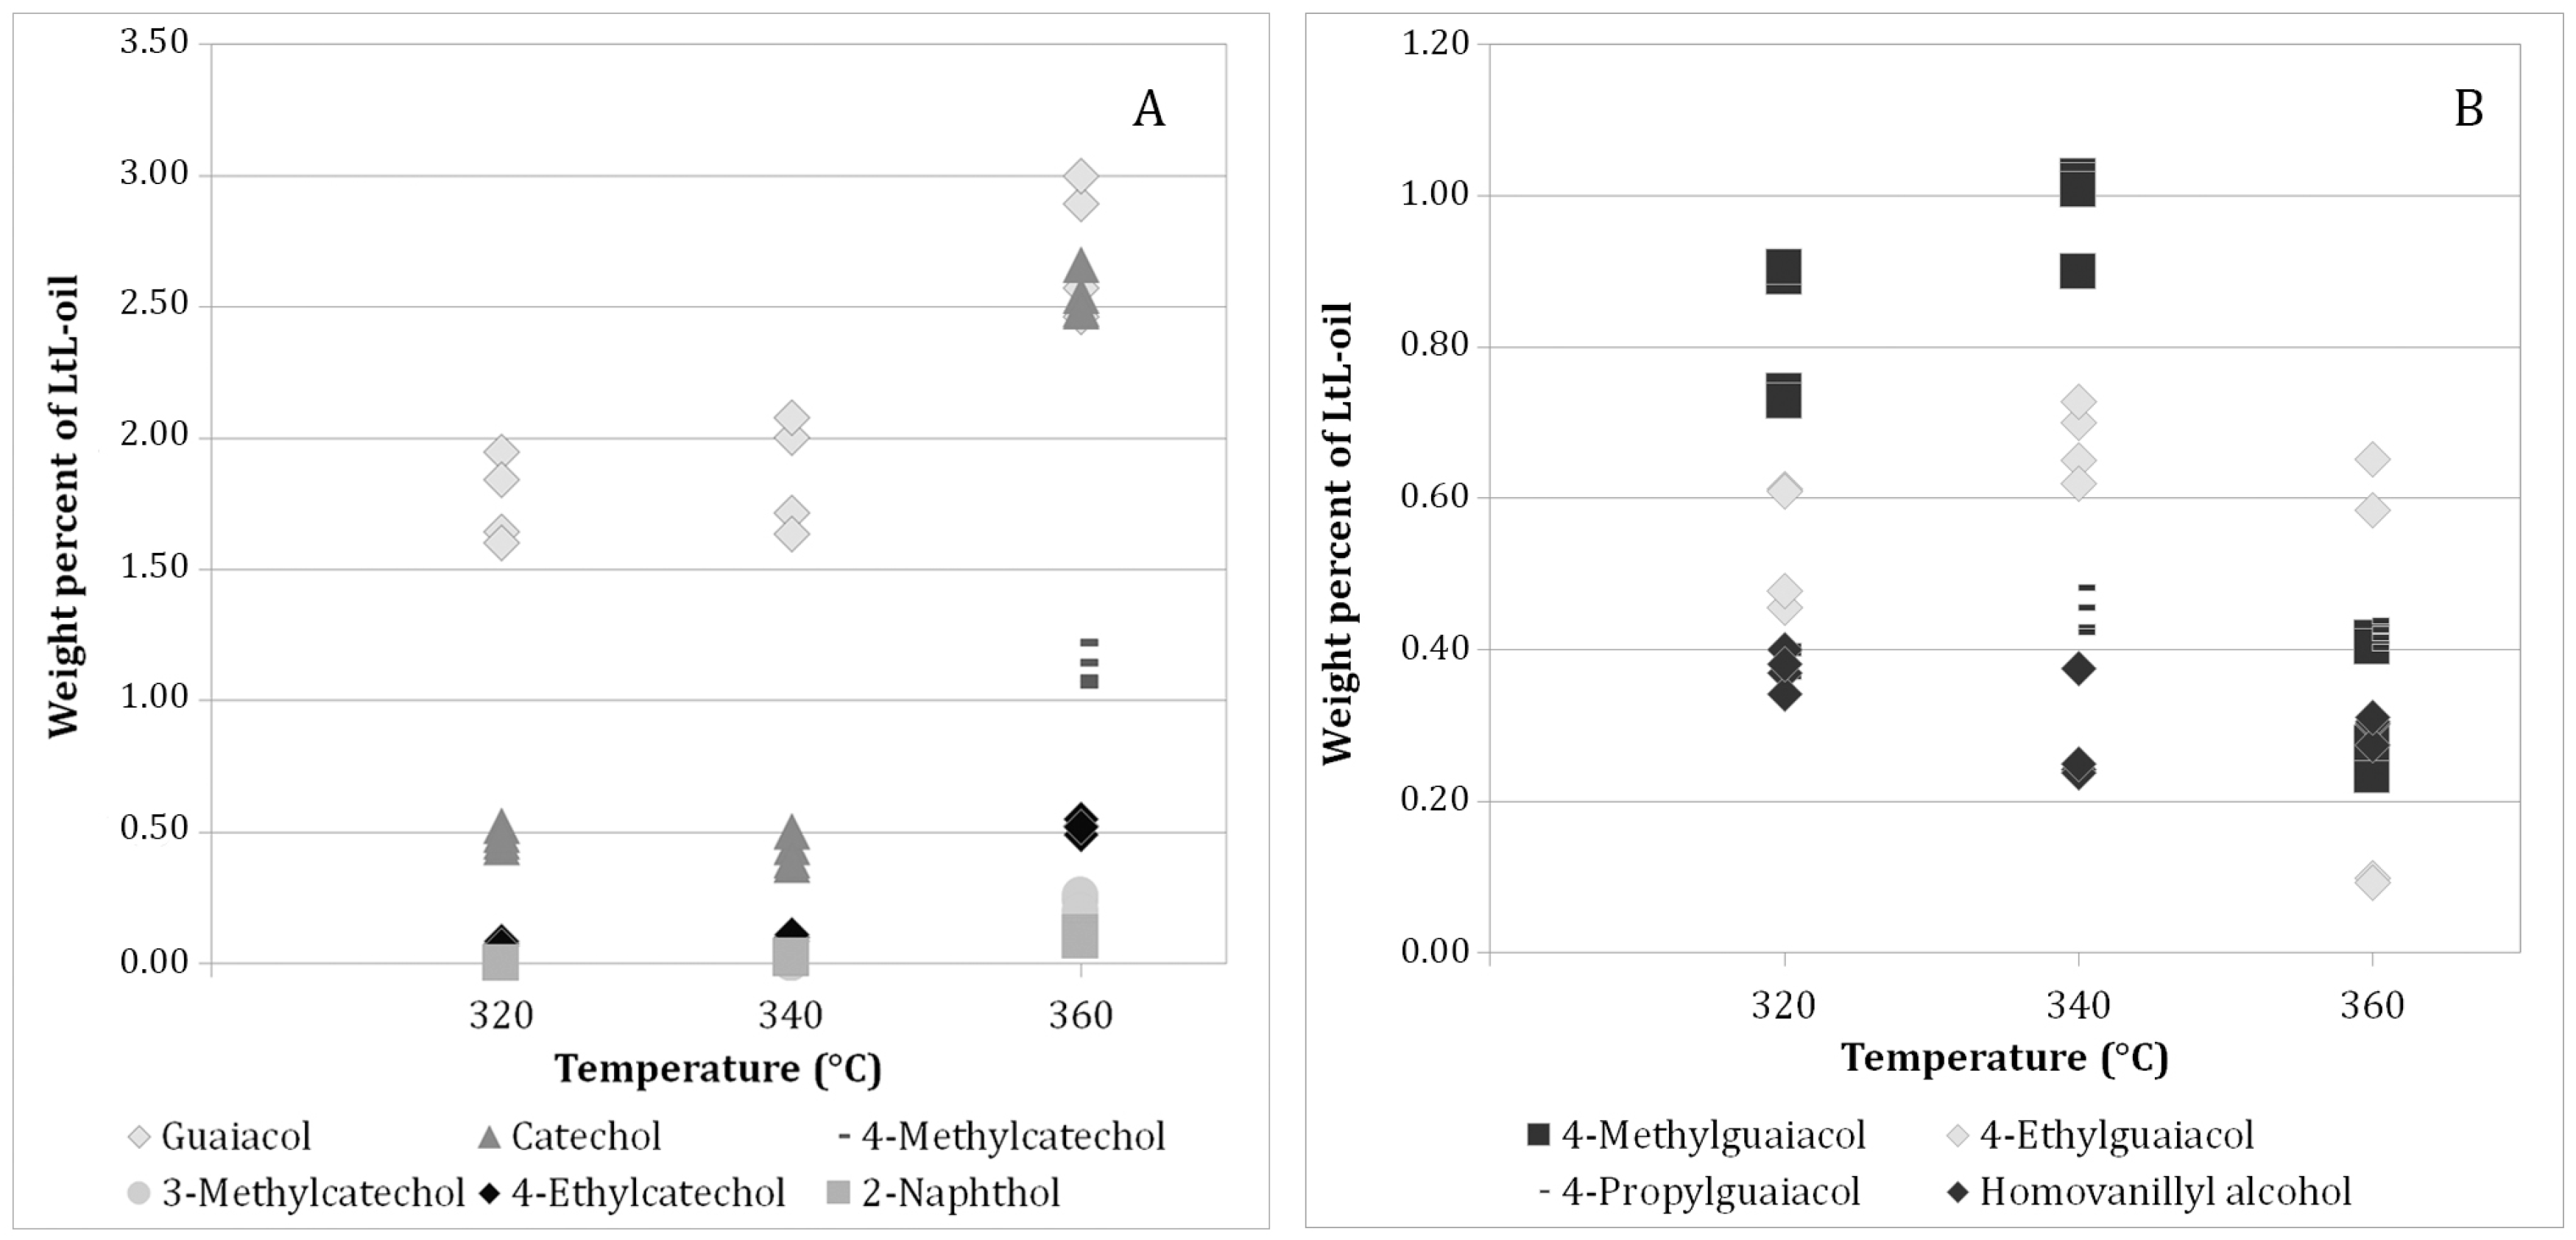
2.3. Quantification of Individual Components
Sample Shelf Life of Silylated Bio-Oil
2.4. Elemental Analysis
2.5. Carbon Balance
3. Discussion
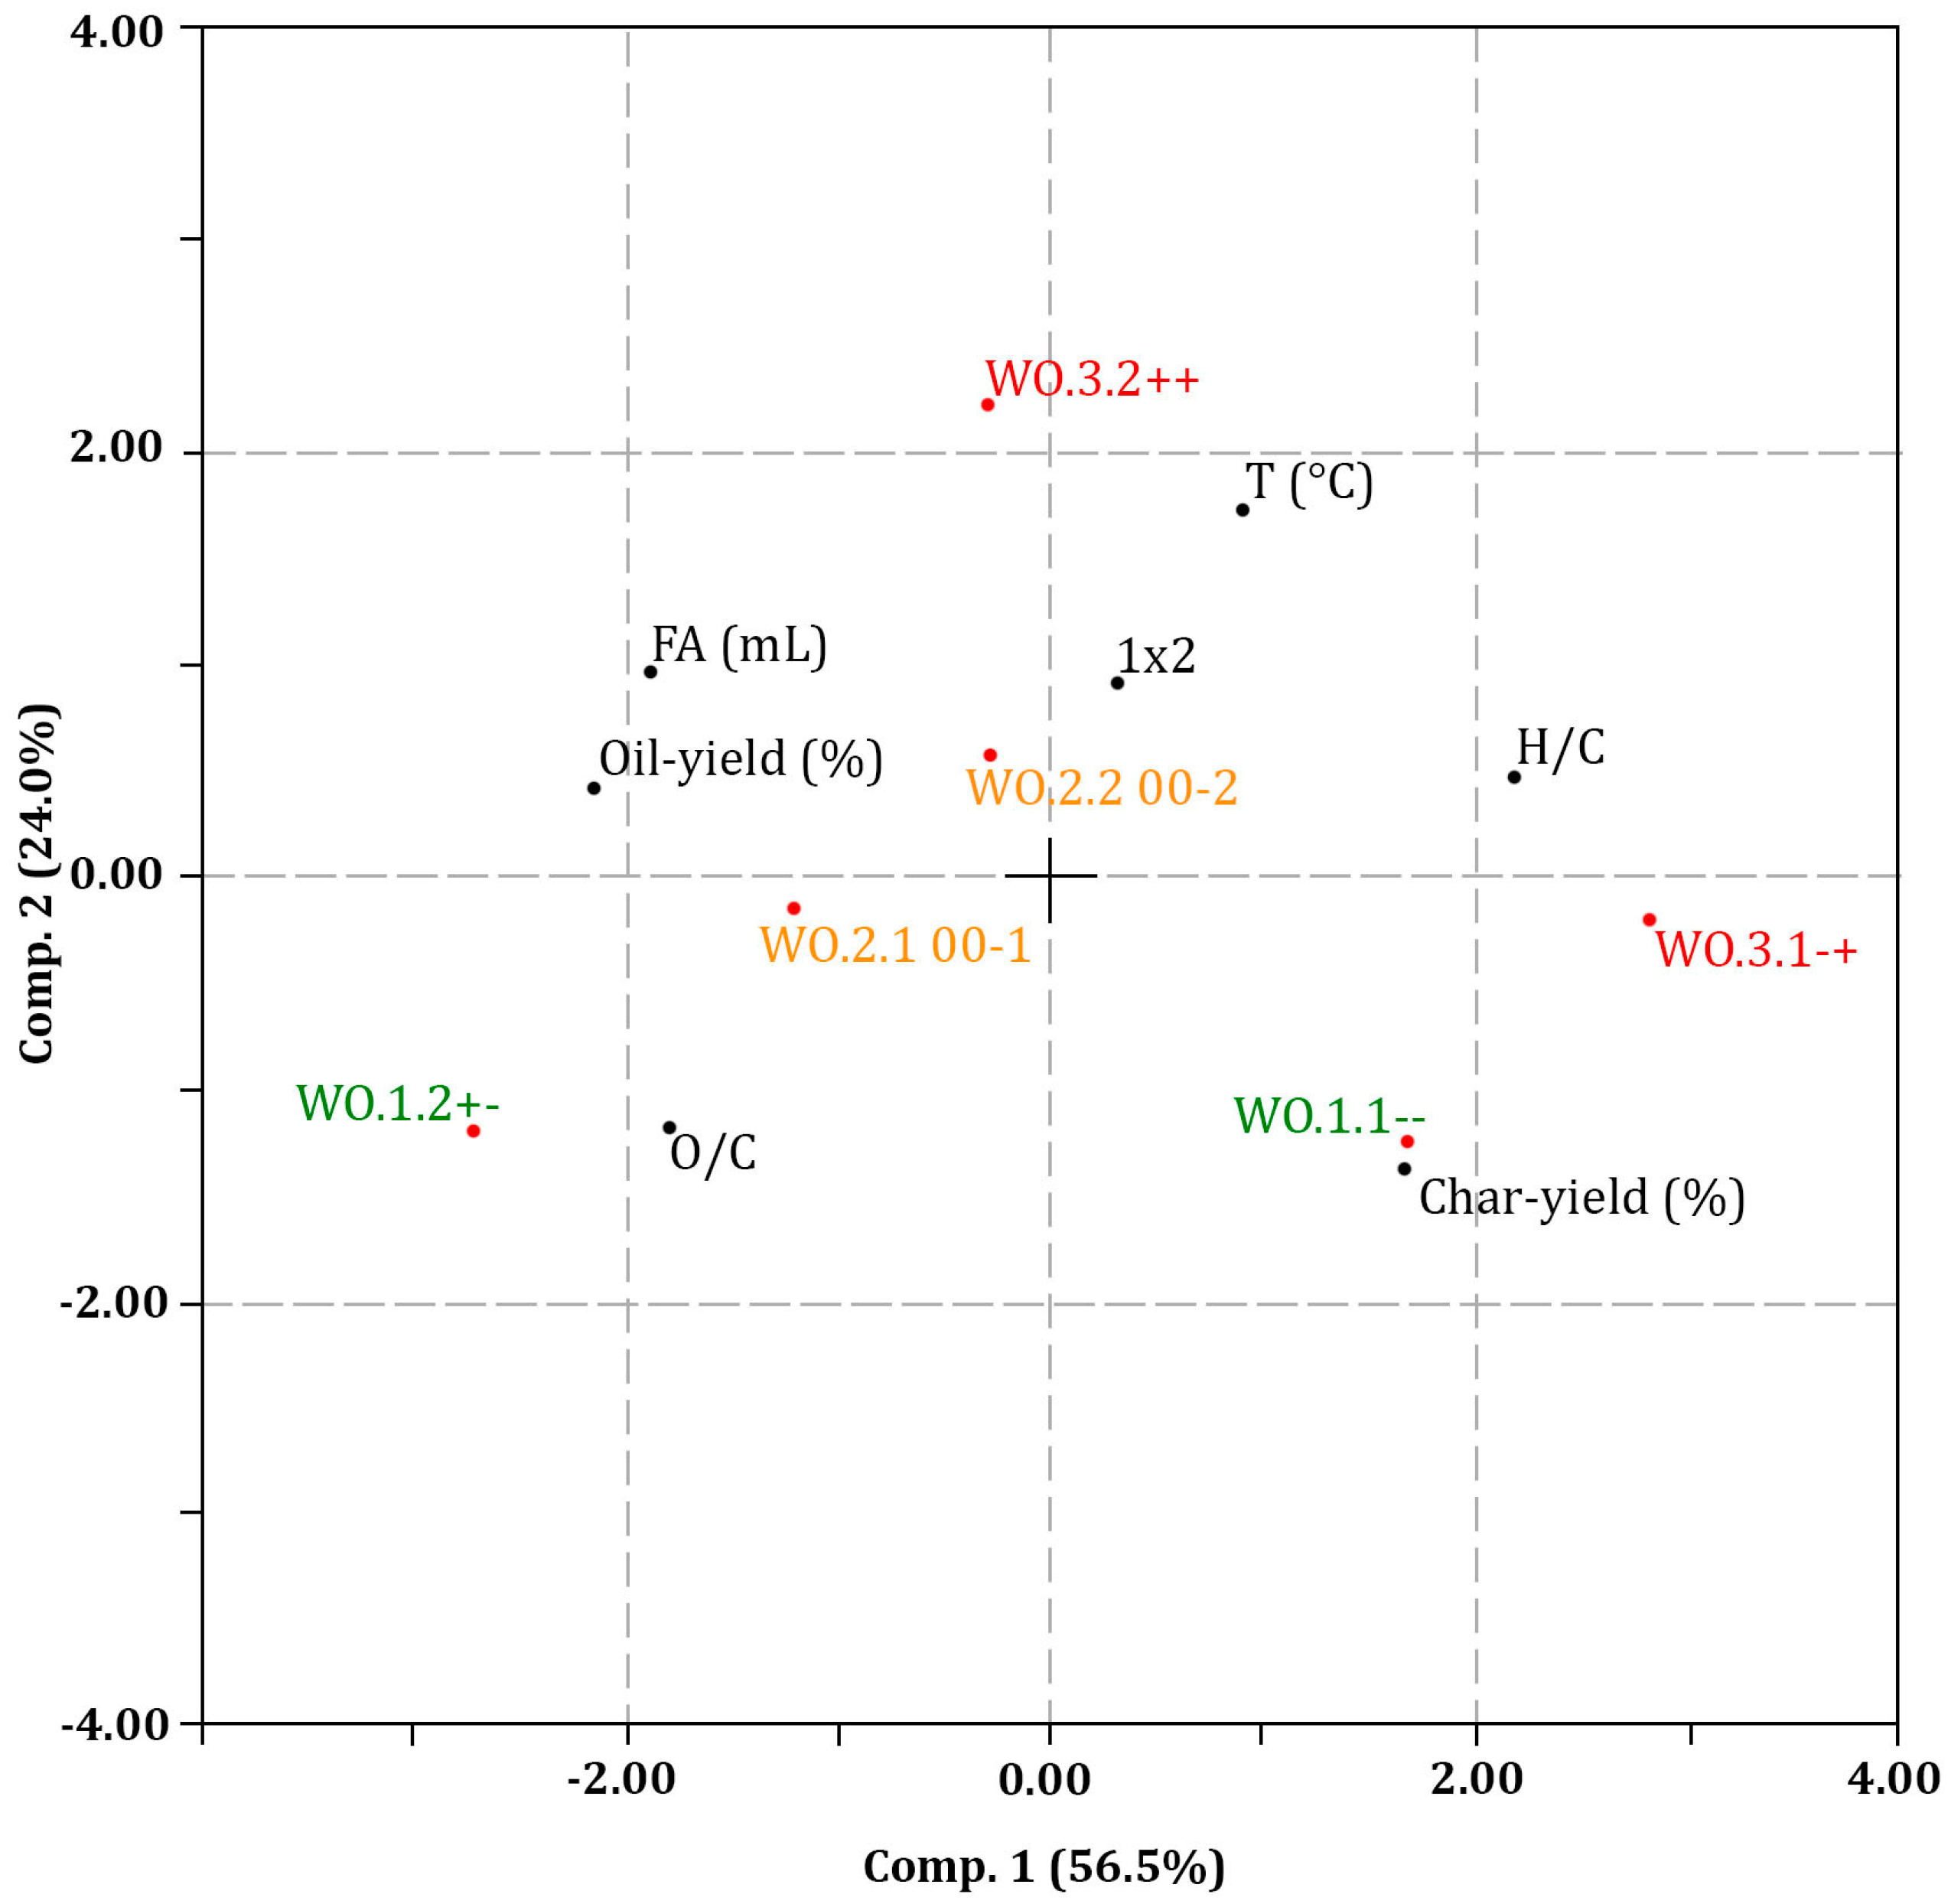
3.1. Experimental Design and Multivariate Data Analysis
3.1.1. LtL-Solvolysis
3.1.2. Quantitative Analysis
Sample Shelf Life of Silylated Bio-Oil
Quantitative Analysis
3.2. Reproducibility, Mass Recovery and Carbon Balance
4. Materials and Methods
4.1. Organosolv Fractionation and Product Purity
4.2. Experimental Design and Reaction Conditions for LtL-Solvolysis
4.3. LtL-Solvolysis
4.4. Total Organic Carbon in Aqueous Phase (TOC)
4.5. Elemental Analysis of LtL-Oil and Solid Residue
4.6. 1H-NMR
4.7. Quantification
4.7.1. Silylation
4.7.2. Sample Shelf Life of Silylated Bio-Oils
4.8. Gas Chromatography
4.8.1. Gas Chromatography-Mass Spectrometry (GC-MS)
4.8.2. Gas Chromatography-Flame Ionization Detector (GC-FID)
5. Conclusions
Supplementary Materials
Acknowledgments
Author Contributions
Conflicts of Interest
References
- Limayem, A.; Ricke, S.C. Lignocellulosic biomass for bioethanol production: Current perspectives, potential issues and future prospects. Prog. Energy Combust. Sci. 2012, 38, 449–467. [Google Scholar] [CrossRef]
- Fergus, B.J.; Procter, A.R.; Scott, J.A.N.; Goring, D.A.I. The distribution of lignin in sprucewood as determined by ultraviolet microscopy. Wood Sci. Technol. 1969, 3, 117–138. [Google Scholar] [CrossRef]
- Tuck, C.O.; Pérez, E.; Horváth, I.T.; Sheldon, R.A.; Poliakoff, M. Valorization of Biomass: Deriving More Value from Waste. Science 2012, 337, 695–699. [Google Scholar] [CrossRef] [PubMed]
- Moon, R.J.; Martini, A.; Nairn, J.; Simonsen, J.; Youngblood, J. Cellulose nanomaterials review: Structure, properties and nanocomposites. Chem. Soc. Rev. 2011, 40, 3941–3994. [Google Scholar] [CrossRef] [PubMed]
- Ragauskas, A.J.; Beckham, G.T.; Biddy, M.J.; Chandra, R.; Chen, F.; Davis, M.F.; Davison, B.H.; Dixon, R.A.; Gilna, P.; Keller, M.; et al. Lignin Valorization: Improving Lignin Processing in the Biorefinery. Science 2014, 344, 1246843. [Google Scholar] [CrossRef] [PubMed]
- Duval, A.; Lawoko, M. A review on lignin-based polymeric, micro- and nano-structured materials. React. Funct. Polym. 2014, 85, 78–96. [Google Scholar] [CrossRef]
- Zakzeski, J.; Bruijnincx, P.C.A.; Jongerius, A.L.; Weckhuysen, B.M. The Catalytic Valorization of Lignin for the Production of Renewable Chemicals. Chem. Rev. 2010, 110, 3552–3599. [Google Scholar] [CrossRef] [PubMed]
- Wang, C.; Kelley, S.S.; Venditti, R.A. Lignin-Based Thermoplastic Materials. ChemSusChem 2016, 9, 770–783. [Google Scholar] [CrossRef] [PubMed]
- Holladay, J.E.; White, J.F.; Bozell, J.J.; Johnson, D. Top Value-Added Chemicals from Biomass—Volume II—Results of Screening for Potential Candidates from Biorefinery Lignin; Report No.: PNNL-16983; NTIS: Alexandria, VA, USA, 2007.
- Bu, Q.; Lei, H.; Zacher, A.H.; Wang, L.; Ren, S.; Liang, J.; Wei, Y.; Liu, Y.; Tang, J.; Zhang, Q.; et al. A review of catalytic hydrodeoxygenation of lignin-derived phenols from biomass pyrolysis. Bioresour. Technol. 2012, 124, 470–477. [Google Scholar] [CrossRef] [PubMed]
- Czernik, S.; Bridgwater, A.V. Overview of Applications of Biomass Fast Pyrolysis Oil. Energy Fuel 2004, 18, 590–598. [Google Scholar] [CrossRef]
- Kleinert, M.; Barth, T. Towards a Lignincellulosic Biorefinery: Direct One-Step Conversion of Lignin to Hydrogen-Enriched Biofuel. Energy Fuel 2008, 22, 1371–1379. [Google Scholar] [CrossRef]
- Kleinert, M.; Barth, T. Phenols from Lignin. Chem. Eng. Technol. 2008, 31, 736–745. [Google Scholar] [CrossRef]
- Løhre, C.; Barth, T.; Kleinert, M. The effect of solvent and input material pretreatment on product yield and composition of bio-oils from lignin solvolysis. J. Anal. Appl. Pyrol. 2016, 119, 208–216. [Google Scholar] [CrossRef]
- Holmelid, B.; Kleinert, M.; Barth, T. Reactivity and reaction pathways in thermochemical treatment of selected lignin-like model compounds under hydrogen rich conditions. J. Anal. Appl. Pyrol. 2012, 98, 37–44. [Google Scholar] [CrossRef]
- Oregui Bengoechea, M.; Hertzberg, A.; Miletić, N.; Arias, P.L.; Barth, T. Simultaneous catalytic de-polymerization and hydrodeoxygenation of lignin in water/formic acid media with Rh/Al2O3, Ru/Al2O3 and Pd/Al2O3 as bifunctional catalysts. J. Anal. Appl. Pyrol. 2015, 113, 713–722. [Google Scholar] [CrossRef]
- Li, D.; Park, J.; Oh, J.-R. Silyl Derivatization of Alkylphenols, Chlorophenols, and Bisphenol A for Simultaneous GC/MS Determination. Anal. Chem. 2001, 73, 3089–3095. [Google Scholar] [CrossRef] [PubMed]
- Orata, F. Derivatization Reactions and Reagents for Gas Chromatography Analysis; INTECH Open Access Publisher: Rijeka, Croatia, 2012. [Google Scholar]
- Zhao, X.; Cheng, K.; Liu, D. Organosolv pretreatment of lignocellulosic biomass for enzymatic hydrolysis. Appl. Microbiol. Biotechnol. 2009, 82, 815–827. [Google Scholar] [CrossRef] [PubMed]
- Norsk Institutt for Skog og Landskap (2015). Klimaeffekter Pa Skog. Available online: http://www.skogoglandskap.no/temaer/klimaeffekt_pa_skog (accessed on 1 August 2016).
- Norsk Institutt for Skog og Landskap (2012). Ti Milliarder Trær I Norge. Available online: http://www.skogoglandskap.no/nyheter/2012/ti_milliarder_trer_i_norge/newsitem (accessed on 1 August 2016).
- Løhre, C.; Kleinert, M.; Barth, T. Organosolv extraction of softwood combined with lignin-to-liquid-solvolysis as a semi-continuous system. Biomass Bioenergy 2016. under revision. [Google Scholar]
- Azadi, P.; Inderwildi, O.R.; Farnood, R.; King, D.A. Liquid fuels, hydrogen and chemicals from lignin: A critical review. Renew. Sustain. Energy Rev. 2013, 21, 506–523. [Google Scholar] [CrossRef]
- Kalogiannis, K.G.; Stefanidis, S.D.; Michailof, C.M.; Lappas, A.A.; Sjöholm, E. Pyrolysis of lignin with 2DGC quantification of lignin oil: Effect of lignin type, process temperature and ZSM-5 in situ upgrading. J. Anal. Appl. Pyrol. 2015, 115, 410–418. [Google Scholar] [CrossRef]
- Wang, L.; Lei, H.; Ren, S.; Bu, Q.; Liang, J.; Wei, Y.; Liu, Y.; Lee, G.-S.J.; Chen, S.; Tang, J.; et al. Aromatics and phenols from catalytic pyrolysis of Douglas fir pellets in microwave with ZSM-5 as a catalyst. J. Anal. Appl. Pyrol. 2012, 98, 194–200. [Google Scholar] [CrossRef]
- Liguori, L.; Barth, T. Palladium-Nafion SAC-13 catalysed depolymerisation of lignin to phenols in formic acid and water. J. Anal. Appl. Pyrol. 2011, 92, 477–484. [Google Scholar] [CrossRef]
- National Centre for Biotechnology Information and National Library of Medicine. Guaiacol: PubChem Compound Database. Available online: https://pubchem.ncbi.nlm.nih.gov/compound/guaiacol (accessed on 28 July 2016).
- Dorfner, R.; Ferge, T.; Kettrup, A.; Zimmermann, R.; Yeretzian, C. Real-Time Monitoring of 4-Vinylguaiacol, Guaiacol, and Phenol during Coffee Roasting by Resonant Laser Ionization Time-of-Flight Mass Spectrometry. J. Agric. Food Chem. 2003, 51, 5768–5773. [Google Scholar] [CrossRef] [PubMed]
- Joint FAO/WHO Expert Committee on Food Additives (JECFA). Evaluation of Certain Food Additives and Contaminants; TRS 901-JECFA 55/44; JECFA: Geneva, Switzerland, 2001. [Google Scholar]
- National Centre for Biotechnology Information and National Library of Medicine. Pyrocatechol: PubChem Compound Database. Available online: https://pubchem.ncbi.nlm.nih.gov/compound/catechol (accessed on 28 July 2016).
- Fiege, H.; Voges, H.-W.; Hamamoto, T.; Umemura, S.; Iwata, T.; Miki, H.; Fujita, Y.; Buysch, H.-J.; Garbe, D.; Paulus, W. Phenol Derivatives. Ullmann’s Encyclopedia of Industrial Chemistry; Wiley-VCH Verlag GmbH & Co. KGaA: Weinheim, Germany, 2000. [Google Scholar]
- National Centre for Biotechnology Information and National Library of Medicine. 2-Naphthol: PubChem Compound Database. Available online: https://pubchem.ncbi.nlm.nih.gov/compound/8663 (accessed on 28 July 2016).
- Beggs, K.T.; Mercer, A.R. Dopamine Receptor Activation By Honey Bee Queen Pheromone. Curr. Biol. 2009, 19, 1206–1209. [Google Scholar] [CrossRef] [PubMed]
- Hansen, B.G. Omdanning av Maursyre Ved Høyt Trykk og Temperatur. Master’s Thesis, University of Bergen, Bergen, Norway, 2000. [Google Scholar]
- Oregui Bengoechea, M.; Gandarias, I.; Arias, P.L.; Barth, T. Unraveling the role of formic acid and the type of solvent in the catalytic conversion of lignin: A holistic approach. ChemSusChem 2016. [Google Scholar] [CrossRef] [PubMed]
- Sluiter, A.; Hames, B.; Ruiz, R.; Scarlata, C.; Sluiter, J.; Templeton, D.; Crocker, D. Determination of Structural Carbohydrates and Lignin in Biomass; Report No.: NREL/TP-510-42618; National Renewable Energy Laboratory: Golden, CO, USA, 2011.
- Technical Association of the Pulp and Paper Industry (TAPPI). UM 250 Acid-Soluble Lignin in Wood and Pulp; TAPPI UM: Peachtree Corners, GA, USA, 1991. [Google Scholar]
- Kleinert, M.; Gasson, J.R.; Barth, T. Optimizing solvolysis conditions for integrated depolymerisation and hydrodeoxygenation of lignin to produce liquid biofuel. J. Anal. Appl. Pyrol. 2009, 85, 108–117. [Google Scholar] [CrossRef]
- Carlson, R.; Carlson, J.E. Design and Optimization in Organic Synthesis, 24th ed.; Elsevier B.V.: Amsterdam, The Netherlands, 2005. [Google Scholar]


| Wood Shavings (g) | 25.6 |
|---|---|
| Ethanol:Water (wt %) | 63:37 |
| Temperature (°C) | 175 |
| Flow (mL·min−1) | 1.500 |
| Time (h) | 10.0 |
| Sulfuric acid—H2SO4 (mM) | 6.00 |
| Fibre residue (wt % of input biomass) | 25.8 (±1.0) |
| Fibre residue (wt % of sample’s cellulose mass) | 68.1 (±2.7) |
| Residual lignin content in fibre residue (wt %) | 6.1 (±0.1) |
| Lignin yield (wt % of input biomass) | 23.9 (±0.8) |
| Lignin yield (wt % of sample’s lignin mass) | 83.0 (±2.9) |
| Lignin purity (%) | 94.9 (±0.2) |
| Residuals in aqueous phase (wt % of input biomass) | 49.1 |
| Sum of fibre residue, extracted lignin and residuals in Aqueous phase (wt % of input wood shavings mass) | 99.1 |
| In/Out | Experiment | WO.1.1 | WO.1.2 | WO.2.1 | WO.2.2 | WO.3.1 | WO.3.2 |
|---|---|---|---|---|---|---|---|
| In | Formic acid (mL) | 0.50 | 1.00 | 0.75 | 0.75 | 0.50 | 1.00 |
| Temperature (°C) | 320 | 320 | 340 | 340 | 360 | 360 | |
| Total mass input (g) | 5.12 | 5.78 | 5.45 | 5.45 | 5.18 | 5.76 | |
| Out | Gas (% of formic acid input) | 98.4 | 90.2 | 96.8 | 96.8 | 96.8 | 98.4 |
| LtL-oil yield (% of lignin input) | 77.9 | 94.2 | 89.3 | 89.4 | 69.2 | 88.7 | |
| Aqueous-phase (% of solvent input) * | 97.3 | 99.1 | 97.4 | 97.1 | 99.3 | 96.6 | |
| Solids (% of lignin input) | 22.7 | 9.7 | 7.5 | 7.0 | 19.1 | 5.7 | |
| Total mass output (g) | 5.00 | 5.70 | 5.30 | 5.29 | 5.07 | 5.57 | |
| Mass recovery (%) | 97.7 | 97.6 | 97.2 | 96.9 | 97.9 | 96.8 |
| Compound | O/C Ratio |  |
|---|---|---|
Guaiacol  | 0.29 |  |
4-Methylguaiacol  | 0.25 |  |
4-Ethylguaiacol  | 0.22 |  |
4-Propylguaiacol  | 0.20 |  |
Catechol | 0.33 |  |
3-Methylcatechol  | 0.29 |  |
4-Methylcatechol  | 0.29 |  |
4-Ethylcatechol  | 0.25 |  |
2-Naphthol  | 0.10 |  |
Homovanillyl alcohol  | 0.33 |  |
| Total identified (wt %) | 4.74 4.60 4.25 4.14 4.99 5.05 4.66 4.47 9.08 9.47 7.88 8.20 |
| Experiment | WO.1.1 | WO.1.2 | WO.2.1 | WO.2.2 | WO.3.1 | WO.3.2 |
|---|---|---|---|---|---|---|
| Lignin mass (g) | 0.51 | 0.51 | 0.50 | 0.50 | 0.51 | 0.51 |
| Carbon content in Lignin (wt %) | 65.36 | |||||
| Carbon added as Lignin (g) | 0.33 | 0.33 | 0.33 | 0.33 | 0.33 | 0.33 |
| Bio-oil mass (g) | 0.40 | 0.48 | 0.45 | 0.45 | 0.35 | 0.45 |
| Carbon content in Bio-oil (wt %) | 70.66 | 68.50 | 69.53 | 71.19 | 72.05 | 71.71 |
| Carbon contribution from Bio-oil (g) | 0.28 | 0.33 | 0.31 | 0.32 | 0.25 | 0.32 |
| Char mass (g) | 0.12 | 0.05 | 0.04 | 0.04 | 0.10 | 0.03 |
| Carbon content in Char (wt %) | 67.48 | 47.25 * | 51.92 | 48.06 * | 72.62 | NA ** |
| Carbon contribution from Char (g) | 0.08 | 0.02 | 0.02 | 0.02 | 0.07 | NA ** |
| Carbon mass in aqueous sample (g) | 0.10 | 0.11 | 0.06 | 0.06 | 0.13 | 0.11 |
| Carbon sum from products (g) | 0.46 | 0.46 | 0.39 | 0.39 | 0.45 | 0.44 |
| Total Carbon balance (%) | 138.86 | 139.58 | 118.74 | 119.93 | 136.29 | >134.2 |
| Carbon balance excluding the aqueous phase (%) | 107.67 | 105.72 | 100.94 | 102.52 | 97.52 | >97.3 |
| Experiment | WO.1.1 -- | WO.1.2 +- | WO.2.1 00-1 | WO.2.2 00-2 | WO.3.1 -+ | WO.3.2 ++ |
|---|---|---|---|---|---|---|
| V1 | - | + | 0 | 0 | - | + |
| V2 | - | - | 0 | 0 | + | + |
© 2017 by the authors; licensee MDPI, Basel, Switzerland. This article is an open access article distributed under the terms and conditions of the Creative Commons Attribution (CC BY) license (http://creativecommons.org/licenses/by/4.0/).
Share and Cite
Løhre, C.; Halleraker, H.V.; Barth, T. Composition of Lignin-to-Liquid Solvolysis Oils from Lignin Extracted in a Semi-Continuous Organosolv Process. Int. J. Mol. Sci. 2017, 18, 225. https://0-doi-org.brum.beds.ac.uk/10.3390/ijms18010225
Løhre C, Halleraker HV, Barth T. Composition of Lignin-to-Liquid Solvolysis Oils from Lignin Extracted in a Semi-Continuous Organosolv Process. International Journal of Molecular Sciences. 2017; 18(1):225. https://0-doi-org.brum.beds.ac.uk/10.3390/ijms18010225
Chicago/Turabian StyleLøhre, Camilla, Hilde Vik Halleraker, and Tanja Barth. 2017. "Composition of Lignin-to-Liquid Solvolysis Oils from Lignin Extracted in a Semi-Continuous Organosolv Process" International Journal of Molecular Sciences 18, no. 1: 225. https://0-doi-org.brum.beds.ac.uk/10.3390/ijms18010225