Article

Microsomal Prostaglandin E Synthase-1 Facilitates an Intercellular Interaction between CD4+ T Cells through IL-1β Autocrine Function in Experimental Autoimmune Encephalomyelitis

1
Medical Research Institute, Tokyo Women’s Medical University, Tokyo 162-8666, Japan
2
Department of Neurology, Tokyo Metropolitan Kita Medical and Rehabilitation Center for the Disabled, Tokyo 114-0033, Japan
*
Author to whom correspondence should be addressed.
Int. J. Mol. Sci. 2017, 18(12), 2758; https://0-doi-org.brum.beds.ac.uk/10.3390/ijms18122758
Submission received: 20 October 2017 / Revised: 9 December 2017 / Accepted: 13 December 2017 / Published: 19 December 2017
(This article belongs to the Special Issue Advances in Multiple Sclerosis 2017)

Abstract

:
Microsomal prostaglandin synthetase-1 (mPGES-1) is an inducible terminal enzyme that produces prostaglandin E2 (PGE2). In our previous study, we investigated the role of mPGES-1 in the inflammation and demyelination observed in experimental autoimmune encephalomyelitis (EAE), an animal model of multiple sclerosis, using mPGES-1-deficient (mPGES-1−/−) and wild-type (wt) mice. We found that mPGES-1 facilitated inflammation, demyelination, and paralysis and was induced in vascular endothelial cells and macrophages and microglia around inflammatory foci. Here, we investigated the role of interleukin-1β (IL-1β) in the intercellular mechanism stimulated by mPGES-1 in EAE spinal cords in the presence of inflammation. We found that the area invaded by CD4-positive (CD4+) T cells was extensive, and that PGE2 receptors EP1–4 were more induced in activated CD4+ T cells of wt mice than in those of mPGES-1−/− mice. Moreover, IL-1β and IL-1 receptor 1 (IL-1r1) were produced by 65% and 48% of CD4+ T cells in wt mice and by 44% and 27% of CD4+ T cells in mPGES-1−/− mice. Furthermore, interleukin-17 (IL-17) was released from the activated CD4+ T cells. Therefore, mPGES-1 stimulates an intercellular interaction between CD4+ T cells by upregulating the autocrine function of IL-1β in activated CD4+ T cells, which release IL-17 to facilitate axonal and myelin damage in EAE mice.

Graphical Abstract

1. Introduction

In the brain, prostaglandin E2 (PGE2) is sequentially synthesized from arachidonic acid by cyclooxygenase-2 (COX-2) and microsomal PGE2 synthase (PGES)-1 (mPGES-1) during neuroinflammation. Moreover, mPGES-1 is induced in the vascular endothelial cells (VECs) of the brain to mediate endotoxin-induced fever [1] and neuronal loss elicited by kainic acid (KA) [2]. Multiple sclerosis (MS) is a central nervous system disease characterized by multifocal areas of leukocyte infiltration and demyelination. Inflammation is one of the most commonly observed pathological features of MS, and inflammatory mediators are known to modulate tissue damage in this disease. COX-2 was reported to be upregulated in microglia and macrophages in the brains of MS patients [3] and in brain VECs in experimental autoimmune encephalomyelitis (EAE), an animal model of MS [4]. In rodent EAE models using oligodendrocyte glycoprotein35–55 peptide (MOG35–55), histological examination revealed inflammatory foci with typical perivascular infiltration of mononuclear cells in the spinal cord and brain [5,6]. MOG35–55 EAE shows infiltration of the cerebral meninges at the lateral and the third ventricle and severe parenchymal infiltration in the spinal cord [6]. EAE disease is then manifested as an ascending flaccid paralysis with inflammation targeting the spinal cord [7,8]; accordingly, we focused on the inflammation of the spinal cord in this study.
In addition, PGE2 levels were previously shown to be increased in the spinal cords of EAE animals [9,10,11,12], while treatment with selective COX-2 inhibitors blocked the increase in spinal PGE2 and suppressed the development of paralysis in EAE [13,14,15]. The contribution of mPGES-1 to MS was revealed by showing that mPGES-1 induction in infiltrated macrophages facilitated the clinical progression of EAE mice [11,12]. We also demonstrated in mPGES-1-deficient (mPGES-1−/−) mice that PGE2, produced by mPGES-1 in VECs and macrophage and microglia around inflammatory foci, facilitated inflammation, demyelination, and paralysis in EAE [12]. Central PGE2 derived from endothelial and macrophage mPGES-1 may aggravate the spread of inflammation and local demyelination in the spinal cord; however, the mechanisms are unknown. In contrast, interleukin-1β (IL-1β) is known to aggravate EAE development and inflammation in the spinal cord. The administration of the recombinant interleukin-1 receptor antagonist (IL-1RN) to EAE rats delayed the onset of the disease and reduced its severity [16]. In addition, a defective interleukin-1 receptor 1 (IL-1r1) gene in mice has been associated with a complete resistance to EAE [17].
IL-1β is also generally known to facilitate PGE2 production. However, there is no evidence that IL-1β induction is conversely regulated by PGE2 or that IL-1β is related to the intercellular mechanism of EAE aggravation stimulated by mPGES-1. In addition, PGE2 is related to the differentiation of interleukin-17 (IL-17)-producing helper T cells (Th17), and it regulates the type 1 helper T cell (Th1)/Th17 immune responses of CD4-positive (CD4+) T cells. This regulation is accomplished via the EP2 and EP4 receptors, with both IL-23 and IL-1β [18,19]. PGE2 also enhances IL-17 expression through the EP4 receptor [20]. Moreover, Th17 differentiation is regulated by IL-1β signaling through IL-1r1 [21,22].
Therefore, we hypothesized that PGE2 synthesized by mPGES-1 regulates IL-1β autocrine function in CD4+ T cells and promotes intercellular communication between CD4+ T cells. Thus, we first investigated whether PGE2 synthesized by mPGES-1 could activate CD4+ T cells and EP receptors on CD4+ T cells. Next, we determined whether mPGES-1 could stimulate IL-1r1 appearance and the production of IL-1β and IL-17 in CD4+ T cells by assessing their cellular activity.

2. Results

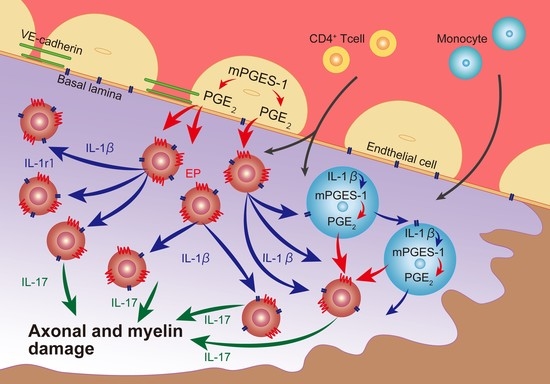
2.1. mPGES-1 Induced in Endothelial Cells and Macrophages Aggravates EAE Paralysis

In immunohistochemistry (IHC) experiments, mPGES-1 was expressed in CD31+ endothelial cells (ECs) and CD11b+ macrophages and microglia, but not in CD4+ T cells, which surrounded the other cells in the inflammatory region of the spinal cord in wild-type (wt) EAE mice (Figure 1A,C,E). In contrast, mPGES-1 was not expressed in mPGES-1−/− EAE mice (Figure 1B,D,F). Moreover, we did not detect CD19+ B cells in the inflammatory region (Figure S1). In the development of EAE, the onset of symptoms occurred significantly later in mPGES-1−/− EAE than in wt EAE (p = 0.0104, Figure 1G). In wt mice, the EAE score showed a gradual increase, with the score maintaining a high level, whereas the EAE score of mPGES-1−/− mice showed a temporary increase and then promptly decreased (Figure S2). Therefore, the EAE score at day 19 was significantly lower in mPGES-1−/− EAE than in wt EAE (p = 0.0403, Figure 1H). Thus, PGE2 produced by mPGES-1 facilitates EAE symptoms.

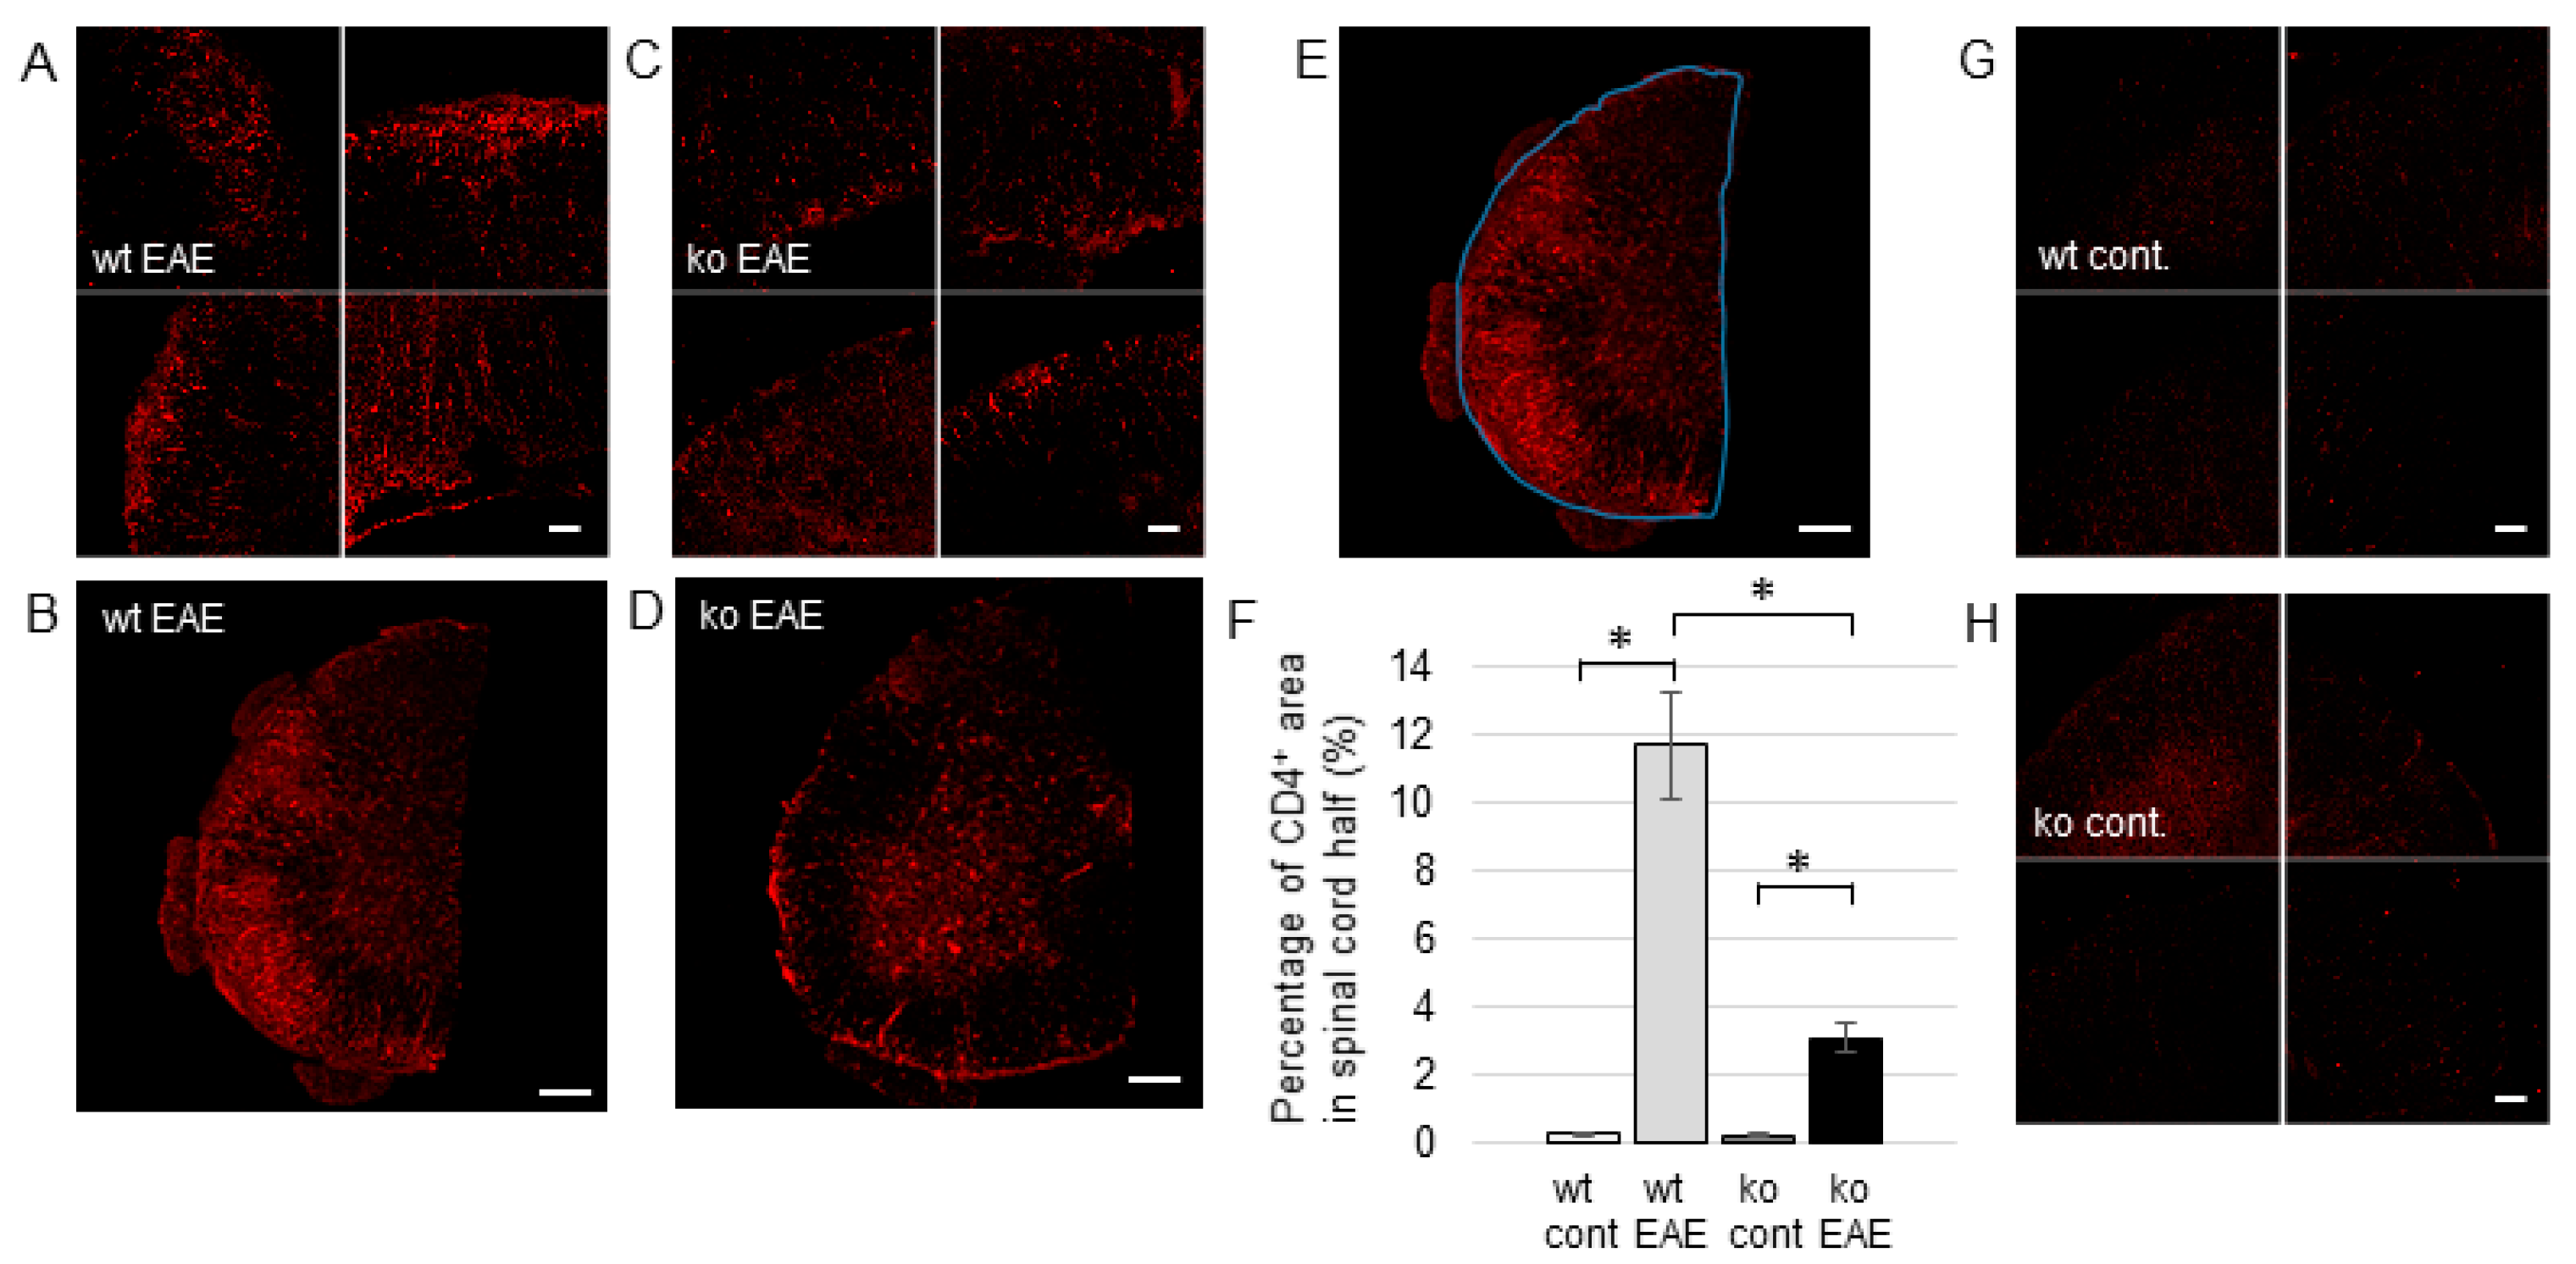
2.2. CD4+ T Cell Invasion in the EAE Spinal Cord is Facilitated by mPGES-1

CD4+ T cells formed a perivascular cluster and infiltrated into the parenchyma in wt EAE mice (Figure 2A,B); however, they were scattered around the vessels of the spinal cord in mPGES-1−/− EAE mice (Figure 2C,D). In addition, there were almost no CD4+ T cells in control spinal cords (Figure 2G,H). The percentage of the area invaded by CD4+ T cells was significantly higher in wt EAE (11.7 ± 1.6%) than in mPGES-1−/− EAE mice (3.1 ± 0.4%) (p < 0.0001, Figure 2E,F). This result suggests that PGE2 synthesized from mPGES-1 stimulates the activation of CD4+ T cells. We hypothesized that if PGE2 directly facilitates T cell activity, then the T cells must express the PGE2 receptor EP, and their IL-1β production may be increased. Therefore, we next examined the appearance of EP receptors and IL-1β in CD4+ T cells.

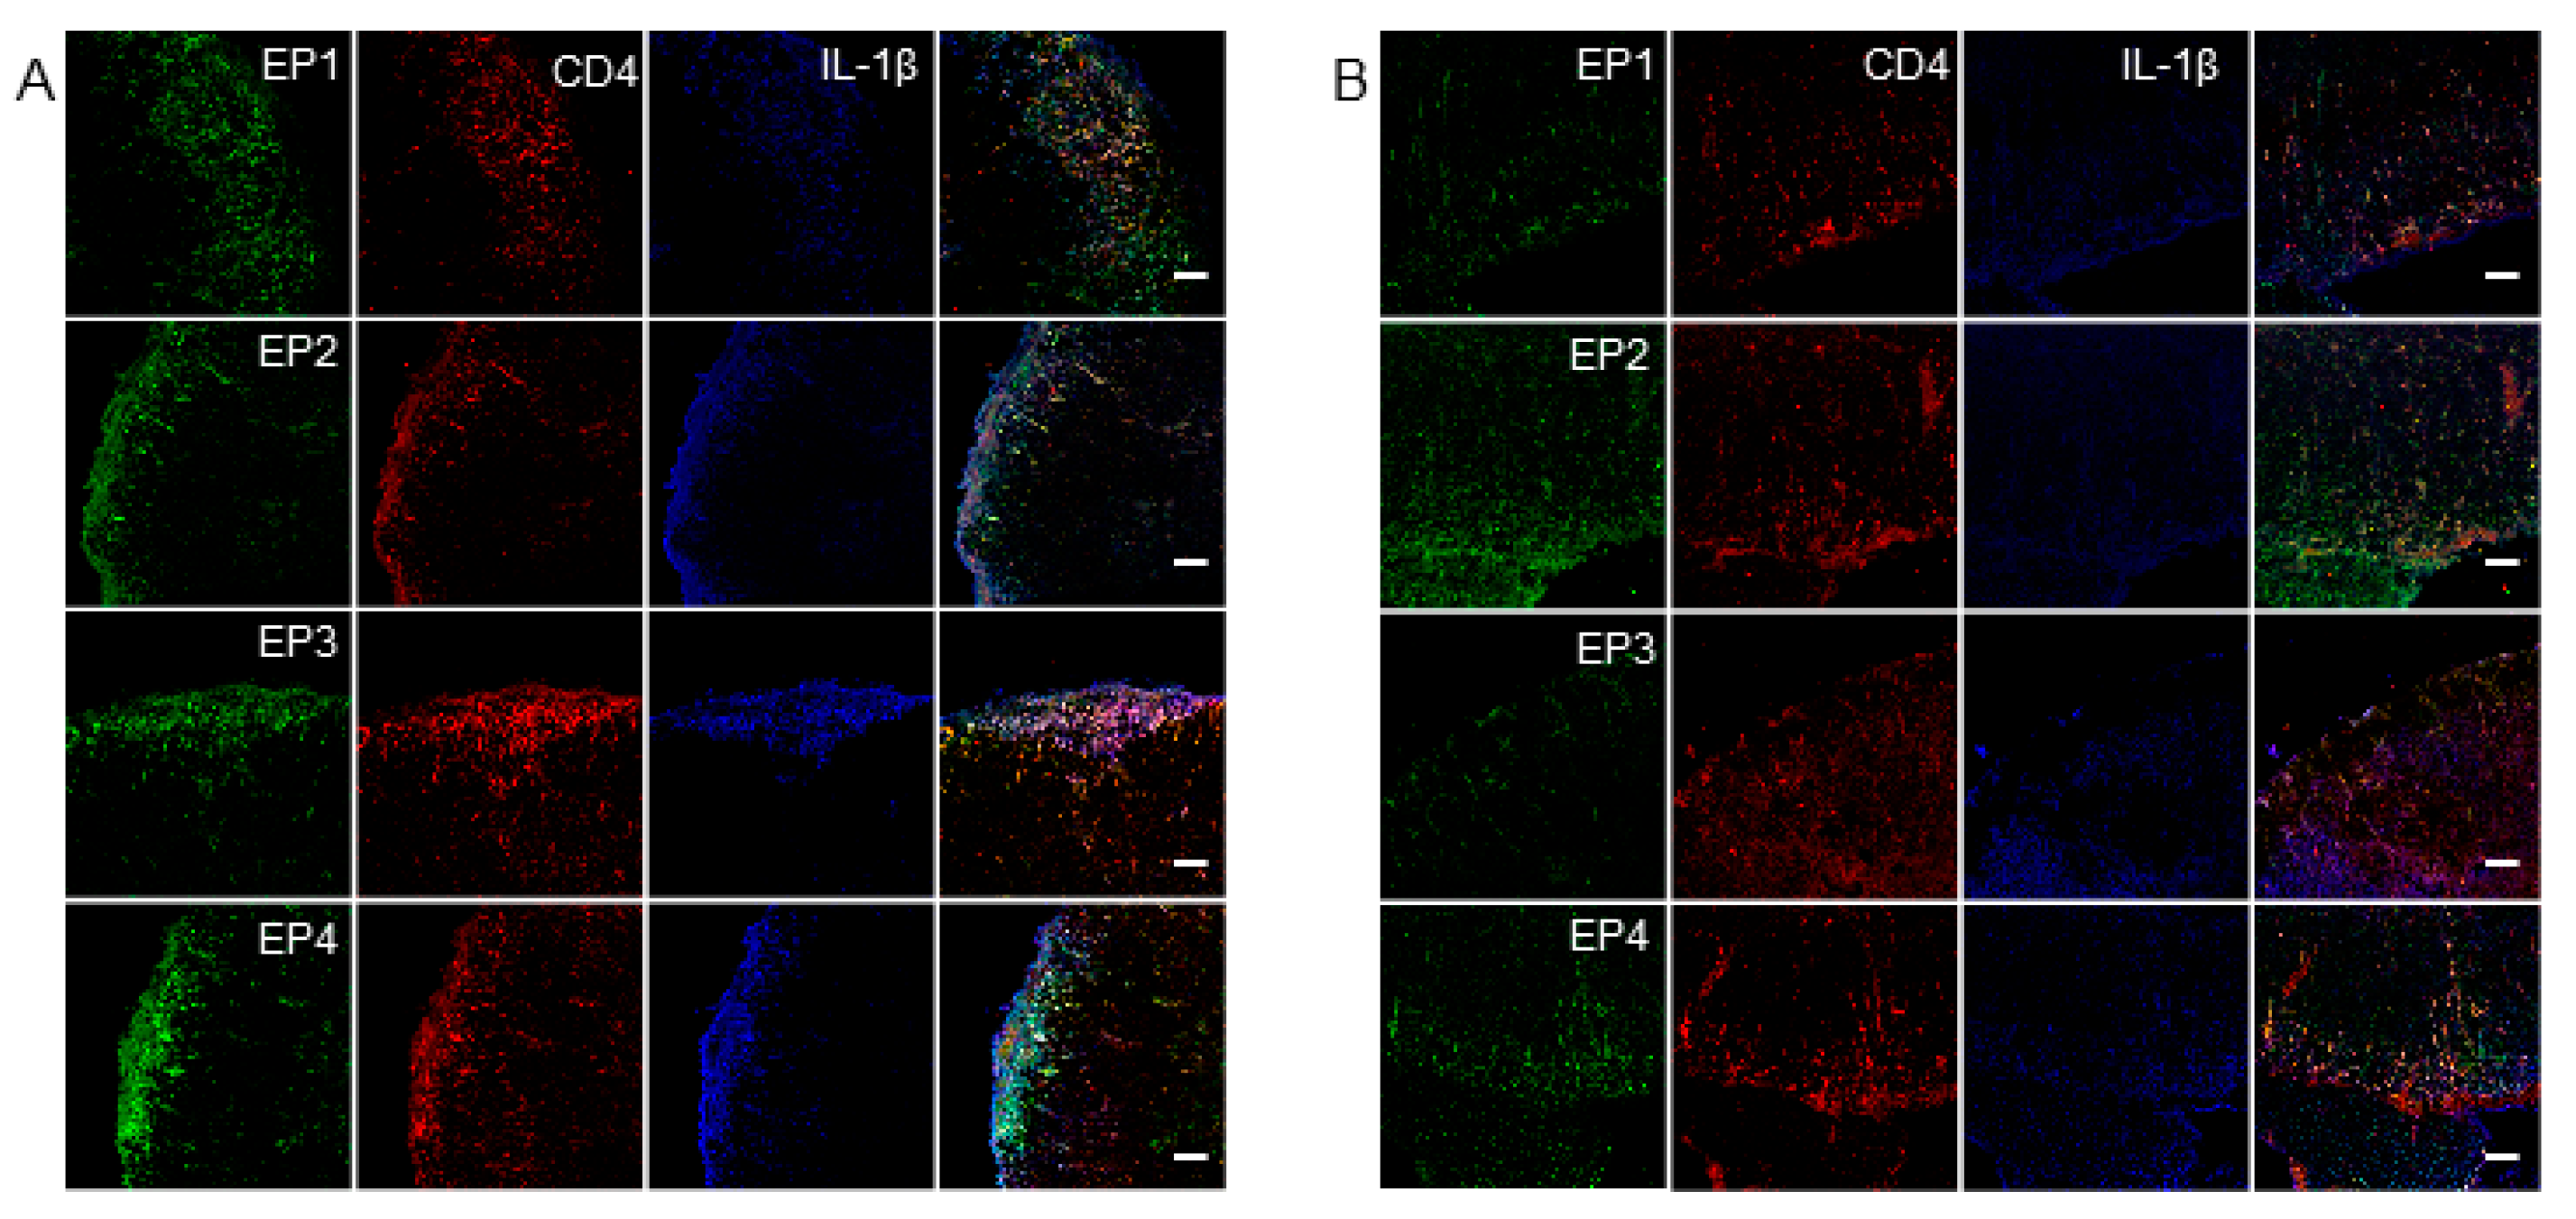
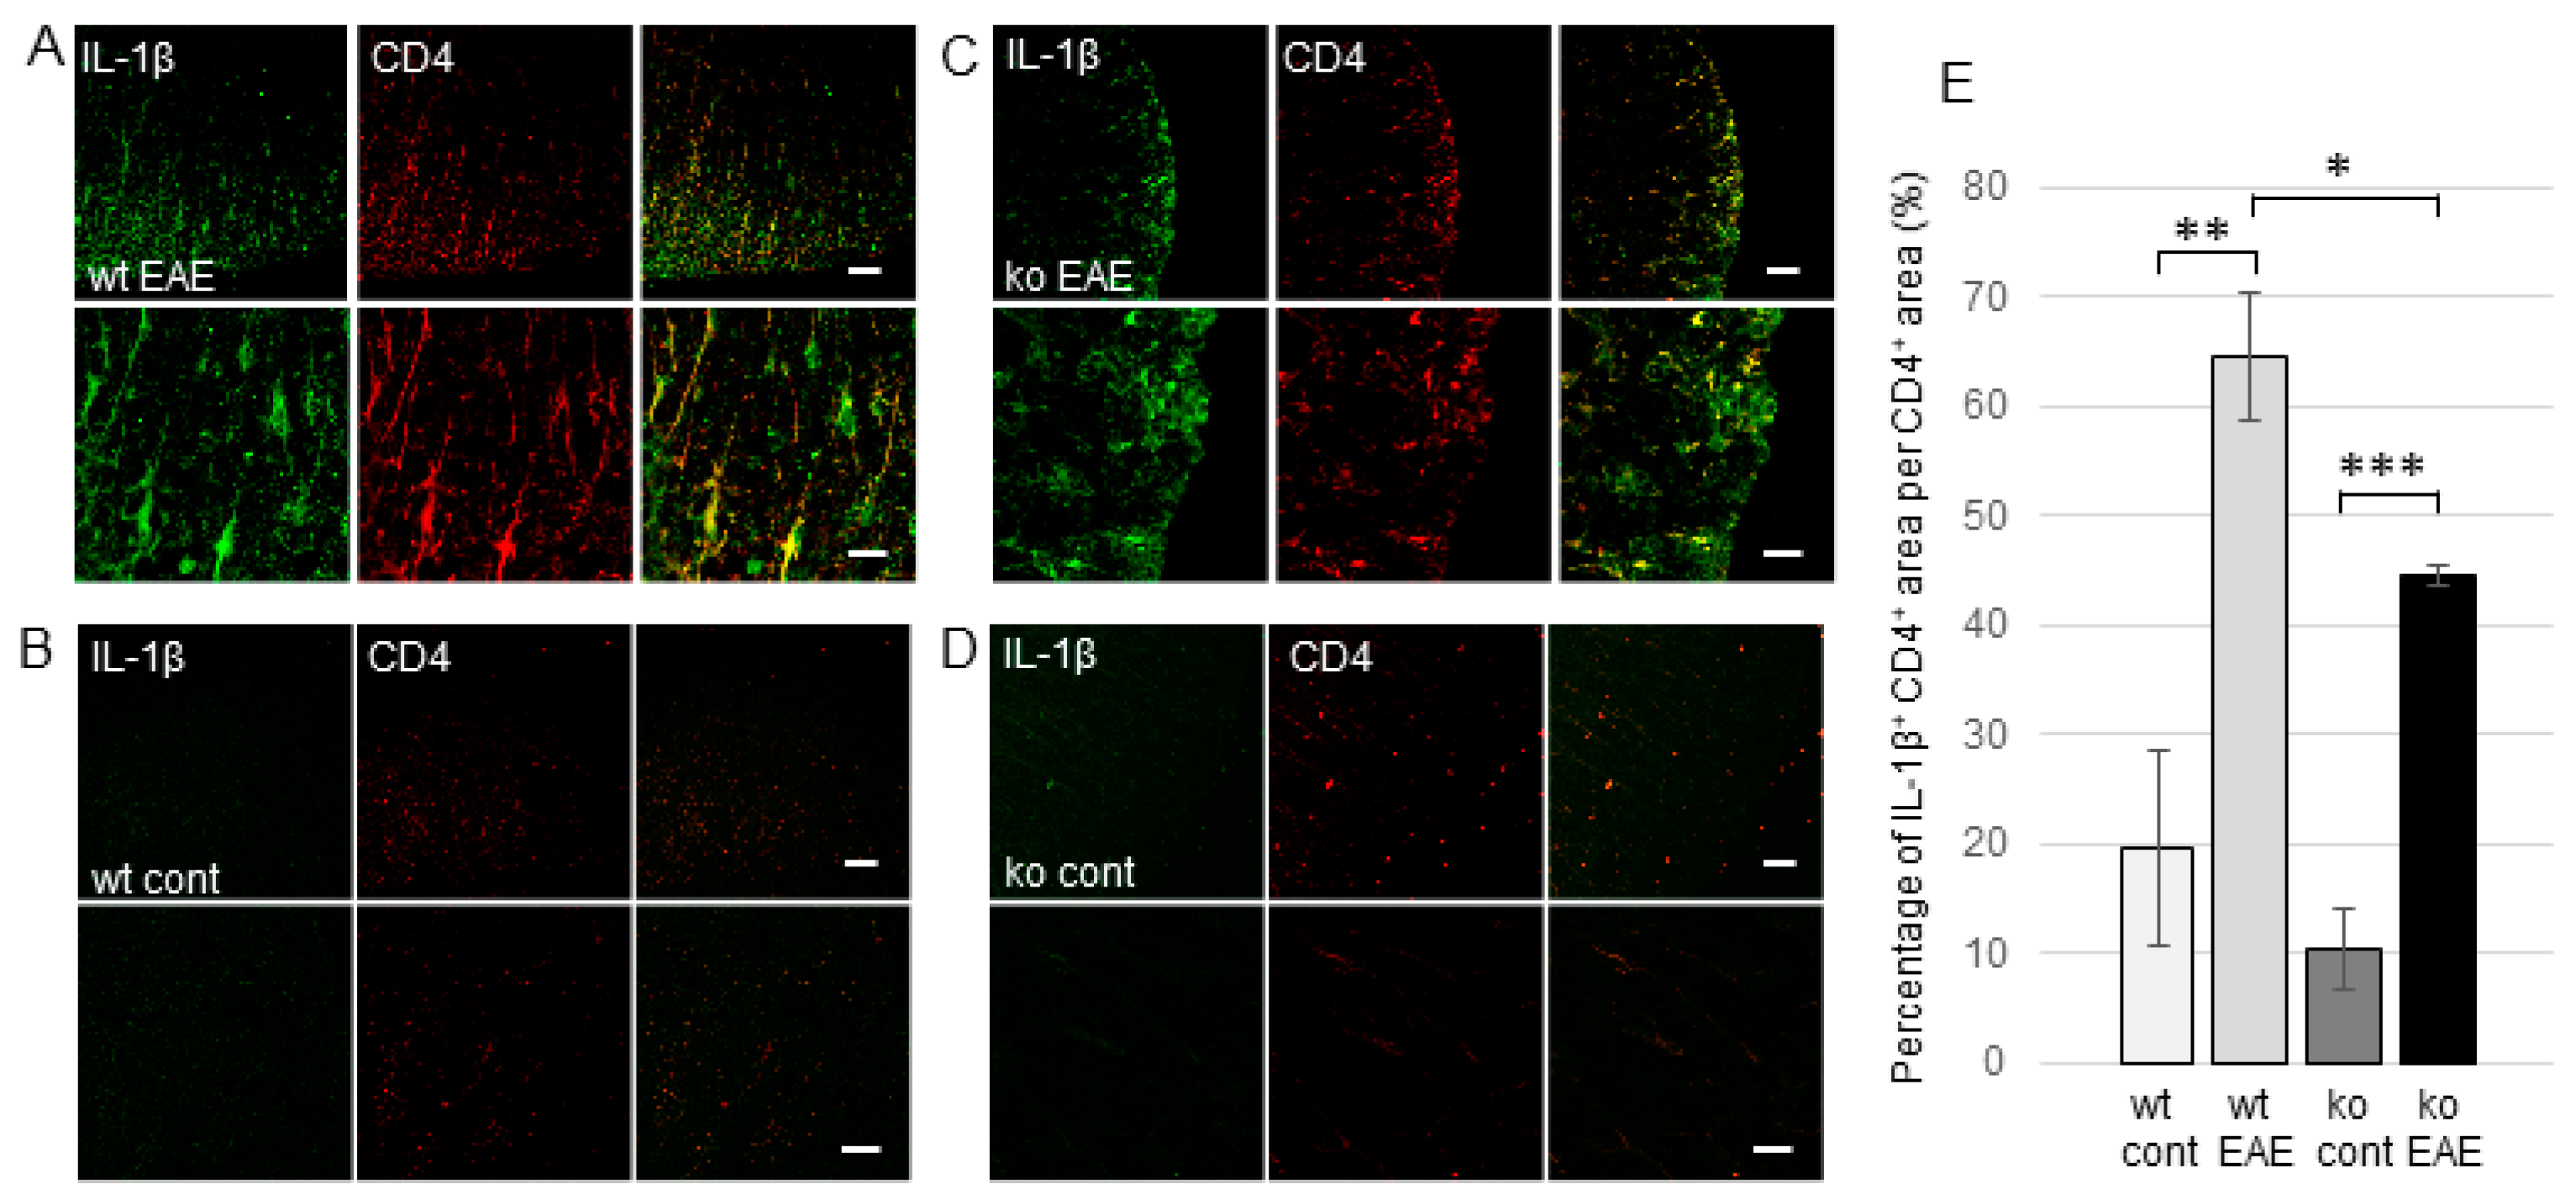
2.3. The Induction of EP Receptors and IL-1β in CD4+ T Cells is Regulated by mPGES-1

There was no expression of EP receptors or IL-1β in control spinal cords, regardless of the presence of mPGES-1 (Figure S3). EP receptors 1–4 were strongly stained and widely colocalized with CD4 in spinal cords in wt EAE mice, but only weakly stained and partially colocalized in mPGES-1−/− EAE mice (Figure 3 and Figure S4). In addition, IL-1β expression was observed in almost all CD4+ T cells in wt EAE mice, but in only a portion of CD4+ T cells in mPGES-1−/− EAE mice (Figure 3 and Figure S4). Because there were no major differences in the association with IL-1β between the different EP receptors, we examined IL-1β and CD4 double staining and compared it between wt and mPGES-1−/− EAE mice (Figure 4A–D). The percentage of the IL-1β+ CD4+ area per CD4+ area in the spinal cord was significantly higher in wt EAE mice (64.6 ± 5.8%) than in mPGES-1−/− EAE mice (44.5 ± 4.7%) (p = 0.0146, Figure 4E), suggesting that IL-1β production may be regulated by mPGES-1. In addition, IL-1β was also expressed in activated CD11b+ macrophages and microglia (Figure 5). The percentage of the IL-1β+ CD11b+ area per CD11b+ area in the spinal cord was significantly higher in wt EAE mice (65.7 ± 10.4%) than in mPGES-1−/− EAE mice (32.6 ± 8.1%) (p = 0.0128, Figure 5E), suggesting that IL-1β production in macrophages and microglia may also be regulated by mPGES-1.

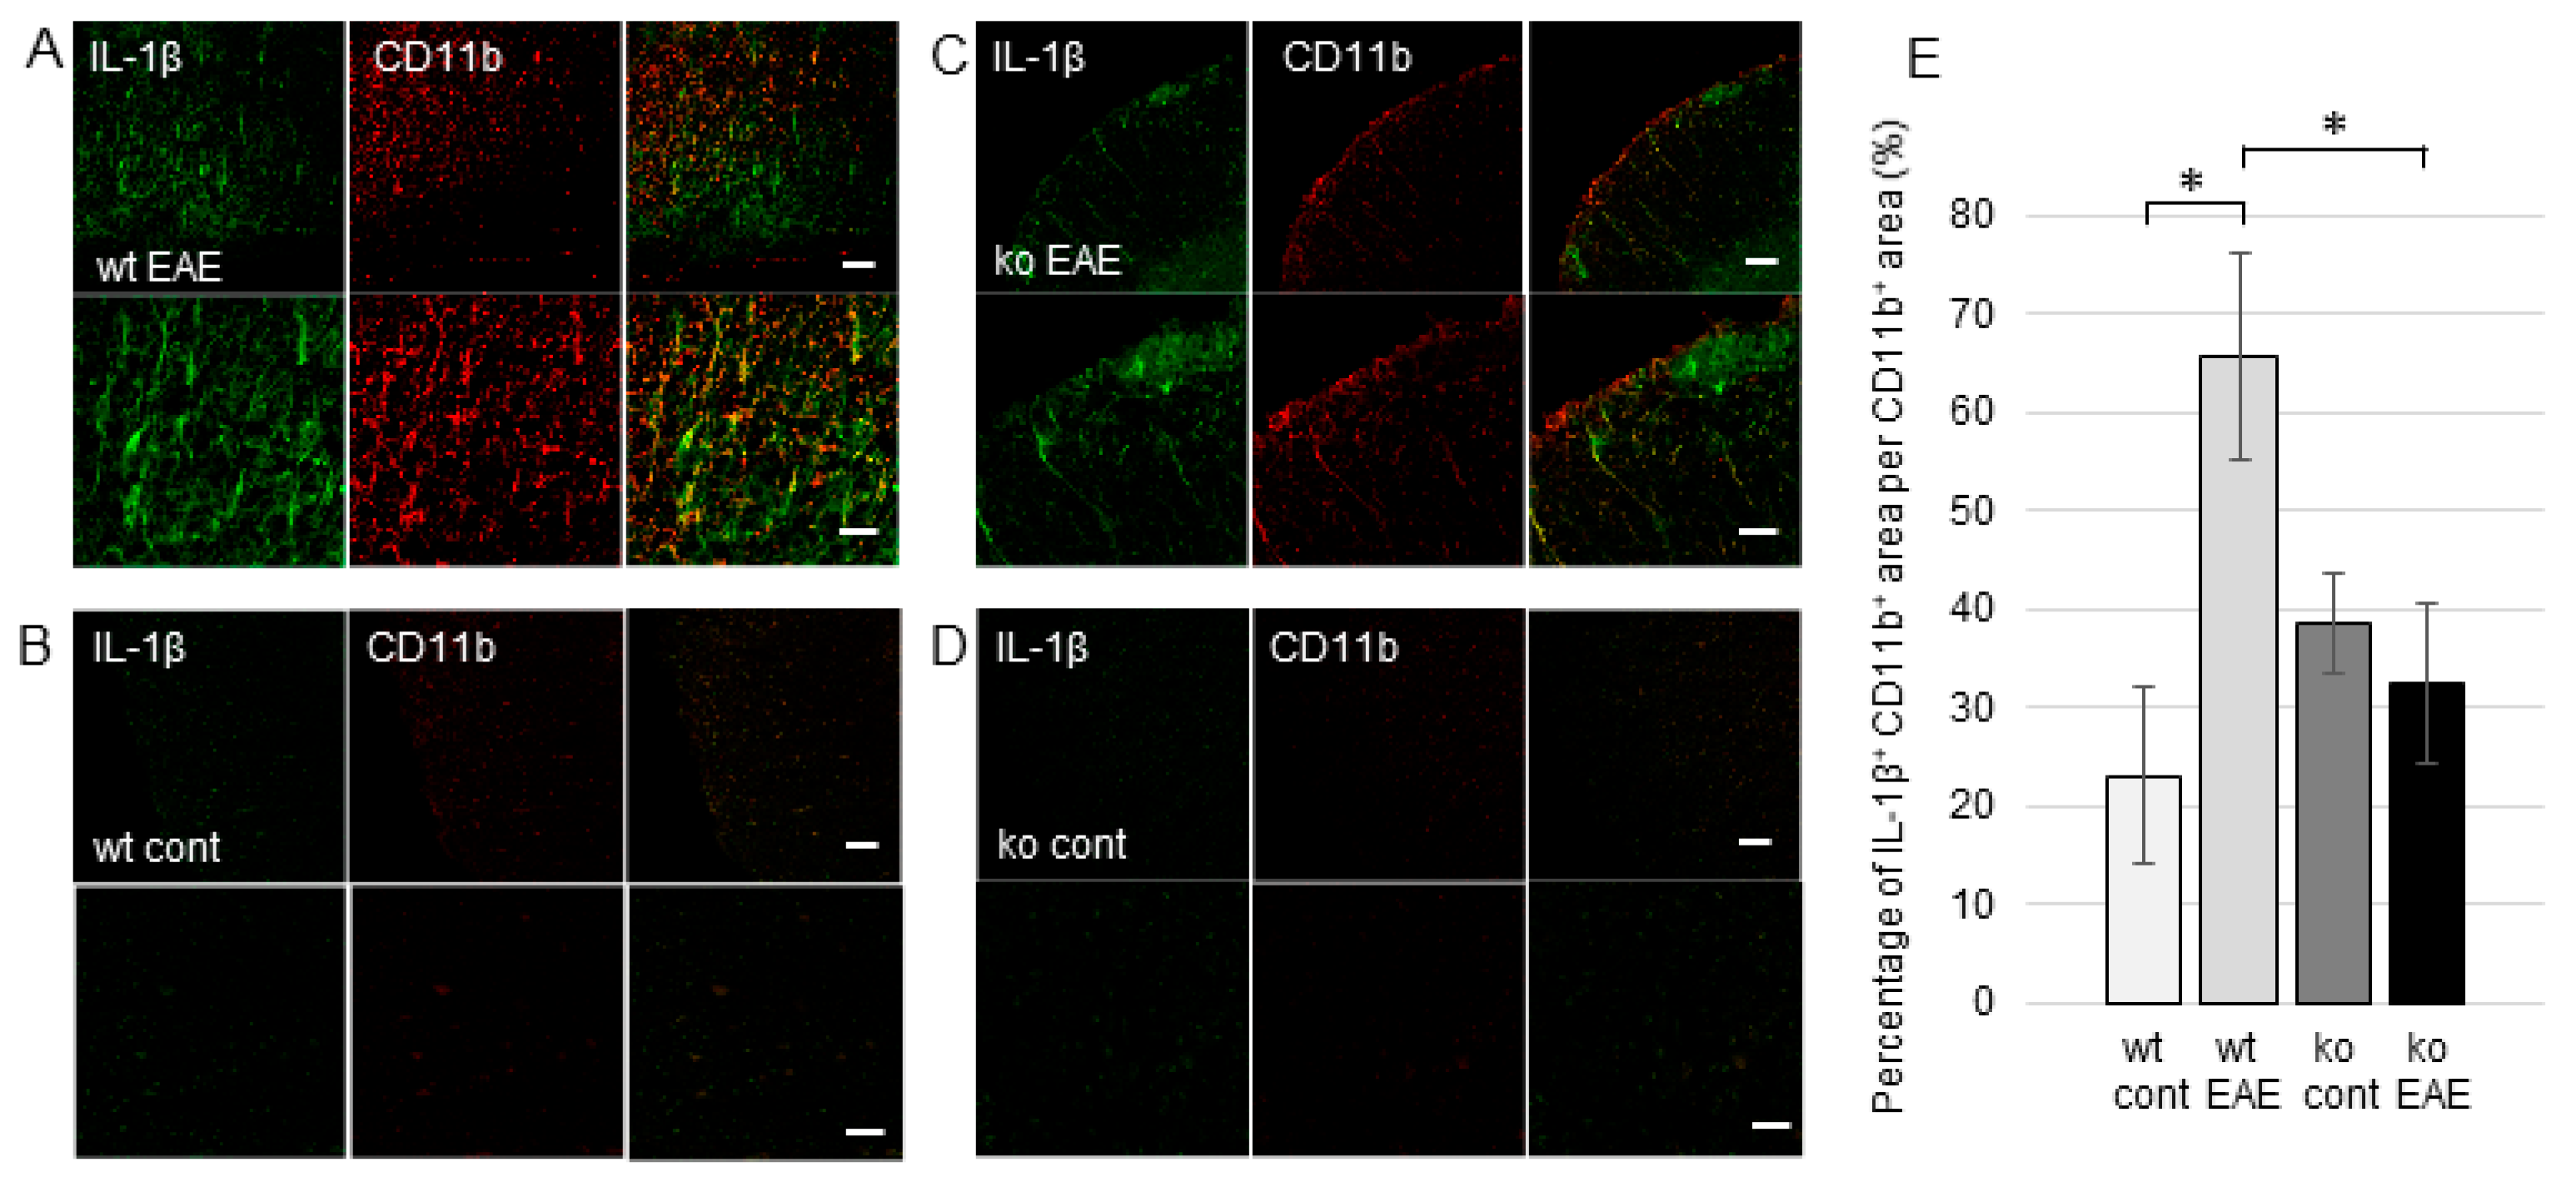
2.4. IL-1r1 Expression in CD4+ T Cells is Controlled by mPGES-1

There was no expression of IL-1r1 in control spinal cords regardless of the presence of mPGES-1 (Figure 6B,D). IL-1r1 staining was strong in the spinal cords of wt EAE mice (Figure 6A); however, it was rare in mPGES-1−/− EAE spinal cords (Figure 6C). Moreover, the percentage of the IL-1r1+ CD4+ area per CD4+ area was significantly higher in wt EAE mice (47.6 ± 7.4%) than in mPGES-1−/− EAE mice (27.3 ± 4.1%) (p = 0.0366, Figure 6E).

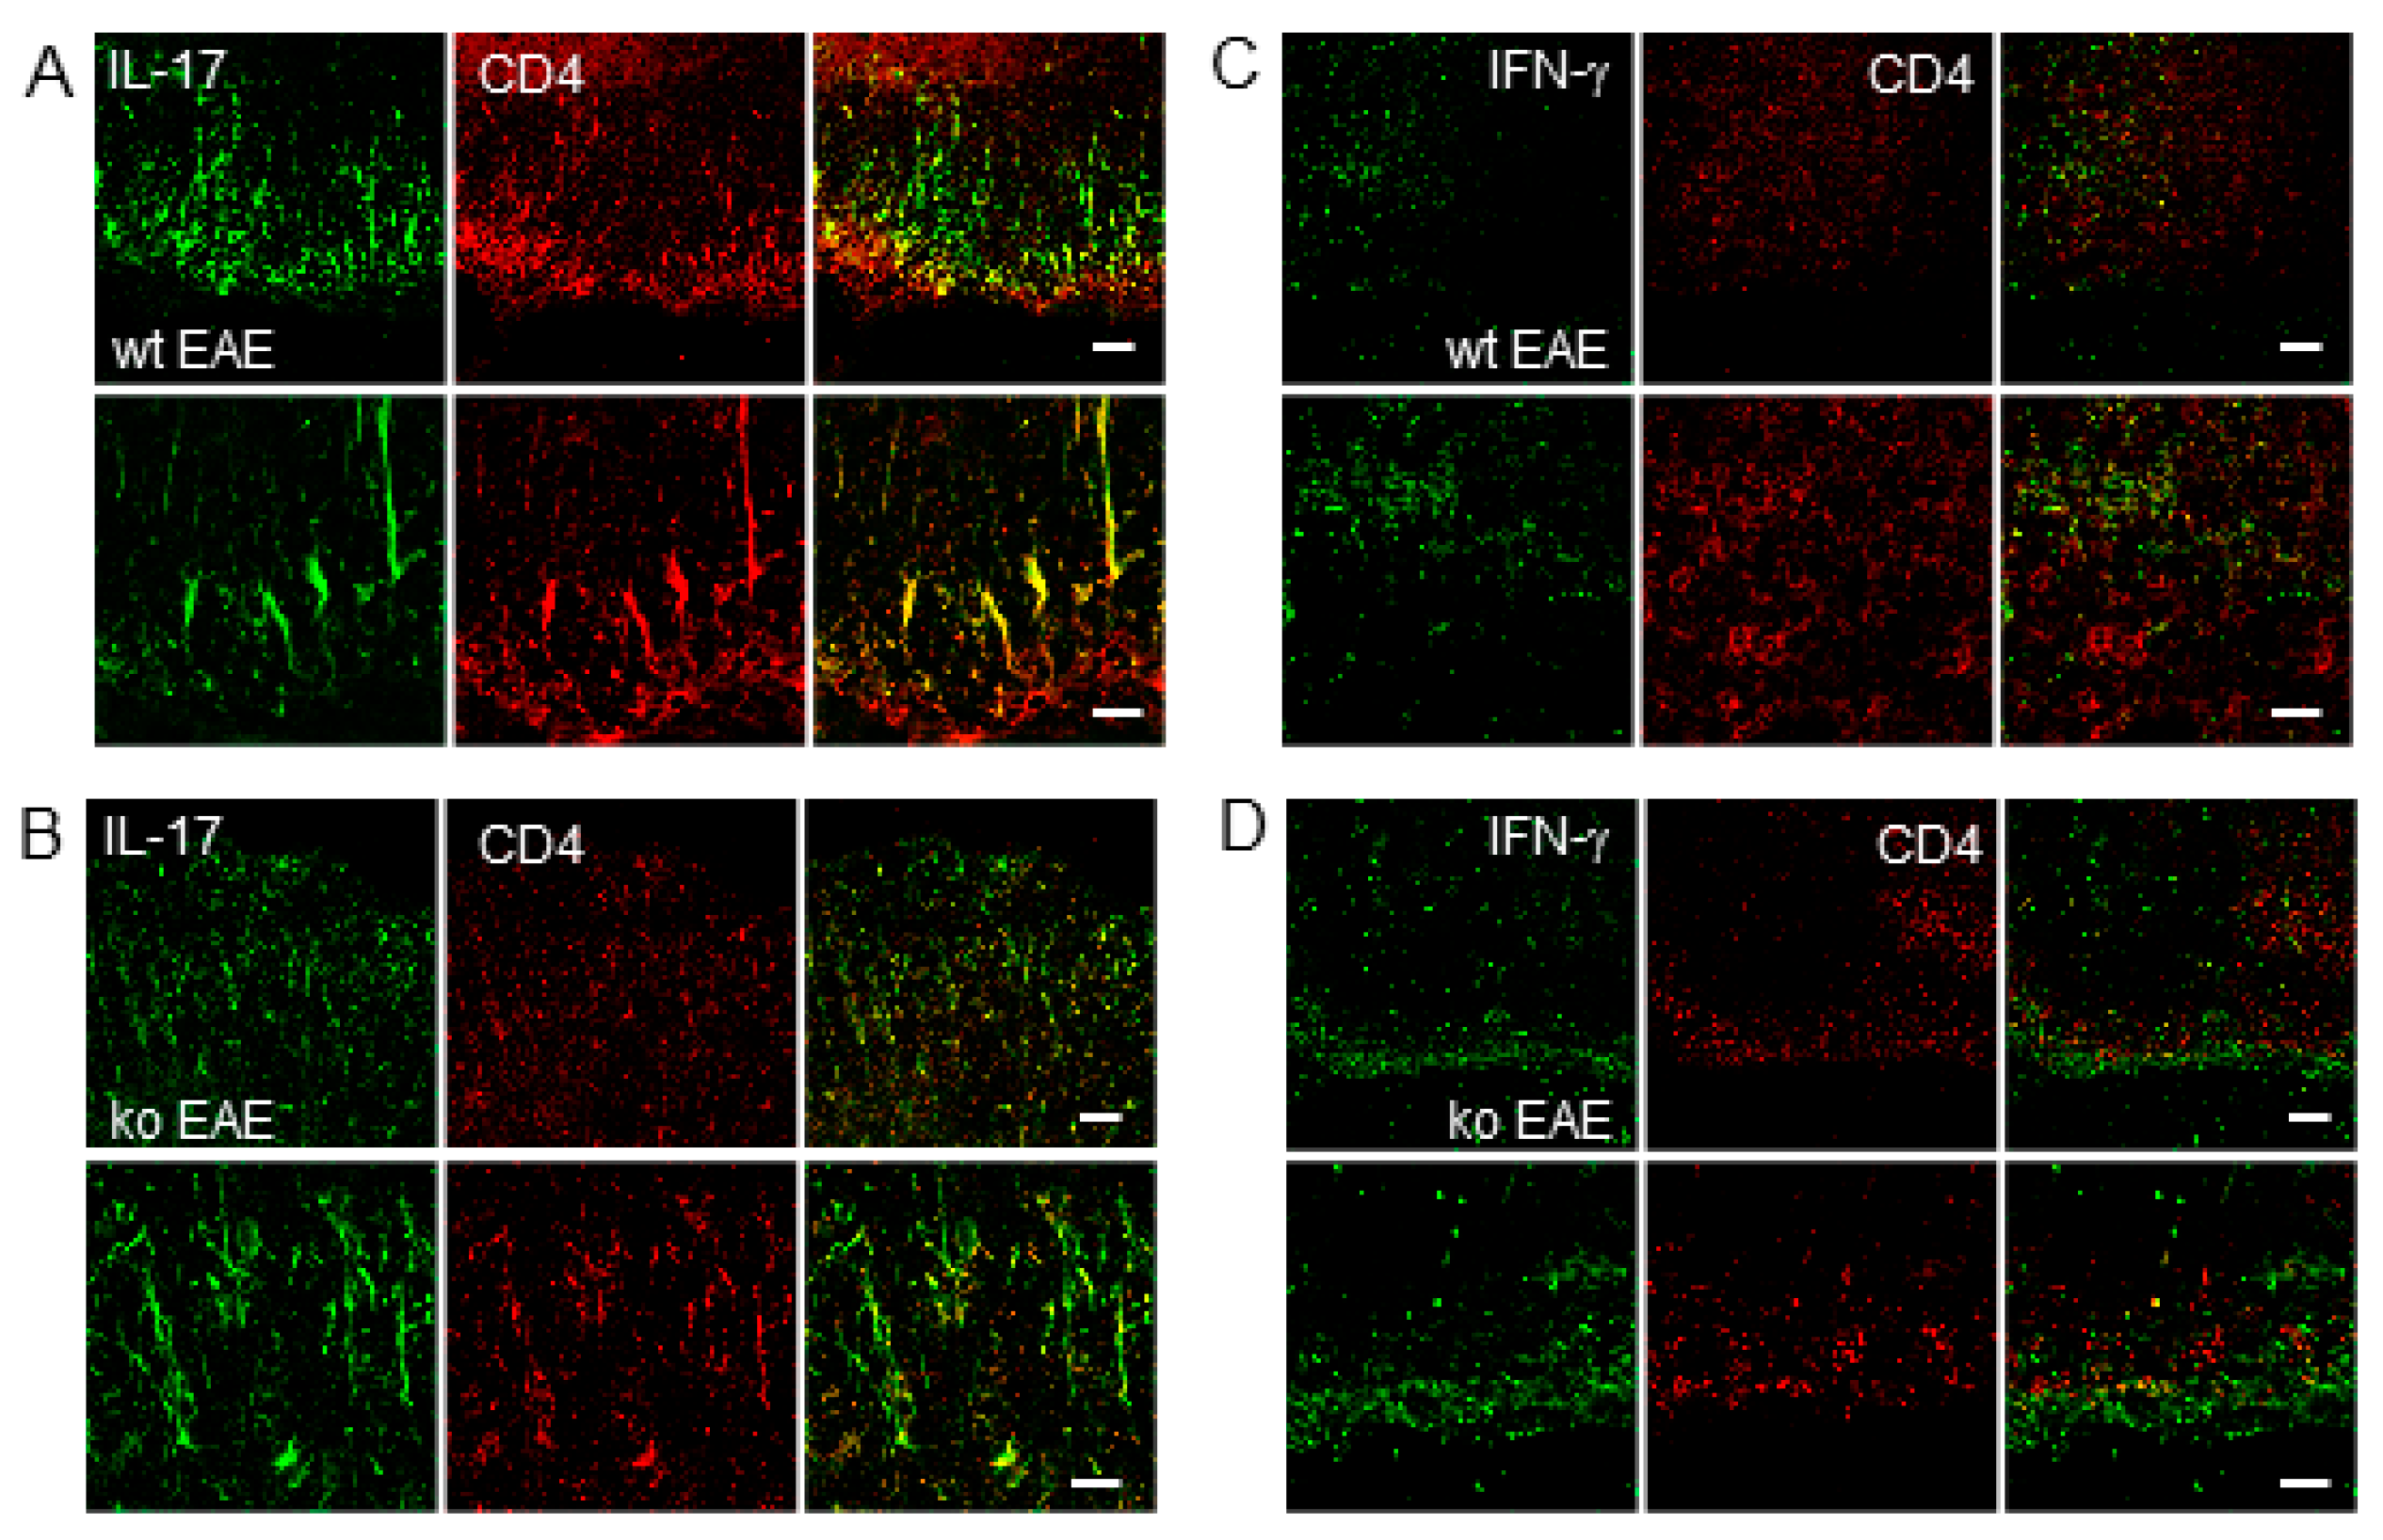
2.5. IL-17 Expression in CD4+ T Cells is Regulated by mPGES-1
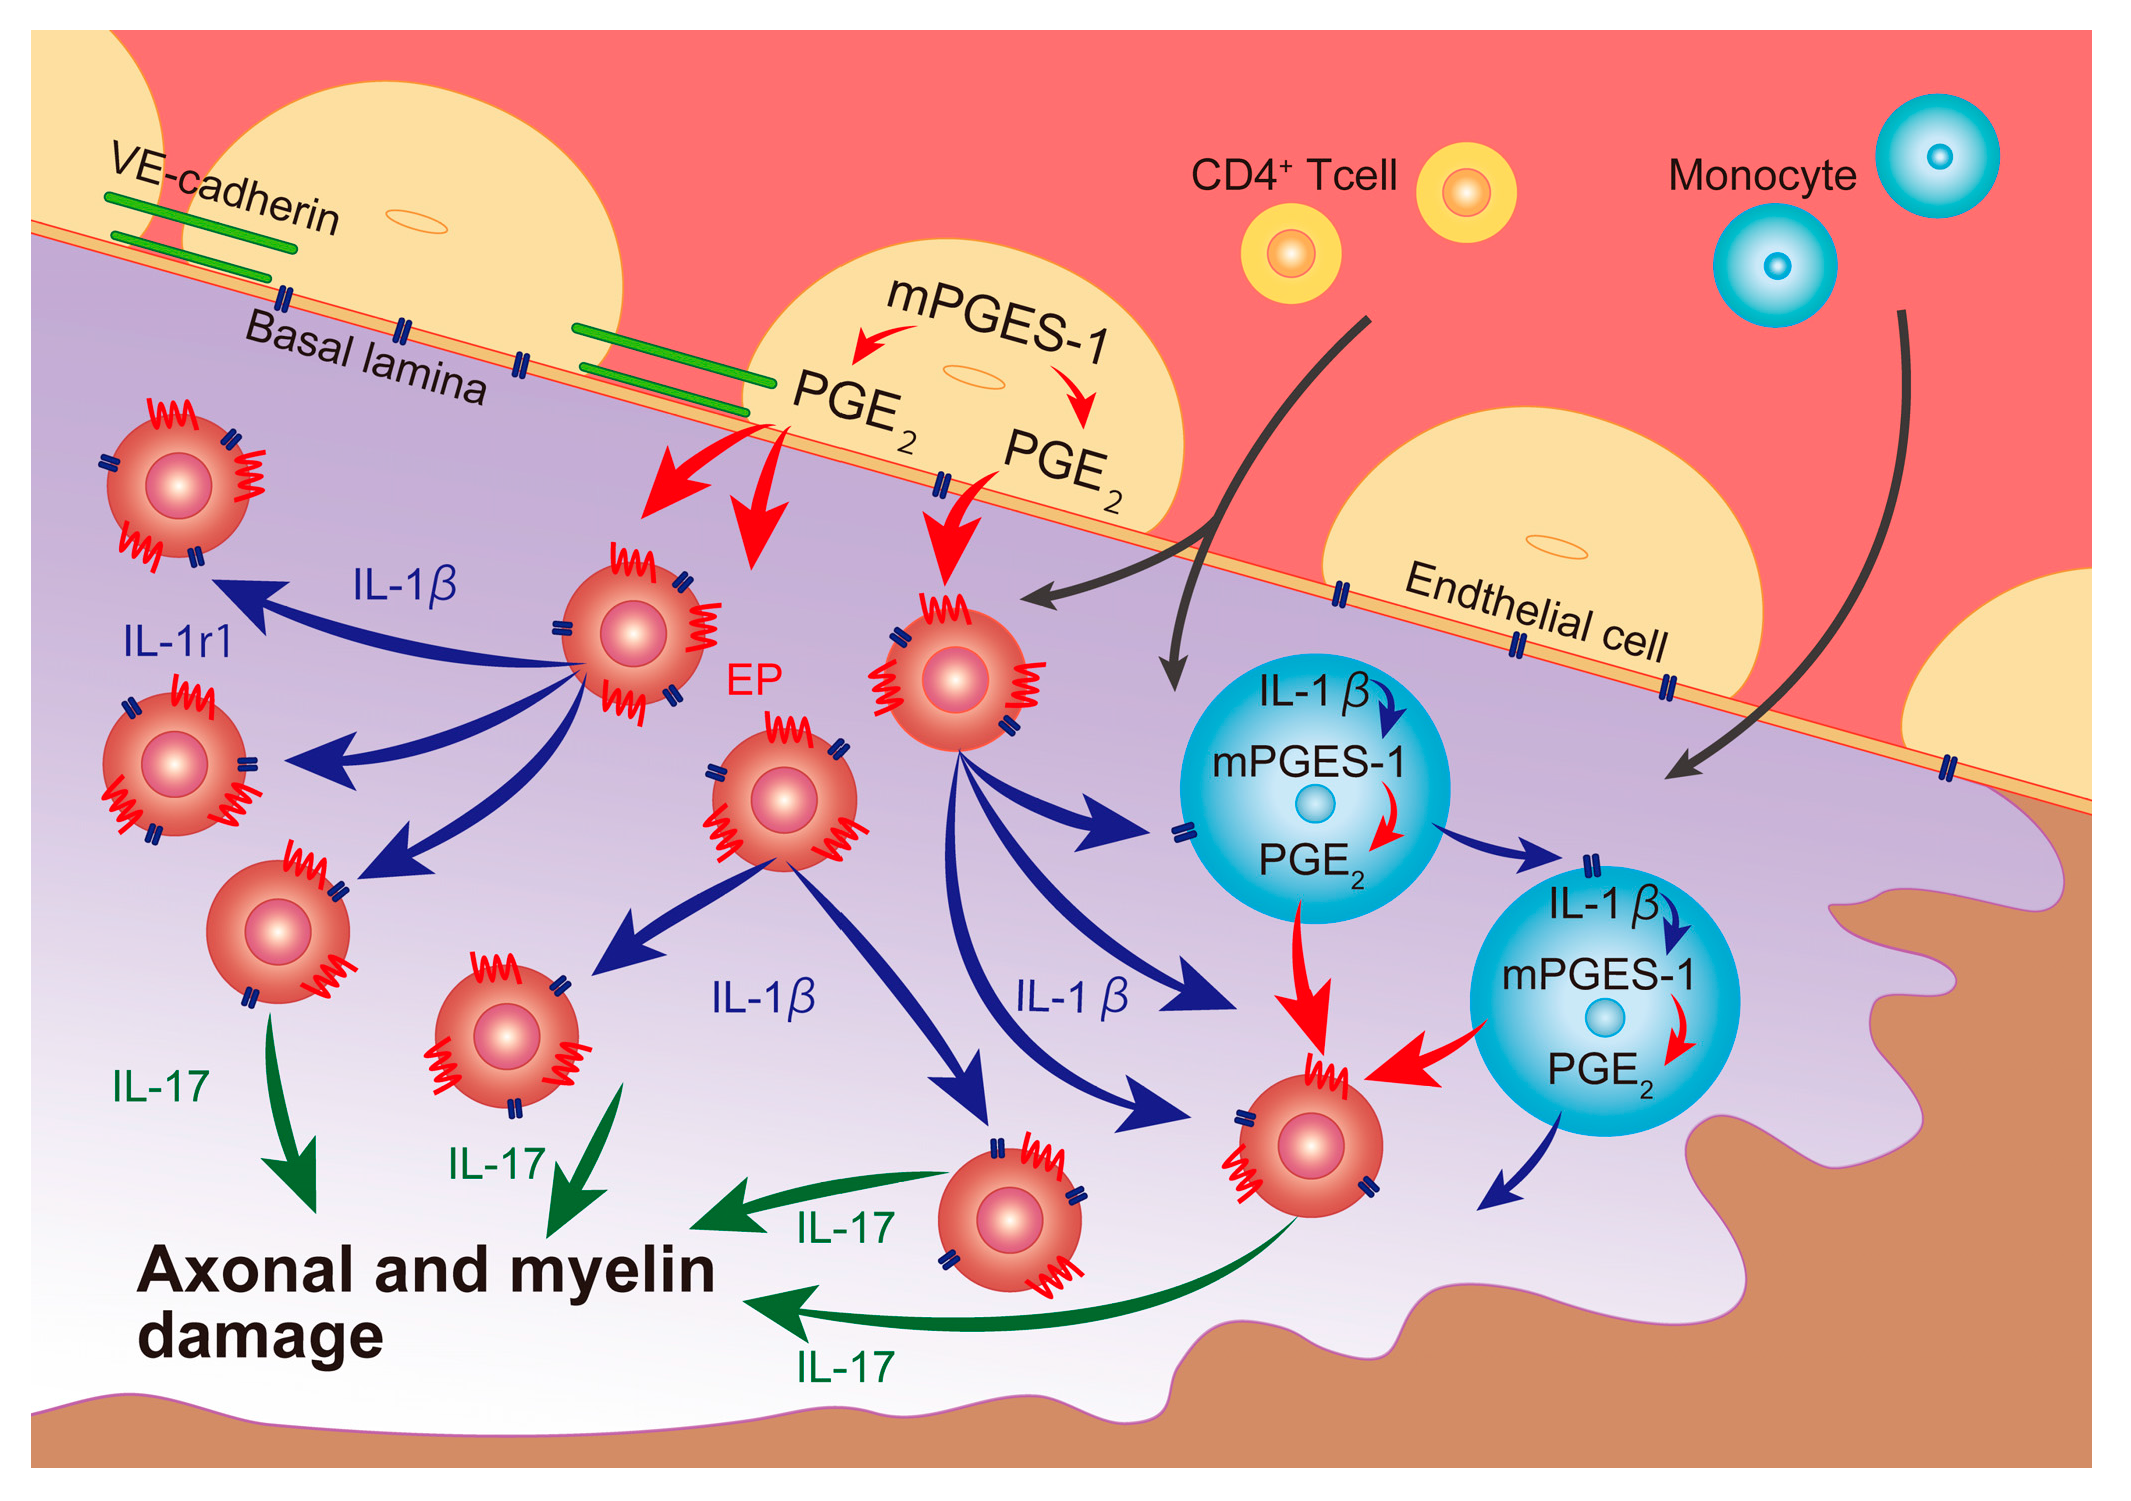
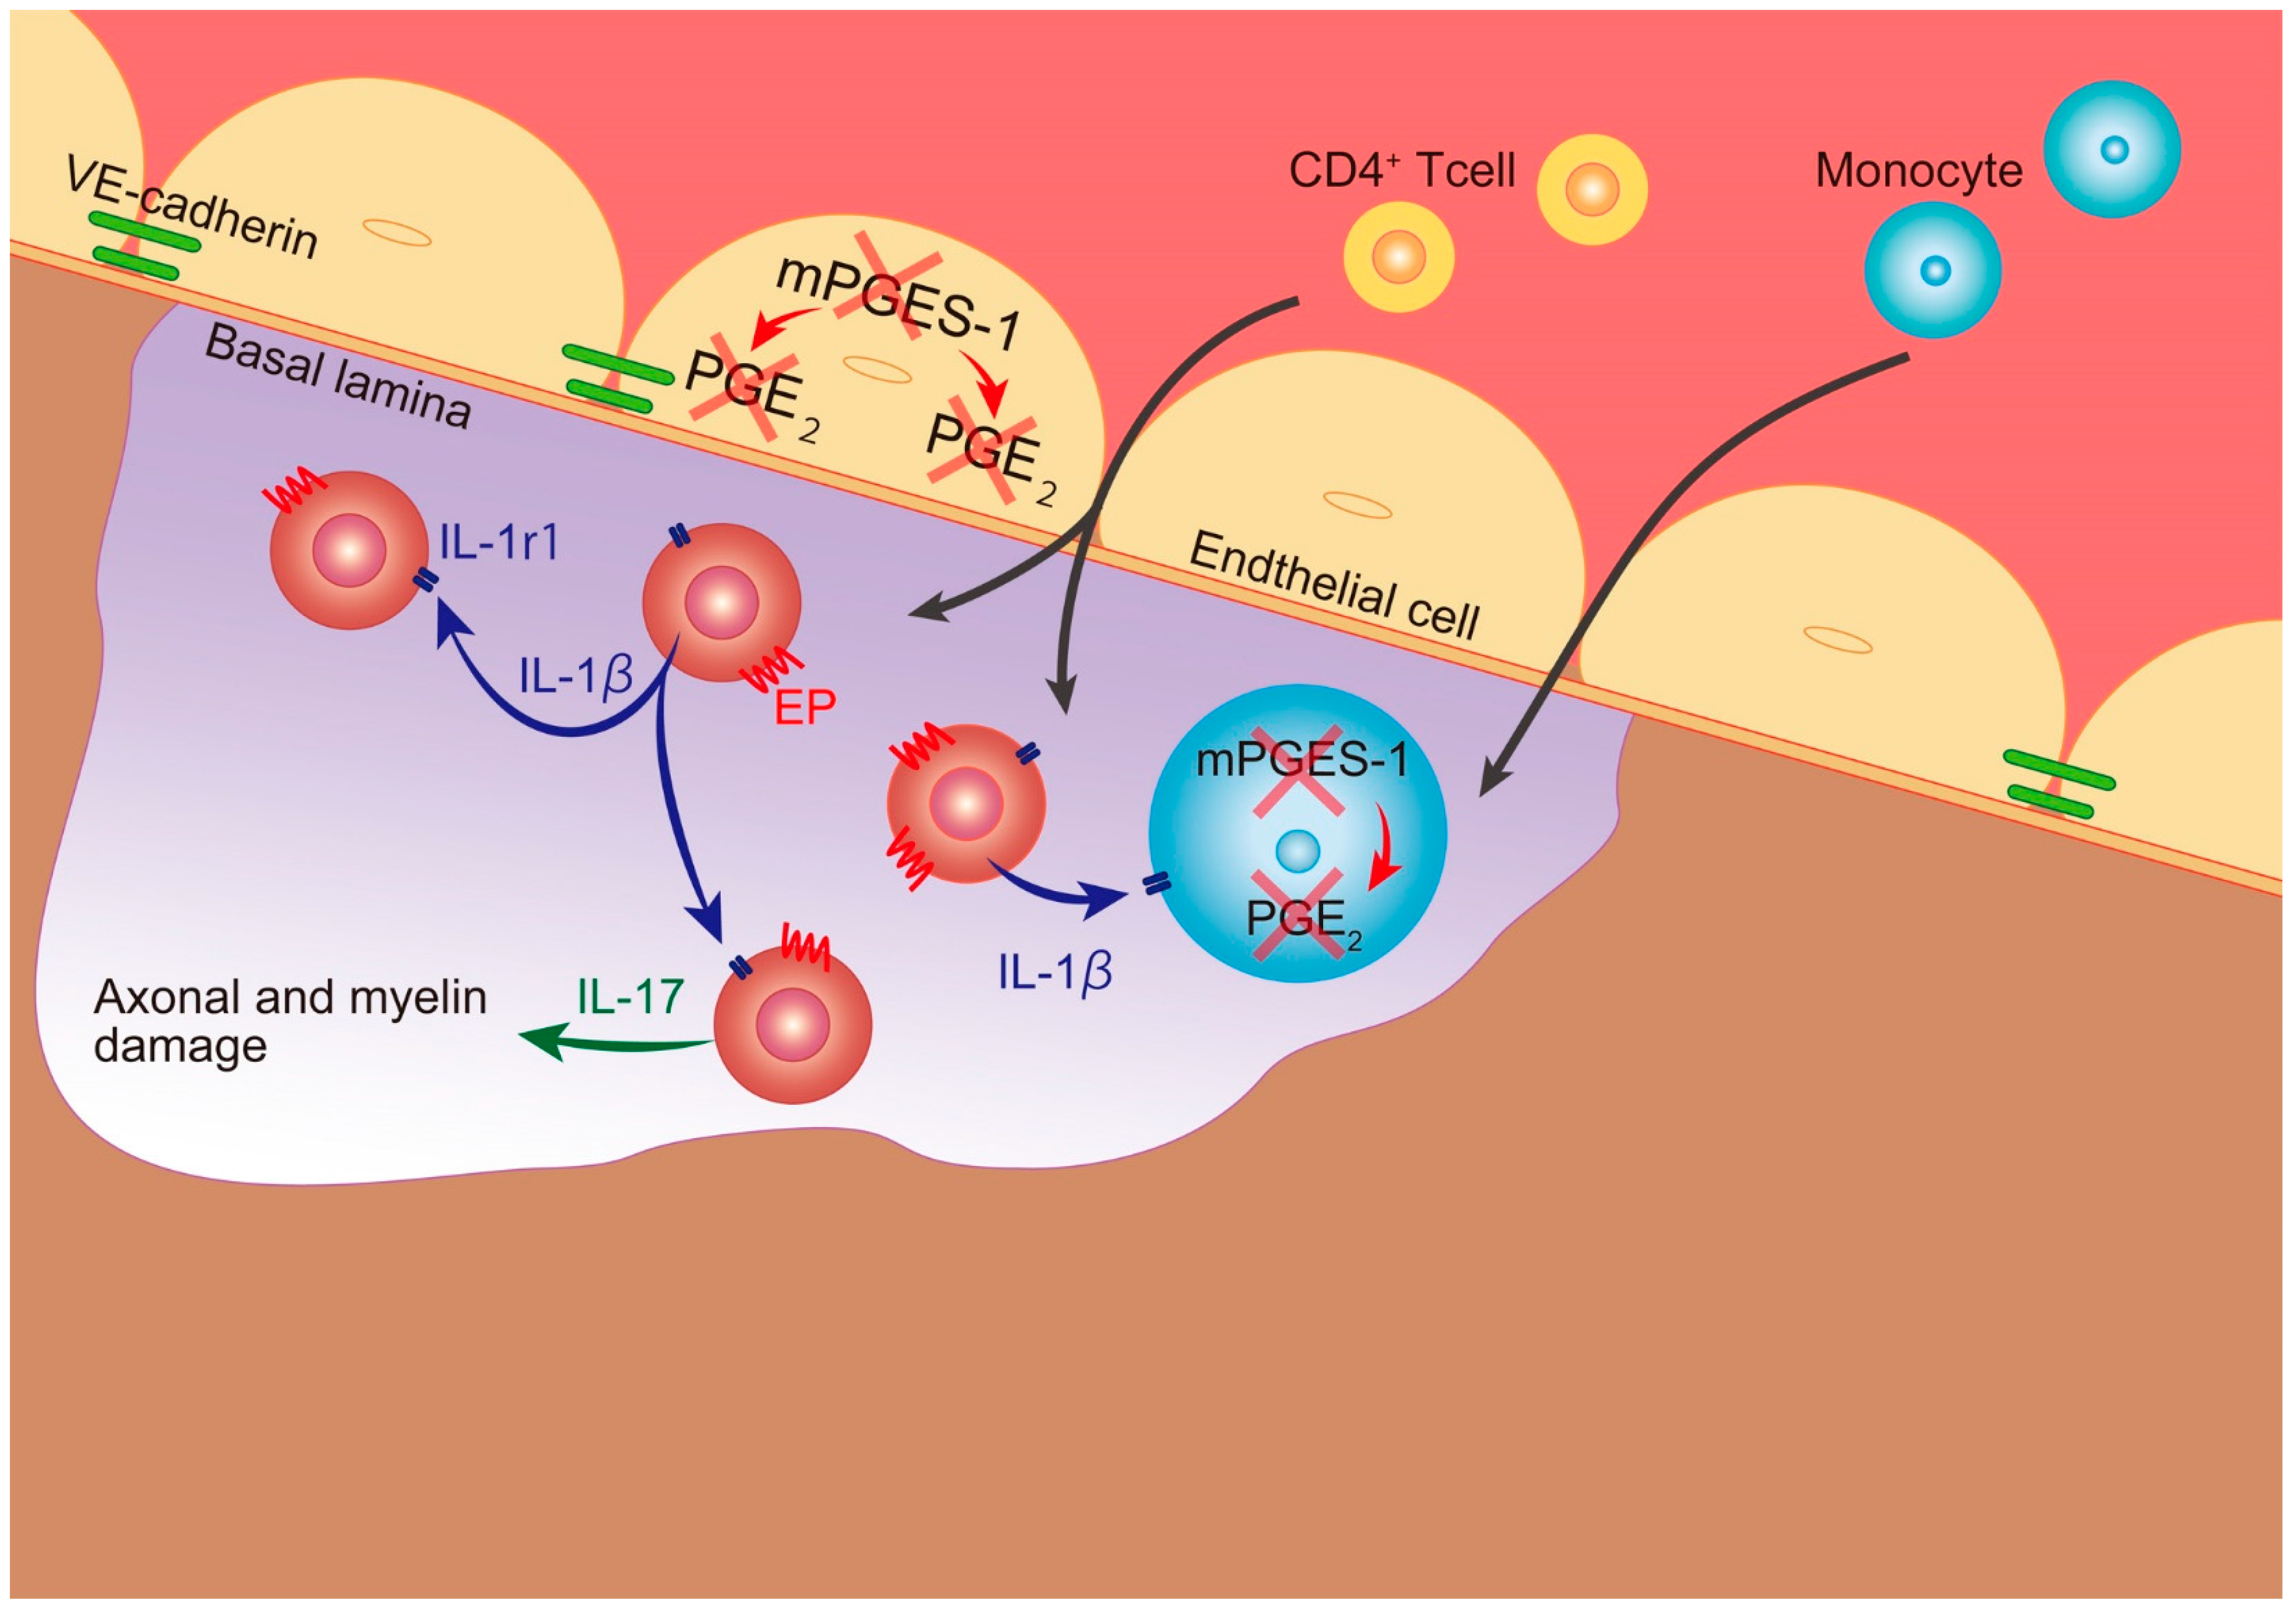
IL-17 was clearly expressed in activated CD4+ T cells with morphological changes in the spinal cords of wt EAE mice (Figure 7A), whereas the changes in T cells were limited and IL-17 staining was faint in mPGES-1−/− EAE spinal cords (Figure 7B). In contrast, interferon-γ (IFN-γ) staining was partially colocalized with CD4+ T cells in both wt and mPGES-1−/− EAE mice (Figure 7C,D).

3. Discussion

First, we discuss the role of PGE2, COX-2, and mPGES-1 in MS and EAE. In clinical research using leukocyte cultures from patients with definite MS, patients had higher baseline PGE expression than control subjects [23]. In addition, PGE2 expression is higher in peripheral blood monocytes from patients with chronic progressive MS [24], suggesting that PGE2 is related to MS development. PGE2 is sequentially synthesized from arachidonic acid by COX and PGES, and COX exists as two isoforms. COX-1 is constitutively active, while COX-2 is inducible. In MS patients, COX-2 is induced in chronic active lesions, specifically near damaged oligodendrocytes in macrophages and microglia [3]. COX-2 has also been reported to be localized to von-Willebrand factor-marked ECs in the spinal cord in EAE, especially 14 to 25 days after immunization [4], and it appears in CD11b+ cells 16 days after immunization in EAE [25].
Moreover, PGES has three isoforms: mPGES-1 [26], mPGES-2 [27], and cytosolic PGE2 synthase (cPGES) [28]. mPGES-2 and cPGES are constitutively expressed, while mPGES-1 is induced in macrophages or osteoblasts following proinflammatory stimulation and is functionally coupled with COX-2 [29]. In the brain, mPGES-1 is induced in vascular endothelial cells in fever [1] and KA-induced neuronal injury [2]. In EAE, mPGES-1 appears in F4/80+ or CD68+ macrophages in the spinal cord [11] and in CD31+ ECs and CD11+ macrophages and microglia in the spinal cord 19 days after immunization [12]. In the present study, we confirmed that mPGES-1 was expressed in CD31+ ECs (Figure 1A) and CD11+ macrophages and microglia at day 19 after immunization (Figure 1C) but not in CD4+ T cells (Figure 1E). In addition, the onset of symptoms occurred significantly later, and the EAE score at day 19 was significantly lower in mPGES-1−/− EAE mice compared to wt EAE mice (Figure 1G,H). The examination of EAE scores showed that mPGES-1−/− mice show significant impairment in the development of EAE for 26 days [11] or 35 days [12]. In the present study, the EAE score was only examined until day 19 (Figure S2); therefore, there was no significant difference in EAE scores between wt and mPGES-1−/− mice as shown by ANOVA. In our previous study, we monitored the EAE score for 28 days and found significant differences after day 19. Furthermore, mPGES-1−/− mice exhibited a decrease in the activation of microglia of the spinal cord related to neuropathic pain [30]. These findings suggest that inducible PGE2, synthesized by COX-2 and mPGES-1 in macrophages and microglia and VECs, stimulates pathological changes in the spinal cord in EAE and leads to EAE paralysis.
We next discuss the role of IL-1β in MS and EAE. In the clinic, significantly higher values of IL-1β have been detected in the cerebrospinal fluid and serum of MS patients [31]. Several studies have provided evidence that IL-1β plays a crucial role in EAE. First, the administration of recombinant IL-1RN to EAE rats resulted in a delay in the onset of the disease and reduced its severity [16]. In addition, a defective IL-1r1 gene in mice was associated with a complete resistance to EAE [17]. Recently, IL-1β was reported to be the main protagonist of EAE, whereas IL-1α is dispensable [32].
IL-1β is known to stimulate the induction of COX-2. Intraperitoneal injection of IL-1β induces the expression of COX-2 mRNA in VECs in the brain [33] and leads to the induction of COX-2 mRNA in cultured primary hippocampal neurons [34]. Moreover, the main inducer of central COX-2 upregulation in the spinal cord is IL-1β, which thus promotes the production of PGE2 and contributes to inflammatory pain hypersensitivity [35]. COX-2 inhibitors prevent the IL-1β-induced increase in PGE2 production in the brain [36], suggesting that IL-1β regulates PGE2 production through the synthesis of COX-2. In addition, cross-talk between tumor cells and microvascular ECs upregulate COX-2 and mPGES-1, which are both strongly inhibited by an IL-1-receptor antagonist [37]. Thus, IL-1β plays an important role in the induction of COX-2 and mPGES-1 to produce pathophysiological PGE2, which promotes inflammation. These data suggest that IL-1β may stimulate the induction of COX-2 and mPGES-1 in VECs or macrophages and microglia in the spinal cord in EAE. In contrast, there is no evidence that IL-1β is controlled by PGE2 in EAE spinal cords.
CD4+ T cells formed a perivascular cluster and infiltrated the parenchyma in the spinal cords of wt EAE mice but were scattered around the vessel in the spinal cords in mPGES-1−/− EAE mice (Figure 2A–D) [12]. Since there were no T cells in the spinal cords of normal control wt or mPGES-1−/− mice (Figure 2G,H), CD4+ T cells infiltrated the spinal cord through the disrupted blood–spinal barrier in EAE. The percentage of the CD4+-stained area in half of the spinal cord of wt EAE mice was significantly higher than that in mPGES-1−/− EAE mice (Figure 2E,F). Thus, mPGES-1 might regulate the infiltration or the activation of CD4+ T cells (or both) in EAE. If PGE2 directly activates CD4+ T cells, T cells must express the PGE2 receptor EP, and IL-1β expression may be further upregulated by PGE2 in wt EAE compared with mPGES-1−/− EAE mice.
We first examined EP expression in CD4+ T cells. There was a low EP expression in normal control wt mice or mPGES-1−/− mice (Figure S2). In contrast, EP receptors 1–4 were strongly stained and widely colocalized with CD4 in the spinal cords of wt EAE mice, but were weakly stained and only partially colocalized with CD4 in mPGES-1−/− EAE mice (Figure 3 and Figure S4). Because all four EP receptors were shown to be expressed in neurons and induced in VECs under conditions of hypoxic–ischemic encephalopathy [38], EP receptors are known to be inducible in pathological conditions. In previous studies, T cells were regulated by PGE2, and this effect was mediated by EP2 or EP4 [39,40,41]. Moreover, IL-1β upregulated EP2 and EP4 in primary cultured hippocampal neurons [42]. Furthermore, we found that EP+ CD4+ T cells were almost entirely colocalized with IL-1β in wt EAE mice, but they rarely expressed IL-1β in the mPGES-1−/− EAE mice in the current study (Figure 3 and Figure S3). CD4+ T cells might be stimulated by PGE2 produced by mPGES-1, through EP receptors, to increase IL-1β production in EAE; however, we could not determine which specific EP receptor was crucial for producing IL-1β in CD4+ T cells using IHC because individual T cells may express multiple EP receptor types.
Second, we investigated IL-1β expression in CD4+ T cells in wt EAE and mPGES-1−/− EAE mice. There was no co-expression of IL-1β and CD4 in normal control wt mice or mPGES-1−/− mice (Figure 4B,D). In contrast, we found IL-1β expression in almost all CD4+ T cells in wt EAE (Figure 4A) mice, but in only a few CD4+ T cells in mPGES-1−/− EAE mice (Figure 4C). The percentage of the IL-1β+ CD4+ area per CD4+ area in the spinal cords of wt EAE mice was significantly higher than that in mPGES-1−/− EAE mice (Figure 4E). During in vitro Th17 differentiation, pro-IL-1β expression is strongly induced, suggesting that CD4+ T cells are a major cellular source of IL-1β during EAE pathogenesis [43]. Previous reports have shown that IL-1β is highly expressed in infiltrating macrophages [44], and IL-1β mRNA is induced in peritoneal leukocytes right after the initial EAE induction [45]. Moreover, activated macrophages are considered to be the predominant source of IL-1β in the brain [46]. We also observed IL-1β expression in CD11b+ macrophages in spinal cords (Figure 5). In wt EAE mice, IL-1β production in CD11+ macrophages and microglia was significantly increased compared with that of mPGES-1−/− EAE mice (Figure 5). However, we recently determined that the contribution of macrophages to the total production of IL-1β is minor in EAE pathogenesis [32,44]. The IL-1β released from macrophages and microglia might induce mPGES-1 in other macrophages and microglia and play roles in the inflammatory loop of the chronic phase of EAE [47]. In addition, the release of IL-1β from astrocytes might regulate the permeability of the blood–spinal barrier and the infiltration of immune cells into the spinal cord [48].
We next studied the expression of IL-1r1 in CD4+ T cells in the spinal cord. There was no co-expression of IL-1r1 and CD4 in normal control wt mice or mPGES-1−/− mice (Figure 6B,D). In contrast, IL-1r1 was expressed in almost all CD4+ T cells in wt EAE mice (Figure 6A). Since IL-1r1 was detected on Th17 but not on TH1 cells in EAE mice [43], and because early Th17 differentiation is regulated by IL-1β signaling through IL-1r1 [21,22], many of the CD4+ T cells had the same properties as Th17 cells in the wt EAE mice used in the present study. Interestingly, IL-1r1 was rarely expressed in CD4+ T cells in mPGES-1−/− EAE mice (Figure 6C). The percentage of the IL-1r1+CD4+ area per CD4+ area of the spinal cord in wt EAE was significantly higher than that in mPGES-1−/− EAE (Figure 6E). This result suggests that mPGES-1 stimulates IL-1r1 expression in CD4+ T cells and promotes their differentiation to Th17 by IL-1β. Therefore, mPGES-1 modulates the IL-1β-dependent autocrine regulation of CD4+ T cells with TH17 properties.
Finally, we discuss the discrepancy between the appearance of IL-1β and IL-1r1 in CD4+ T cells. In this study, we investigated their expression using spinal cords obtained 19 days after immunization. We previously found a significant difference between wt EAE and mPGES-1−/− EAE in their inflammation and demyelination at 19 and 35 days after immunization, however there was a remarkable histological change at day 35 [12]. Therefore, the balance of IL-1β and IL-1r1 production may be altered during EAE development. Moreover, IL-1β is known to regulate blood–brain barrier (BBB) permeability [49,50], and IL-1r1 signaling controls chemokine CXCL12 expression at the BBB, affecting the severity of EAE [51]. Thus, endothelial IL-1r1 is an important receptor in EAE pathology [32,52]. Furthermore, IL-1r1 is essential for the efficient activation of microglia in response to brain injury [53]. Therefore, IL-1β produced in CD4+ T cells might affect not only CD4+ T cells but also ECs or macrophages and microglia in the inflammatory region.
In experiments to investigate the production of IL-17 or IFN-γ in CD4+ T cells in the EAE spinal cord, IL-17 staining was clearly colocalized with many morphologically changed CD4+ T cells in wt EAE mice (Figure 7A); however, the change in T cell morphology was limited, and IL-17 staining was faint in mPGES-1−/− EAE mice (Figure 7B). In contrast, there were few CD4+ T cells that co-expressed IFN-γ with CD4+ T cells in either wt (Figure 7C) or mPGES-1−/− EAE mice (Figure 7D). The analysis of Th1 and Th17 cells in culture supernatants showed that IFN-γ expression is higher in Th1 cells, and IL-17 expression is higher in Th17 cells [54]. Our results suggest that mPGES-1 facilitates the differentiation of CD4+ T cells toTh17 cells. The CD4+ T cell characteristics are altered according to the timing of the secretion of IL-17, IFN-γ, or both, after immunization in the spinal cord in EAE. Initially, the number of CD4+ IFN-γ+ T cells is increased, as is that of CD4+ IL-17+ T cells, though more gradually [55]. When EAE mice are treated with anti-IL-17 antibodies before the increase in CD4+ IL-17+ T cells, the EAE incidence and EAE score are reduced, suggesting that CD4+ T cells regulate tissue inflammation by producing IL-17 [56]. In our previous study, histopathological examination revealed significant differences between wt and mPGES-1−/− mice in the inflammation and demyelination of their spinal cords at days 19 and 35 after EAE immunization [12]. We confirmed this result at day 19 in the present study (data not shown). PGE2 is reportedly related to Th17 differentiation. PGE2 and IL-23 plus IL-1β differentially regulate the Th1/Th17 immune response of CD4+ T cells via the EP2 and EP4 receptors [18,19] and enhance IL-17 expression through EP4 [20]. The main source of PGE2 might be ECs and macrophages, and PGE2 might be primarily synthesized by mPGES-1. We did not detect CD19+ B cells in the inflammatory regions of EAE spinal cords. In rat and marmoset models of MOG-induced EAE, demyelination is antibody-dependent and reproduces the immunopathology seen in many MS patients, but, in mice, inflammation of the spinal cord can result in demyelination in the absence of a MOG-specific B cell response [57]. In addition, EAE development in B cell-deficient mice was shown to be the same as in wt mice [58]. Therefore, B cells may not be necessary for primary demyelination in MOG-induced EAE in mice.
In this study, we demonstrated that the invasion of CD4+ T cells was significantly increased by mPGES-1-derived PGE2 through the induction of EP and IL-1r1 receptors on CD4+ T cells and the potentiation of IL-1β production. IL-β1 then exerted an autocrine signaling through IL-1r1 (Scheme 1). These intercellular interactions affected the production of IL-17, which ultimately aggravated inflammation and demyelination (Scheme 1). This signaling pathway is regulated by mPGES-1; therefore, mPGES-1-deficient mice showed a suppression of CD4+ T cell invasion with a decrease in IL-1β production, EP and IL-1r1 receptor expression, and IL-17 production (Scheme 2).

4. Materials and Methods

4.1. Mice

Seven female mPGES-1−/− mice, 8 weeks of age, and seven female age-matched C57BL/6J mice were used in this study. The mPGES-1−/− mice were generated as previously described [59]. We used untreated female wt mice and mPGES-1−/− mice as a normal control. Seven mice were included in each group. The mice were housed four or five per cage in a room maintained at 24 ± 2 °C in a standard 12 h light-dark cycle and had access to standard chow and water ad libitum. All animal experiments were approved by the Ethical Review Committee of Animal Experiments and Gene Recombination Experiment Safety Committee of Tokyo Women’s Medical University (14-91/14-44, 29 March 2014).

4.2. Induction and Assessment of EAE

Mice were immunized by subcutaneous injection with 250 μg myelin oligodendrocyte glycoprotein35–55 peptide (MOG35–55, MEVGWYRSPFSRVVHLYRNGK, purity > 95%, Operon Technology, Tokyo, Japan) in complete Freund’s adjuvant (Difco, Detroit, MI, USA). The mice also received two intraperitoneal injections of 500 ng of pertussis toxin each (Seikagaku Corporation, Tokyo, Japan), once on the day of immunization and again two days later. The mice were observed daily, and we assessed the progression of EAE using the following scoring system: (0) no detectable signs of paralysis; (1) completely limp tail; (2) loss of the righting reflex; (3) partial hind limb paralysis; (4) complete hind limb paralysis; (5) total paralysis of all four limbs; and (6) death. Mice that were scored as 5 for two consecutive days were immediately euthanized.

4.3. Immunohistochemistry

For immunohistochemical detection, the mice were sacrificed under deep anesthesia induced by an intraperitoneal injection of pentobarbital (120 mg/kg) 19 days after immunization. The spinal cords were quickly removed and frozen with a dry ice/acetone mixture. Sections were cut at a thickness of 10 μm and left to air dry at room temperature for 30 min, after which they were rinsed with PBS. Next, the sections were treated with 10% normal goat serum for 5 h and then incubated with antibodies. The sections were incubated with anti-mPGES-1 antibodies (Cayman Chemical, Ann Arbor, MI, USA, #160140, 1:250 dilution) overnight and then with anti-EP1 (Bioss, Woburn, MA, USA, bs-6316R, 1:100), anti-EP2 (Bioss, Woburn, MA, USA, bs-4196R, 1:100), anti-EP3 (Santa Cruz Biotechnology, Inc., Dallas, TX, USA, sc-20676, 1:100), anti-EP4 (Bioss, Woburn, MA, USA, bs-8538R, 1:100), anti-IL-1β (Santa Cruz Biotechnology, Inc., Dallas, TX, USA, sc-15325, 1:100, Cloud-Clone, Houston, TX, USA, MAA563Mu21, 1:25), or anti-IL-1r1 (Santa Cruz Biotechnology, Inc., Dallas, TX, USA, sc-689, 1:100) antibodies for two nights at 4 °C with slow shaking. To visualize the ECs, macrophages and microglia, CD4-positive T lymphocytes, and CD19-positive B lymphocytes, some of the sections were double stained with anti-CD31 (BD Bioscience, La Jolla, CA, USA, #550274, 1:20), anti-CD11b (BD Bioscience, La Jolla, CA, USA, #550282, 1:25), anti-CD4 (BD Bioscience, La Jolla, CA, USA, #550278, 1:50), or anti-CD19 (Thermo Fisher, Waltham, MA, USA, #14-0194-82, 1:100; Bioss, Woburn, MA, USA, bs-0079R, 1:100) antibodies. After removal of the primary antibody, the sections were incubated with FITC-labeled anti-rabbit IgG (1:150) to label mPGES-1, EP1–4, IL-1β, and IL-1r1, or with Cy3-labeled anti-rat IgG (1:150) to label CD4, CD31, CD11b, or CD19, for 5 h at room temperature with slow shaking. In addition, we examined the production of cytokines, such as IL-17 or interferon-γ (IFN-γ), in CD4-positive T lymphocytes. The spinal cord sections were treated with 10% normal donkey serum for 5 h and then incubated with anti-CD4 antibodies (Thermo Fisher, Waltham, MA, USA, #AF554, 1:25) and either anti-IL-17 (Thermo Fisher, Waltham, MA, USA, USA, #17-7177-81, 1:100) or anti-IFN-γ (Thermo Fisher, Waltham, MA, USA, #MM700, 1:100) antibodies 3 overnight at 4 °C with slow shaking. After removal of the primary antibody, the sections were incubated with FITC-labeled anti-rat IgG (1:150) to label IL-17 and IFN-γ, or with Cy3-labeled anti-goat IgG (1:150) to label CD4, for 5 h at room temperature with slow shaking. Fluorescent images were obtained using a confocal microscope (Carl Zeiss LSM510 and LSM710, Oberkochen, Germany).

4.4. Image Analysis

To analyze the fluorescent images, we measured the CD4-stained area in the inflammatory half of the spinal cord using Carl Zeiss software ZEN2.3, and then calculated the ratio of the CD4-stained area to the total half-spine area. In addition, we measured the IL-1β- or IL-1r1-stained area co-localized with CD4 in each experiment and calculated the ratio of the costained area to the CD4-stained area using the colocalization function of the Carl Zeiss software AIM (Carl Zeiss LSM510 and LSM710, Oberkochen, Germany).

4.5. Statistical Analysis

The data are presented as the means ± standard error (s.e.). The statistical analysis was performed using independent Student’s t-tests with assumption of equal variance, and significance was determined at a p-value < 0.05.

5. Conclusions

We determined that PGE2, synthesized by mPGES-1 in ECs and macrophages and microglia, facilitates an intercellular interaction between CD4+ T cells by regulating IL-1β autocrine function in EAE development.

Supplementary Materials

Supplementary materials can be found at www.mdpi.com/1422-0067/18/12/2758/s1.

Acknowledgments

This work was supported by KAKENHI (17K10064). This study was also supported by Saori Takeuchi from the technical staff of the Medical Research Institute, Tokyo Women’s Medical University.

Author Contributions

Takako Takemiya, Chisen Takeuchi, and Marumi Kawakami made substantial contributions to the design, acquisition, analysis, and interpretation of the experimental work, and Takako Takemiya wrote the manuscript.

Conflicts of Interest

The authors declare that there are no conflicts of interest regarding the publication of this paper.

Abbreviations

PGE2Prostaglandin E2
COX-2Cyclooxygenase-2
PGESPGE2 synthase
mPGES-1Microsomal prostaglandin synthetase-1
VECsVascular endothelial cells
KAKainic acid
MSMultiple sclerosis
EAEExperimental allergic encephalomyelitis
MOG35–55Oligodendrocyte glycoprotein35–55 peptide
mPGES-1−/−Microsomal prostaglandin synthetase-1-deficient
IL-1βInterleukin-1β
IL-1RNInterleukin-1 receptor antagonist
IL-1r1Interleukin-1 receptor 1
IL-17Interleukin-17
Th17Interleukin-17-producing helper T cell
Th1Type 1 helper T cell
CD4+ T cellsCD4-positive T cells
IHCImmunohistochemistry
wtWild-type
IFN-γInterferon-γ
cPGESCytosolic PGE2 synthase
BBBBlood-brain barrier

References

  1. Yamagata, K.; Matsumura, K.; Inoue, W.; Shiraki, T.; Suzuki, K.; Yasuda, S.; Sugiura, H.; Cao, C.; Watanabe, Y.; Kobayashi, S. Coexpression of microsomal-type prostaglandin E synthase with cyclooxygenase-2 in brain endothelial cells of rats during endotoxin-induced fever. J. Neurosci. 2001, 21, 2669–2677. [Google Scholar] [PubMed]
  2. Takemiya, T.; Matsumura, K.; Sugiura, H.; Maehara, M.; Yasuda, S.; Uematsu, S.; Akira, S.; Yamagata, K. Endothelial microsomal prostaglandin E synthase-1 exacerbates neuronal loss induced by kainate. J. Neurosci. Res. 2010, 88, 381–390. [Google Scholar] [CrossRef] [PubMed]
  3. Rose, J.W.; Hill, K.E.; Watt, H.E.; Carlson, N.G. Inflammatory cell expression of cyclooxygenase-2 in the multiple sclerosis lesion. J. Neuroimmunol. 2004, 149, 40–49. [Google Scholar] [CrossRef] [PubMed]
  4. Deininger, M.H.; Schluesener, H.J. Cyclooxygenases-1 and -2 are differentially localized to microglia and endothelium in rat EAE and glioma. J. Neuroimmunol. 1999, 95, 202–208. [Google Scholar] [CrossRef]
  5. Mendel, I.; Kerlero de Rosbo, N.; Ben-Nun, A. A myelin oligodendrocyte glycoprotein peptide induces typical chronic experimental autoimmune encephalomyelitis in H-2b mice: Fine specificity and T cell receptor Vβ expression of encephalitogenic T cells. Eur. J. Immunol. 1995, 25, 1951–1959. [Google Scholar] [CrossRef] [PubMed]
  6. Kuerten, S.; Kostova-Bales, D.A.; Frenzel, L.P.; Tigno, J.T.; Tary-Lehmann, M.; Angelov, D.N.; Lehmann, P.V. MP4- and MOG:35–55-induced EAE in C57BL/6 mice differentially targets brain, spinal cord and cerebellum. J. Neuroimmunol. 2007, 189, 31–40. [Google Scholar] [CrossRef] [PubMed]
  7. Stromnes, I.M.; Goverman, J.M. Active induction of experimental allergic encephalomyelitis. Nat. Protoc. 2006, 1, 1810–1819. [Google Scholar] [CrossRef] [PubMed]
  8. Stromnes, I.M.; Goverman, J.M. Passive induction of experimental allergic encephalomyelitis. Nat. Protoc. 2006, 1, 1952–1960. [Google Scholar] [CrossRef] [PubMed]
  9. Bolton, C.; Gordon, D.; Turk, J.L. Prostaglandin and thromboxane levels in central nervous system tissues from rats during the induction and development of experimental allergic encephalomyelitis (EAE). Immunopharmacology 1984, 7, 101–107. [Google Scholar] [CrossRef]
  10. Marusic, S.; Leach, M.W.; Pelker, J.W.; Azoitei, M.L.; Uozumi, N.; Cui, J.; Shen, M.W.; DeClercq, C.M.; Miyashiro, J.S.; Carito, B.A.; et al. Cytosolic phospholipase A2 α-deficient mice are resistant to experimental autoimmune encephalomyelitis. J. Exp. Med. 2005, 202, 841–851. [Google Scholar] [CrossRef] [PubMed]
  11. Kihara, Y.; Matsushita, T.; Kita, Y.; Uematsu, S.; Akira, S.; Kira, J.; Ishii, S.; Shimizu, T. Targeted lipidomics reveals mPGES-1-PGE2 as a therapeutic target for multiple sclerosis. Proc. Natl. Acad. Sci. USA 2009, 106, 21807–21812. [Google Scholar] [CrossRef] [PubMed]
  12. Takeuchi, C.; Matsumoto, Y.; Kohyama, K.; Uematsu, S.; Akira, S.; Yamagata, K.; Takemiya, T. Microsomal prostaglandin E synthase-1 aggravates inflammation and demyelination in a mouse model of multiple sclerosis. Neurochem. Int. 2013, 62, 271–280. [Google Scholar] [CrossRef] [PubMed]
  13. Miyamoto, K.; Miyake, S.; Mizuno, M.; Oka, N.; Kusunoki, S.; Yamamura, T. Selective COX-2 inhibitor celecoxib prevents experimental autoimmune encephalomyelitis through COX-2-independent pathway. Brain 2006, 129, 1984–1992. [Google Scholar] [CrossRef] [PubMed]
  14. Muthian, G.; Raikwar, H.P.; Johnson, C.; Rajasingh, J.; Kalgutkar, A.; Marnett, L.J.; Bright, J.J. COX-2 inhibitors modulate IL-12 signaling through JAK-STAT pathway leading to Th1 response in experimental allergic encephalomyelitis. J. Clin. Immunol. 2006, 26, 73–85. [Google Scholar] [CrossRef] [PubMed]
  15. Ni, J.; Shu, Y.Y.; Zhu, Y.N.; Fu, Y.F.; Tang, W.; Zhong, X.G.; Wang, H.; Yang, Y.F.; Ren, J.; Wang, M.W.; et al. COX-2 inhibitors ameliorate experimental autoimmune encephalomyelitis through modulating IFN-γ and IL-10 production by inhibiting T-bet expression. J. Neuroimmunol. 2007, 186, 94–103. [Google Scholar] [CrossRef] [PubMed]
  16. Martin, D.; Near, S.L. Protective effect of the interleukin-1 receptor antagonist (IL-1ra) on experimental allergic encephalomyelitis in rats. J. Neuroimmunol. 1995, 61, 241–245. [Google Scholar] [CrossRef]
  17. Schiffenbauer, J.; Streit, W.J.; Butfiloski, E.; LaBow, M.; Edwards, C., III; Moldawer, L.L. The induction of EAE is only partially dependent on TNF receptor signaling but requires the IL-1 type I receptor. Clin. Immunol. 2000, 95, 117–123. [Google Scholar] [CrossRef] [PubMed]
  18. Napolitani, G.; Acosta-Rodriguez, E.V.; Lanzavecchia, A.; Sallusto, F. Prostaglandin E2 enhances Th17 responses via modulation of IL-17 and IFN-γ production by memory CD4+ T cells. Eur. J. Immunol. 2009, 39, 1301–1312. [Google Scholar] [CrossRef] [PubMed]
  19. Boniface, K.; Bak-Jensen, K.S.; Li, Y.; Blumenschein, W.M.; McGeachy, M.J.; McClanahan, T.K.; McKenzie, B.S.; Kastelein, R.A.; Cua, D.J.; de Waal Malefyt, R. Prostaglandin E2 regulates Th17 cell differentiation and function through cyclic AMP and EP2/EP4 receptor signaling. J. Exp. Med. 2009, 206, 535–548. [Google Scholar] [CrossRef] [PubMed]
  20. Adamik, J.; Henkel, M.; Ray, A.; Auron, P.E.; Duerr, R.; Barrie, A. The IL17A and IL17F loci have divergent histone modifications and are differentially regulated by prostaglandin E2 in Th17 cells. Cytokine 2013, 64, 404–412. [Google Scholar] [CrossRef] [PubMed]
  21. Sutton, C.E.; Lalor, S.J.; Sweeney, C.M.; Brereton, C.F.; Lavelle, E.C.; Mills, K.H. Interleukin-1 and IL-23 induce innate IL-17 production from γδ T cells, amplifying Th17 responses and autoimmunity. Immunity 2009, 31, 331–341. [Google Scholar] [CrossRef] [PubMed]
  22. Chung, Y.; Chang, S.H.; Martinez, G.J.; Yang, X.O.; Nurieva, R.; Kang, H.S.; Ma, L.; Watowich, S.S.; Jetten, A.M.; Tian, Q.; et al. Critical regulation of early Th17 cell differentiation by interleukin-1 signaling. Immunity 2009, 30, 576–587. [Google Scholar] [CrossRef] [PubMed]
  23. Dore-Duffy, P.; Donaldson, J.O.; Koff, T.; Longo, M.; Perry, W. Prostaglandin release in multiple sclerosis: Correlation with disease activity. Neurology 1986, 36, 1587–1590. [Google Scholar] [CrossRef] [PubMed]
  24. Aberg, J.A.; Demers, L.M.; Romano, P.J.; Tenser, R.B. Prostaglandin production in chronic progressive multiple sclerosis. J. Clin. Lab. Anal. 1990, 4, 246–250. [Google Scholar] [CrossRef] [PubMed]
  25. Di Rosa, F.; Serafini, B.; Scognamiglio, P.; Di Virgilio, A.; Finocchi, L.; Aloisi, F.; Barnaba, V. Short-lived immunization site inflammation in self-limited active experimental allergic encephalomyelitis. Int. Immunol. 2000, 12, 711–719. [Google Scholar] [CrossRef] [PubMed]
  26. Jakobsson, P.J.; Thoren, S.; Morgenstern, R.; Samuelsson, B. Identification of human prostaglandin E synthase: A microsomal, glutathione-dependent, inducible enzyme, constituting a potential novel drug target. Proc. Natl. Acad. Sci. USA 1999, 96, 7220–7225. [Google Scholar] [CrossRef] [PubMed]
  27. Tanikawa, N.; Ohmiya, Y.; Ohkubo, H.; Hashimoto, K.; Kangawa, K.; Kojima, M.; Ito, S.; Watanabe, K. Identification and characterization of a novel type of membrane-associated prostaglandin E synthase. Biochem. Biophys. Res. Commun. 2002, 291, 884–889. [Google Scholar] [CrossRef] [PubMed]
  28. Tanioka, T.; Nakatani, Y.; Semmyo, N.; Murakami, M.; Kudo, I. Molecular identification of cytosolic prostaglandin E2 synthase that is functionally coupled with cyclooxygenase-1 in immediate prostaglandin E2 biosynthesis. J. Biol. Chem. 2000, 275, 32775–32782. [Google Scholar] [CrossRef] [PubMed]
  29. Murakami, M.; Naraba, H.; Tanioka, T.; Semmyo, N.; Nakatani, Y.; Kojima, F.; Ikeda, T.; Fueki, M.; Ueno, A.; Oh, S.; et al. Regulation of prostaglandin E2 biosynthesis by inducible membrane-associated prostaglandin E2 synthase that acts in concert with cyclooxygenase-2. J. Biol. Chem. 2000, 275, 32783–32792. [Google Scholar] [CrossRef] [PubMed]
  30. Kunori, S.; Matsumura, S.; Okuda-Ashitaka, E.; Katano, T.; Audoly, L.P.; Urade, Y.; Ito, S. A novel role of prostaglandin E2 in neuropathic pain: Blockade of microglial migration in the spinal cord. Glia 2011, 59, 208–218. [Google Scholar] [CrossRef] [PubMed]
  31. Kleine, T.O.; Zwerenz, P.; Graser, C.; Zofel, P. Approach to discriminate subgroups in multiple sclerosis with cerebrospinal fluid (CSF) basic inflammation indices and TNF-α, IL-1β, IL-6, IL-8. Brain Res. Bull. 2003, 61, 327–346. [Google Scholar] [CrossRef]
  32. Levesque, S.A.; Pare, A.; Mailhot, B.; Bellver-Landete, V.; Kebir, H.; Lecuyer, M.A.; Alvarez, J.I.; Prat, A.; de Rivero Vaccari, J.P.; Keane, R.W.; et al. Myeloid cell transmigration across the CNS vasculature triggers IL-1β-driven neuroinflammation during autoimmune encephalomyelitis in mice. J. Exp. Med. 2016, 213, 929–949. [Google Scholar] [CrossRef] [PubMed]
  33. Cao, C.; Matsumura, K.; Yamagata, K.; Watanabe, Y. Endothelial cells of the rat brain vasculature express cyclooxygenase-2 mRNA in response to systemic interleukin-1β: A possible site of prostaglandin synthesis responsible for fever. Brain Res. 1996, 733, 263–272. [Google Scholar] [CrossRef]
  34. Serou, M.J.; DeCoster, M.A.; Bazan, N.G. Interleukin-1β activates expression of cyclooxygenase-2 and inducible nitric oxide synthase in primary hippocampal neuronal culture: Platelet-activating factor as a preferential mediator of cyclooxygenase-2 expression. J. Neurosci. Res. 1999, 58, 593–598. [Google Scholar] [CrossRef]
  35. Samad, T.A.; Moore, K.A.; Sapirstein, A.; Billet, S.; Allchorne, A.; Poole, S.; Bonventre, J.V.; Woolf, C.J. Interleukin-1β-mediated induction of COX-2 in the CNS contributes to inflammatory pain hypersensitivity. Nature 2001, 410, 471–475. [Google Scholar] [CrossRef] [PubMed]
  36. Favrais, G.; Schwendimann, L.; Gressens, P.; Lelievre, V. Cyclooxygenase-2 mediates the sensitizing effects of systemic IL-1β on excitotoxic brain lesions in newborn mice. Neurobiol. Dis. 2007, 25, 496–505. [Google Scholar] [CrossRef] [PubMed]
  37. Casos, K.; Siguero, L.; Fernandez-Figueras, M.T.; Leon, X.; Sarda, M.P.; Vila, L.; Camacho, M. Tumor cells induce COX-2 and mPGES-1 expression in microvascular endothelial cells mainly by means of IL-1 receptor activation. Microvasc. Res. 2011, 81, 261–268. [Google Scholar] [CrossRef] [PubMed]
  38. Taniguchi, H.; Anacker, C.; Suarez-Mier, G.B.; Wang, Q.; Andreasson, K. Function of prostaglandin E2 EP receptors in the acute outcome of rodent hypoxic ischemic encephalopathy. Neurosci. Lett. 2011, 504, 185–190. [Google Scholar] [CrossRef] [PubMed]
  39. Okano, M.; Sugata, Y.; Fujiwara, T.; Matsumoto, R.; Nishibori, M.; Shimizu, K.; Maeda, M.; Kimura, Y.; Kariya, S.; Hattori, H.; et al. E prostanoid 2 (EP2)/EP4-mediated suppression of antigen-specific human T-cell responses by prostaglandin E2. Immunology 2006, 118, 343–352. [Google Scholar] [CrossRef] [PubMed]
  40. Maslanka, T.; Spodniewska, A.; Barski, D.; Jasiecka, A.; Zuska-Prot, M.; Ziolkowski, H.; Markiewicz, W.; Jaroszewski, J.J. Prostaglandin E2 down-regulates the expression of CD25 on bovine T cells, and this effect is mediated through the EP4 receptor. Vet. Immunol. Immunopathol. 2014, 160, 192–200. [Google Scholar] [CrossRef] [PubMed]
  41. Sreeramkumar, V.; Hons, M.; Punzon, C.; Stein, J.V.; Sancho, D.; Fresno, M.; Cuesta, N. Efficient T-cell priming and activation requires signaling through prostaglandin E2 (EP) receptors. Immunol. Cell Biol. 2016, 94, 39–51. [Google Scholar] [CrossRef] [PubMed]
  42. Zhu, P.; Genc, A.; Zhang, X.; Zhang, J.; Bazan, N.G.; Chen, C. Heterogeneous expression and regulation of hippocampal prostaglandin E2 receptors. J. Neurosci. Res. 2005, 81, 817–826. [Google Scholar] [CrossRef] [PubMed]
  43. Martin, B.N.; Wang, C.; Zhang, C.J.; Kang, Z.; Gulen, M.F.; Zepp, J.A.; Zhao, J.; Bian, G.; Do, J.S.; Min, B.; et al. T cell-intrinsic ASC critically promotes Th17-mediated experimental autoimmune encephalomyelitis. Nat. Immunol. 2016, 17, 583–592. [Google Scholar] [CrossRef] [PubMed]
  44. Vainchtein, I.D.; Vinet, J.; Brouwer, N.; Brendecke, S.; Biagini, G.; Biber, K.; Boddeke, H.W.; Eggen, B.J. In acute experimental autoimmune encephalomyelitis, infiltrating macrophages are immune activated, whereas microglia remain immune suppressed. Glia 2014, 62, 1724–1735. [Google Scholar] [CrossRef] [PubMed]
  45. Dumas, A.; Amiable, N.; de Rivero Vaccari, J.P.; Chae, J.J.; Keane, R.W.; Lacroix, S.; Vallieres, L. The inflammasome pyrin contributes to pertussis toxin-induced IL-1β synthesis, neutrophil intravascular crawling and autoimmune encephalomyelitis. PLoS Pathog. 2014, 10, e1004150. [Google Scholar] [CrossRef] [PubMed]
  46. McFarland, H.F.; Martin, R. Multiple sclerosis: A complicated picture of autoimmunity. Nat. Immunol. 2007, 8, 913–919. [Google Scholar] [CrossRef] [PubMed]
  47. Pare, A.; Mailhot, B.; Levesque, S.A.; Lacroix, S. Involvement of the IL-1 system in experimental autoimmune encephalomyelitis and multiple sclerosis: Breaking the vicious cycle between IL-1β and GM-CSF. Brain Behav. Immun. 2017, 62, 1–8. [Google Scholar] [CrossRef] [PubMed]
  48. Correale, J.; Farez, M.F. The Role of Astrocytes in Multiple Sclerosis Progression. Front. Neurol. 2015, 6, 180. [Google Scholar] [CrossRef] [PubMed]
  49. Blamire, A.M.; Anthony, D.C.; Rajagopalan, B.; Sibson, N.R.; Perry, V.H.; Styles, P. Interleukin-1β-induced changes in blood-brain barrier permeability, apparent diffusion coefficient, and cerebral blood volume in the rat brain: A magnetic resonance study. J. Neurosci. 2000, 20, 8153–8159. [Google Scholar] [PubMed]
  50. Argaw, A.T.; Zhang, Y.; Snyder, B.J.; Zhao, M.L.; Kopp, N.; Lee, S.C.; Raine, C.S.; Brosnan, C.F.; John, G.R. IL-1α regulates blood-brain barrier permeability via reactivation of the hypoxia-angiogenesis program. J. Immunol. 2006, 177, 5574–5584. [Google Scholar] [CrossRef] [PubMed]
  51. McCandless, E.E.; Budde, M.; Lees, J.R.; Dorsey, D.; Lyng, E.; Klein, R.S. IL-1r signaling within the central nervous system regulates CXCL12 expression at the blood-brain barrier and disease severity during experimental autoimmune encephalomyelitis. J. Immunol. 2009, 183, 613–620. [Google Scholar] [CrossRef] [PubMed]
  52. Li, Q.; Powell, N.; Zhang, H.; Belevych, N.; Ching, S.; Chen, Q.; Sheridan, J.; Whitacre, C.; Quan, N. Endothelial IL-1r1 is a critical mediator of EAE pathogenesis. Brain Behav. Immun. 2011, 25, 160–167. [Google Scholar] [CrossRef] [PubMed]
  53. Basu, A.; Krady, J.K.; O’Malley, M.; Styren, S.D.; DeKosky, S.T.; Levison, S.W. The type 1 interleukin-1 receptor is essential for the efficient activation of microglia and the induction of multiple proinflammatory mediators in response to brain injury. J. Neurosci. 2002, 22, 6071–6082. [Google Scholar] [PubMed]
  54. Domingues, H.S.; Mues, M.; Lassmann, H.; Wekerle, H.; Krishnamoorthy, G. Functional and pathogenic differences of Th1 and Th17 cells in experimental autoimmune encephalomyelitis. PLoS ONE 2010, 5, e15531. [Google Scholar] [CrossRef] [PubMed]
  55. Murphy, A.C.; Lalor, S.J.; Lynch, M.A.; Mills, K.H. Infiltration of Th1 and Th17 cells and activation of microglia in the CNS during the course of experimental autoimmune encephalomyelitis. Brain Behav. Immun. 2010, 24, 641–651. [Google Scholar] [CrossRef] [PubMed]
  56. Park, H.; Li, Z.; Yang, X.O.; Chang, S.H.; Nurieva, R.; Wang, Y.H.; Wang, Y.; Hood, L.; Zhu, Z.; Tian, Q.; et al. A distinct lineage of CD4 T cells regulates tissue inflammation by producing interleukin 17. Nat. Immunol. 2005, 6, 1133–1141. [Google Scholar] [CrossRef] [PubMed]
  57. Iglesias, A.; Bauer, J.; Litzenburger, T.; Schubart, A.; Linington, C. T- and B-cell responses to myelin oligodendrocyte glycoprotein in experimental autoimmune encephalomyelitis and multiple sclerosis. Glia 2001, 36, 220–234. [Google Scholar] [CrossRef] [PubMed]
  58. Hjelmstrom, P.; Juedes, A.E.; Fjell, J.; Ruddle, N.H. B-cell-deficient mice develop experimental allergic encephalomyelitis with demyelination after myelin oligodendrocyte glycoprotein sensitization. J. Immunol. 1998, 161, 4480–4483. [Google Scholar] [PubMed]
  59. Uematsu, S.; Matsumoto, M.; Takeda, K.; Akira, S. Lipopolysaccharide-dependent prostaglandin E2 production is regulated by the glutathione-dependent prostaglandin E2 synthase gene induced by the Toll-like receptor 4/MyD88/NF-IL6 pathway. J. Immunol. 2002, 168, 5811–5816. [Google Scholar] [CrossRef] [PubMed]
Figure 1. Expression of microsomal PGE2 synthase-1 (mPGES-1) and the effect of mPGES-1 on experimental autoimmune encephalomyelitis (EAE) paralysis. Immunohistochemistry image of mPGE-1 (green) with CD31 (A,B), CD11b (C,D), and CD4 (E,F) in the inflammatory region of spinal cords of wt EAE mice (A,C,E) and ko EAE (B,D,F) mice. Onset of symptoms (G) and the EAE score at day 19 (H) in EAE development. Scale bars (20 μm) for all images. wt, wild-type; ko, mPGES-1−/−. * p < 0.05.
Ijms 18 02758 g001
Figure 2. Distribution of CD4+ T cells in EAE spinal cords. Immunohistochemistry image showing CD4 in the inflammatory region of the spinal cord in wt EAE (A,B), ko EAE (C,D), wt control (G), and ko control (H) mice. Measurement of half size area in the spinal cord (E). Percentage of the CD4+ area in the EAE spinal cord half (F). Scale bar (20 μm) for (A,C,G,H), and (200 μm) for (B,D,E). wt, wild-type; ko, mPGES-1−/−; cont, naïve mice; EAE, EAE mice. * p < 0.0001.
Ijms 18 02758 g002
Figure 3. Expression of EP receptors and interleukin-1β (IL-1β) in CD4+ T cells in EAE spinal cords. Immunohistochemistry image showing EP1–4 (green), CD4 (red), and IL-1β (blue) in the inflammatory region of the spinal cords of EAE wild-type mice (A) and EAE mPGES-1−/− mice (B). Scale bar (50 μm) for all images.
Ijms 18 02758 g003
Figure 4. Expression of IL-1β in CD4+ T cells in the spinal cords of EAE and control mice. Immunohistochemistry image showing IL-1β (green) and CD4 (red) in the inflammatory region of the spinal cords of wt EAE (A), wt control (B), ko EAE (C), and ko control (D) mice. Percentage of the IL-1β+ CD4+ area in the CD4+ area of EAE spinal cords (E). Scale bar (50 μm) for upper panels and (20 μm) for lower panels of (AD). wt, wild-type; ko, mPGES-1−/−; cont, naïve mice; EAE, EAE mice. * p < 0.05, ** p < 0.005, *** p < 0.0005.
Ijms 18 02758 g004
Figure 5. Expression of IL-1β in CD11b+ macrophages and microglia in the spinal cords of EAE and control mice. Immunohistochemistry image showing IL-1β (green) and CD11b (red) in the inflammatory region of the spinal cords of wt EAE (A), wt control (B), ko EAE (C), and ko control (D) mice. Percentage of the IL-1β+ CD11b+ area in the CD11b+ area of EAE spinal cords (E). Scale bar (50 μm) for upper panels and (20 μm) for lower panels of (AD). wt, wild-type; ko, mPGES-1−/−; cont, naïve mice; EAE, EAE mice. * p < 0.05.
Ijms 18 02758 g005
Figure 6. Expression of interleukin-1 receptor 1 (IL-1r1) in CD4+ T cells in the spinal cords of EAE and control mice. Immunohistochemistry image showing IL-1r1 (green) and CD4 (red) in the inflammatory region of the spinal cords of wt EAE (A), wt control (B), ko EAE (C), and ko control (D) mice. Percentage of the IL-1r1+ CD4+ area in the CD4+ area of EAE spinal cords (E). Scale bar (50 μm) for upper panels and (20 μm) for lower panels of (AD). wt, wild-type; ko, mPGES-1−/−; cont, naïve mice; EAE, EAE mice. * p < 0.05.
Ijms 18 02758 g006
Figure 7. Expression of interleukin-17 (IL-17) and interferon-γ (IFN-γ) in CD4+ T cells in the spinal cords of EAE mice. Immunohistochemistry image showing IL-17 (green) and CD4 (red) in the inflammatory region of the spinal cords of wt EAE (A) and ko EAE (B) mice; and IFN-γ (green) and CD4 (red) in the inflammatory region of the spinal cords of wt EAE (C) and ko EAE (D) mice. Scale bar (50 μm) for upper panels and (20 μm) for lower panels of A–D. wt, wild-type; ko, mPGES-1−/−.
Ijms 18 02758 g007
Scheme 1. PGE2 synthesized by mPGES-1 facilitates the invasion of CD4+ T cells by inducing EP and IL-1r1 receptors, and potentiates IL-1β production, which exerts an autocrine signaling through IL-1r1 in wt EAE mice. This intercellular interaction affects IL-17 production, which finally aggravates inflammation and demyelination. Red arrows show production and secretion of PGE2, blue arrows show IL-1β, green arrows show IL-17, and gray arrows show cells infiltration from blood to spinal cord.
Ijms 18 02758 sch001
Scheme 2. In contrast, in mPGES-1−/− mice, CD4+ T cell invasion is suppressed along with EP receptor appearance, and, subsequently, IL-1r1 appearance and the production of IL-1β and IL-17 are reduced. Red arrows show production and secretion of PGE2, blue arrows show IL-1β, green arrows show IL-17, and gray arrows show cells infiltration from blood to spinal cord.
Ijms 18 02758 sch002

