
Wisteria floribunda Agglutinin and Its Reactive-Glycan-Carrying Prostate-Specific Antigen as a Novel Diagnostic and Prognostic Marker of Prostate Cancer

 ,
,
Abstract
:1. Introduction
2. Results
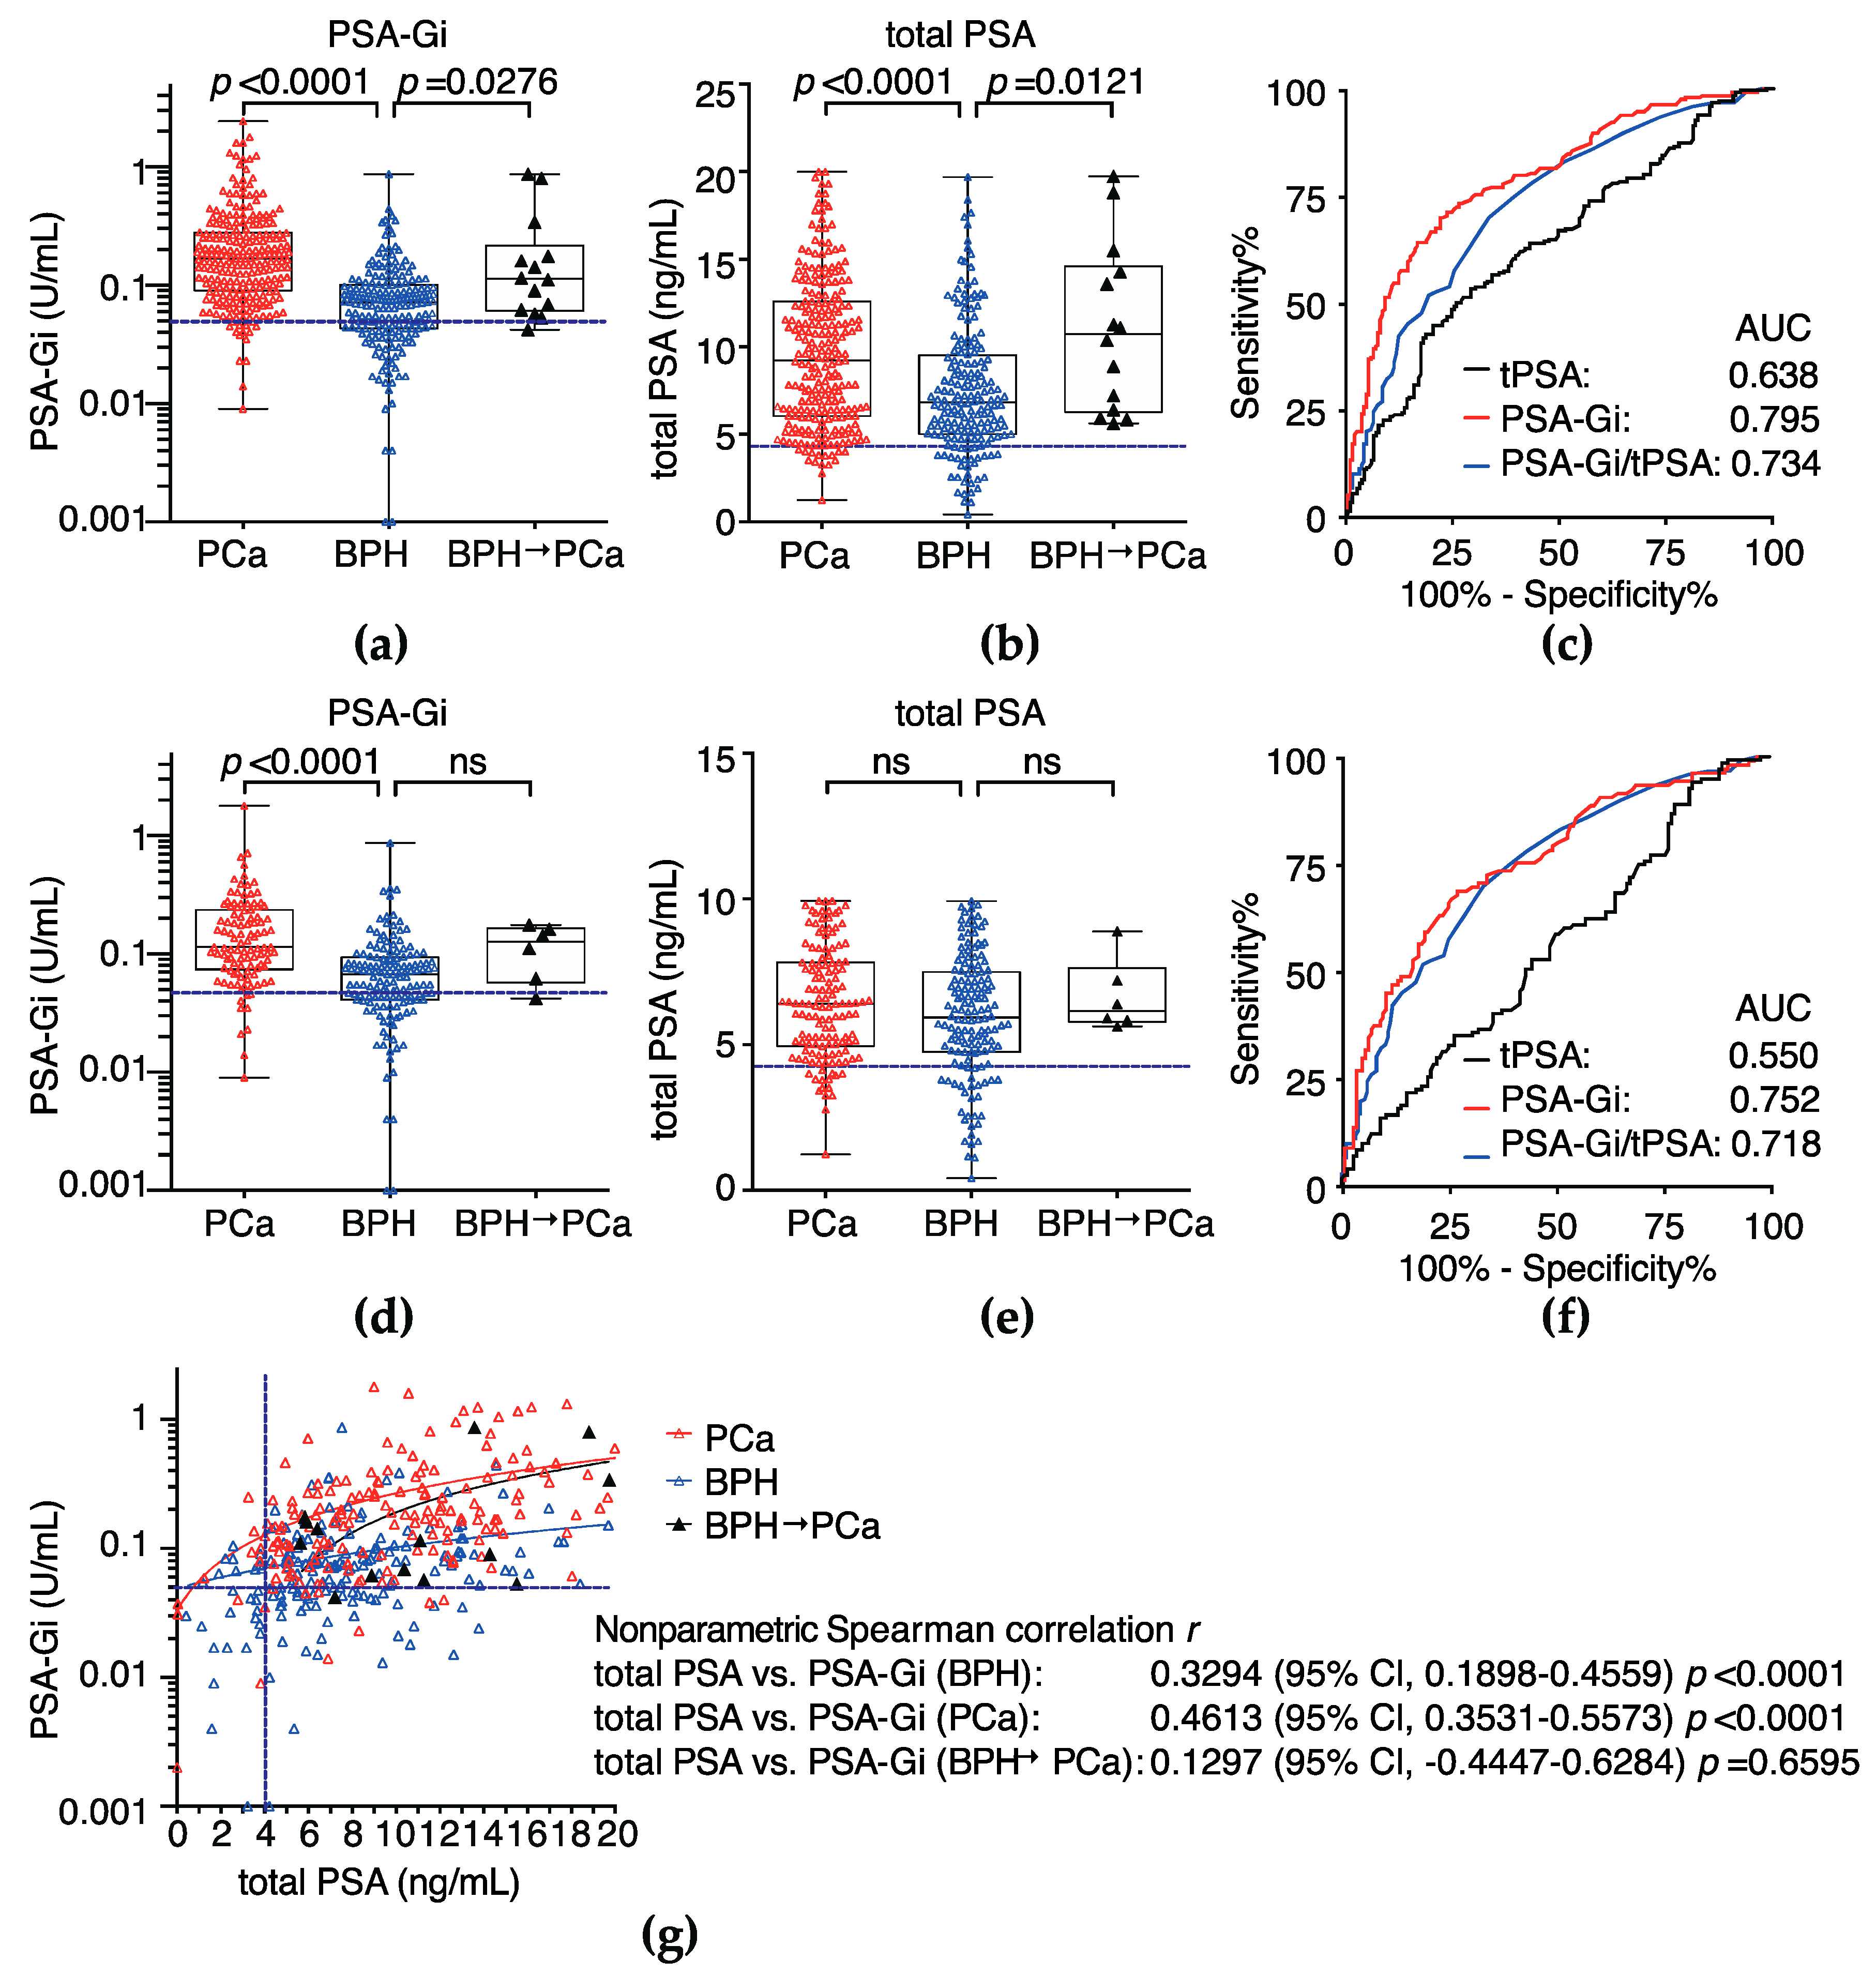
2.1. Diagnostic Performance of Serum PSA-Gi before Pbx Much Superior to Total PSA
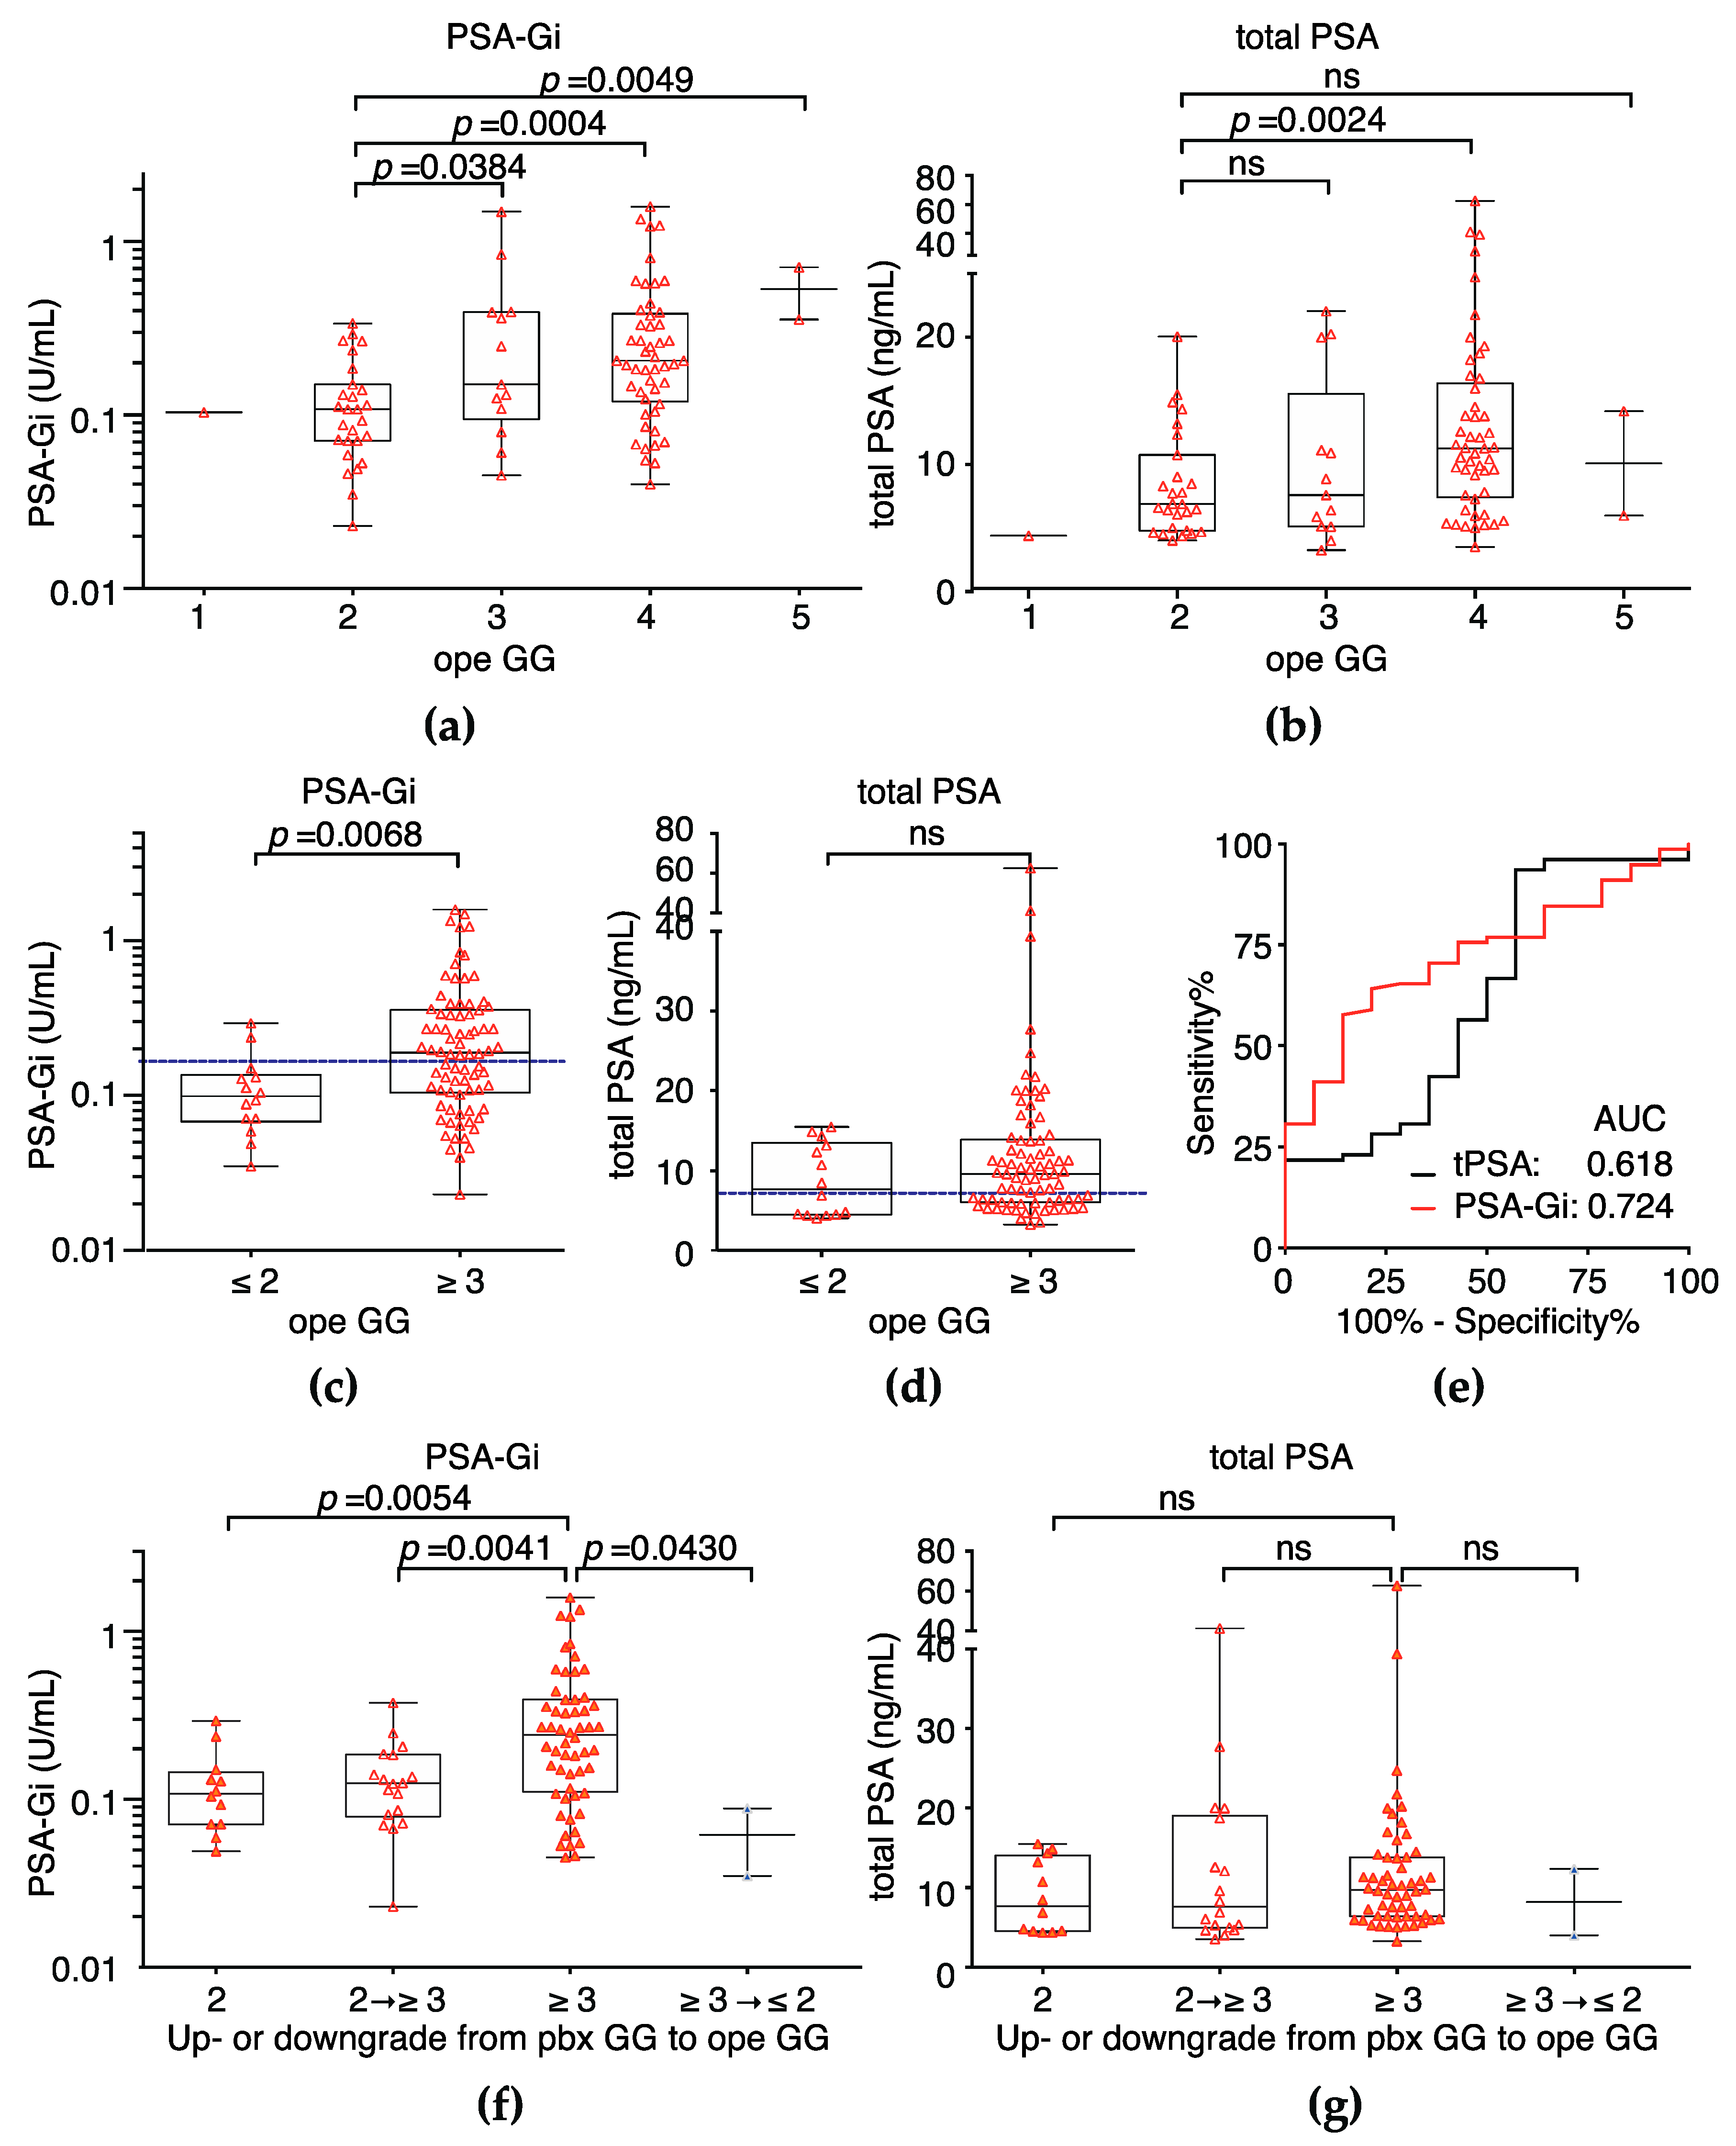
2.2. Serum PSA-Gi before Pbx Can Discriminate between Pbx Grade Group 2 and 3
2.3. Serum PSA-Gi before Pbx Can Discriminate between Ope Grade Group ≤2 and ≥3
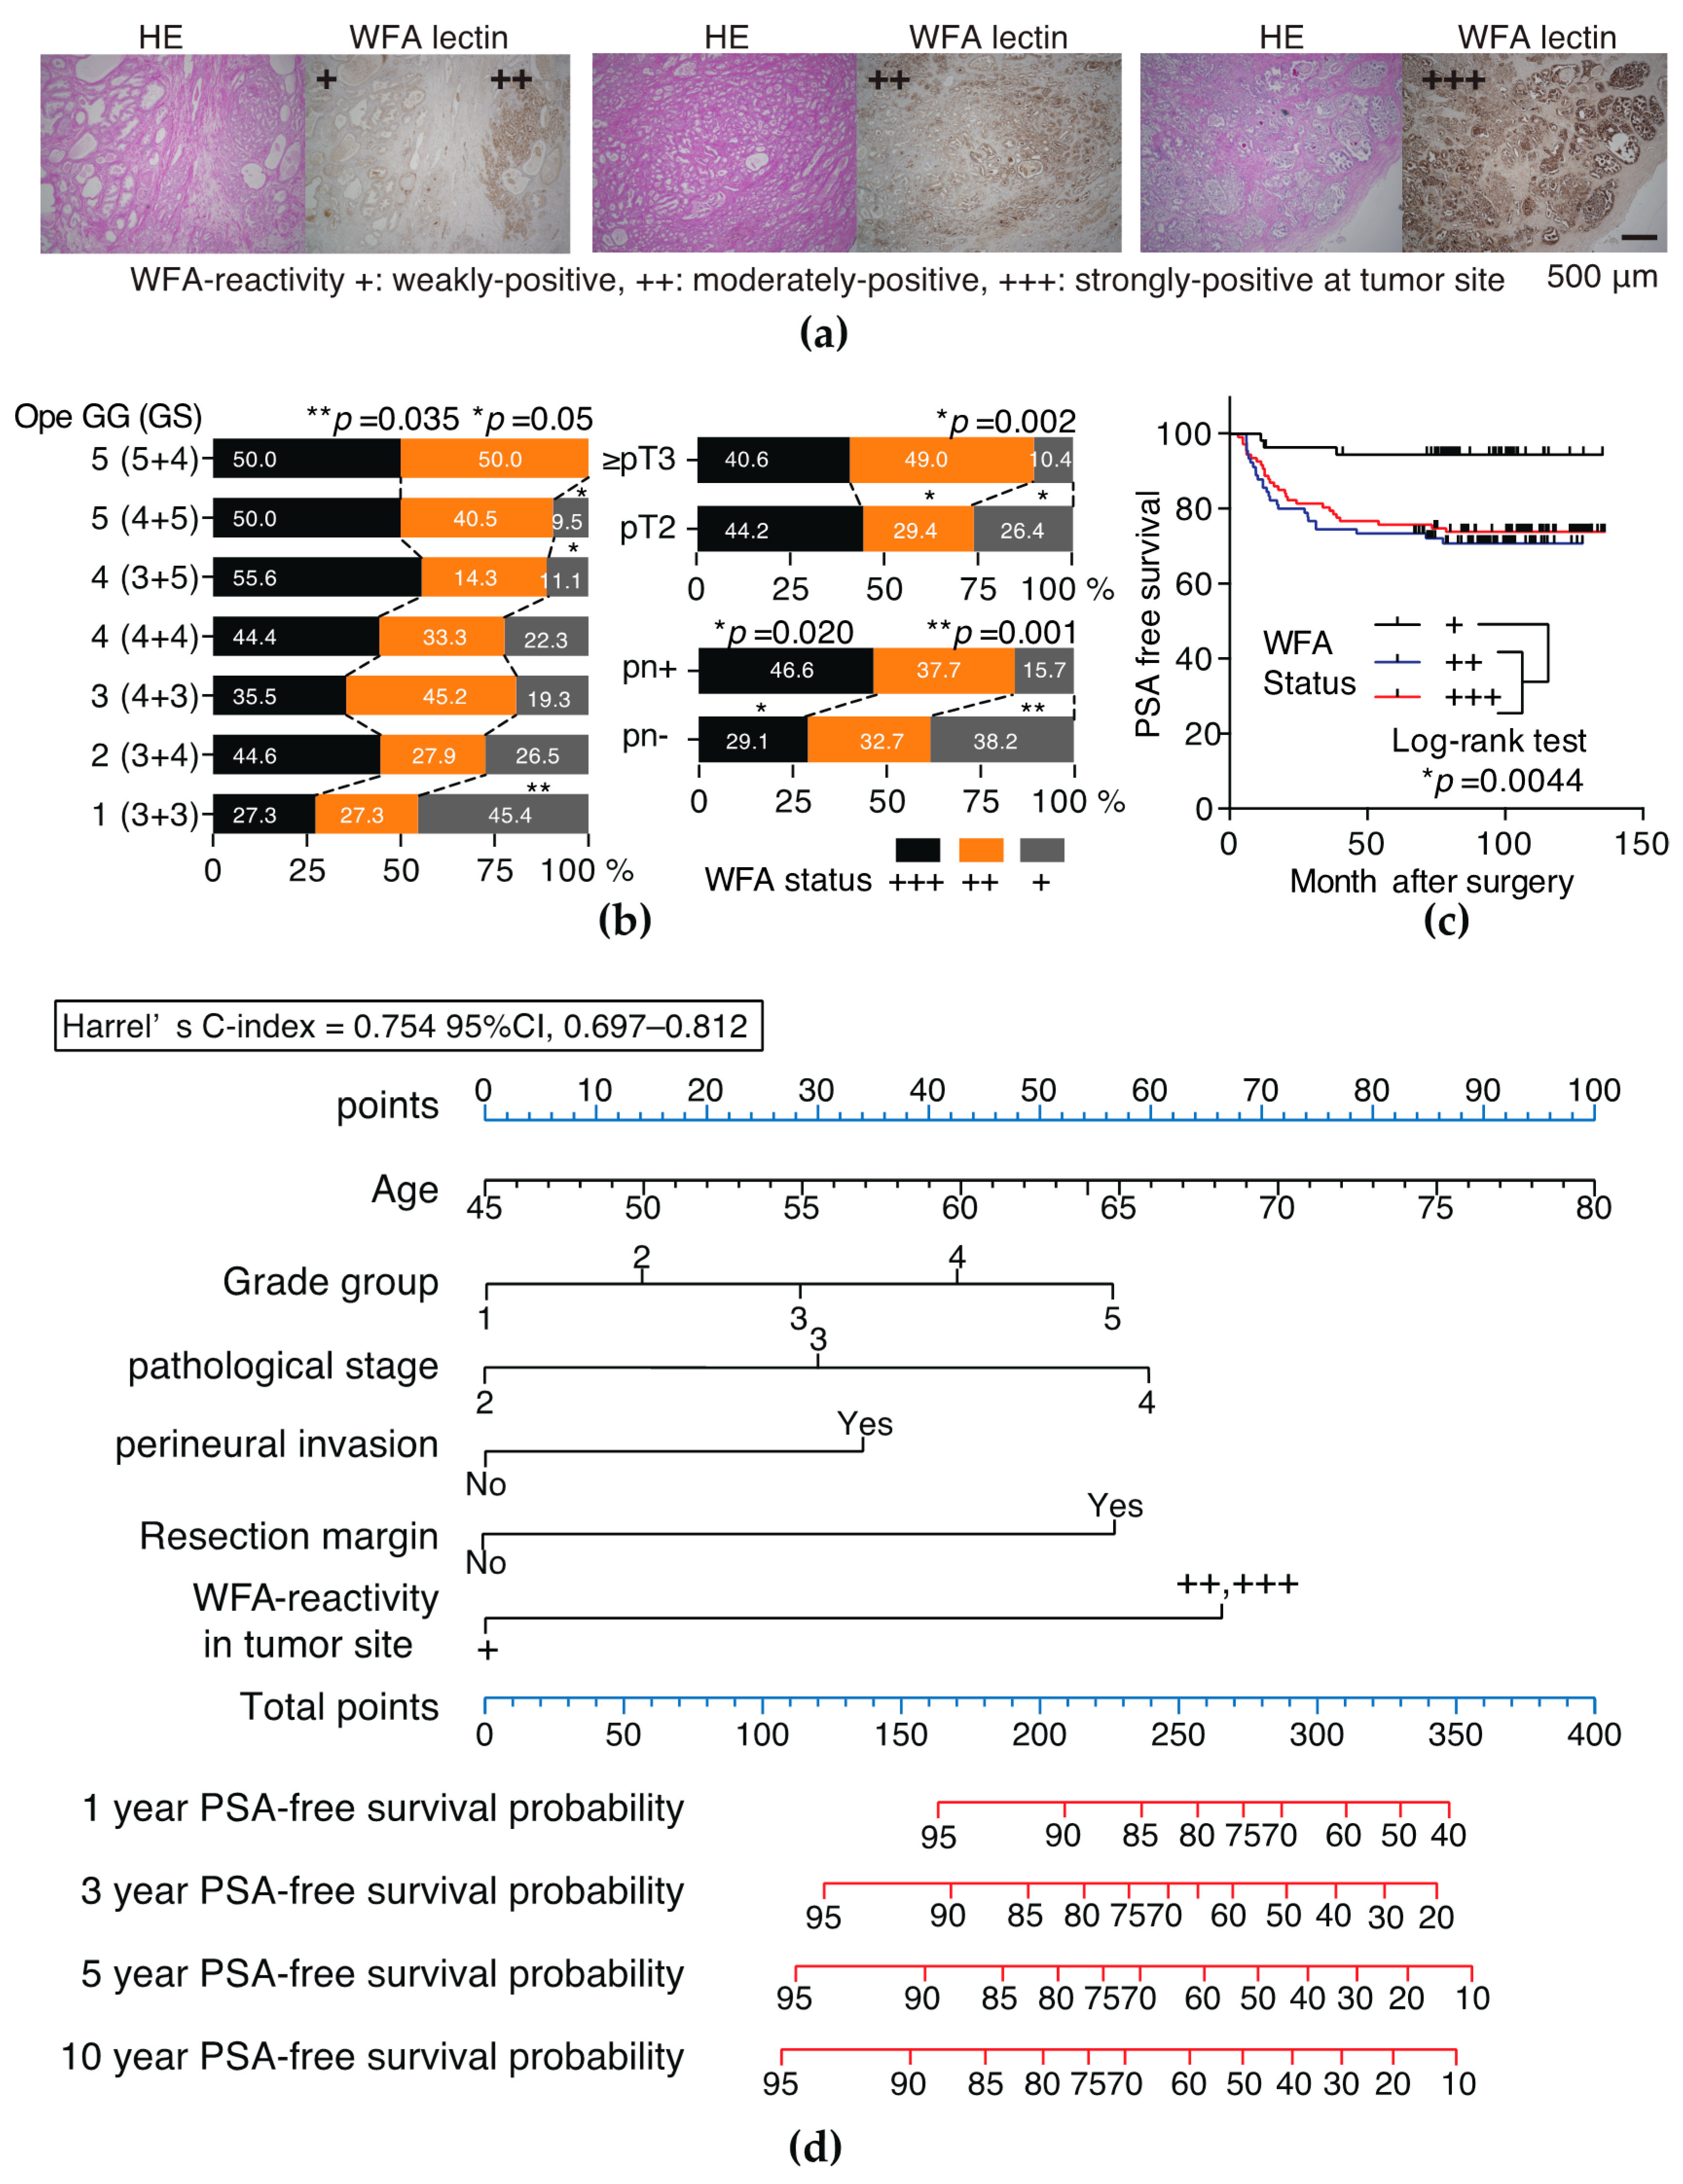
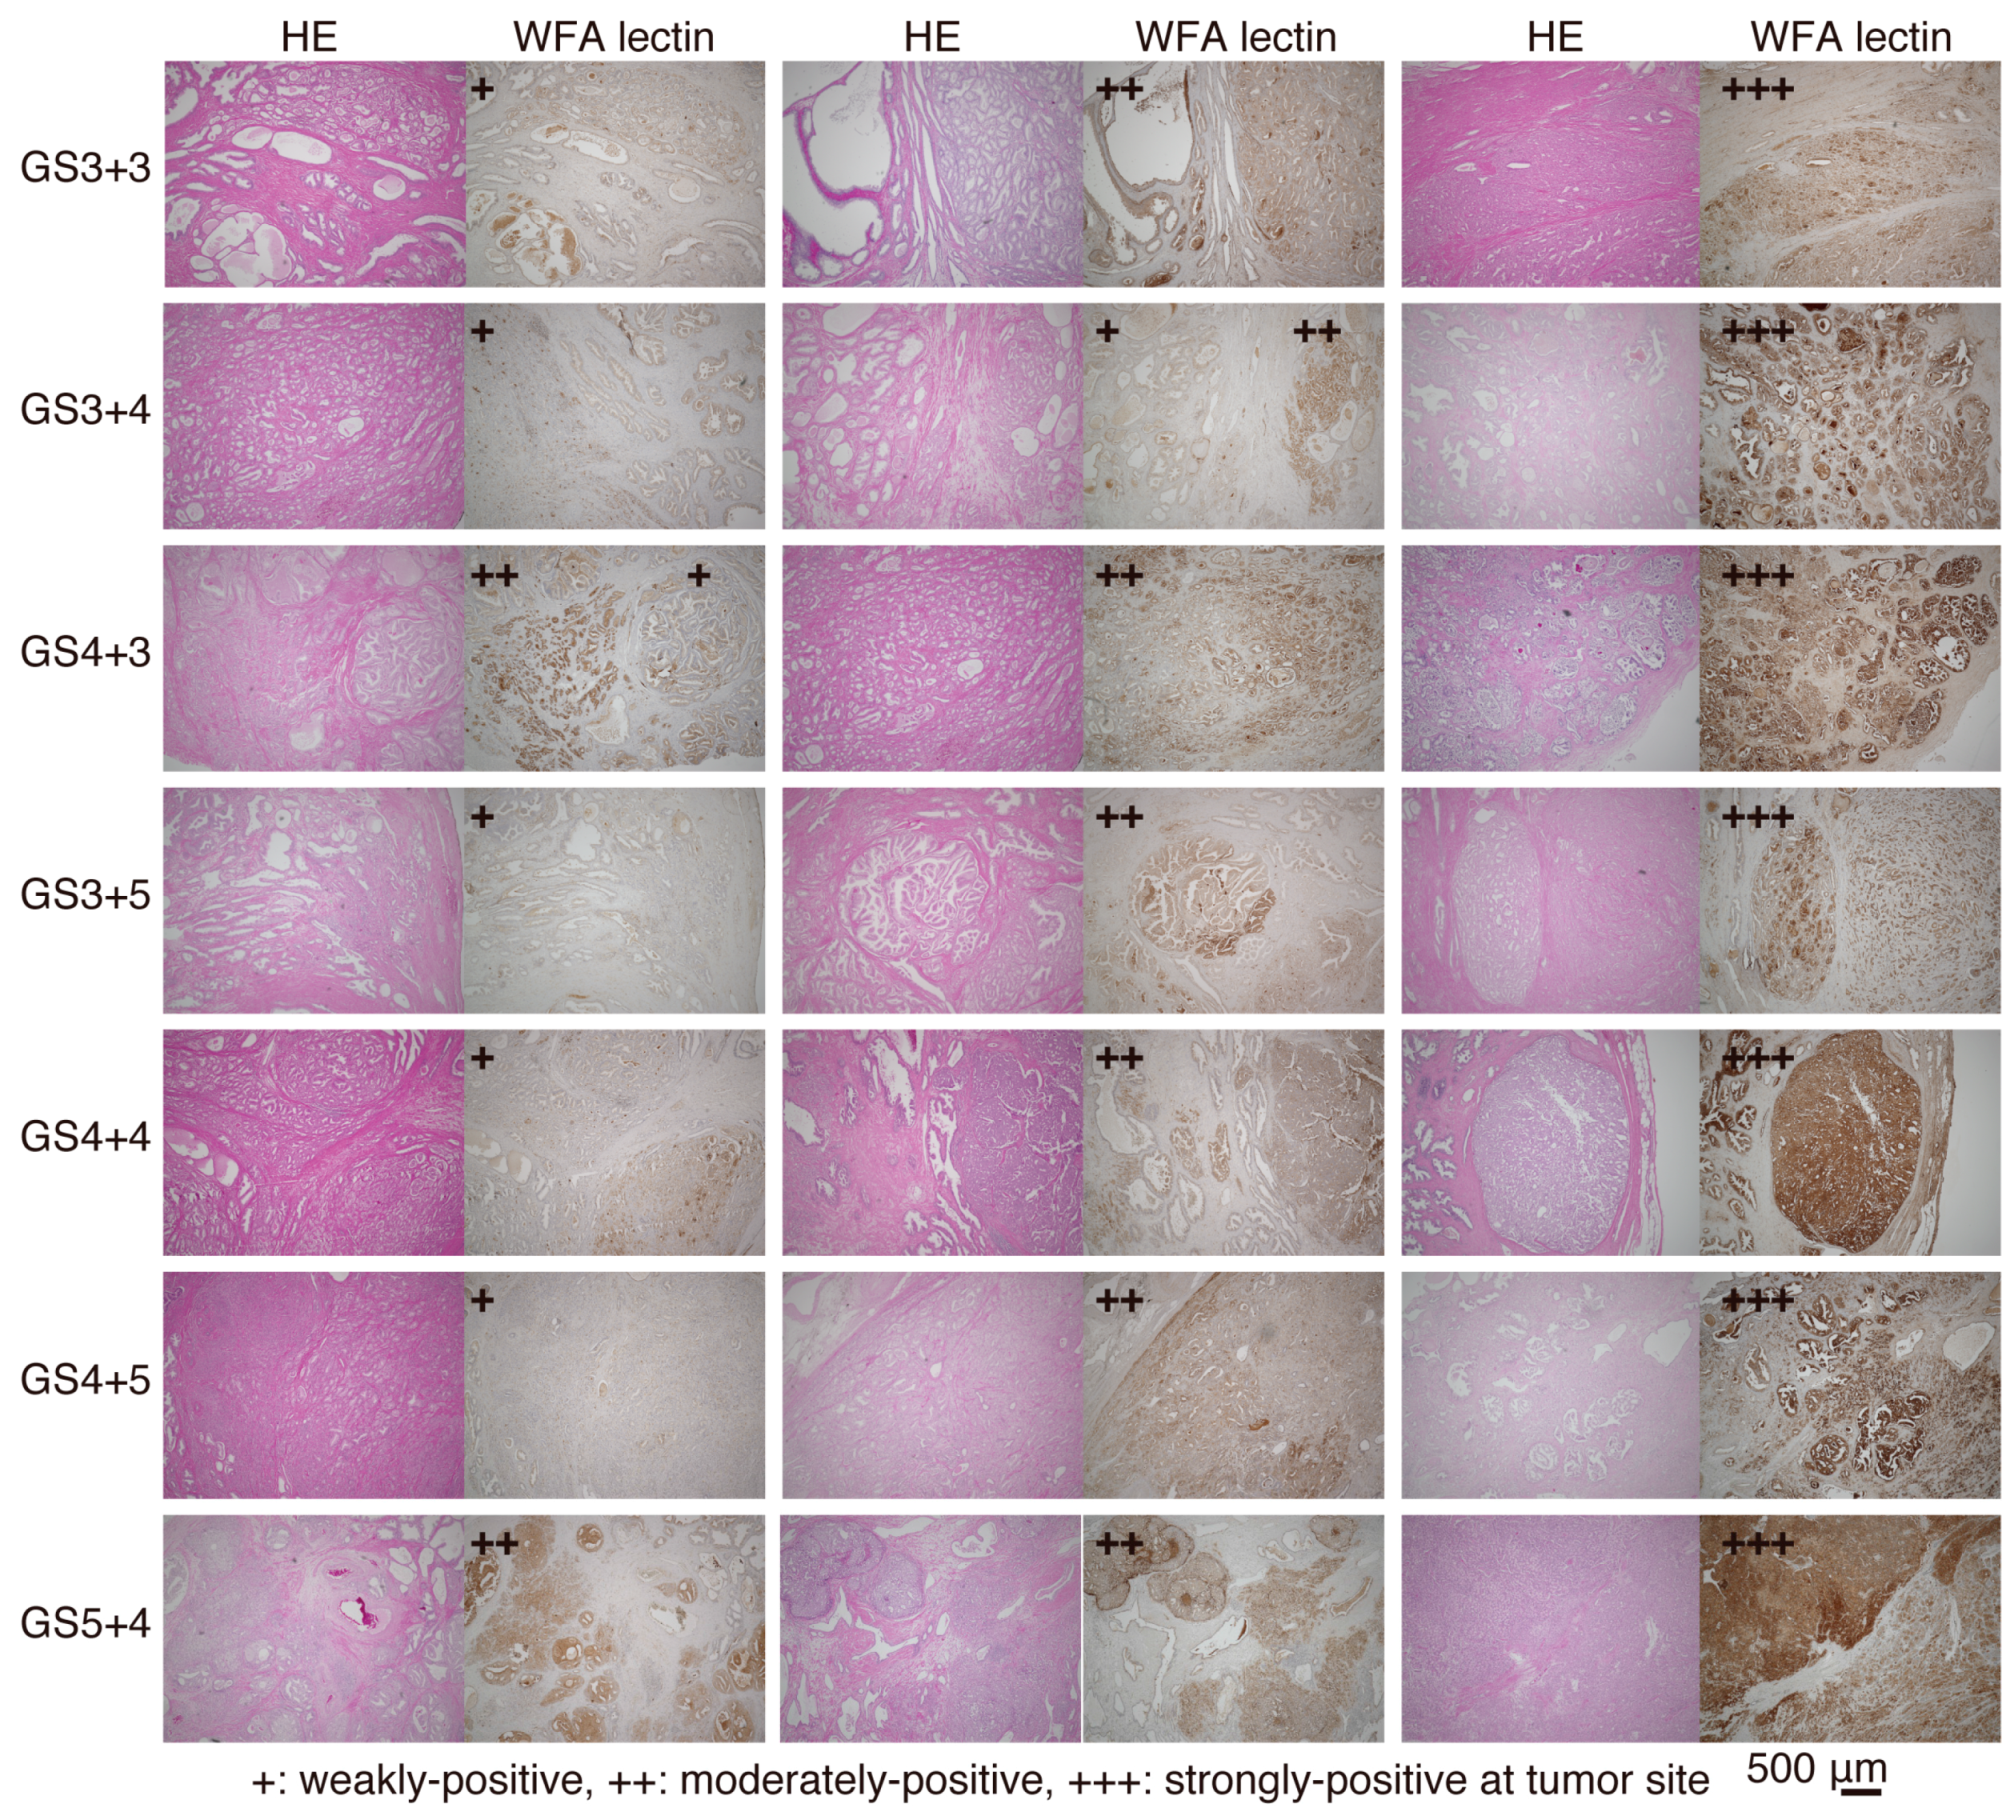
2.4. Tumors Strongly and Moderately Positive for WFA Is an Independent Risk Factor of PSA Recurrence
3. Discussion
4. Materials and Methods
4.1. Serum Samples from Patients with BPH and PCa
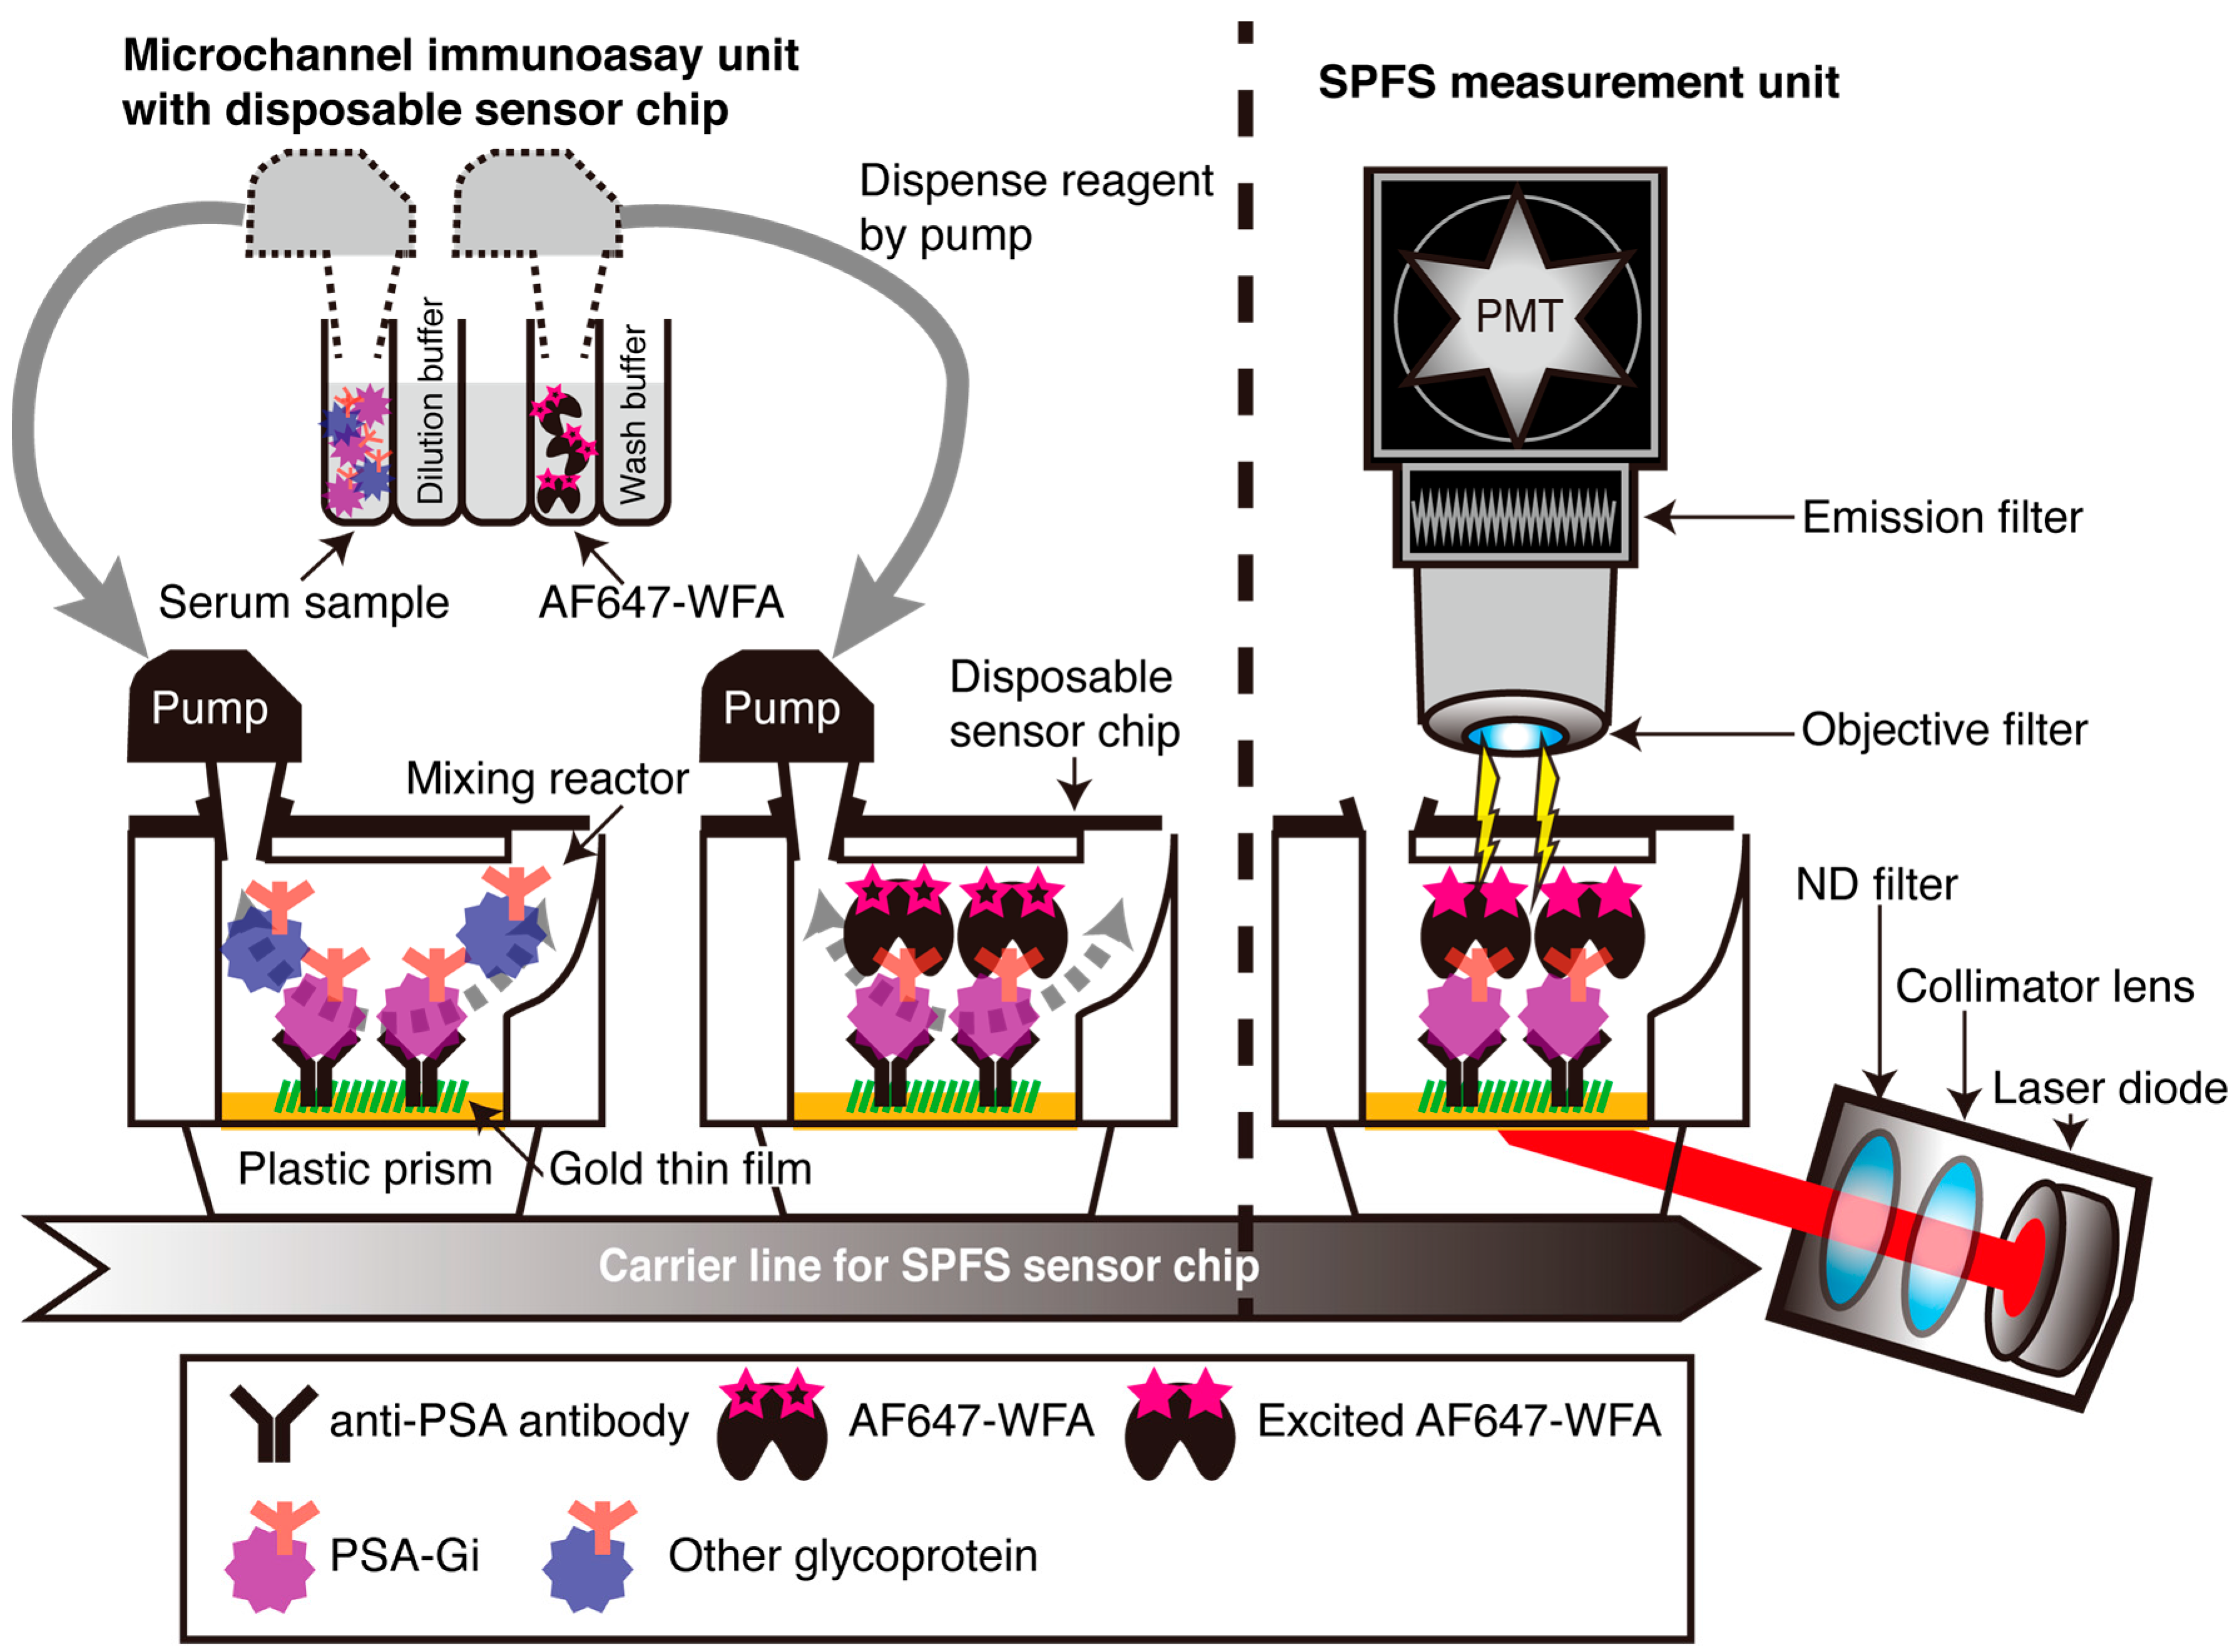
4.2. Detection of Serum PSA-Gi and Total PSA
4.3. Immunohistochemical Analysis of RP Specimens by WFA
4.4. Statistical Analysis
5. Conclusions
Acknowledgments
Author Contributions
Conflicts of Interest
Abbreviations
| SPFS | surface plasmon field-enhanced fluorescence spectrometry |
| WFA | Wisteria floribunda agglutinin |
| PSA | prostate-specific antigen |
| PCa | prostate cancer |
| BPH | benign prostatic hyperplasia |
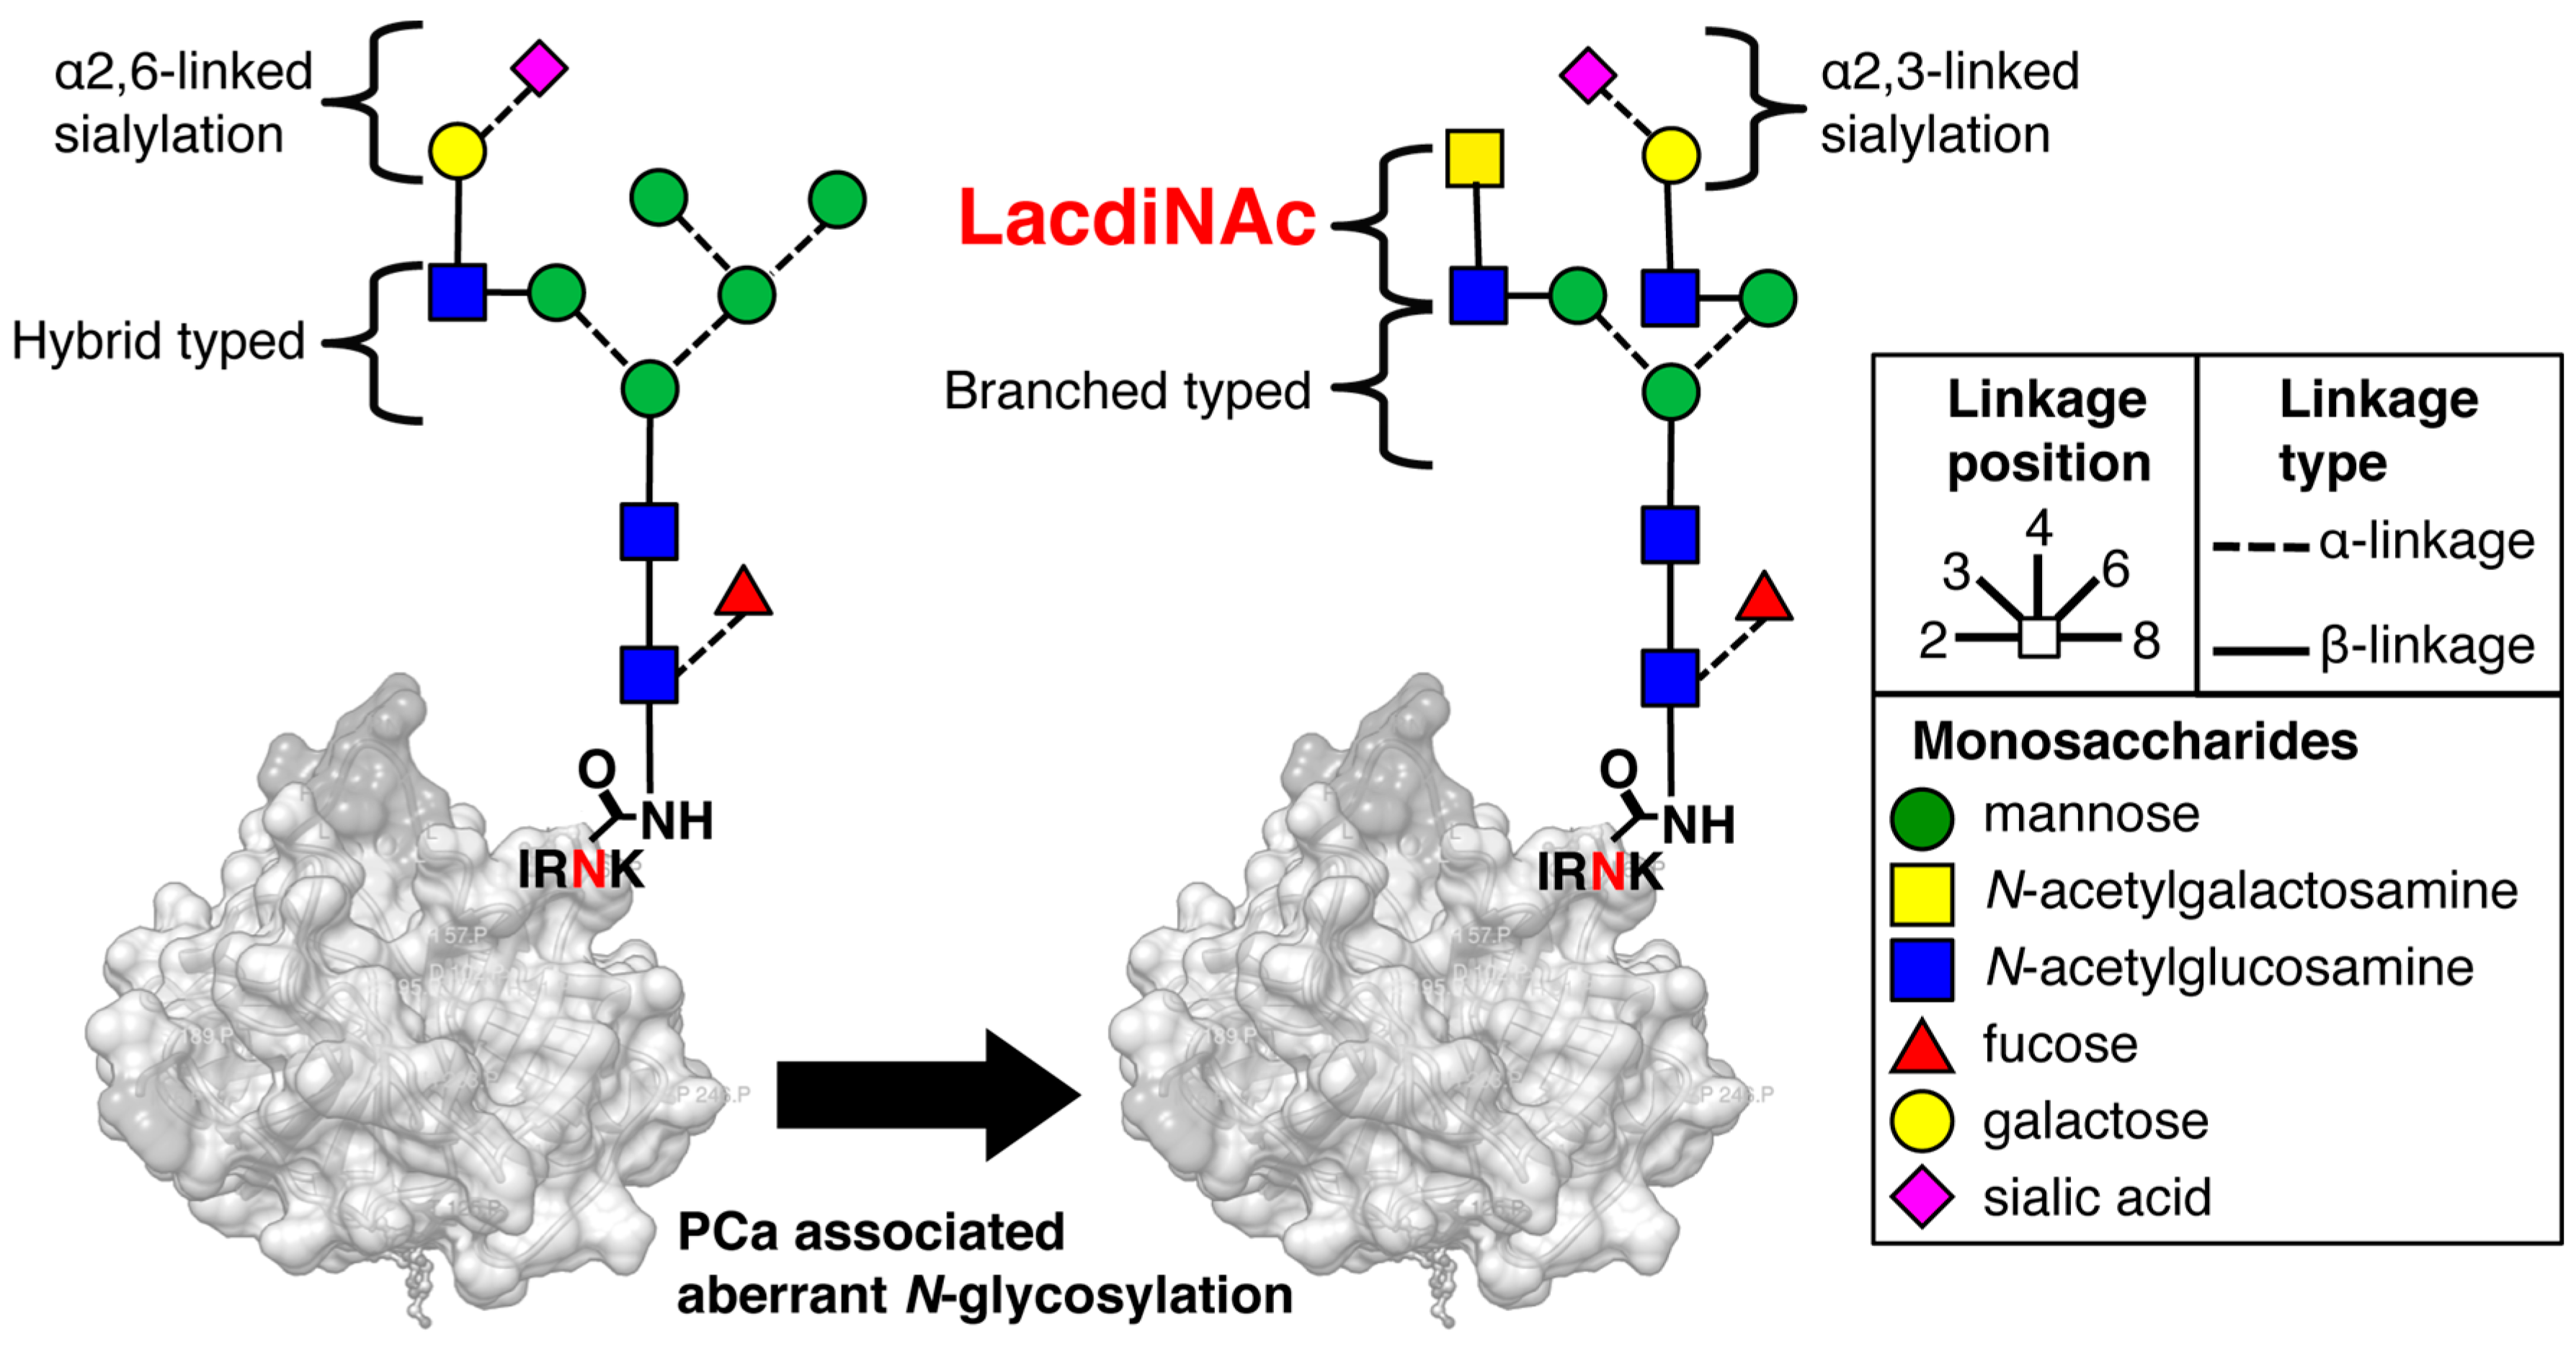
| LacdiNAc | GalNAcβ1-4GlcNAc- |
| Gal | galactose |
| Man | mannose |
| Fuc | fucose |
| Sia | sialic acid |
| GalNAc | N-acetylgalactosamine |
| GlcNAc | N-acetylglucosamine |
| Pbx GS | prostate biopsy Gleason Score |
| Pbx GG | prostate biopsy grade group |
| cT | clinical T stage |
| pT | pathological T stage |
| Ope GS | gleason score after radical prostatectomy |
| Ope GG | grade group after radical prostatectomy |
| RP | radical prostatectomy |
| pn | perineural invasion |
| RM | resection margin |
Appendix A

References
- Torre, L.A.; Bray, F.; Siegel, R.L.; Ferlay, J.; Lortet-Tieulent, J.; Jemal, A. Global cancer statistics, 2012. CA: Cancer J. Clin. 2015, 65, 87–108. [Google Scholar] [CrossRef] [PubMed]
- Ferlay, J.; Steliarova-Foucher, E.; Lortet-Tieulent, J.; Rosso, S.; Coebergh, J.W.; Comber, H.; Forman, D.; Bray, F. Cancer incidence and mortality patterns in Europe: Estimates for 40 countries in 2012. Eur. J. Cancer 2013, 49, 1374–1403. [Google Scholar] [CrossRef] [PubMed]
- Klotz, L. Prostate cancer overdiagnosis and overtreatment. Curr. Opin. Endocrinol. Diabetes Obes. 2013, 20, 204–209. [Google Scholar] [CrossRef] [PubMed]
- Kim, E.H.; Andriole, G.L. Prostate-specific antigen-based screening: Controversy and guidelines. BMC Med. 2015, 13, 61. [Google Scholar] [CrossRef] [PubMed]
- Ward, J.F.; Blute, M.L.; Slezak, J.; Bergstralh, E.J.; Zincke, H. The long-term clinical impact of biochemical recurrence of prostate cancer 5 or more years after radical prostatectomy. J. Urol. 2003, 170, 1872–1876. [Google Scholar] [CrossRef] [PubMed]
- Powell, I.J.; Tangen, C.M.; Miller, G.J.; Lowe, B.A.; Haas, G.; Carroll, P.R.; Osswald, M.B.; deVere White, R.; Thompson, I.M., Jr.; Crawford, E.D. Neoadjuvant therapy before radical prostatectomy for clinical T3/T4 carcinoma of the prostate: 5-Year followup, phase II Southwest Oncology Group Study 9109. J. Urol. 2002, 168, 2016–2019. [Google Scholar] [CrossRef]
- Mitsuzuka, K.; Narita, S.; Koie, T.; Kaiho, Y.; Tsuchiya, N.; Yoneyama, T.; Kakoi, N.; Kawamura, S.; Tochigi, T.; Habuchi, T.; et al. Pathological and biochemical outcomes after radical prostatectomy in men with low-risk prostate cancer meeting the Prostate Cancer International: Active surveillance criteria. Br. J. Urol. Int. 2013, 111, 914–920. [Google Scholar] [CrossRef] [PubMed]
- Satkunasivam, R.; Kulkarni, G.S.; Zlotta, A.R.; Kalnin, R.; Trachtenberg, J.; Fleshner, N.E.; Hamilton, R.J.; Jewett, M.A.; Finelli, A. Pathological, oncologic and functional outcomes of radical prostatectomy following active surveillance. J. Urol. 2013, 190, 91–95. [Google Scholar] [CrossRef] [PubMed]
- Maurice, M.J.; Sundi, D.; Schaeffer, E.M.; Abouassaly, R. Risk of pathological upgrading and upstaging among men with low-risk prostate cancer varies by race: Results from the National Cancer Data Base. J. Urol. 2016. [Google Scholar] [CrossRef] [PubMed]
- Sussman, R.; Staff, I.; Tortora, J.; Champagne, A.; Meraney, A.; Kesler, S.S.; Wagner, J.R. Impact of active surveillance on pathology and nerve sparing status. Can. J. Urol. 2014, 21, 7299–7304. [Google Scholar] [PubMed]
- Kattan, M.W.; Eastham, J.A.; Stapleton, A.M.; Wheeler, T.M.; Scardino, P.T. A preoperative nomogram for disease recurrence following radical prostatectomy for prostate cancer. J. Natl. Cancer Inst. 1998, 90, 766–771. [Google Scholar] [CrossRef] [PubMed]
- Haji-Ghassemi, O.; Gilbert, M.; Spence, J.; Schur, M.J.; Parker, M.J.; Jenkins, M.L.; Burke, J.E.; van Faassen, H.; Young, N.M.; Evans, S.V. Molecular basis for recognition of the cancer glycobiomarker LacdiNAc (GalNAc(β1–4)GlcNAc) by Wisteria floribunda agglutinin. J. Biol. Chem. 2016, 291, 24085–24095. [Google Scholar] [CrossRef] [PubMed]
- Kitamura, N.; Guo, S.; Sato, T.; Hiraizumi, S.; Taka, J.; Ikekita, M.; Sawada, S.; Fujisawa, H.; Furukawa, K. Prognostic significance of reduced expression of β-N-acetylgalactosaminylated N-linked oligosaccharides in human breast cancer. Int. J. Cancer 2003, 105, 533–541. [Google Scholar] [CrossRef] [PubMed]
- Hirano, K.; Matsuda, A.; Kuji, R.; Nakandakari, S.; Shirai, T.; Furukawa, K. Enhanced expression of the β4-N-acetylgalactosaminyltransferase 4 gene impairs tumor growth of human breast cancer cells. Biochem. Biophys. Res. Commun. 2015, 461, 80–85. [Google Scholar] [CrossRef] [PubMed]
- McMahon, R.F.; McWilliam, L.J.; Mosley, S. Evaluation of three techniques for differential diagnosis of prostatic needle biopsy specimens. J. Clin. Pathol. 1992, 45, 1094–1098. [Google Scholar] [CrossRef] [PubMed]
- McMahon, R.F.; McWilliam, L.J.; Clarke, N.W.; George, N.J. Altered saccharide sequences in two groups of patients with metastatic prostatic carcinoma. Br. J. Urol. 1994, 74, 80–85. [Google Scholar] [CrossRef] [PubMed]
- Yamaguchi, T.; Yokoyama, Y.; Ebata, T.; Matsuda, A.; Kuno, A.; Ikehara, Y.; Shoda, J.; Narimatsu, H.; Nagino, M. Verification of WFA-sialylated MUC1 as a sensitive biliary biomarker for human biliary tract cancer. Ann. Surg. Oncol. 2016, 23, 671–677. [Google Scholar] [CrossRef] [PubMed]
- Iio, E.; Ocho, M.; Togayachi, A.; Nojima, M.; Kuno, A.; Ikehara, Y.; Hasegawa, I.; Yatsuhashi, H.; Yamasaki, K.; Shimada, N.; et al. A novel glycobiomarker, Wisteria floribunda agglutinin macrophage colony-stimulating factor receptor, for predicting carcinogenesis of liver cirrhosis. Int. J. Cancer 2016, 138, 1462–1471. [Google Scholar] [CrossRef] [PubMed]
- Sogabe, M.; Nozaki, H.; Tanaka, N.; Kubota, T.; Kaji, H.; Kuno, A.; Togayachi, A.; Gotoh, M.; Nakanishi, H.; Nakanishi, T.; et al. Novel glycobiomarker for ovarian cancer that detects clear cell carcinoma. J. Proteome Res. 2014, 13, 1624–1635. [Google Scholar] [CrossRef] [PubMed]
- Khabaz, M.N.; McClure, J.; McClure, S.; Stoddart, R.W. Glycophenotype of prostatic carcinomas. Folia Histochem. Cytobiol. 2010, 48, 637–645. [Google Scholar] [PubMed]
- Fukushima, K.; Satoh, T.; Baba, S.; Yamashita, K. α1,2-Fucosylated and β-N-acetylgalactosaminylated prostate-specific antigen as an efficient marker of prostatic cancer. Glycobiology 2010, 20, 452–460. [Google Scholar] [CrossRef] [PubMed]
- Kaya, T.; Kaneko, T.; Kojima, S.; Nakamura, Y.; Ide, Y.; Ishida, K.; Suda, Y.; Yamashita, K. High-sensitivity immunoassay with surface plasmon field-enhanced fluorescence spectroscopy using a plastic sensor chip: Application to quantitative analysis of total prostate-specific antigen and GalNAcβ1–4GlcNAc-linked prostate-specific antigen for prostate cancer diagnosis. Anal. Chem. 2015, 87, 1797–1803. [Google Scholar] [PubMed]
- Humphrey, P.A.; Moch, H.; Cubilla, A.L.; Ulbright, T.M.; Reuter, V.E. The 2016 WHO classification of tumours of the urinary system and male genital organs-part B: Prostate and bladder tumours. Eur. Urol. 2016, 70, 106–119. [Google Scholar] [CrossRef] [PubMed]
- Nguyen, D. Quantifying chromogen intensity in immunohistochemistry via reciprocal intensity. Protoc. Exchange 2013. [Google Scholar] [CrossRef]
- Harrell, F.E., Jr.; Lee, K.L.; Mark, D.B. Multivariable prognostic models: Issues in developing models, evaluating assumptions and adequacy, and measuring and reducing errors. Stat. Med. 1996, 15, 361–387. [Google Scholar] [CrossRef]
- Hatakeyama, S.; Yoneyama, T.; Tobisawa, Y.; Ohyama, C. Recent progress and perspectives on prostate cancer biomarkers. Int. J. Clin. Oncol. 2016. [Google Scholar] [CrossRef] [PubMed]
- Haider, M.A.; Yao, X.; Loblaw, A.; Finelli, A. Multiparametric magnetic resonance imaging in the diagnosis of prostate cancer: A systematic review. Clin. Oncol. 2016, 28, 550–567. [Google Scholar] [CrossRef] [PubMed]
- Nicholson, A.; Mahon, J.; Boland, A.; Beale, S.; Dwan, K.; Fleeman, N.; Hockenhull, J.; Dundar, Y. The clinical effectiveness and cost-effectiveness of the PROGENSA (R) prostate cancer antigen 3 assay and the prostate health index in the diagnosis of prostate cancer: A systematic review and economic evaluation. Health Technol. Assess. 2015, 19, 1–191. [Google Scholar] [CrossRef] [PubMed]
- Fujita, K.; Shimomura, M.; Uemura, M.; Nakata, W.; Sato, M.; Nagahara, A.; Nakai, Y.; Takamatsu, S.; Miyoshi, E.; Nonomura, N. Serum fucosylated haptoglobin as a novel prognostic biomarker predicting high-Gleason prostate cancer. Prostate 2014, 74, 1052–1058. [Google Scholar] [CrossRef] [PubMed]
- Okuyama, N.; Ide, Y.; Nakano, M.; Nakagawa, T.; Yamanaka, K.; Moriwaki, K.; Murata, K.; Ohigashi, H.; Yokoyama, S.; Eguchi, H.; et al. Fucosylated haptoglobin is a novel marker for pancreatic cancer: A detailed analysis of the oligosaccharide structure and a possible mechanism for fucosylation. Int. J. Cancer 2006, 118, 2803–2808. [Google Scholar] [CrossRef] [PubMed]
- Thompson, S.; Dargan, E.; Turner, G.A. Increased fucosylation and other carbohydrate changes in haptoglobin in ovarian cancer. Cancer Lett. 1992, 66, 43–48. [Google Scholar] [CrossRef]
- Li, Q.K.; Chen, L.; Ao, M.H.; Chiu, J.H.; Zhang, Z.; Zhang, H.; Chan, D.W. Serum fucosylated prostate-specific antigen (PSA) improves the differentiation of aggressive from non-aggressive prostate cancers. Theranostics 2015, 5, 267–276. [Google Scholar] [CrossRef] [PubMed]
- Stark, J.R.; Perner, S.; Stampfer, M.J.; Sinnott, J.A.; Finn, S.; Eisenstein, A.S.; Ma, J.; Fiorentino, M.; Kurth, T.; Loda, M.; et al. Gleason score and lethal prostate cancer: Does 3 + 4 = 4 + 3? J. Clin. Oncol. 2009, 27, 3459–3464. [Google Scholar] [CrossRef] [PubMed]
- Epstein, J.I.; Zelefsky, M.J.; Sjoberg, D.D.; Nelson, J.B.; Egevad, L.; Magi-Galluzzi, C.; Vickers, A.J.; Parwani, A.V.; Reuter, V.E.; Fine, S.W.; et al. A contemporary prostate cancer grading system: A validated alternative to the gleason score. Eur. Urol. 2016, 69, 428–435. [Google Scholar] [CrossRef] [PubMed]
- Koie, T.; Ohyama, C.; Hatakeyama, S.; Imai, A.; Yoneyama, T.; Hashimoto, Y.; Yoneyama, T.; Tobisawa, Y.; Hosogoe, S.; Yamamoto, H.; et al. Significance of preoperative butyrylcholinesterase as an independent predictor of biochemical recurrence-free survival in patients with prostate cancer treated with radical prostatectomy. Int. J. Clin. Oncol. 2016, 21, 379–383. [Google Scholar] [CrossRef] [PubMed]


| Characteristics | BPH a | PCa b | BPH-> PCa | p (a vs. b) | ||
|---|---|---|---|---|---|---|
| n = 442 | 184 | 244 | 14 | |||
| Age, median (range) | 69 (30–87) | 68 (44–85) | 69 (52–80) | ns 1 | ||
| PSA 2, ng/mL, median (range) | 6.8 (0.4–19.7) | 9.0 (1.2–62.6) | 6.3 (5.9–19.7) | <0.001 | ||
| PSA-Gi, U/mL, median (range) | 0.0715 (0.001–0.86) | 0.165 (0.002–2.43) | 0.113 (0.04–0.87) | <0.001 | ||
| PSA-Gi/total PSA, U/ng, median (range) | 0.0100 (0.00–0.1150) | 0.0200 (0.002–0.1980) | 0.0135 (0.003–0.0640) | <0.001 | ||
| Clinical T stage, n (%) | n = 244 | |||||
| cT1 | 144 | (59.3) | ||||
| cT2 | 46 | (18.5) | ||||
| cT3 | 55 | (22.2) | ||||
| Pbx GS 3, n (%) Pbx GG 4 | n = 244 | |||||
| 3 + 3 1 | 6 | (2.4) | ||||
| 3 + 4 2 | 79 | (32.4) | ||||
| 4 + 3 3 | 29 | (11.9) | ||||
| 4 + 4 4 | 30 | (12.3) | ||||
| 3 + 5 4 | 3 | (1.2) | ||||
| 4 + 5 5 | 72 | (29.5) | ||||
| 5 + 4 5 | 20 | (8.2) | ||||
| 5 + 5 5 | 5 | (2.0) | ||||
| Pathological T stage, n (%) | n = 92 | n = 8 | ||||
| pT1 | 4 | (4.3) | 0 | (0) | ||
| pT2 | 53 | (57.6) | 5 | (62.5) | ||
| pT3 | 38 | (41.3) | 3 | (37.5) | ||
| Ope GS 5, n (%) Ope GG 6 | n = 92 | n = 8 | ||||
| 3 + 3 1 | 1 | (1.1) | ||||
| 3 + 4 2 | 13 | (14.1) | 2 | (25.0) | ||
| 4 + 3 3 | 14 | (15.2) | ||||
| 3 + 5 4 | 3 | (3.2) | 1 | (12.5) | ||
| 4 + 4 4 | 9 | (9.8) | 1 | (12.5) | ||
| 5 + 3 4 | 1 | (1.1) | ||||
| 4 + 5 5 | 37 | (40.2) | 3 | (37.5) | ||
| 5 + 4 5 | 12 | (13.0) | 1 | (12.5) | ||
| 5 + 5 5 | 2 | (2.2) | ||||
| Test Name | PSA Range | AUC | 95% CI | p (vs. a) | p (vs. b) | p (vs. c) |
|---|---|---|---|---|---|---|
| Total PSA a | - | 0.638 | 0.586–0.691 | - | <0.0001 | 0.0376 |
| PSA-Gi b | 20 ng/mL | 0.795 | 0.753–0.837 | <0.0001 | - | 0.0003 |
| PSA-Gi/total PSAc | - | 0.734 | 0.586–0.691 | 0.0376 | 0.0003 | - |
| Total PSA a | - | 0.550 | 0.483–0.618 | - | <0.0001 | <0.0001 |
| PSA-Gi b | 10 ng/mL | 0.752 | 0.690–0.813 | <0.0001 | - | 0.567 |
| PSA-Gi/total PSA c | - | 0.719 | 0.659–0.779 | 0.0009 | 0.0009 | - |
| Characteristics | WFA-Reactivity | p | ||||||
|---|---|---|---|---|---|---|---|---|
| Weakly Positive a | Moderately Positive b | Strongly Positive c | a vs. b + c | |||||
| n, Total = 260 | 51 | 95 | 112 | |||||
| Age, median (range) | 68 (48–75) | 68 (56–76) | 68 (52–78) | 0.555 | ||||
| PSA 1, ng/mL, median (range) | 7.5 (2.3–18.4) | 7.4 (0.6–27.6) | 7.5 (0.5–35.9) | 0.473 | ||||
| Pathological T stage, n (%) | 0.008 2 | |||||||
| pT2, n = 163 | 41 | (26.4) | 48 | (29.4) | 72 | (44.2) | 0.002 | |
| pT3, n = 96 | 10 | (10.4) | 47 | (49.0) | 39 | (40.6) | 0.002 | |
| pT4, n = 1 | 0 | (0) | 0 | (0) | 1 | (100) | 0.612 | |
| Ope GS 3, n (%) | Ope GG 4 | 0.045 2 | ||||||
| 3 + 3, n = 11 | Ope GG 1 | 5 | (45.4) | 3 | (27.3) | 3 | (27.3) | 0.035 |
| 3 + 4, n = 112 | Ope GG 2 | 28 | (26.5) | 34 | (27.9) | 50 | (44.6) | 0.108 |
| 4 + 3, n = 63 | Ope GG 3 | 13 | (19.3) | 28 | (45.2) | 22 | (35.5) | 0.955 |
| 4 + 4, n = 9 | Ope GG 4 | 2 | (22.3) | 3 | (33.3) | 4 | (44.4) | 0.889 |
| 3 + 5, n = 9 | Ope GG 4 | 1 | (11.1) | 3 | (33.3) | 5 | (55.6) | 0.482 |
| 4 + 5, n = 42 | Ope GG 5 | 4 | (9.5) | 17 | (40.5) | 21 | (50.0) | 0.056 |
| 5 + 4, n = 14 | Ope GG 5 | 0 | (0) | 7 | (50.0) | 7 | (50.0) | 0.052 |
| pn 5, n (%) | ||||||||
| pn−, n = 56 | 21 | (37.5) | 18 | (32.1) | 17 | (30.4) | <0.001 | |
| pn+, n = 204 | 32 | (15.7) | 77 | (37.7) | 95 | (46.6) | <0.001 | |
| RM 6, n (%) | ||||||||
| RM−, n = 188 | 43 | (22.9) | 65 | (34.6) | 80 | (42.5) | 0.108 | |
| RM+, n = 72 | 10 | (13.9) | 30 | (41.7) | 32 | (44.4) | 0.108 | |
| PSA failure, n (%) | ||||||||
| −, n = 194 | 49 | (25.3) | 66 | (34.0) | 79 | (40.7) | <0.001 | |
| +, n = 66 | 4 | (6.1) | 29 | (43.9) | 33 | (50.0) | <0.001 | |
| Variable | Hazard Ratio | Standard Error | p |
|---|---|---|---|
| Age | 1.046 | 0.027 | 0.099 |
| WFA-reactivity | 2.831 | 0.529 | 0.049 |
| pT 1 | 1.589 | 0.336 | 0.168 |
| Grade group | 1.246 | 0.099 | 0.027 |
| RM 2 | 2.424 | 0.319 | 0.006 |
| pn 3 | 1.715 | 0.447 | 0.227 |
© 2017 by the authors. Licensee MDPI, Basel, Switzerland. This article is an open access article distributed under the terms and conditions of the Creative Commons Attribution (CC BY) license ( http://creativecommons.org/licenses/by/4.0/).
Share and Cite
Hagiwara, K.; Tobisawa, Y.; Kaya, T.; Kaneko, T.; Hatakeyama, S.; Mori, K.; Hashimoto, Y.; Koie, T.; Suda, Y.; Ohyama, C.; et al. Wisteria floribunda Agglutinin and Its Reactive-Glycan-Carrying Prostate-Specific Antigen as a Novel Diagnostic and Prognostic Marker of Prostate Cancer. Int. J. Mol. Sci. 2017, 18, 261. https://0-doi-org.brum.beds.ac.uk/10.3390/ijms18020261
Hagiwara K, Tobisawa Y, Kaya T, Kaneko T, Hatakeyama S, Mori K, Hashimoto Y, Koie T, Suda Y, Ohyama C, et al. Wisteria floribunda Agglutinin and Its Reactive-Glycan-Carrying Prostate-Specific Antigen as a Novel Diagnostic and Prognostic Marker of Prostate Cancer. International Journal of Molecular Sciences. 2017; 18(2):261. https://0-doi-org.brum.beds.ac.uk/10.3390/ijms18020261
Chicago/Turabian StyleHagiwara, Kazuhisa, Yuki Tobisawa, Takatoshi Kaya, Tomonori Kaneko, Shingo Hatakeyama, Kazuyuki Mori, Yasuhiro Hashimoto, Takuya Koie, Yoshihiko Suda, Chikara Ohyama, and et al. 2017. "Wisteria floribunda Agglutinin and Its Reactive-Glycan-Carrying Prostate-Specific Antigen as a Novel Diagnostic and Prognostic Marker of Prostate Cancer" International Journal of Molecular Sciences 18, no. 2: 261. https://0-doi-org.brum.beds.ac.uk/10.3390/ijms18020261