
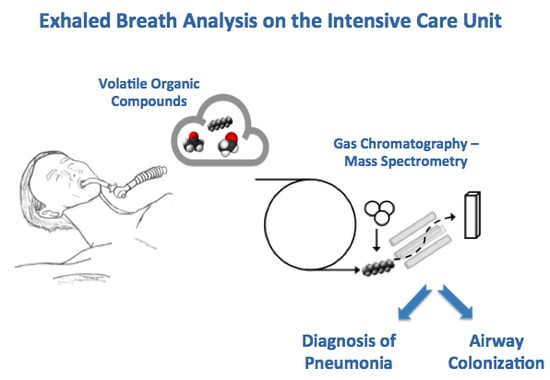
Exhaled Breath Metabolomics for the Diagnosis of Pneumonia in Intubated and Mechanically-Ventilated Intensive Care Unit (ICU)-Patients

 , , , ,
Abstract
:
1. Introduction
2. Results
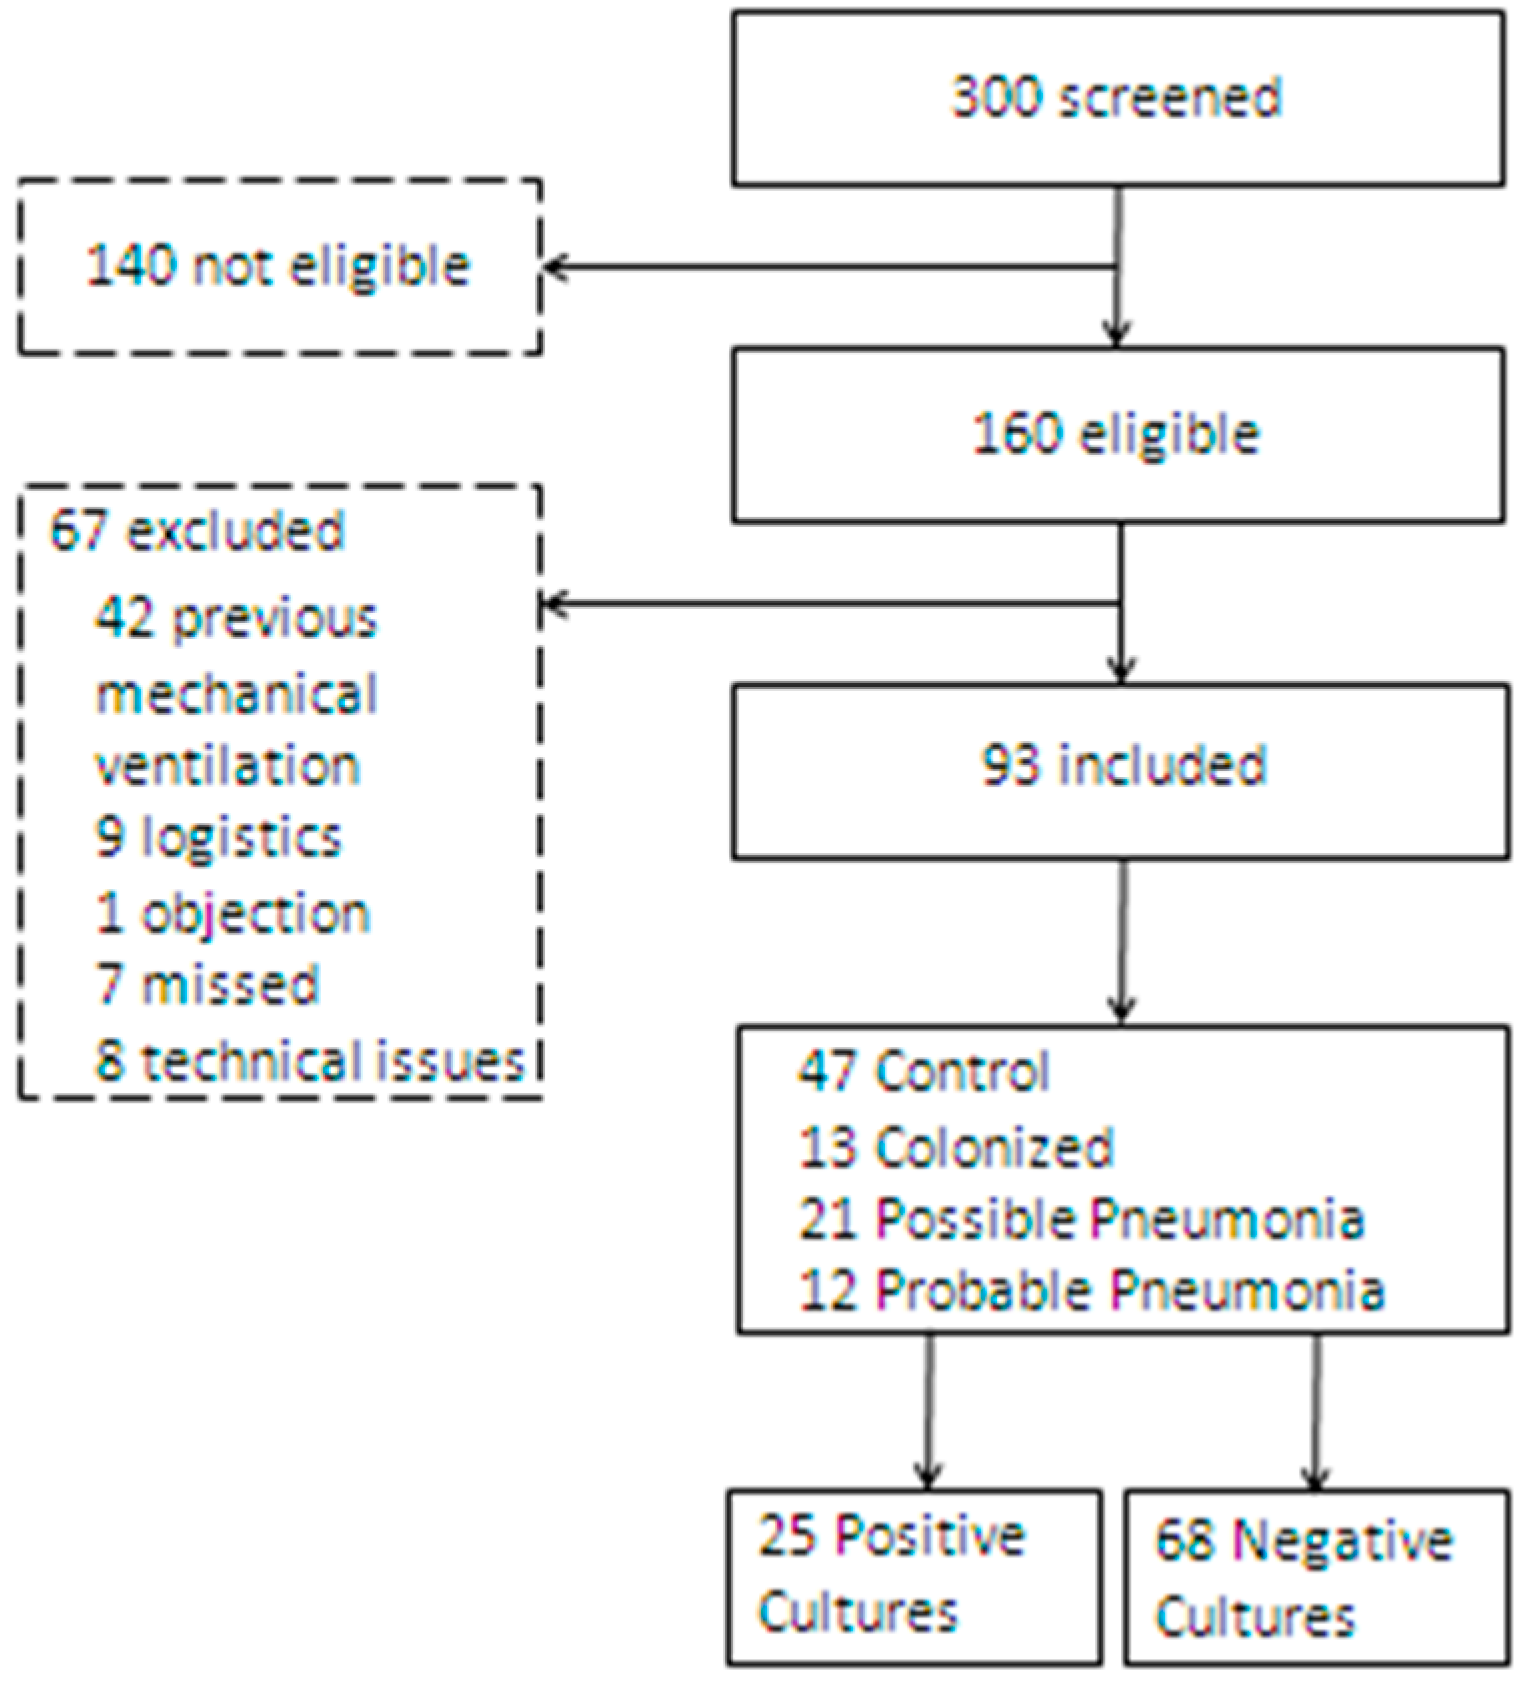
2.1. Subjects
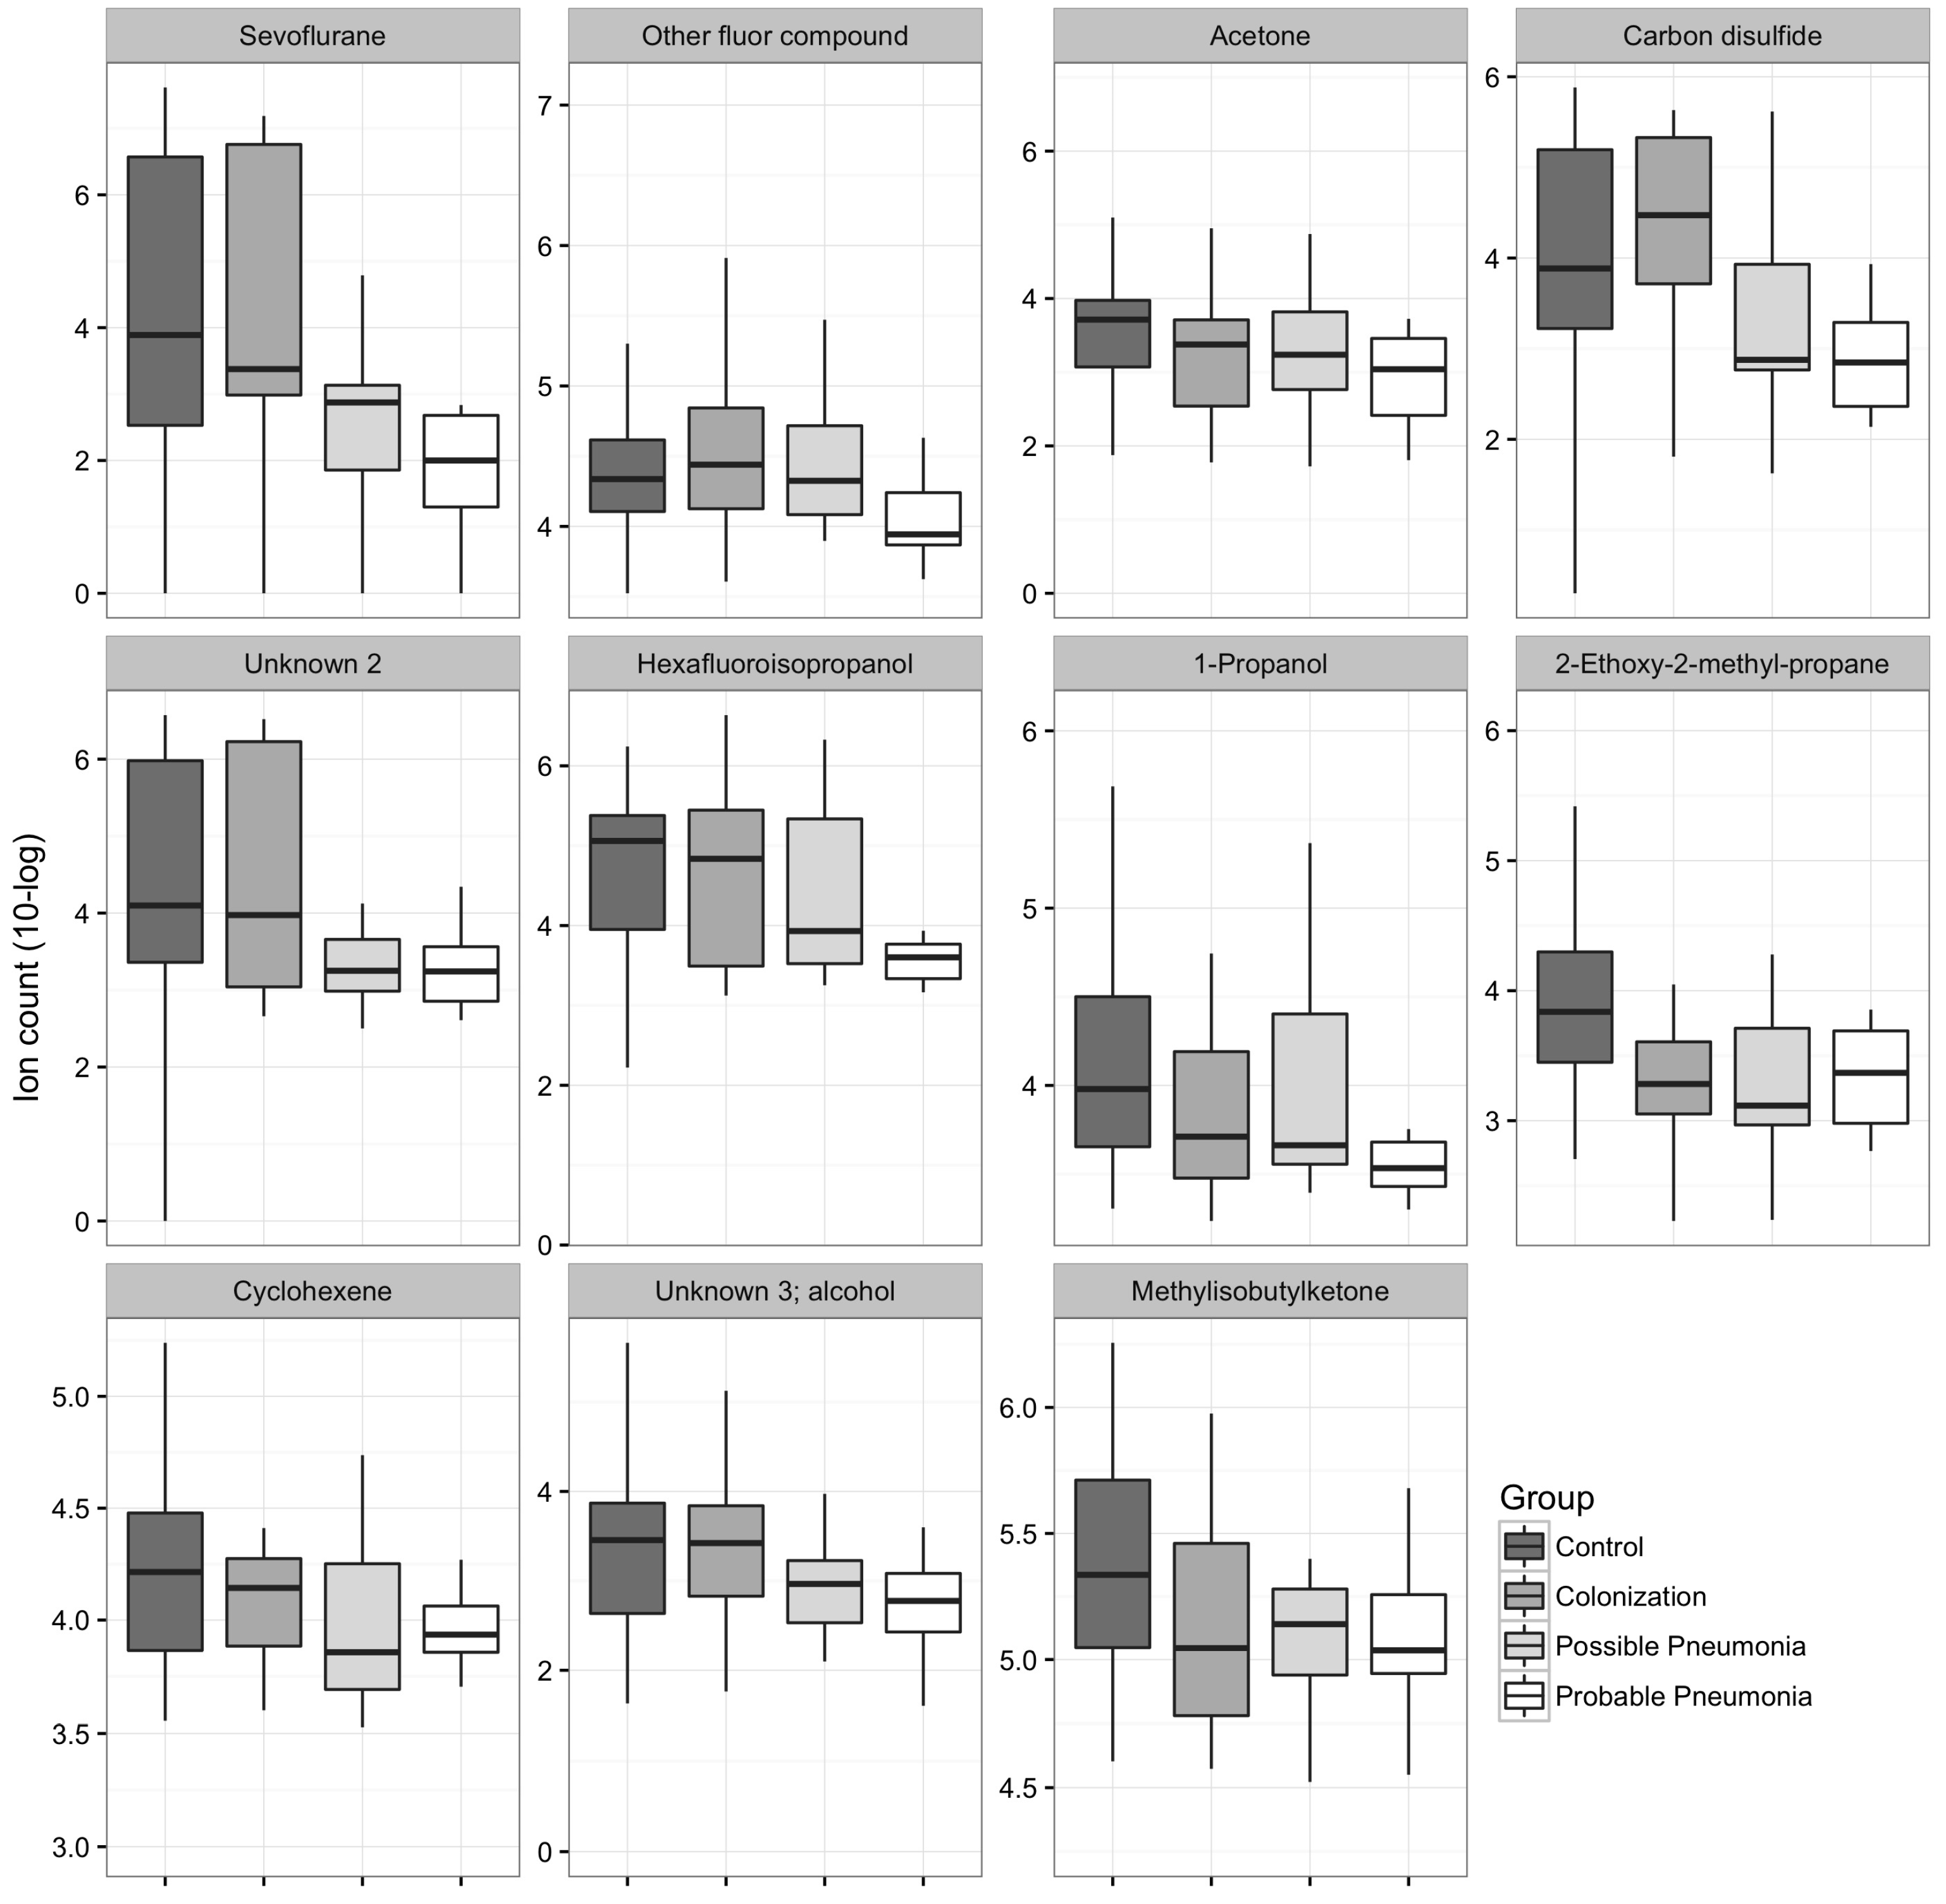
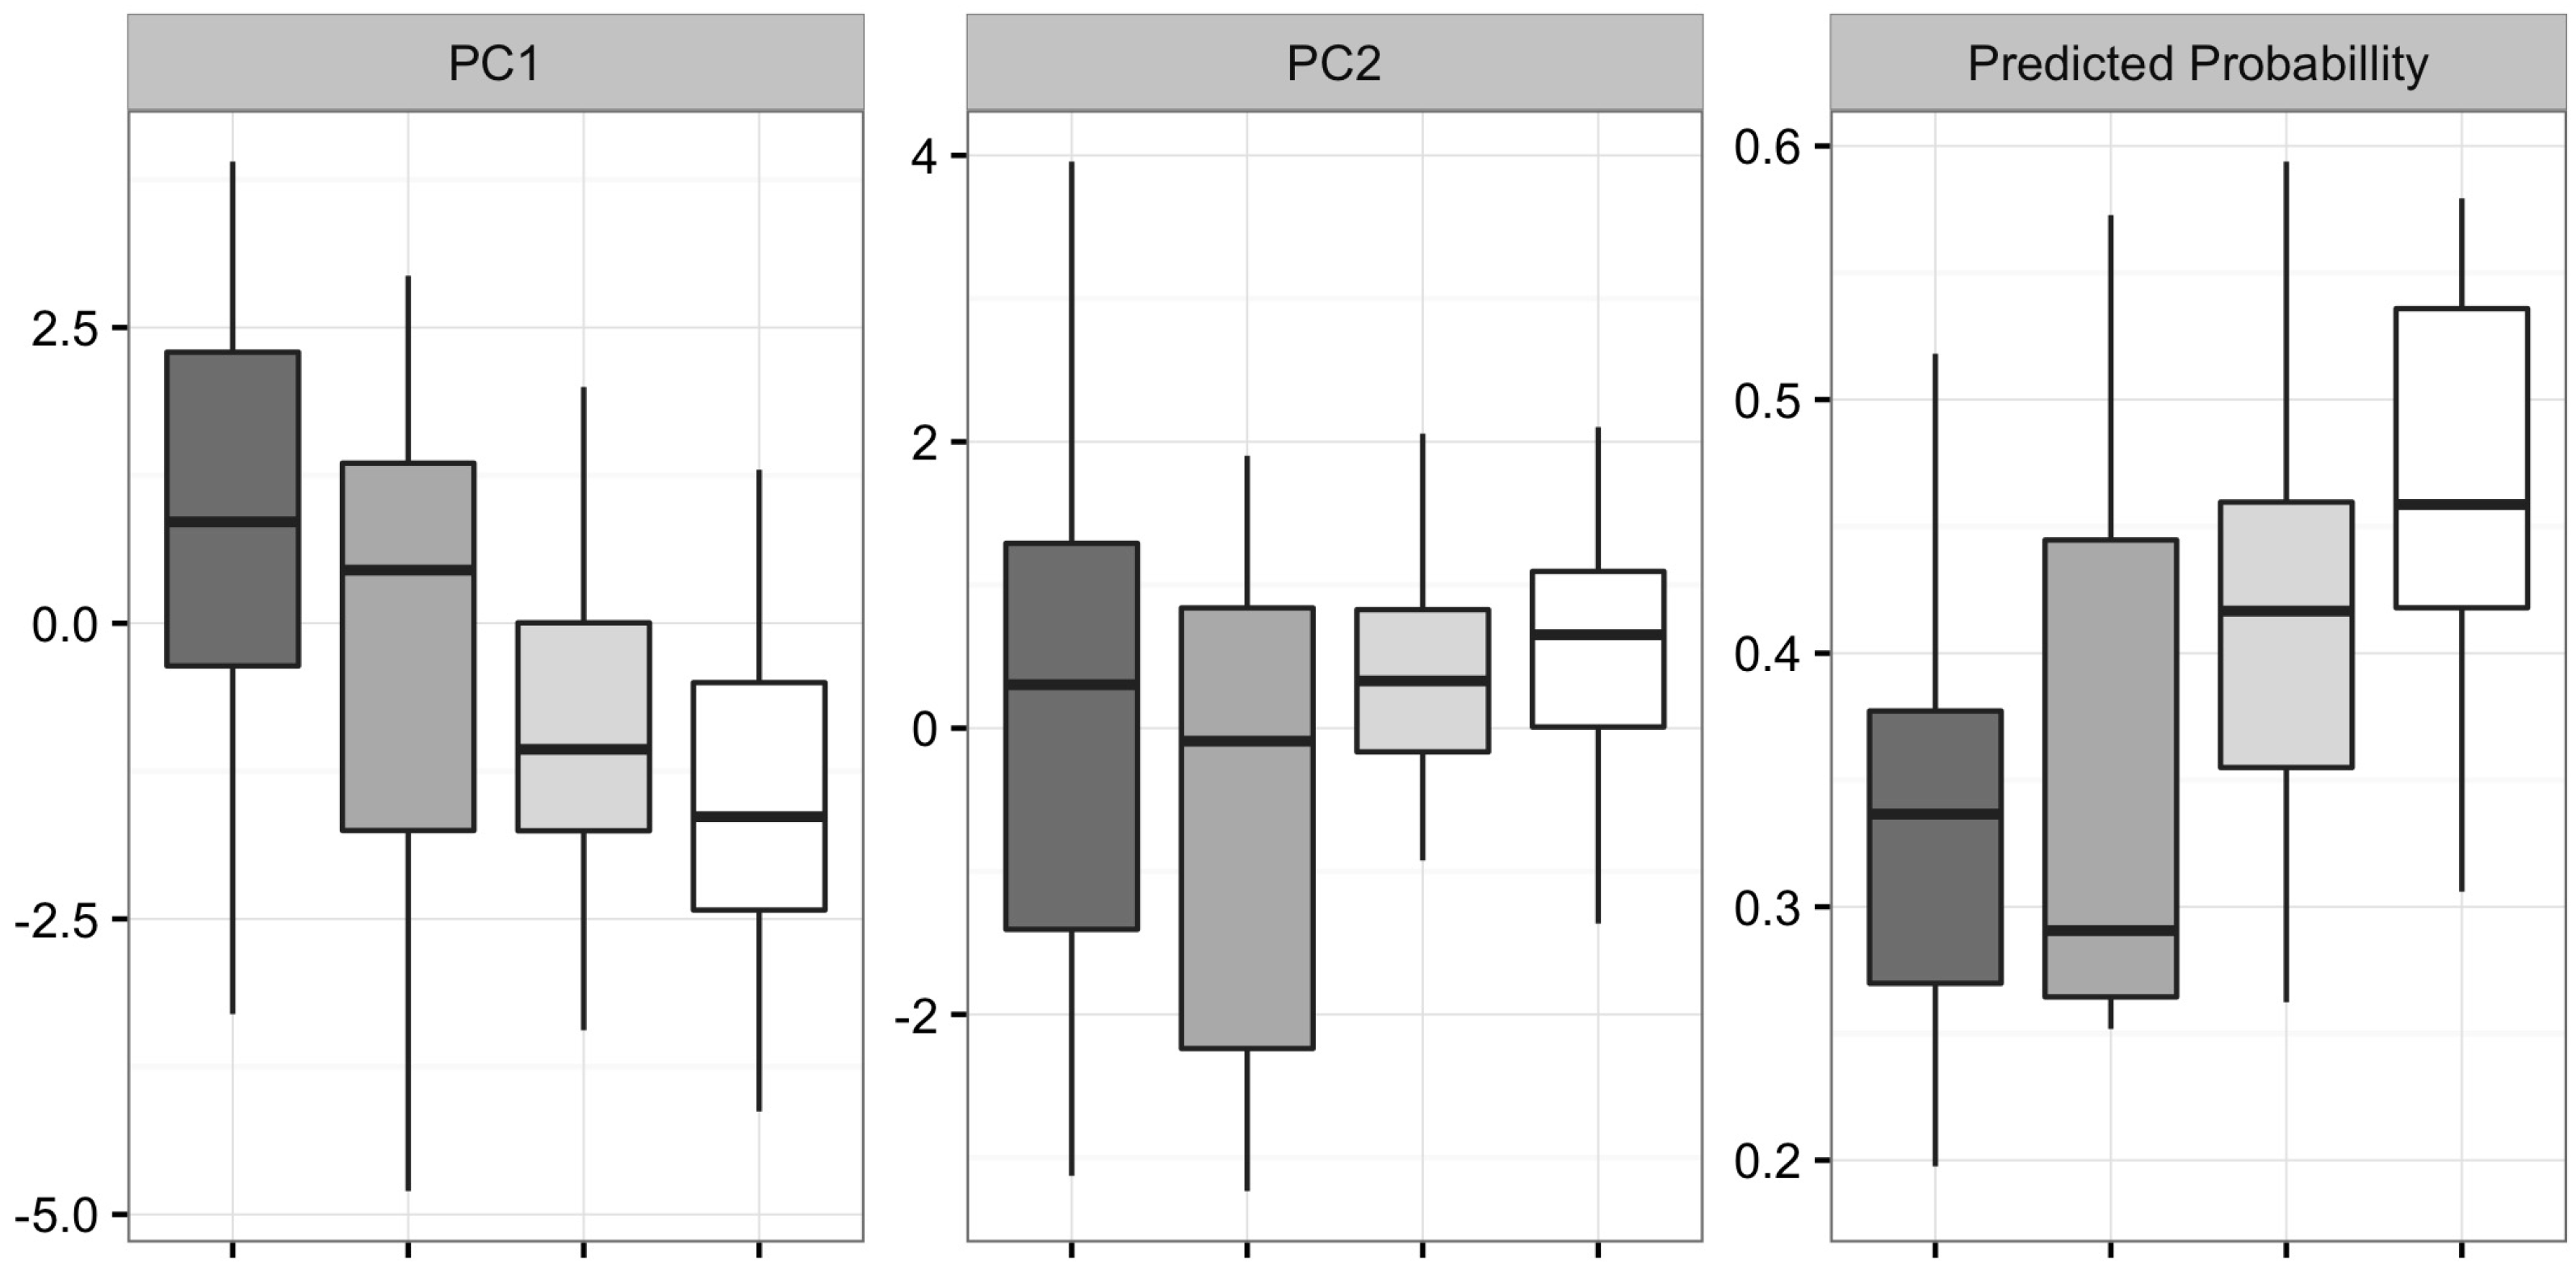
2.2. Probable Pneumonia vs. Controls (Patients without Pneumonia and without Colonized Airways)
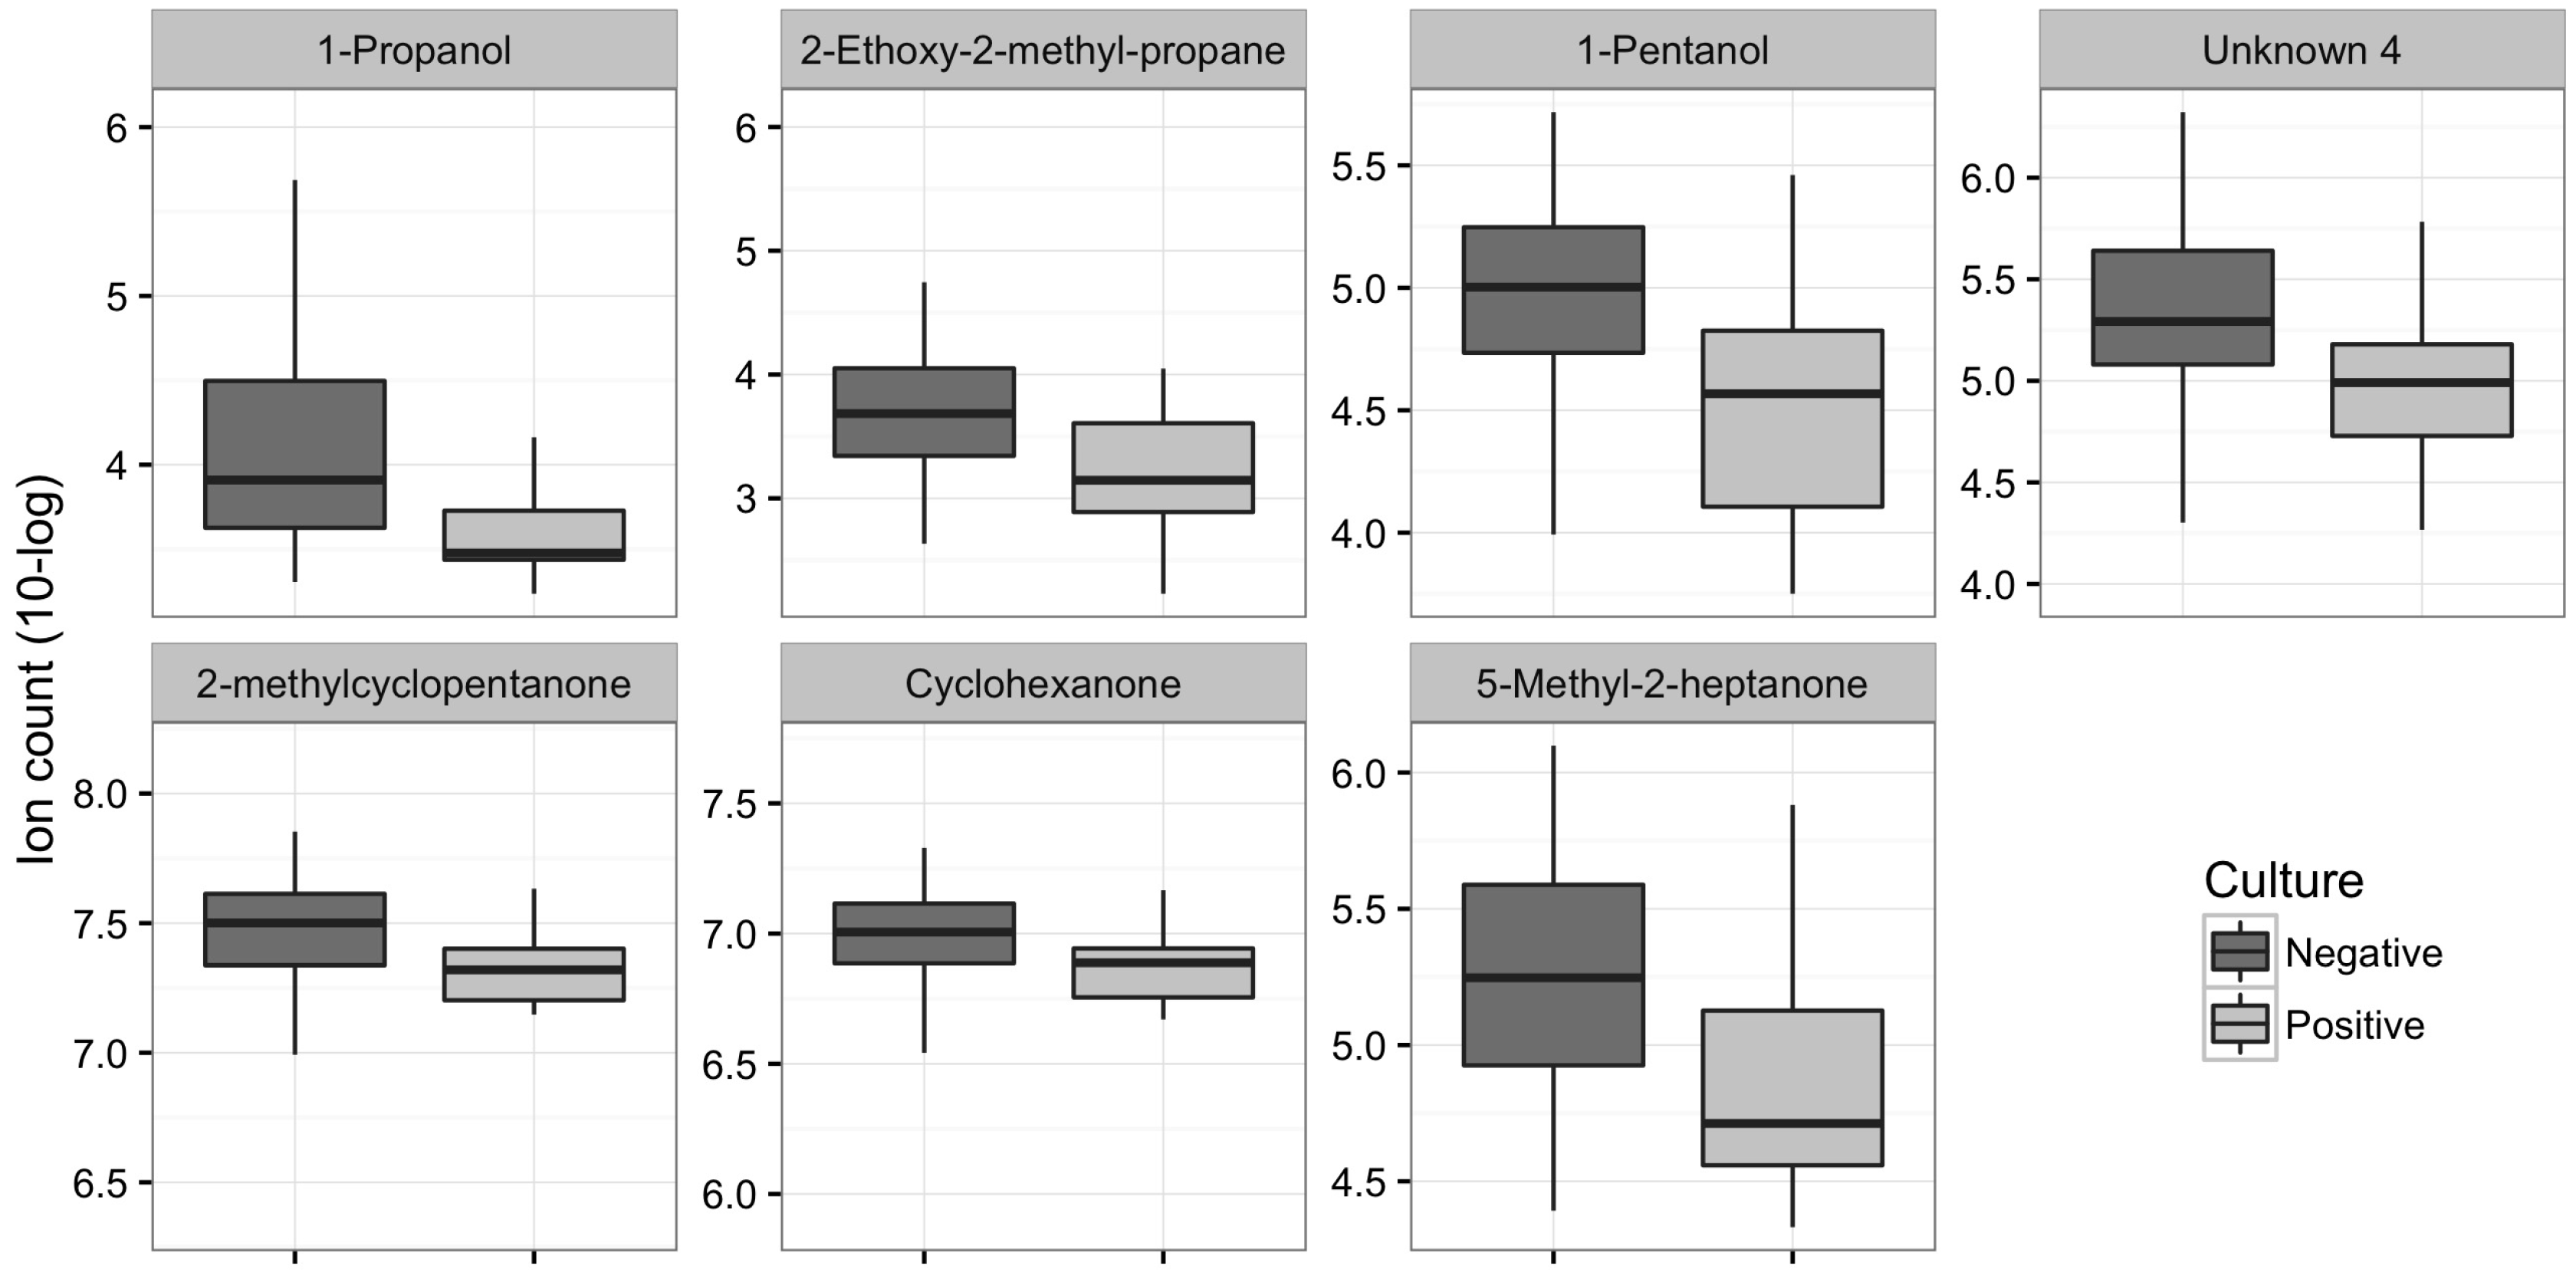
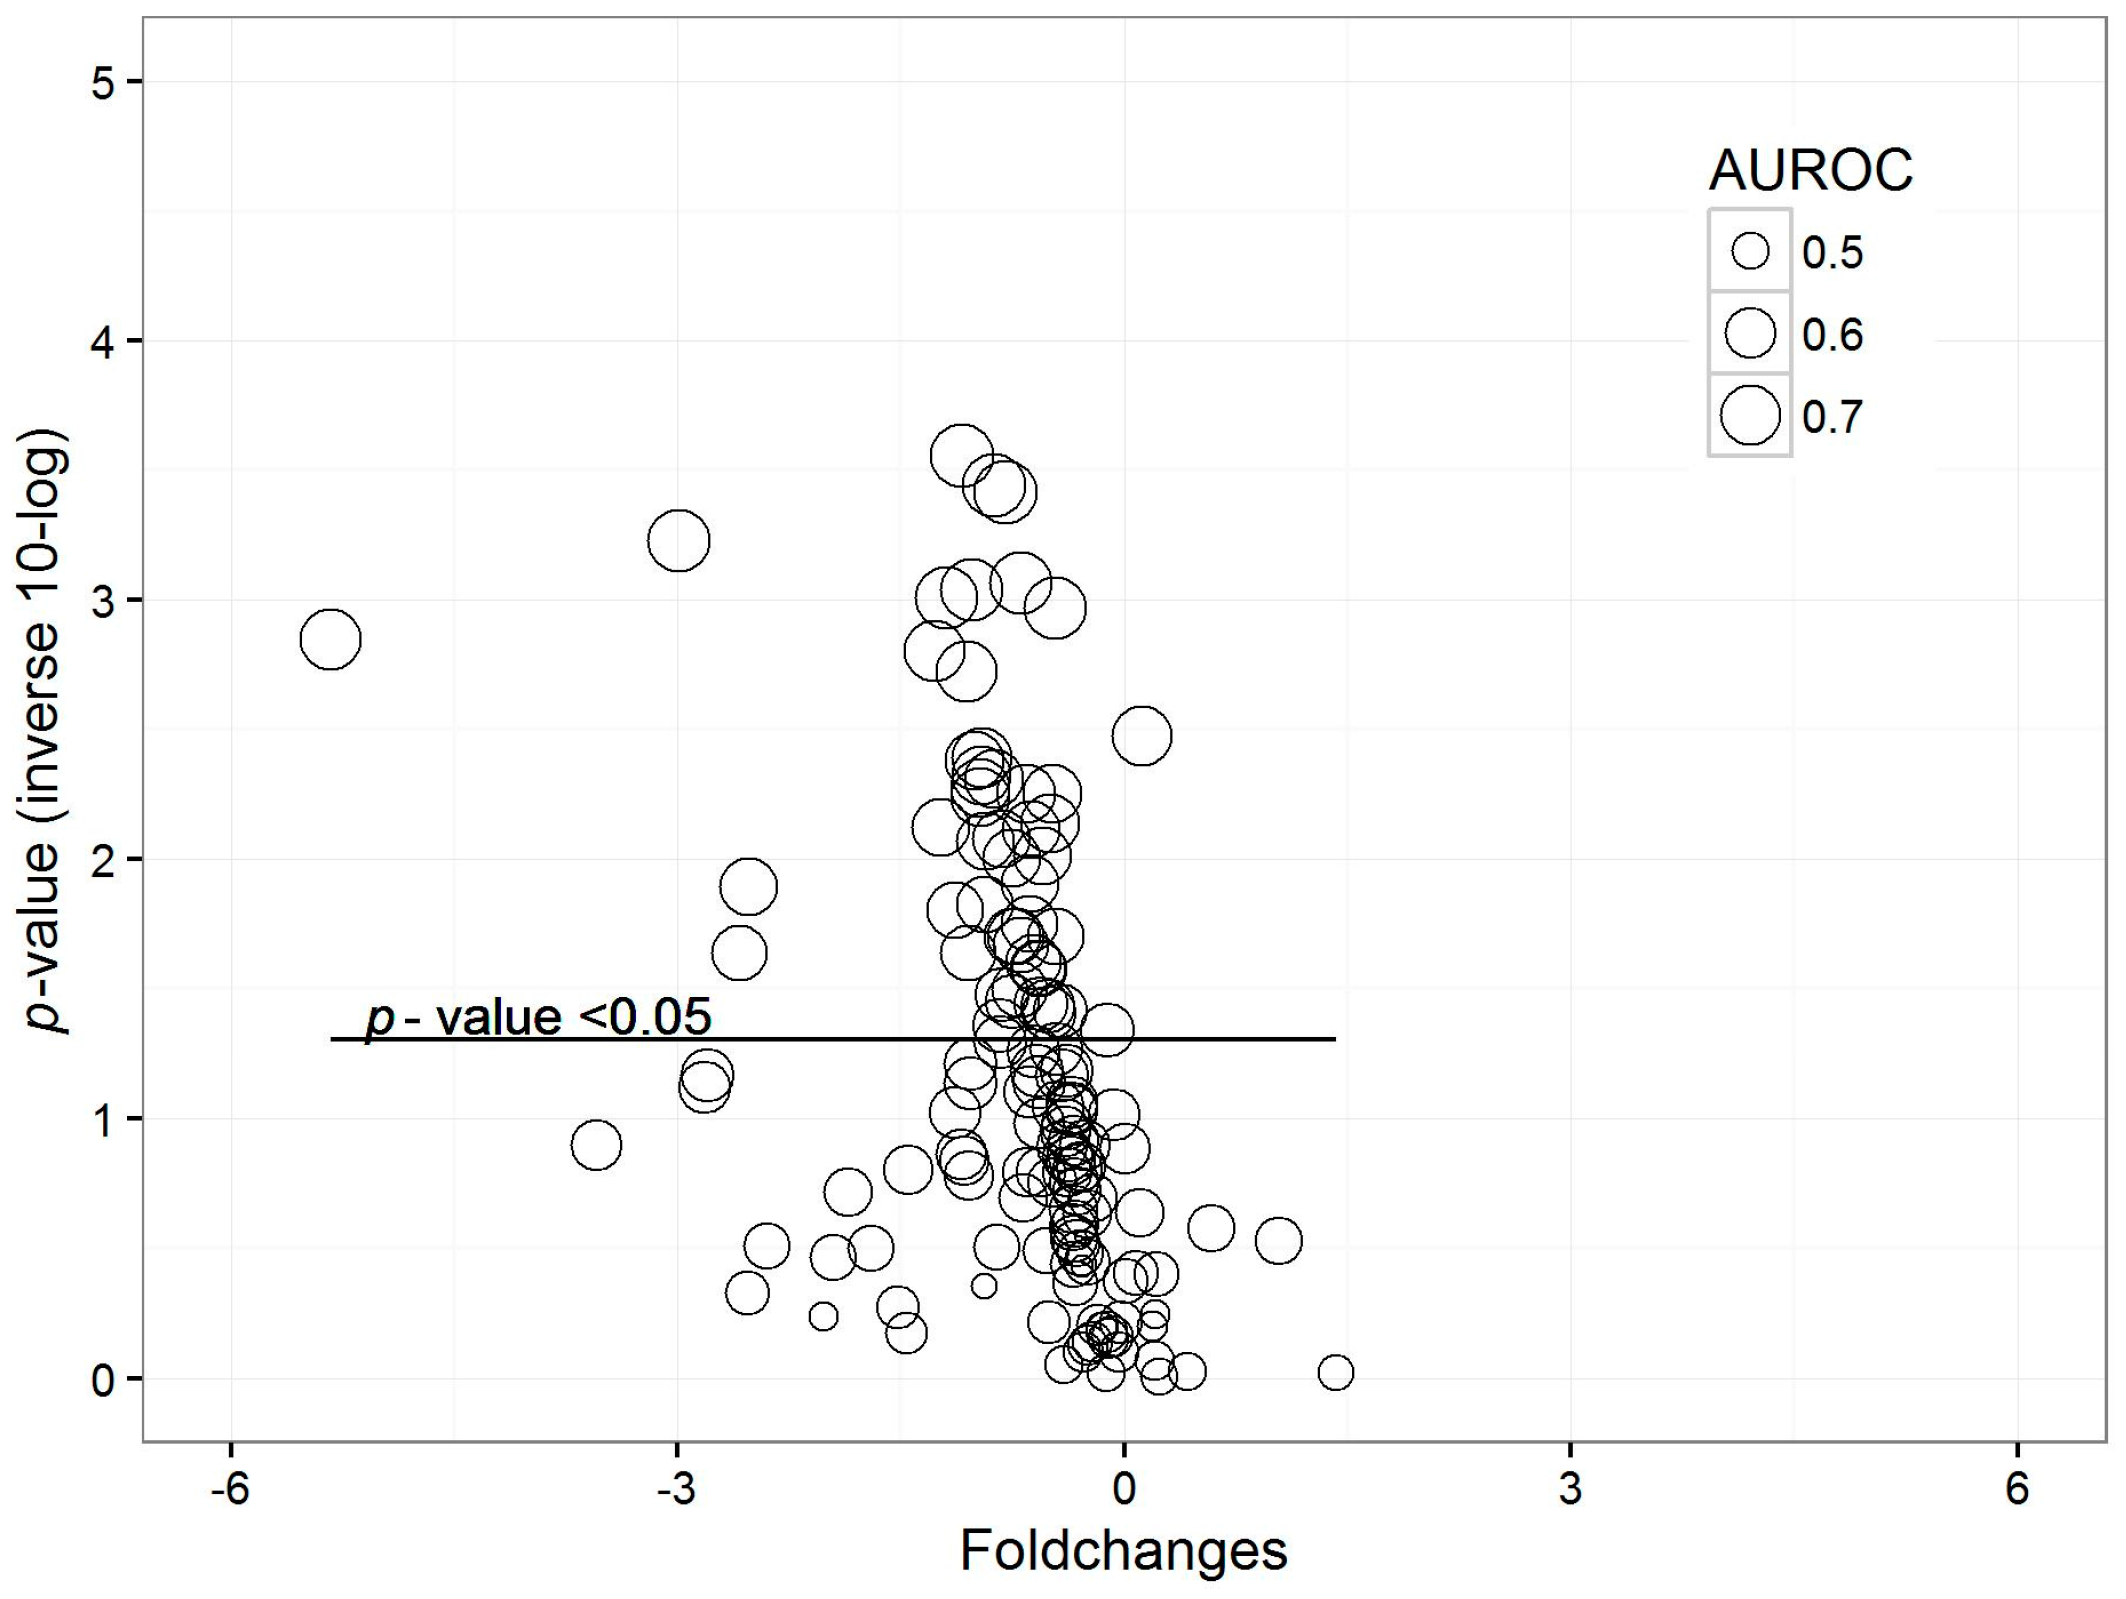
2.3 Patients with Positive Cultures vs. Patients with Negative Cultures
3. Discussion
4. Materials and Methods
4.1. Design, Subjects, and Setting
4.2. Clinical Diagnosis of Pneumonia
4.3. Exhaled Breath Analysis and Data Pre-Processing
4.4. Group Comparisons and Analysis Plan
4.5. Data Analysis
Acknowledgments
Author Contributions
Conflicts of Interest
Abbreviations
| ARDS | Acute Respiratory Distress Syndrome |
| AUROC | Area under the receiver operating characteristics curve |
| BAL | Bronchoalveolar lavage |
| CAP | Community-acquired pneumonia |
| CI | Confidence interval |
| COPD | Chronic Obstructive Pulmonary Disease |
| HAP | Hospital-acquired pneumonia |
| ICU | Intensive care unit |
| TD-GC-MS | Thermal desorption-gas chromatography-mass spectrometry |
| PC | Principal component |
| PLSDA | Partial least squares discriminant analysis |
| PSB | Protected specimen brush |
| VAP | Ventilator-associated pneumonia |
| VOC | Volatile organic compound |
References
- Woodhead, M.; Welch, C.A.; Harrison, D.A.; Bellingan, G.; Ayres, J.G. Community-acquired pneumonia on the intensive care unit: Secondary analysis of 17,869 cases in the ICNARC Case Mix Programme Database. Crit. Care 2006, 10 (Suppl. 2), S1. [Google Scholar] [CrossRef] [PubMed]
- Koulenti, D.; Lisboa, T.; Brun-Buisson, C.; Krueger, W.; Macor, A.; Sole-Violan, J.; Diaz, E.; Topeli, A.; DeWaele, J.; Carneiro, A.; et al. Spectrum of practice in the diagnosis of nosocomial pneumonia in patients requiring mechanical ventilation in European intensive care units. Crit. Care Med. 2009, 37, 2360–2368. [Google Scholar] [CrossRef] [PubMed]
- Wipf, J.E.; Lipsky, B.; Hirschmann, J.; Boyko, E.; Takasugi, J.; Peugeot, R.; Davis, C. Diagnosing Pneumonia by Physical Examination: Relevant or relic? Arch. Intern. Med. 1999, 159, 1082–1087. [Google Scholar] [CrossRef] [PubMed]
- Self, W.H.; Courtney, D.M.; McNaughton, C.D.; Wunderink, R.G.; Kline, J.A. High discordance of chest X-ray and computed tomography for detection of pulmonary opacities in ED patients: Implications for diagnosing pneumonia. Am. J. Emerg. Med. 2013, 31, 401–405. [Google Scholar] [CrossRef] [PubMed]
- Said, M.A.; Johnson, H.L.; Nonyane, B.A.S.; Deloria-Knoll, M.; OBrien, K.L. Estimating the Burden of Pneumococcal Pneumonia among Adults: A Systematic Review and Meta-Analysis of Diagnostic Techniques. PLoS ONE 2013, 8. [Google Scholar] [CrossRef] [PubMed] [Green Version]
- Slupsky, C.M.; Cheypesh, A.; Chao, D.V.; Fu, H.; Rankin, K.N.; Marrie, T.J.; Lacy, P. Streptococcus pneumoniae and Staphylococcus aureus pneumonia induce distinct metabolic responses. J. Proteome Res. 2009, 8, 3029–3036. [Google Scholar] [CrossRef] [PubMed]
- Moens, M.; Smet, A.; Naudts, B.; Verhoeven, J.; Ieven, M.; Jorens, P.; Geise, H.J.; Blockhuys, F. Fast identification of ten clinically important micro-organisms using an electronic nose. Lett. Appl. Microbiol. 2006, 42, 121–126. [Google Scholar] [CrossRef] [PubMed]
- Schöller, C.; Molin, S.; Wilkins, K. Volatile metabolites from some Gram-negative bacteria. Chemosphere 1997, 35, 1487–1495. [Google Scholar] [CrossRef]
- Dolch, M.E.; Hornuss, C.; Klocke, C.; Praun, S.; Villinger, J.; Denzer, W.; Schelling, G.; Schubert, S. Volatile organic compound analysis by ion molecule reaction mass spectrometry for Gram-positive bacteria differentiation. Eur. J. Clin. Microbiol. Infect. Dis. 2012, 31, 3007–3013. [Google Scholar] [CrossRef] [PubMed]
- Shestivska, V.; Španěl, P.; Dryahina, K.; Sovová, K.; Smith, D.; Musílek, M.; Nemec, A. Variability in the concentrations of volatile metabolites emitted by genotypically different strains of Pseudomonas aeruginosa. J. Appl. Microbiol. 2012, 113, 701–713. [Google Scholar] [CrossRef] [PubMed]
- Thorn, R.M.S.; Reynolds, D.M.; Greenman, J. Multivariate analysis of bacterial volatile compound profiles for discrimination between selected species and strains in vitro. J. Microbiol. Methods 2011, 84, 258–264. [Google Scholar] [CrossRef] [PubMed]
- Zhu, J.; Bean, H.D.; Kuo, Y.M.; Hill, J.E. Fast detection of volatile organic compounds from bacterial cultures by secondary electrospray ionization-mass spectrometry. J. Clin. Microbiol. 2010, 48, 4426–4431. [Google Scholar] [CrossRef] [PubMed]
- Bos, L.D.J.; Sterk, P.J.; Schultz, M.J. Volatile Metabolites of Pathogens: A Systematic Review. PLoS Pathog. 2013, 9, e1003311. [Google Scholar] [CrossRef] [PubMed]
- Schnabel, R.; Fijten, R.; Smolinska, A.; Dallinga, J.; Boumans, M.-L.; Stobberingh, E.; Boots, A.; Roekaerts, P.; Bergmans, D.; van Schooten, F.J. Analysis of volatile organic compounds in exhaled breath to diagnose ventilator-associated pneumonia. Sci. Rep. 2015, 5, 17179. [Google Scholar] [CrossRef] [PubMed]
- Boots, A.W.; van Berkel, J.J.B.N.; Dallinga, J.W.; Smolinska, A.; Wouters, E.F.; van Schooten, F.J. The versatile use of exhaled volatile organic compounds in human health and disease. J. Breath Res. 2012, 6, 27108. [Google Scholar] [CrossRef] [PubMed]
- Balthazar, A.B.; Von Nowakonski, A.; de Capitani, E.M.; Bottini, P.V.; Terzi, R.G.G.; Araújo, S. Diagnostic investigation of ventilator-associated pneumonia using bronchoalveolar lavage: Comparative study with a postmortem lung biopsy. Braz. J. Med. Biol. Res. 2001, 34, 993–1001. [Google Scholar] [CrossRef] [PubMed]
- Seligman, R.; Seligman, B.G.S.; Konkewicz, L.; Dos Santos, R.P. Accuracy of tracheal aspirate gram stain in predicting Staphylococcus aureus infection in ventilator-associated pneumonia. BMC Anesthesiol. 2015, 15, 19. [Google Scholar] [CrossRef] [PubMed]
- Chastre, J.; Fagon, J.Y. Invasive diagnostic testing should be routinely used to manage ventilated patients with suspected pneumonia. Am. J. Respir. Crit. Care Med. 1994, 150, 570–574. [Google Scholar] [CrossRef] [PubMed]
- Woodhead, E.M.; Schaberg, T.; Ioanas, M.; Ferrer, R.; Angrill, J.; Ferrer, M.; Torres, A. Microbial investigation in ventilator-associated pneumonia. Eur. Respir. J. 2001, 791–801. [Google Scholar]
- Mondi, M.M.; Chang, M.C.; Bowton, D.L.; Kilgo, P.D.; Meredith, J.W.; Miller, P.R. Prospective Comparison of Bronchoalveolar Lavage and Quantitative Deep Tracheal Aspirate in the Diagnosis of Ventilator Associated Pneumonia. J. Trauma Inj. Infect. Crit. Care 2005, 59, 891–896. [Google Scholar] [CrossRef]
- Rutjes, A.W.; Reitsma, J.B.; Coomarasamy, A.; Khan, K.S.; Bossuyt, P.M. Evaluation of diagnostic tests when there is no gold standard. A review of methods. Health Technol. Assess. 2007. [Google Scholar] [CrossRef]
- Christ-Crain, M.; Opal, S.M. Clinical review: The role of biomarkers in the diagnosis and management of community-acquired pneumonia. Crit Care 2010, 14, 203. [Google Scholar] [CrossRef] [PubMed]
- Fens, N.; de Nijs, S.B.; Peters, S.; Dekker, T.; Knobel, H.H.; Vink, T.J.; Willard, N.P.; Zwinderman, A.H.; Krouwelse, F.H.; Janssen, H.G.; et al. Exhaled air molecular profiling in relation to inflammatory subtype and activity in COPD. Eur. Respir. J. 2011, 38, 1301–1309. [Google Scholar] [CrossRef] [PubMed]
- Van Berkel, J.J.B.N.; Dallinga, J.W.; Moller, G.M.; Godschalk, R.W.L.; Moonen, E.J.; Wouters, E.F.M.; van Schooten, F.J. A profile of volatile organic compounds in breath discriminates COPD patients from controls. Respir. Med. 2010, 104, 557–563. [Google Scholar] [CrossRef] [PubMed]
- Phillips, M.; Basa-Dalay, V.; Bothamley, G.; Cataneo, R.N.; Lam, P.K.; Natividad, M.P.R.; Schmitt, P.; Wai, J. Breath biomarkers of active pulmonary tuberculosis. Tuberculosis 2010, 90, 145–151. [Google Scholar] [CrossRef] [PubMed]
- Bos, L.D.J.; Weda, H.; Wang, Y.; Knobel, H.H.; Nijsen, T.M.E.; Vink, T.J.; Zwinderman, A.H.; Sterk, P.J.; Schultz, M.J. Exhaled breath metabolomics as a noninvasive diagnostic tool for acute respiratory distress syndrome. Eur. Respir. J. 2014, 44, 188–197. [Google Scholar] [CrossRef] [PubMed]
- Van der Schee, M.P.; Paff, T.; Brinkman, P.; van Aalderen, W.M.C.; Haarman, E.G.; Sterk, P.J. Breathomics in Lung Disease. CHEST J. 2015, 147, 224. [Google Scholar] [CrossRef] [PubMed]
- Jareno-Esteban, J.J.; Munoz-Lucas, M.A.; Gomez-Martin, O.; Utrilla-Trigo, S.; Aquilar-Ros, A.; Collado-Yurrita, L.; Callol-Sanchez, L.M. Study of 5 volatile organic compounds in exhaled breath in Chronic Obstructive Pulmonary Disease. Arch. Bronconeumol. 2016. [Google Scholar] [CrossRef]
- Jareno-Esteban, J.J.; Munoz-Lucas, M.A.; Carrillo-Aranda, B.; Maldonado-Sanz, J.A.; de Granda-Orive, I.; Aguilar-Ros, A.; Civera-Tejuca, C.; Gutierrez-Ortega, C.; Callol-Sanchez, L.M.; Group, S. Volatile organic compounds in exhaled breath in a healthy population: effect of tobacco smoking. Arch. Bronconeumol. 2013, 49, 457–461. [Google Scholar] [CrossRef] [PubMed]
- Huang, Y.J.; Charlson, E.S.; Collman, R.G.; Colombini-Hatch, S.; Martinez, F.D.; Senior, R.M. The role of the lung microbiome in health and disease: A national heart, lung, and blood institute workshop report. Am. J. Respir. Crit. Care Med. 2013, 187, 1382–1387. [Google Scholar] [CrossRef] [PubMed]
- Filipiak, W.; Beer, R.; Sponring, A.; Filipiak, A.; Ager, C.; Schiefecker, A.; Lanthaler, S.; Helbok, R.; Nagl, M.; Troppmair, J.; et al. Breath analysis for in vivo detection of pathogens related to ventilator-associated pneumonia in intensive care patients: A prospective pilot study. J. Breath Res. 2015, 9, 16004. [Google Scholar] [CrossRef] [PubMed]
- Broza, Y.Y.; Mochalski, P.; Ruzsanyi, V.; Amann, A.; Haick, H. Hybrid Volatolomics and Disease Detection. Angew. Chem. Int. Ed. 2015, 54, 11036–11048. [Google Scholar] [CrossRef] [PubMed]
- Bean, H.D.; Jimenez-Diaz, J.; Zhu, J.; Hill, J.E. Breathprints of model murine bacterial lung infections are linked with immune response. Eur. Respir. J. 2015, 45, 181–190. [Google Scholar] [CrossRef] [PubMed]
- Babyak, M.A. What You See May Not Be What You Get: A Brief, Nontechnical Introduction to Overfitting in Regression-Type Models. Psychosom. Med. 2004, 66, 411–421. [Google Scholar] [PubMed]
- García-Vázquez, E.; Marcos, M.A.; Mensa, J.; de Roux, A.; Puig, J.; Font, C.; Francisco, G.; Torres, A. Assessment of the usefulness of sputum culture for diagnosis of community-acquired pneumonia using the PORT predictive scoring system. Arch. Intern. Med. 2004, 164, 1807–1811. [Google Scholar] [CrossRef] [PubMed]
- Bos, L.; Schultz, M.; Sterk, P. A simple breath sampling method in intubated and mechanically ventilated critically ill patients. Respir. Physiol. Neurobiol. 2014, 191, 67–74. [Google Scholar] [CrossRef] [PubMed]
- Bos, L.D.J.; Schultz, M.J.; Sterk, P.J. Exhaled breath profiling for diagnosing acute respiratory distress syndrome. BMC Pulm. Med. 2014, 14, 72. [Google Scholar] [CrossRef]
- Bradley, A.P. The use of the area under the ROC curve in the evaluation of machine learning algorithms. Pattern Recognit. 1997, 30, 1145–1159. [Google Scholar] [CrossRef] [Green Version]
- Golbraikh, A.; Tropsha, A. Beware of Q2! J. Mol. Graph. Model. 2002, 20, 269–276. [Google Scholar] [CrossRef]
- Friedrich, M.J. Scientists Seek to Sniff Out Diseases. Electronic “Noses” May Someday Be Diagnostic Tools. J. Am. Med. Assoc. 2009, 301, 585–586. [Google Scholar] [CrossRef] [PubMed]
- Oh, E.H.; Song, H.S.; Park, T.H. Recent advances in electronic and bioelectronic noses and their biomedical applications. Enzym. Microb. Technol. 2011, 48, 427–437. [Google Scholar] [CrossRef] [PubMed]
- Klein Klouwenberg, P.M.C.; Ong, D.S.Y.; Bos, L.D.J.; de Beer, F.M.; van Hooijdonk, R.T.M.; Huson, M.A.; Straat, M.; van Vught, L.A.; Wieske, L.; Horn, J.; et al. Interobserver agreement of centers for disease control and prevention criteria for classifying infections in critically ill patients*. Crit. Care Med. 2013, 41, 2373–2378. [Google Scholar] [CrossRef] [PubMed]
- De Smet, A.M.; Kluytmans, J.A.; Cooper, B.S.; Mascini, E.M.; Benus, R.F.; van der Werf, T.S.; van der Hoeven, J.G.; Pickkers, P.; Bogaers-Hofman, D.; van der Meer, N.J.; et al. Decontamination of the digestive tract and oropharynx in ICU patients. N. Engl. J. Med. 2009, 360, 20–31. [Google Scholar] [CrossRef] [PubMed]
- Oostdijk, E.A.N.; Kesecioglu, J.; Schultz, M.J.; Visser, C.E.; de Jonge, E.; van Essen, E.H.R.; Bernards, A.T.; Purmer, I.; Brimicombe, R.; Bergmans, D.; et al. Effects of decontamination of the oropharynx and intestinal tract on antibiotic resistance in ICUs: A randomized clinical trial. JAMA 2014, 312, 1429–1437. [Google Scholar] [CrossRef] [PubMed]
- Smith, C.A.; Want, E.J.; O’maille, G.; Abagyan, R.; Siuzdak, G. XCMS: Processing Mass Spectrometry Data for Metabolite Profiling Using Nonlinear Peak Alignment, Matching, and Identification. Anal. Chem. 2006, 78, 779–787. [Google Scholar] [CrossRef] [PubMed]
- Robin, X.; Turck, N.; Hainard, A.; Tiberti, N.; Lisacek, F.; Sanchez, J.-C.; Müller, M. pROC: An open-source package for R and S+ to analyze and compare ROC curves. BMC Bioinform. 2011, 12, 77. [Google Scholar] [CrossRef] [PubMed]


| Clinical Data | Control n = 47 | Colonization n = 13 | Possible Pneumonia n = 21 | Probable Pneumonia n = 12 | p-Value |
|---|---|---|---|---|---|
| Age at ICU admission | 59 (48–70) | 64 (43–79) | 63 (55–71) | 61 (45–72) | 0.93 |
| Patient gender: | |||||
| Female | 16 (34) | 5 (38) | 6 (29) | 7 (58) | 0.41 |
| Male | 28 (59) | 8 (62) | 15 (71) | 5 (42) | |
| Admission type: | |||||
| Medical | 31 (65) | 8 (62) | 20 (95) | 11 (92) | 0.17 |
| Surgical elective | 1 (2) | 0 (0) | 0 (0) | 0 (0) | |
| Surgical emergency | 12 (25) | 5 (38) | 1 (5) | 1 (8) | |
| ICU Length of stay (days) | 3 (2–5) | 3 (2–4) | 4 (3–5) | 5.5 (3–9) | 0.18 |
| APACHE IV Score | 80 (55–97) | 76 (56–89) | 76.5 (57–103) | 66 (59–83) | 0.74 |
| ICU mortality | 11 (23) | 1 (8) | 2 (10) | 4 (33) | 0.20 |
| ARDS | 2 (4) | 12 (92) | 15 (71) | 9 (75) | <0.001 |
| Positive Cultures | 0 (0) | 13 (100) | 3 (14) | 9 (75) | <0.001 |
| Comorbidity: | |||||
| Malignancy | 4 (9) | 3 (23) | 4 (19) | 4 (33) | 0.18 |
| Diabetes Mellitus type 2 | 4 (9) | 3 (23) | 2 (10) | 2 (17) | 0.55 |
| COPD | 1 (2) | 0 (0) | 4 (19) | 1 (8) | 0.054 |
| Asthma | 0 (0) | 0 (0) | 1 (5) | 0 (0) | 0.49 |
| Other | 1 (2) | 0 (0) | 1 (5) | 1 (8) | 0.72 |
| Pmax cm H2O | 17 (14–22) | 16 (13–17) | 21 (18–24) | 25 (22–28) | 0.004 |
| Peep cm H2O | 5 (5–5) | 5 (5–5) | 8 (5–10) | 9.5 (5–10) | 0.001 |
| Tidal Volume mL | 458 (391–525) | 467 (448–581) | 500 (383–576) | 464 (409–575) | 0.74 |
| FiO2 % | 40 (35–40) | 35 (35–40) | 40 (35–45) | 45 (40–60) | 0.024 |
| PaO2 kPa | 13.8 (12.2–17) | 16.3 (13.7–24.2) | 14.7 (12.4–17.7) | 14.2 (10.9–19.0) | 0.31 |
| PaCO2 kPa | 5.1 (4.5–5.6) | 5.1 (4.6–5.4) | 5.5 (4.7–5.7) | 5.1 (4.5–6.1) | 0.58 |
| In-Set Analysis | Groups | Probable Pneumonia | Control |
|---|---|---|---|
| Probable pneumonia | 5 | 3 | |
| Control | 7 | 44 | |
| Leave-one-out validation | Probable pneumonia | Control | |
| Probable pneumonia | 3 | 4 | |
| Control | 9 | 43 | |
| In-set analysis | Positive culture | Negative culture | |
| Positive culture | 7 | 5 | |
| Negative culture | 18 | 63 | |
| Leave-one-out validation | Positive culture | Negative culture | |
| Positive culture | 5 | 6 | |
| Negative culture | 20 | 62 |
| Community Acquired Pneumonia (Symptoms of Pneumonia Started at Home or in First 48 h of Hospital Admission) | Chest X-Ray and Clinical Suspicion | Symptoms |
|---|---|---|
| Possible | Uncertainty about infiltrates on chest X-ray | |
| Low clinical suspicion, one or more of the following: | Cough | |
| Purulent sputum | ||
| Fever or hypothermia | ||
| Leukocytosis | ||
| Increased C-reactive protein (CRP) (>30 mg/L) | ||
| Hypoxia (pO2 < 60 mmHg) | ||
| Probable | Evident infiltrates on chest X-ray | |
| High clinical suspicion, one or more of the following: | Crepitations during auscultation | |
| Positive pneumococcal or legionella urine test | ||
| Definite | Evident infiltrates on chest X-ray | |
| High clinical suspicion | ||
| Causative organism detected, one or more of the following: | Positive blood culture | |
| High growth in tracheal aspirate | ||
| Isolation of virus | ||
| Positive serology | ||
| Histopathology | ||
| Hospital Acquired Pneumonia (Symptoms of Pneumonia Started after 48h of Hospital Admission) | Chest X-Ray and Clinical Suspicion | Symptoms | |
|---|---|---|---|
| Possible | Uncertainty about infiltrates on chest X-ray | ||
| Low clinical suspicion, one or more of the following: | Cough | ||
| Purulent sputum | |||
| Fever or hypothermia | |||
| Leukocytosis | |||
| Increased CRP (>30 mg/L) | |||
| Hypoxia (pO2 < 60 mmHg) | |||
| Probable | Evident infiltrates on chest X-ray | ||
| High clinical suspicion, one or more of the following: | Crepitations during auscultation | ||
| PaO2/FiO2 ratio <300 | |||
| Mechanical ventilation | |||
| Causative organism detected, one or more of the following: | Detection of pathogen in respiratory secretion | ||
| Quantitative culture of bronchoalveolar lavage (BAL) / protected specimen brush (PSB) but below threshold for definite | |||
| Definite | Evident infiltrates on chest X-ray | ||
| High clinical suspicion with one or more of the following: | Crepitations during auscultation | ||
| PaO2/FiO2 ratio <300 | |||
| Mechanical ventilation | |||
| Causative organism detected, one or more of the following: | Positive blood culture with respiratory pathogen | ||
| Quantitative culture of BAL/PSB but above threshold (10−3 for PSB and 10−4 for BAL) | |||
| Isolation of virus | |||
| Positive serology | |||
| Histopathology | |||
© 2017 by the authors. Licensee MDPI, Basel, Switzerland. This article is an open access article distributed under the terms and conditions of the Creative Commons Attribution (CC BY) license ( http://creativecommons.org/licenses/by/4.0/).
Share and Cite
Van Oort, P.M.P.; De Bruin, S.; Weda, H.; Knobel, H.H.; Schultz, M.J.; Bos, L.D.; On Behalf of the MARS Consortium. Exhaled Breath Metabolomics for the Diagnosis of Pneumonia in Intubated and Mechanically-Ventilated Intensive Care Unit (ICU)-Patients. Int. J. Mol. Sci. 2017, 18, 449. https://0-doi-org.brum.beds.ac.uk/10.3390/ijms18020449
Van Oort PMP, De Bruin S, Weda H, Knobel HH, Schultz MJ, Bos LD, On Behalf of the MARS Consortium. Exhaled Breath Metabolomics for the Diagnosis of Pneumonia in Intubated and Mechanically-Ventilated Intensive Care Unit (ICU)-Patients. International Journal of Molecular Sciences. 2017; 18(2):449. https://0-doi-org.brum.beds.ac.uk/10.3390/ijms18020449
Chicago/Turabian StyleVan Oort, Pouline M. P., Sanne De Bruin, Hans Weda, Hugo H. Knobel, Marcus J. Schultz, Lieuwe D. Bos, and On Behalf of the MARS Consortium. 2017. "Exhaled Breath Metabolomics for the Diagnosis of Pneumonia in Intubated and Mechanically-Ventilated Intensive Care Unit (ICU)-Patients" International Journal of Molecular Sciences 18, no. 2: 449. https://0-doi-org.brum.beds.ac.uk/10.3390/ijms18020449