
Mitochondrial Genomes Provide Insights into the Phylogeny of Lauxanioidea (Diptera: Cyclorrhapha)

Abstract
:
1. Introduction
2. Results and Discussion
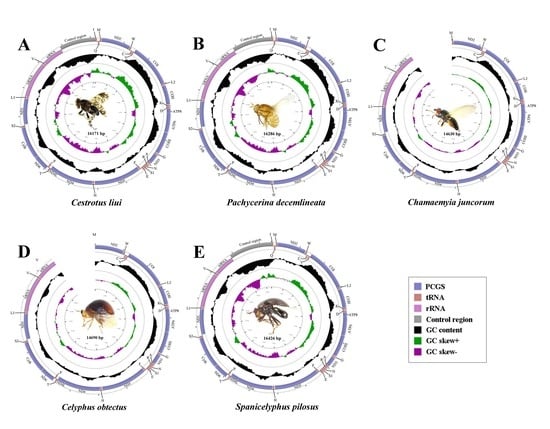
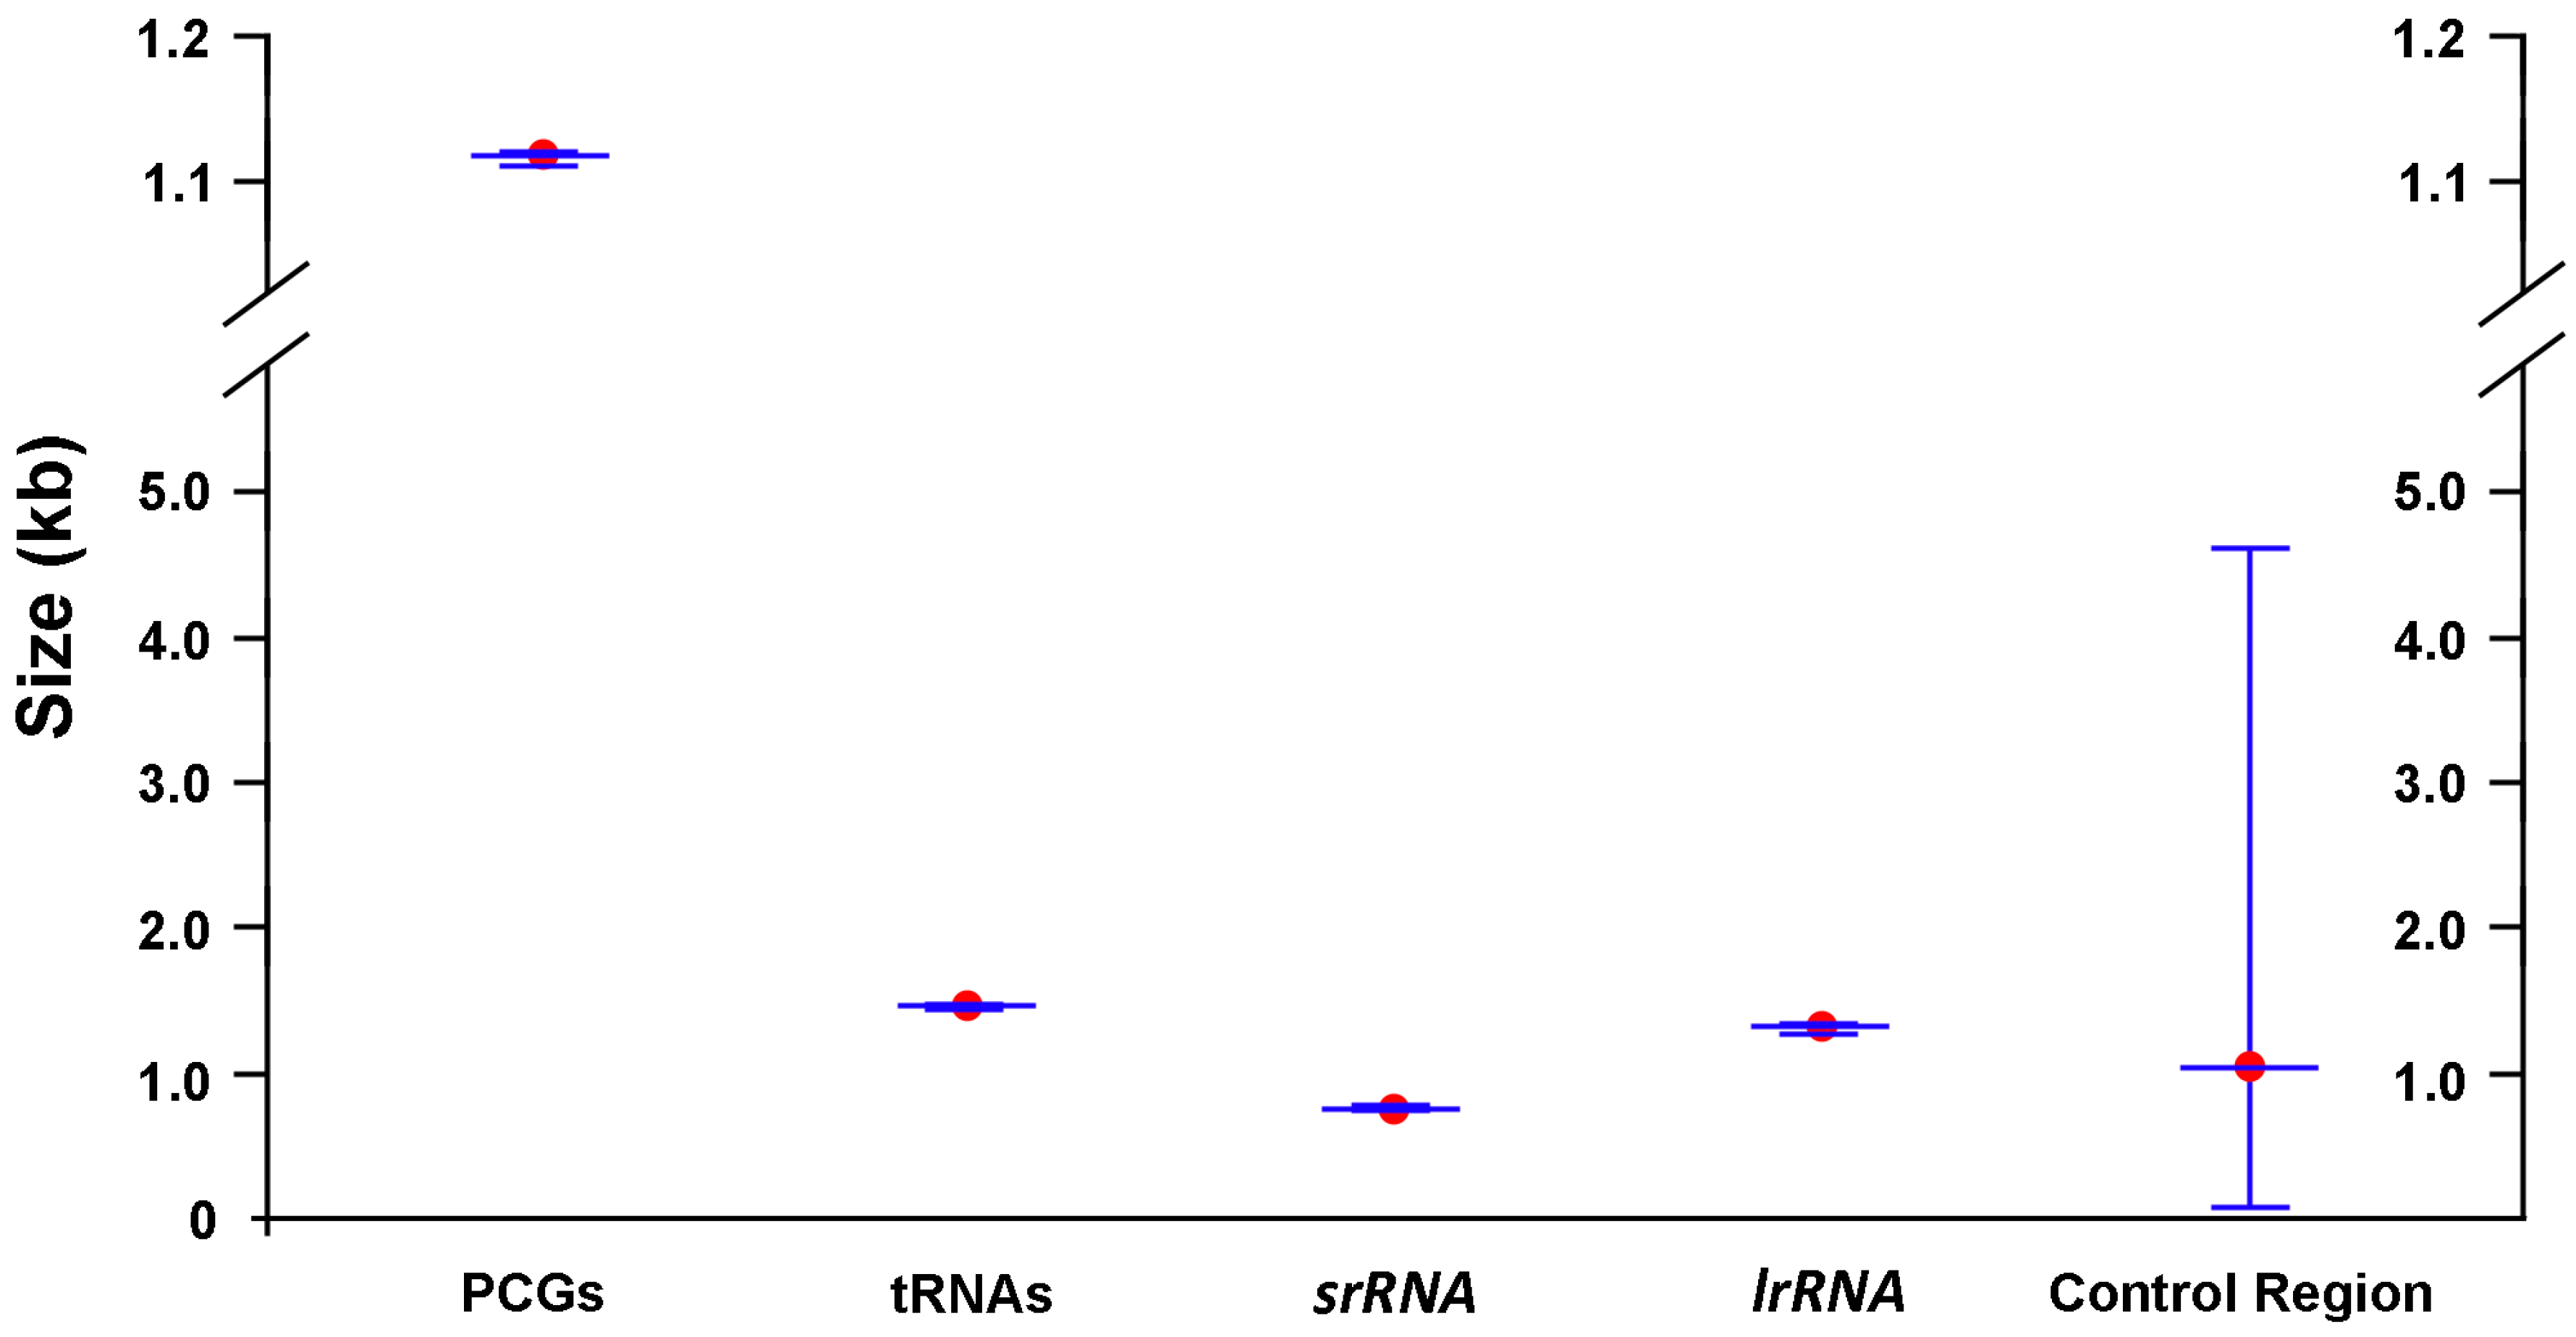
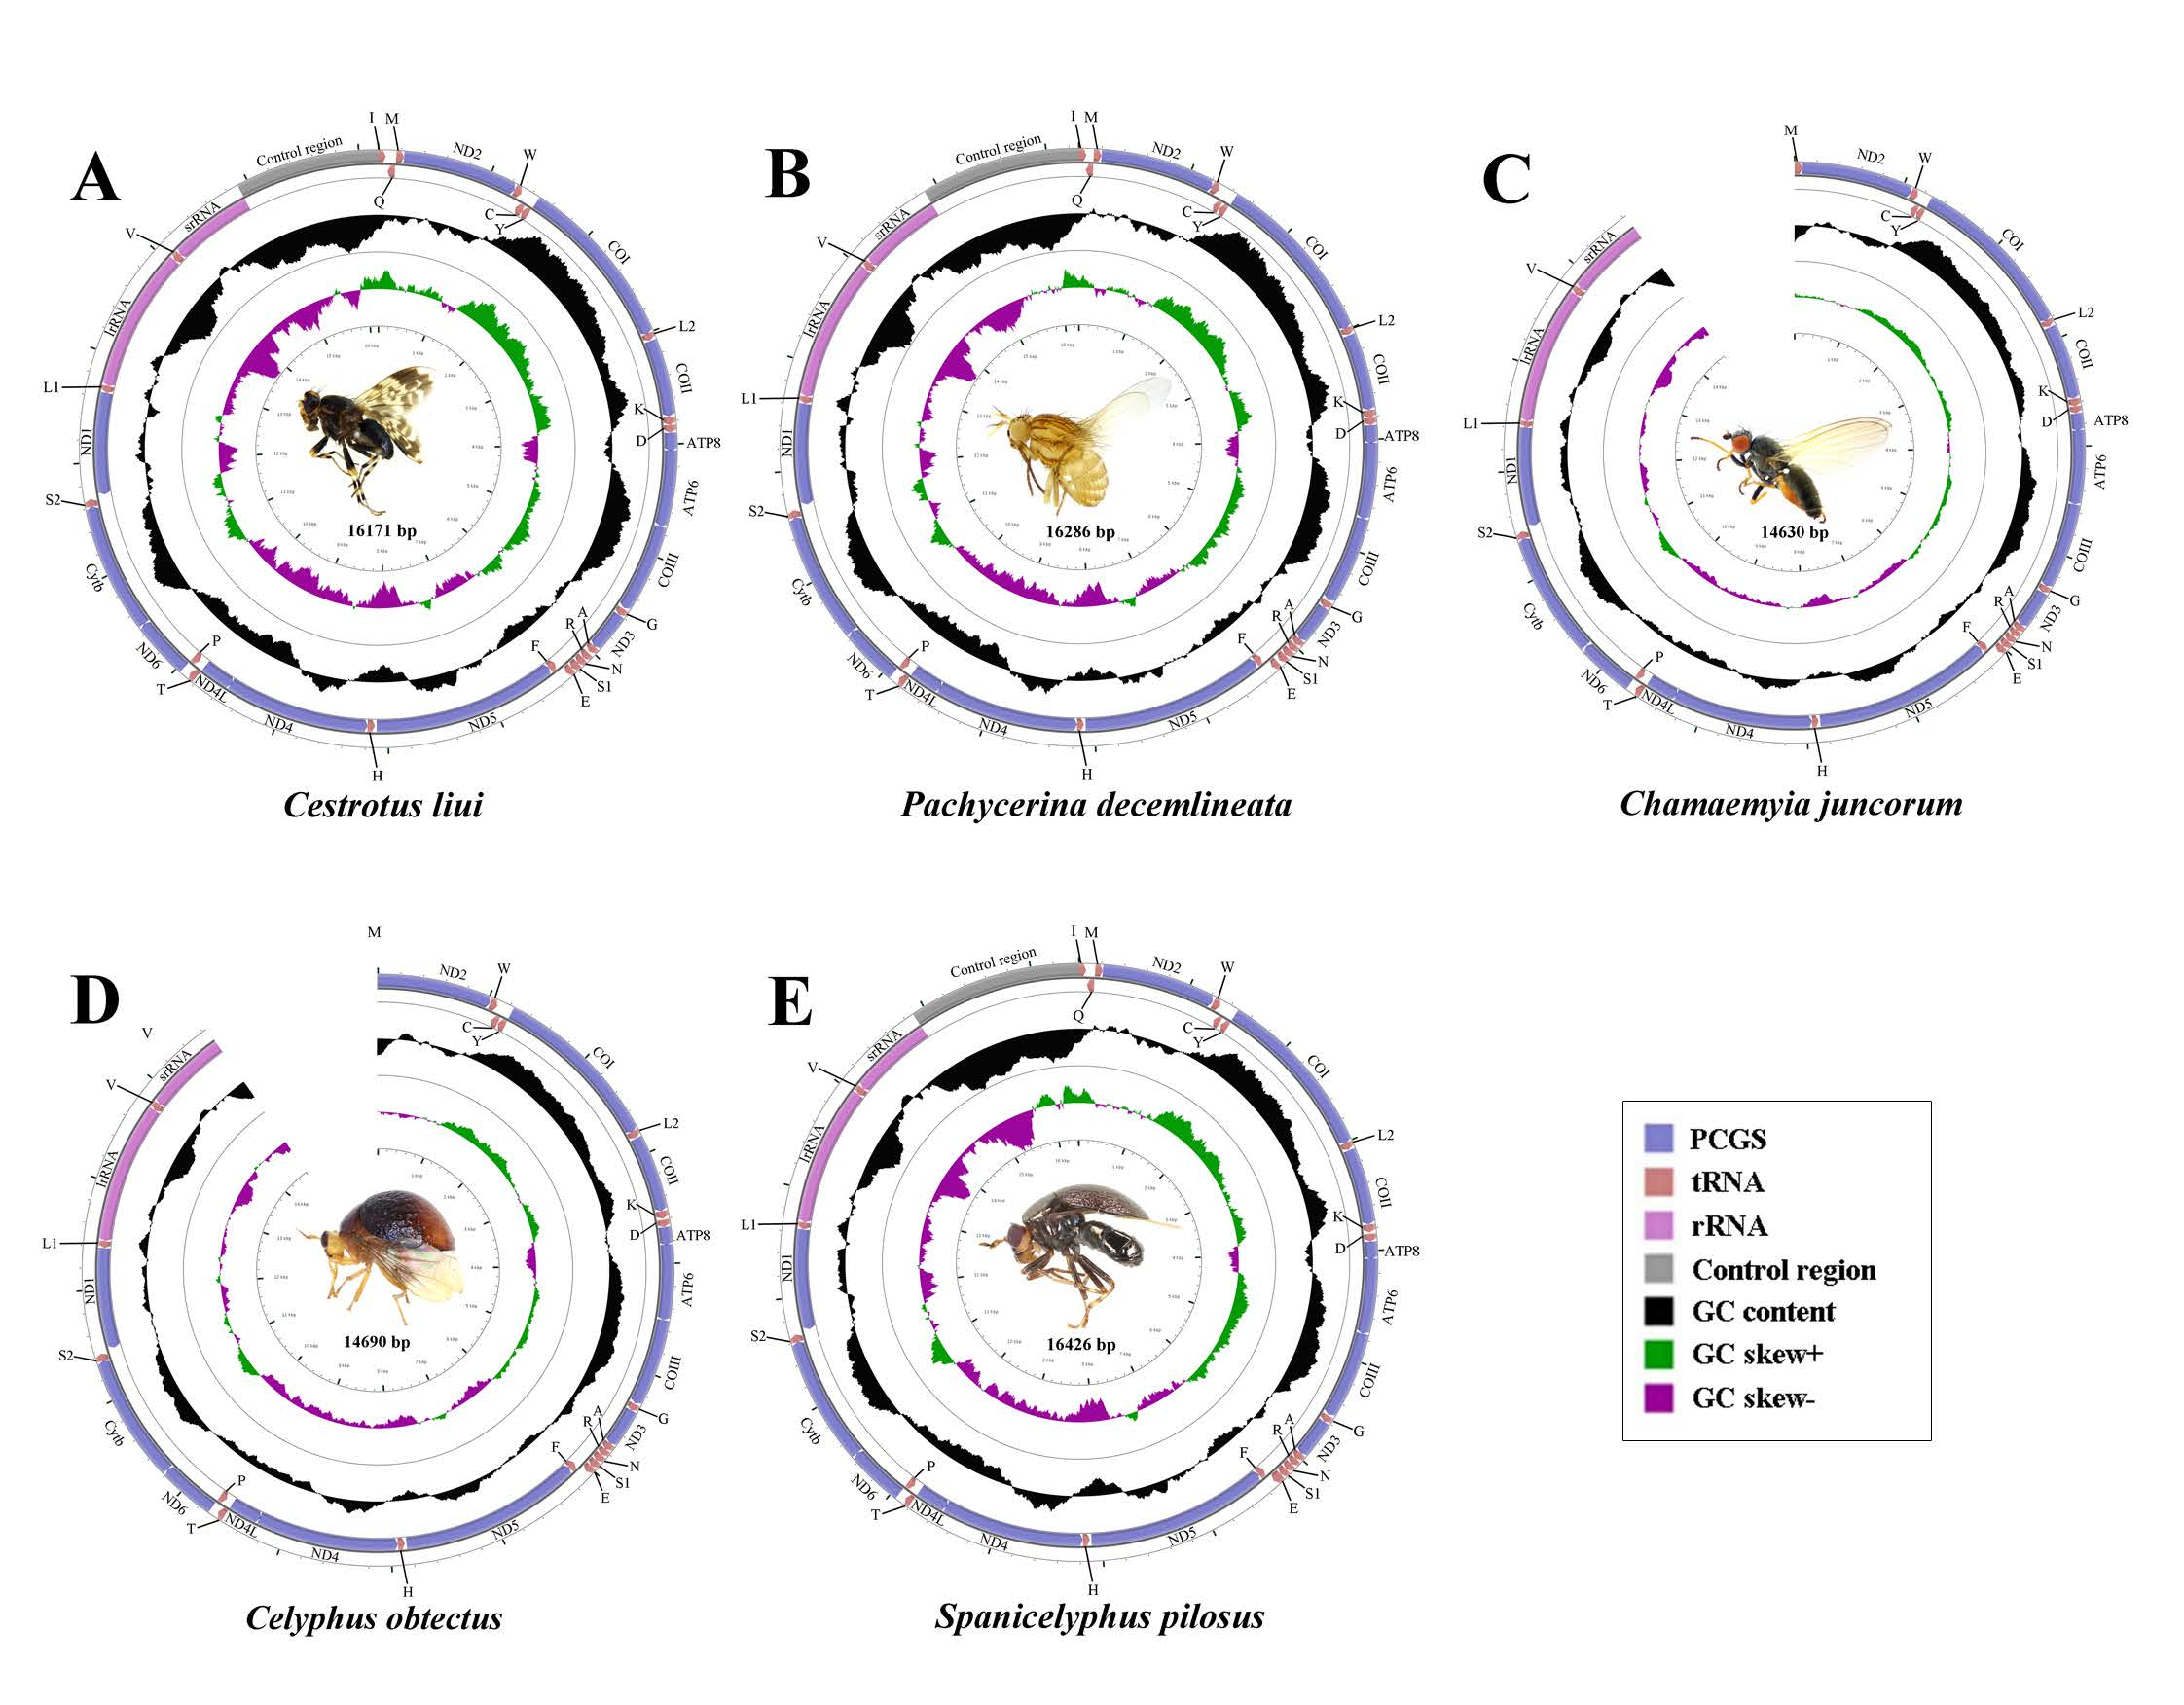
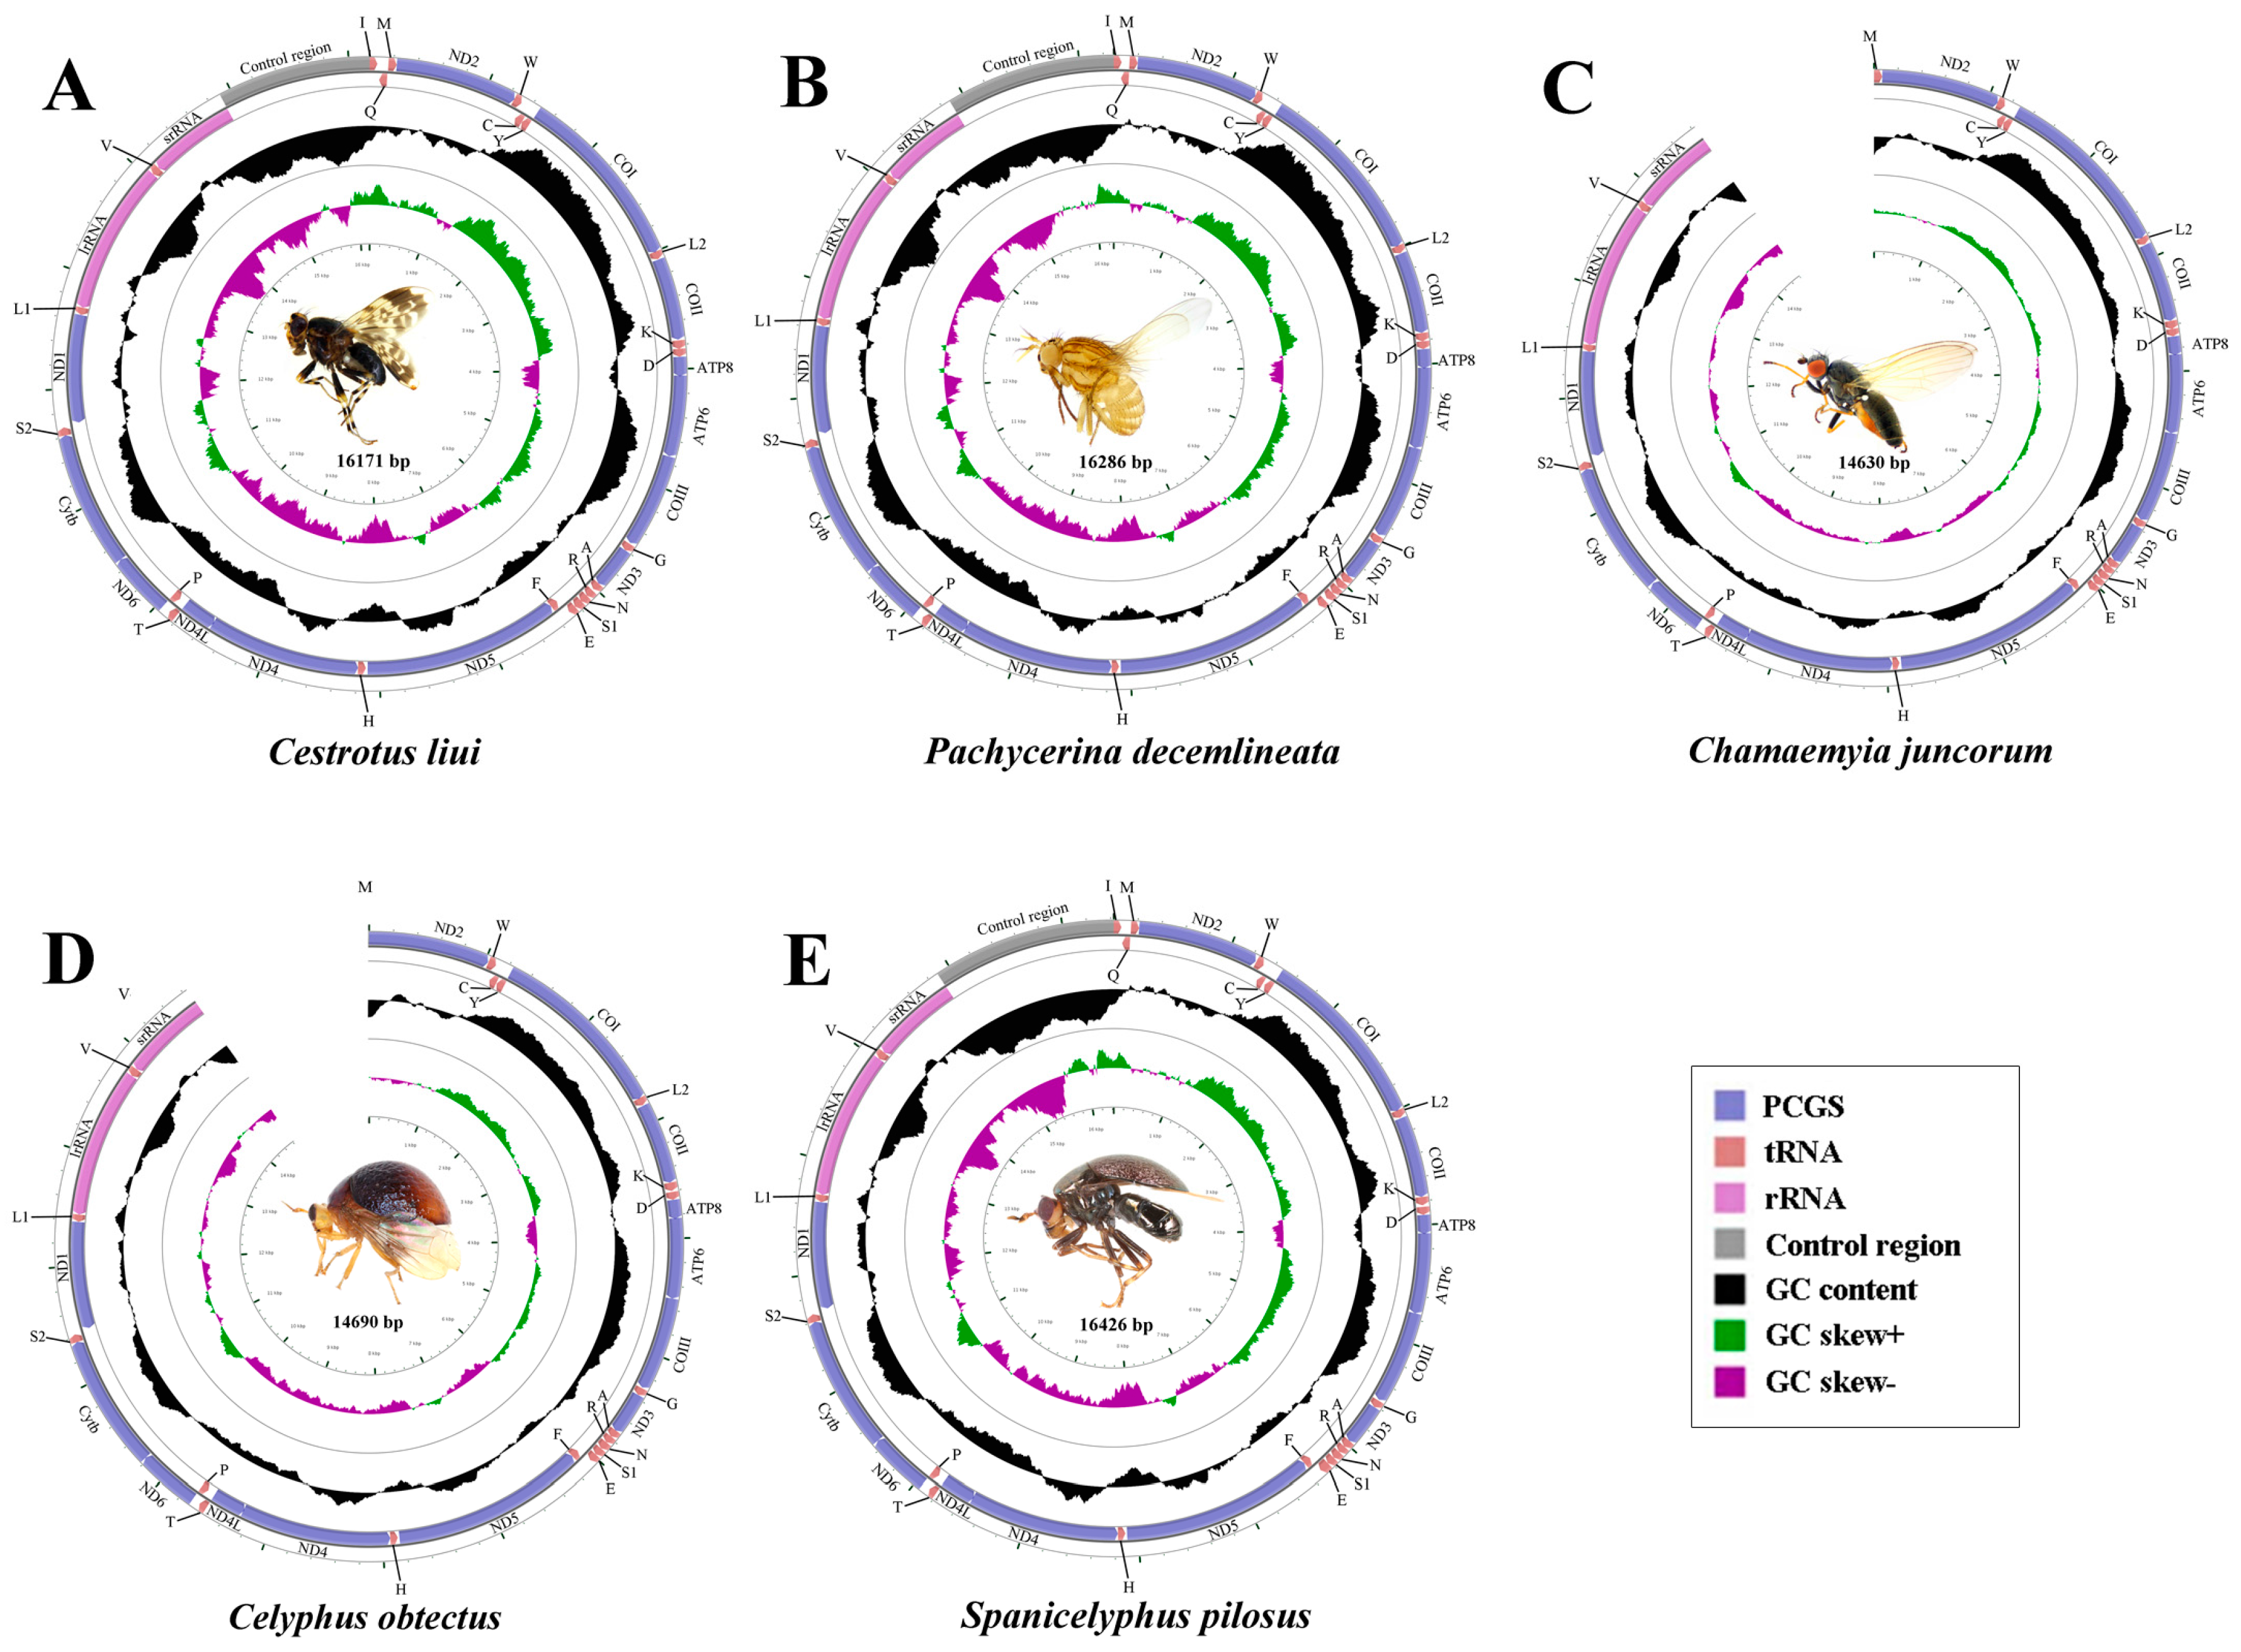
2.1. General Features of Mitochondrial Genome Organization
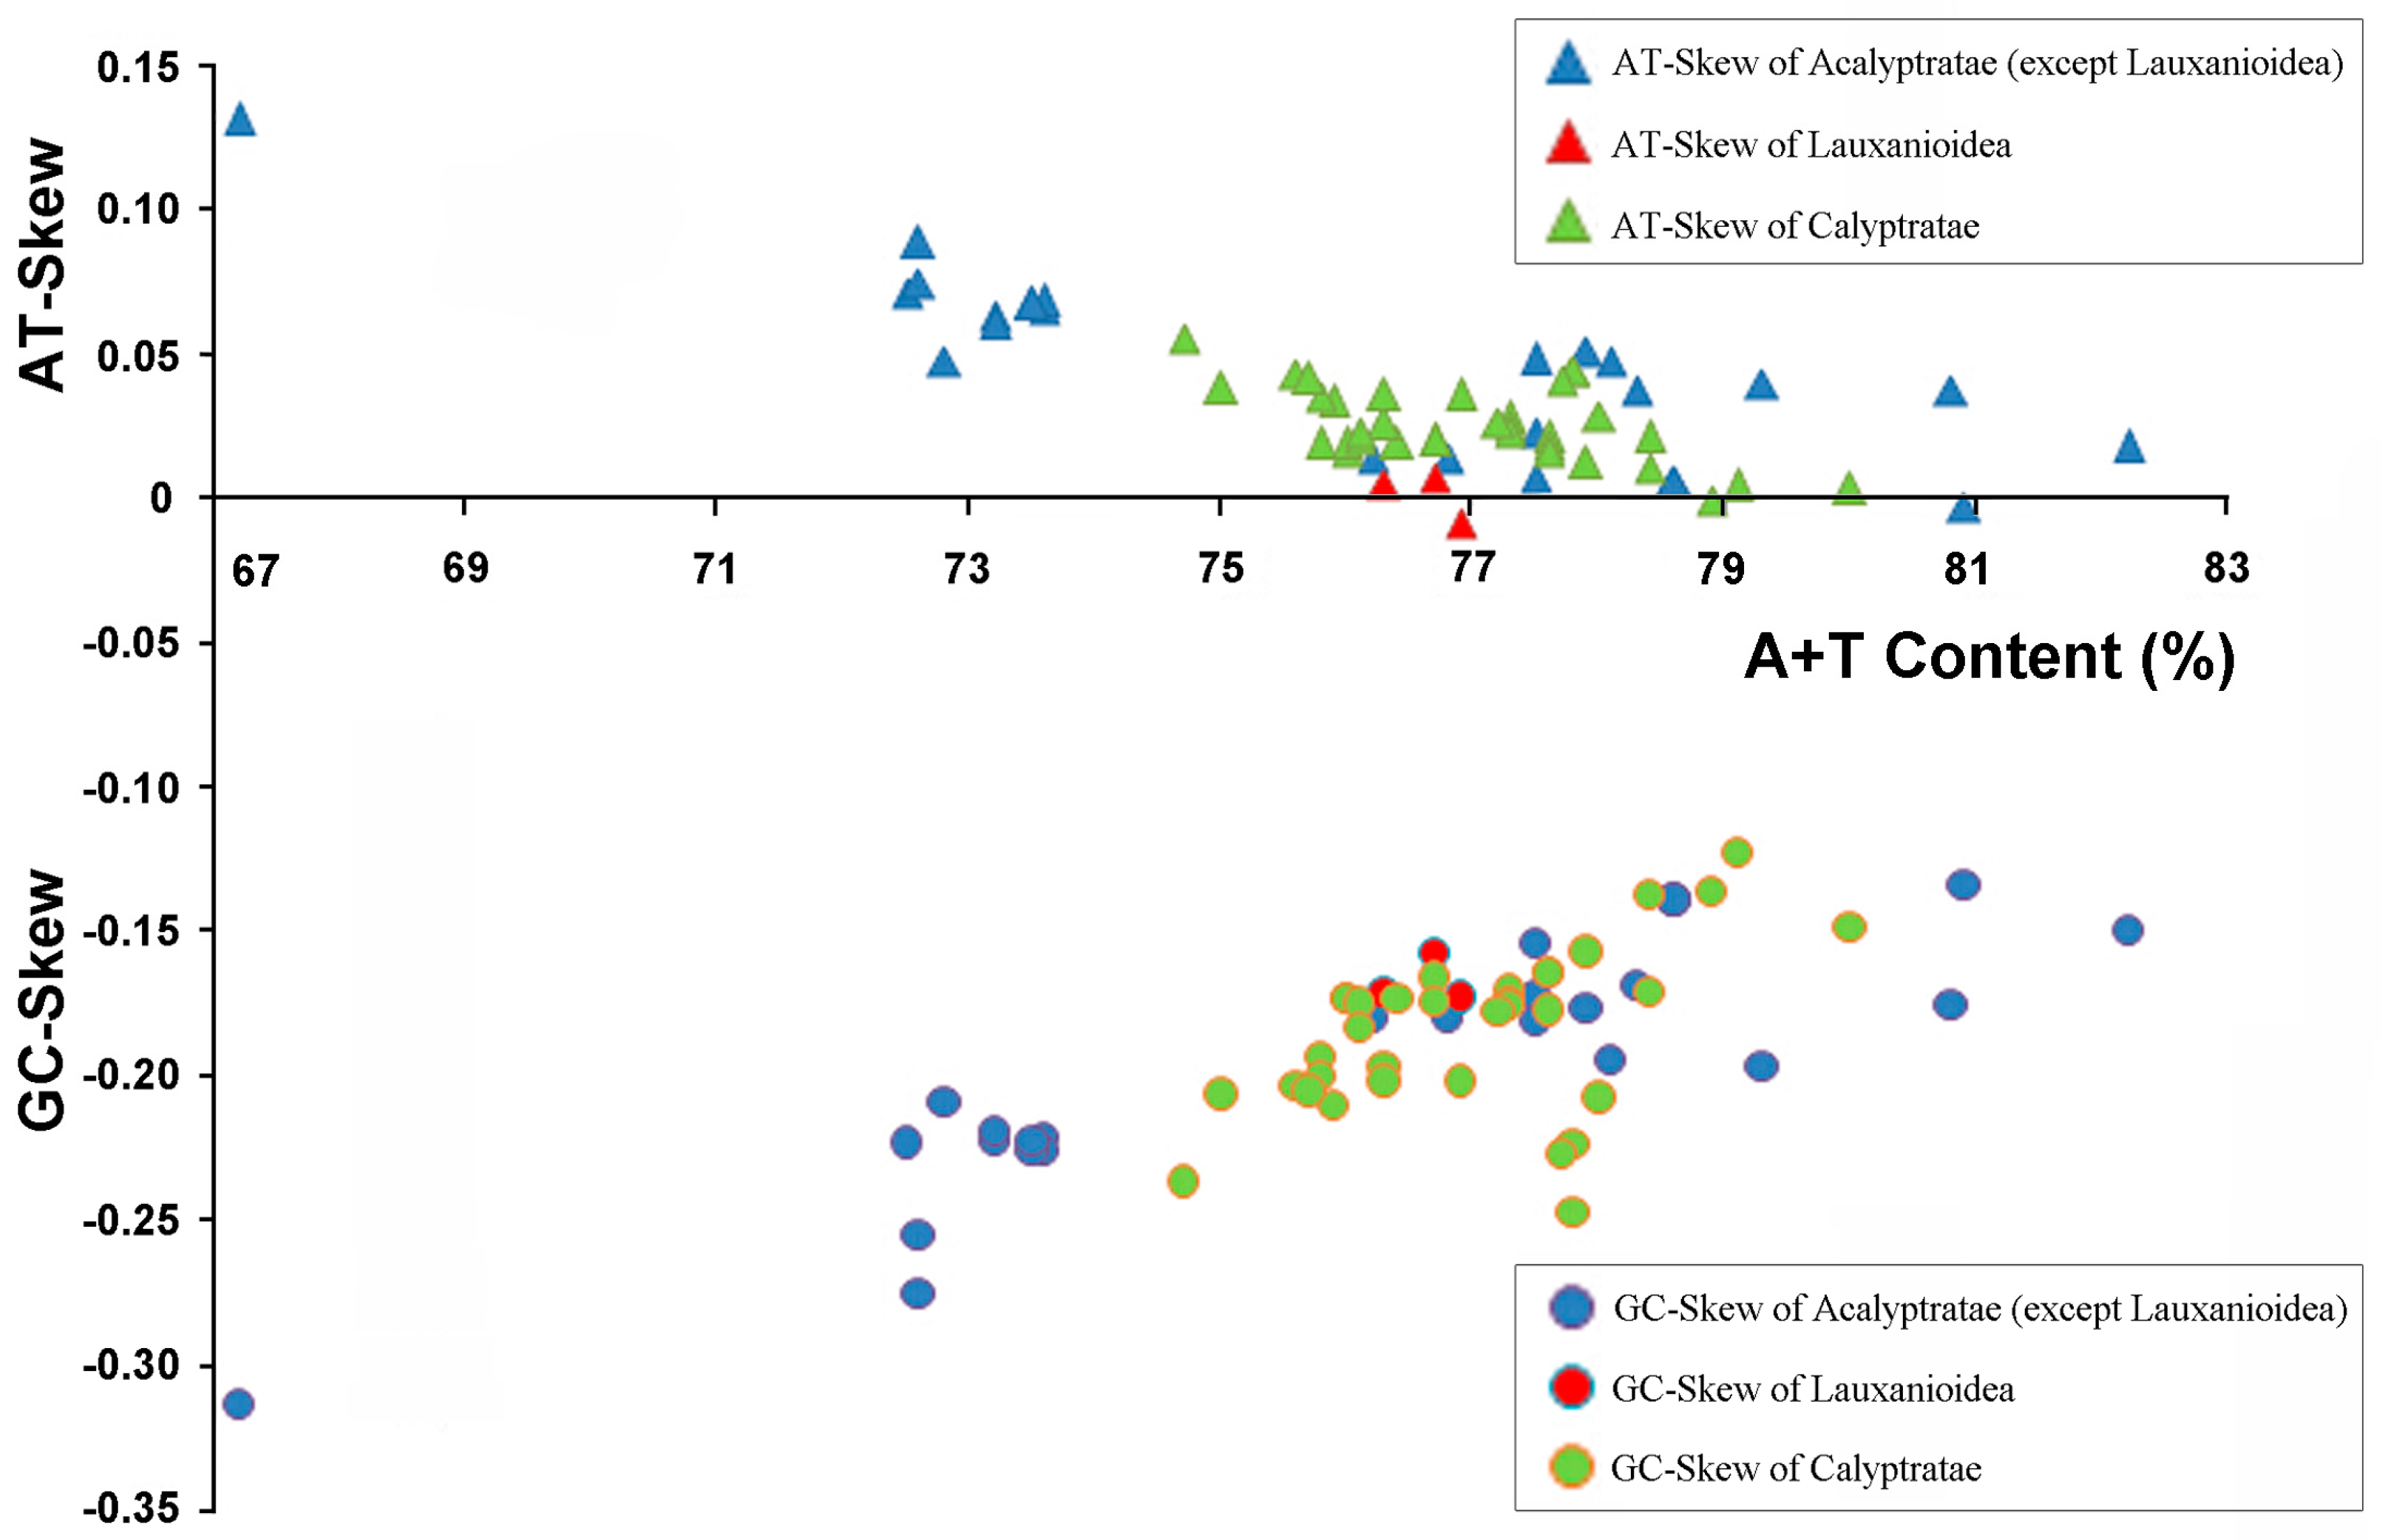
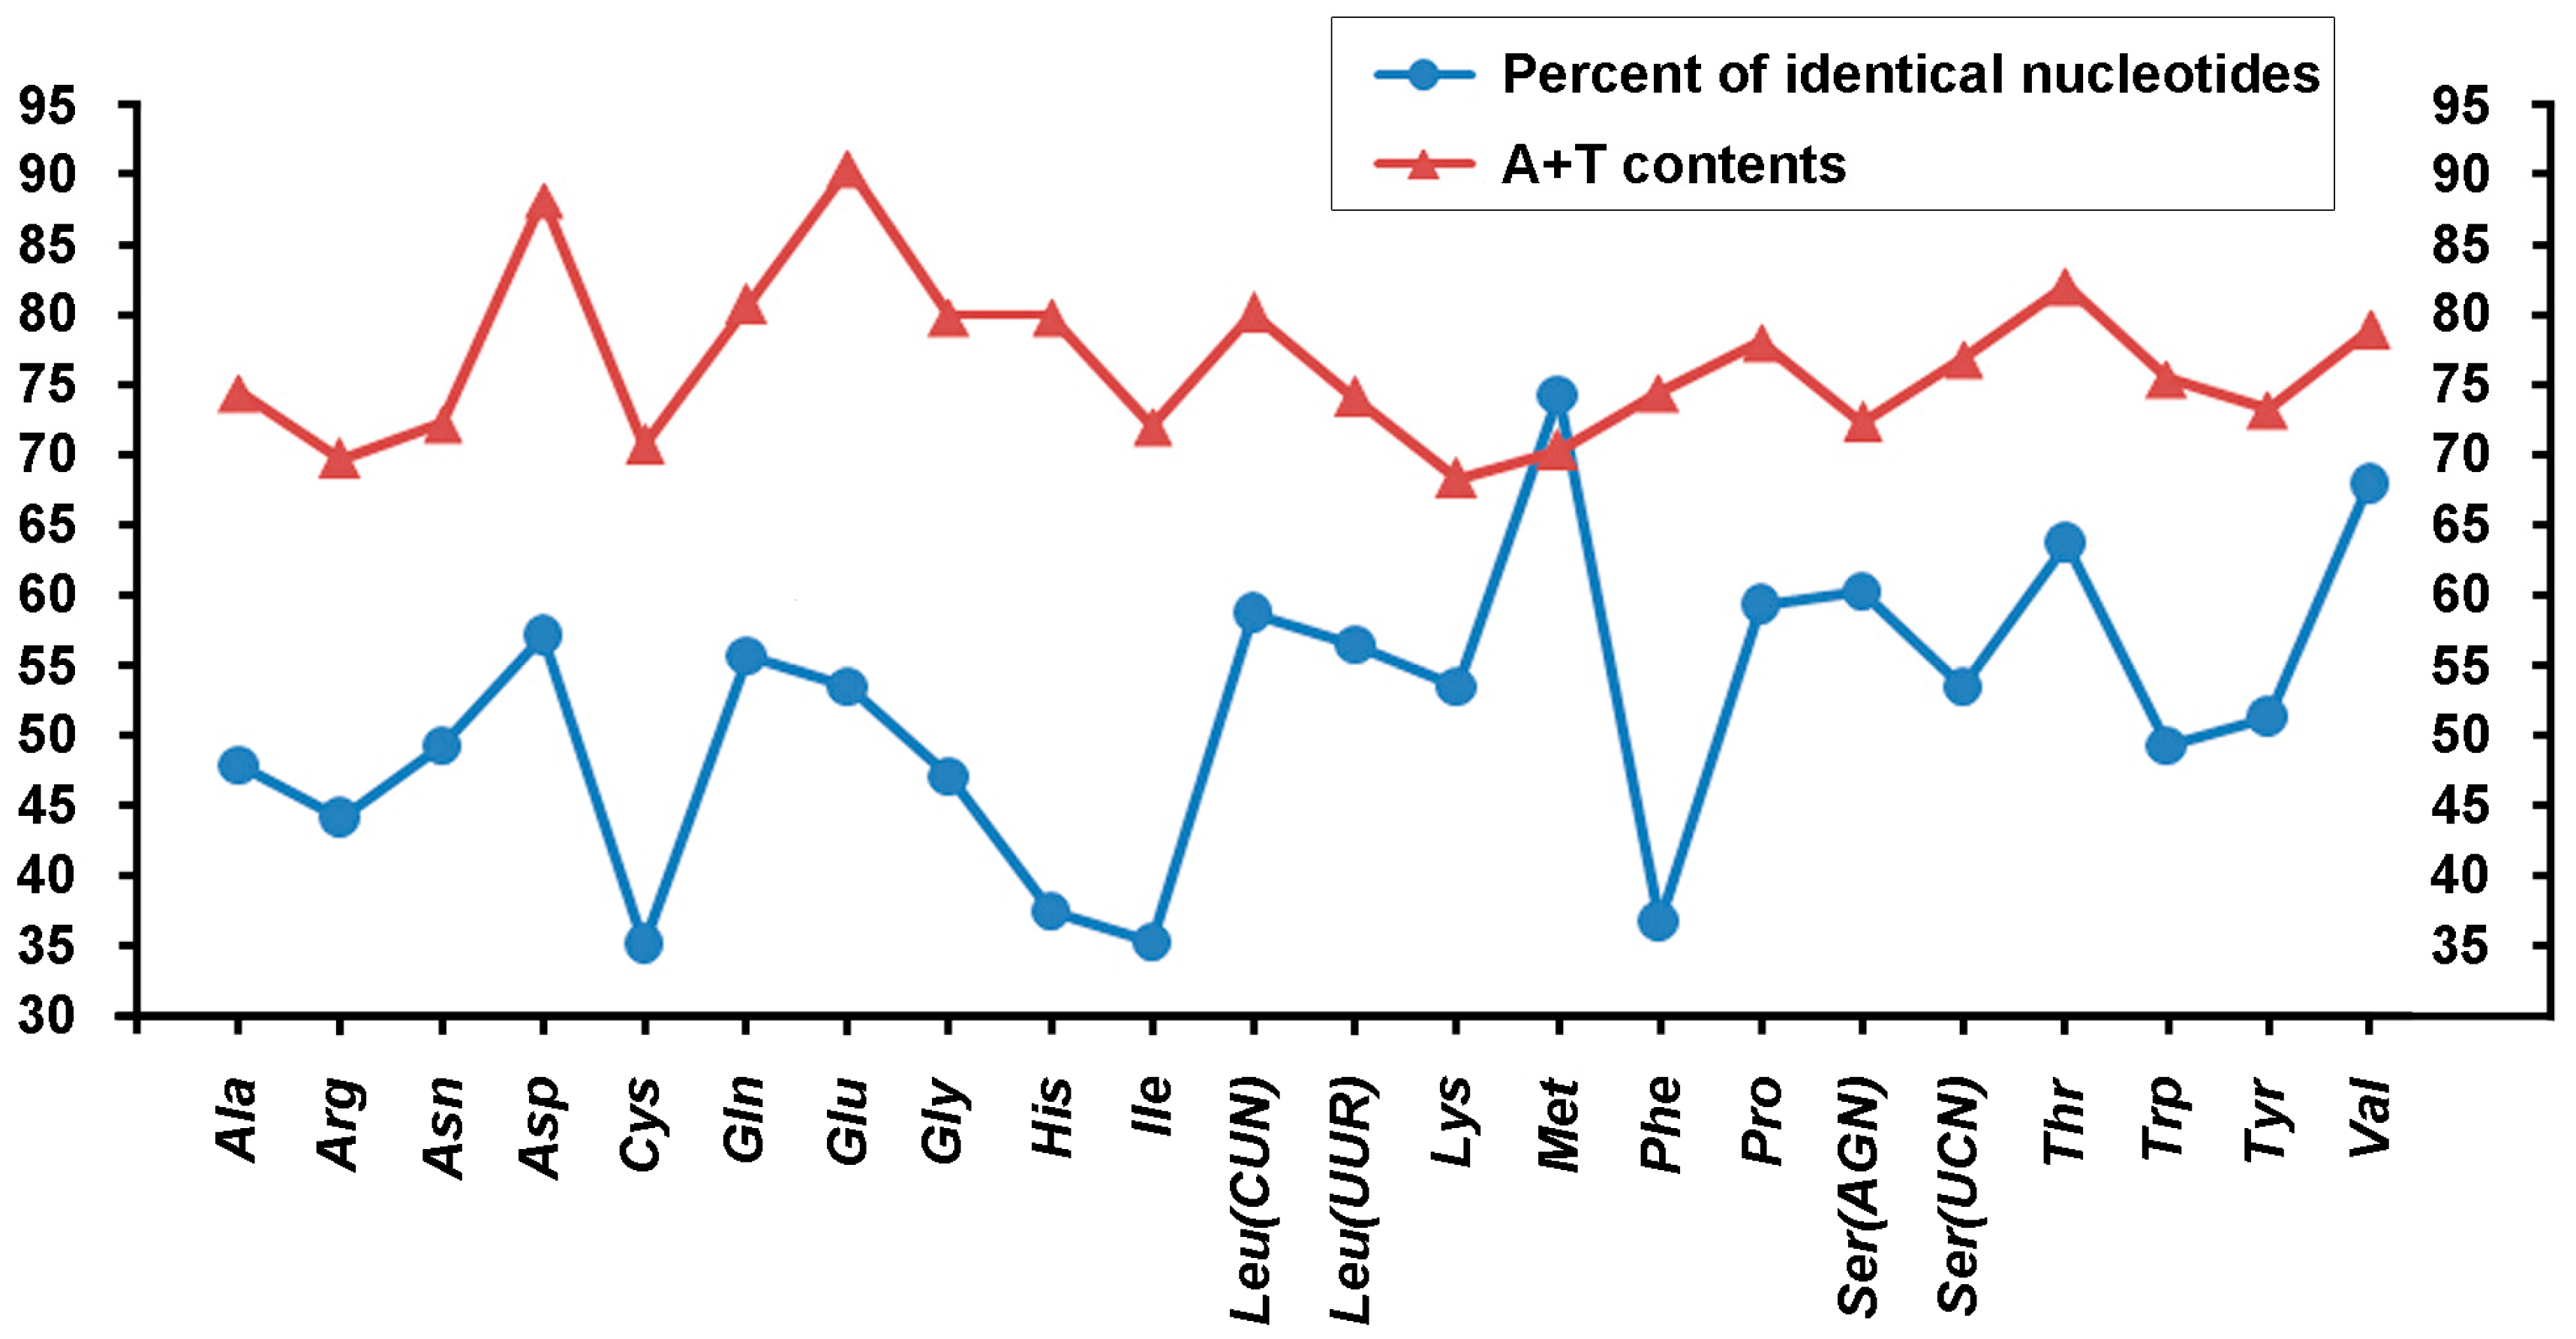
2.2. Base Composition
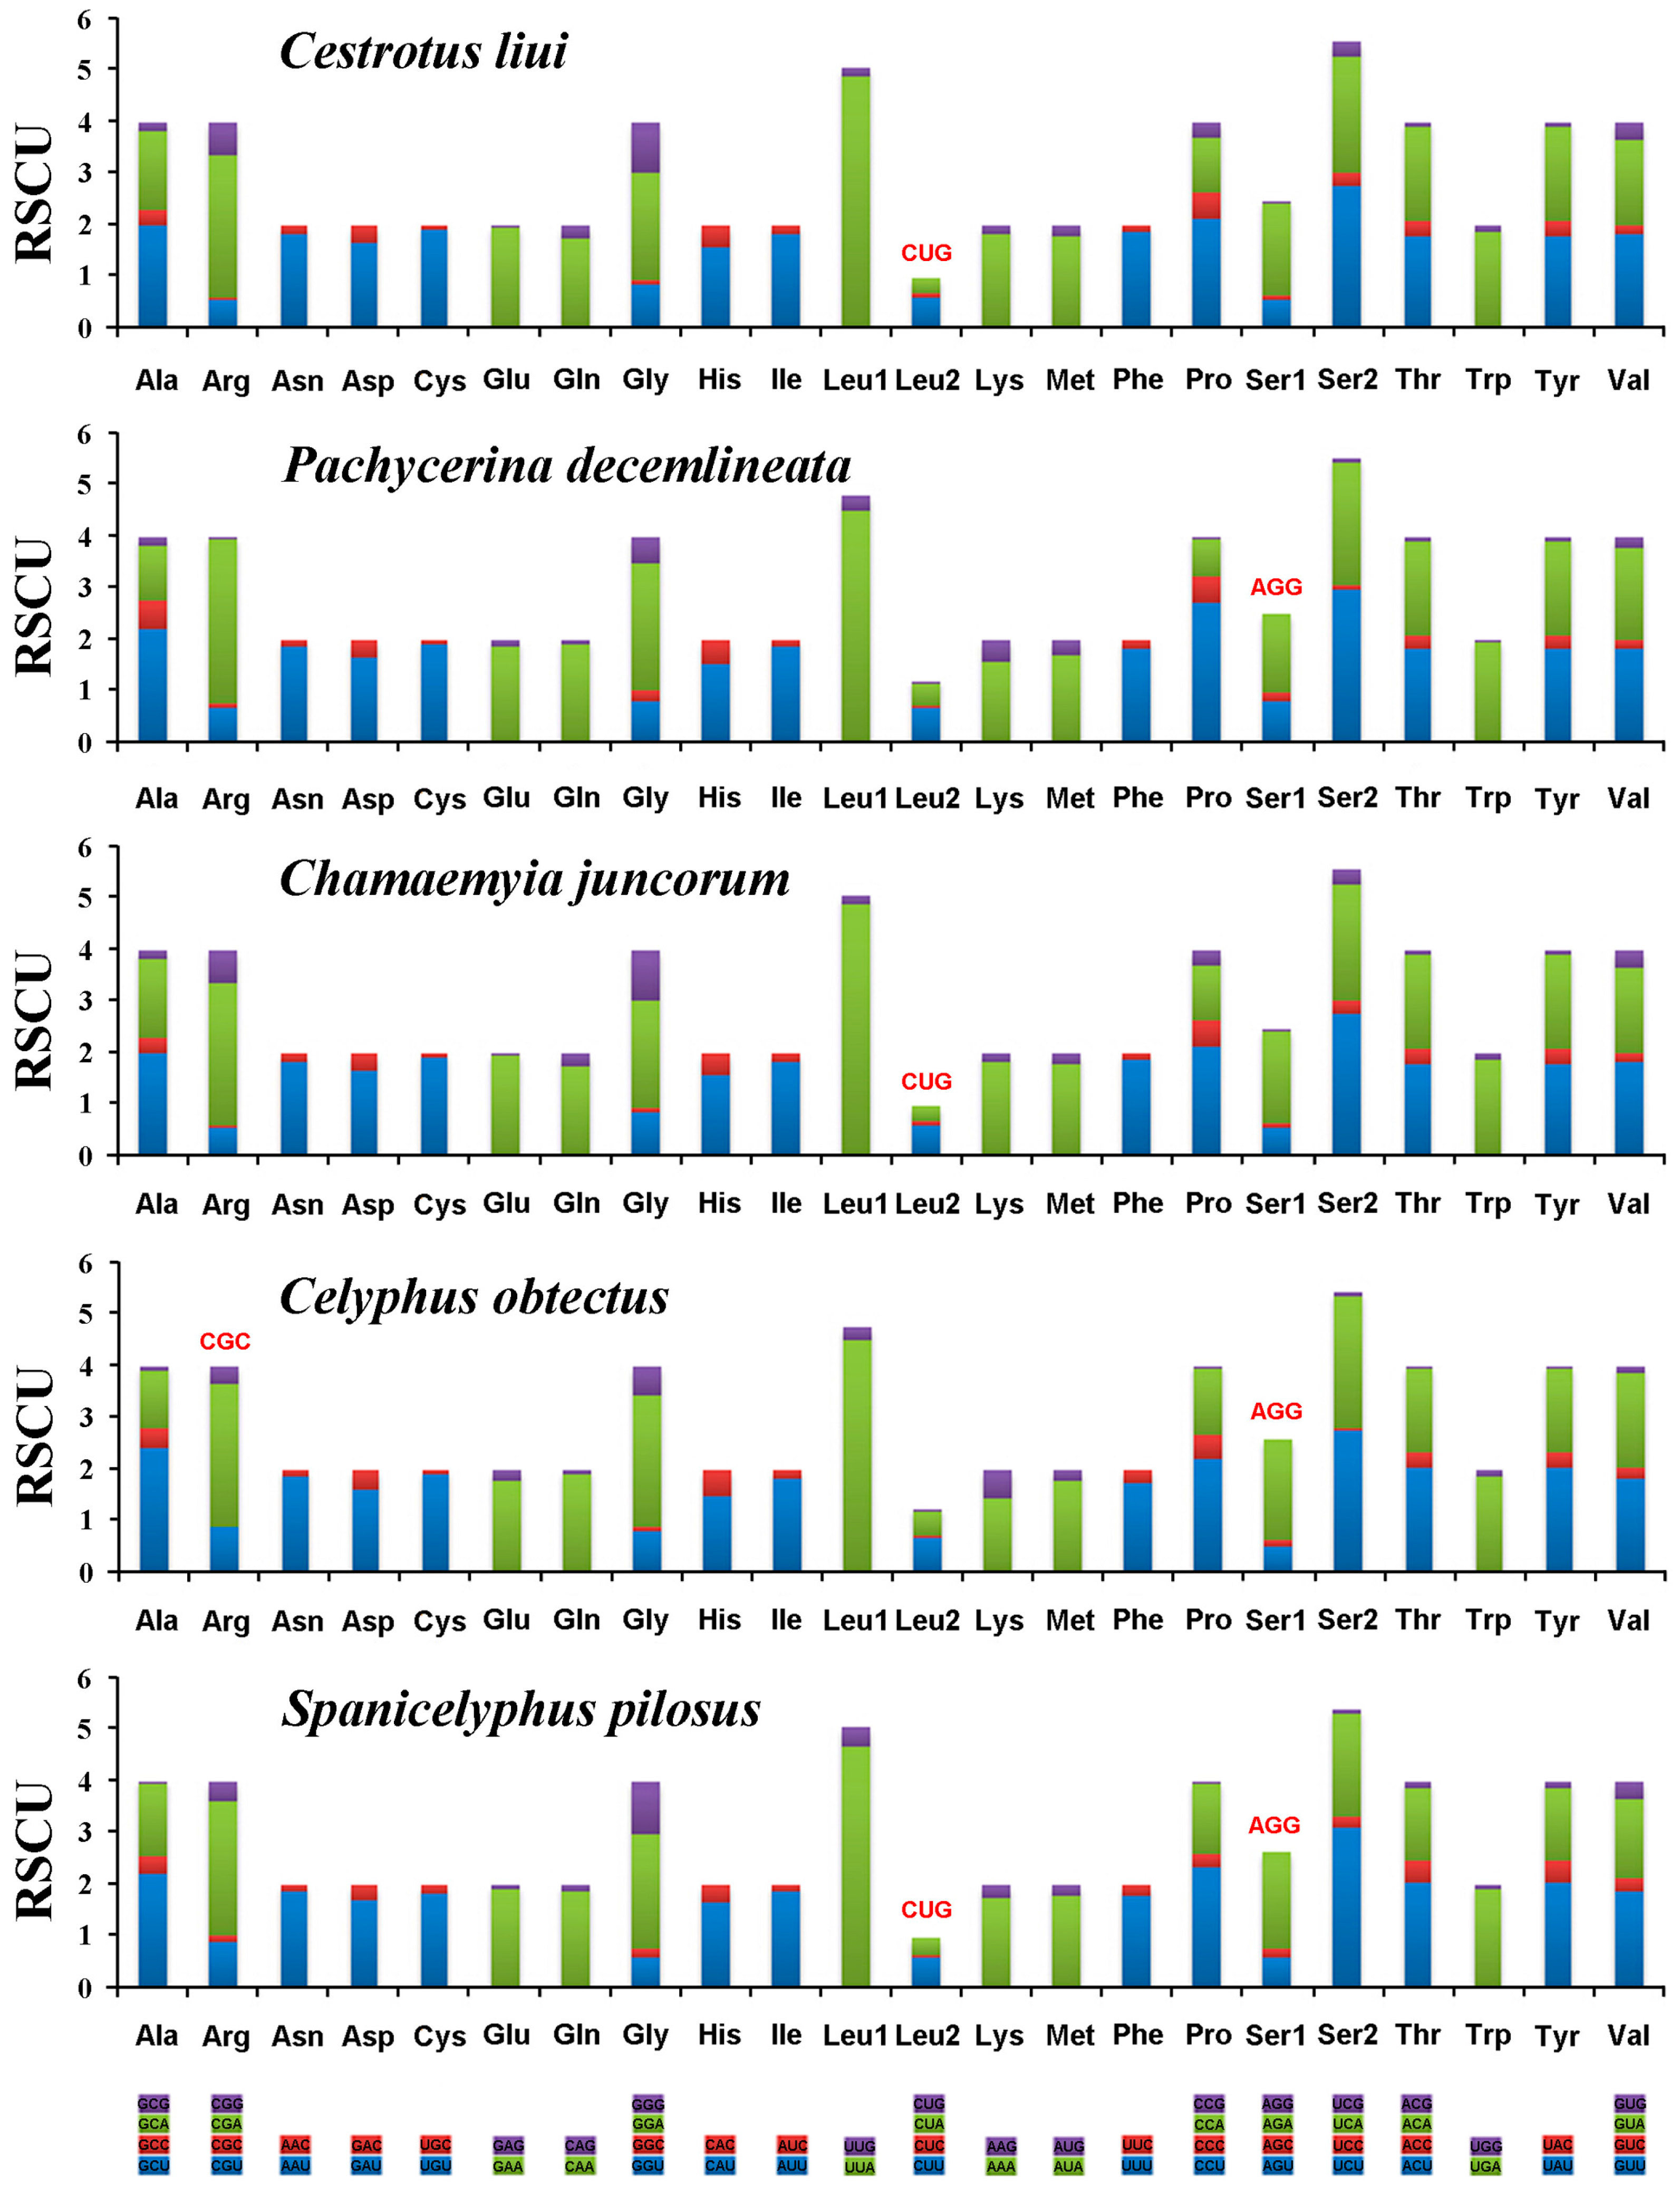
2.3. Protein-Coding Genes and Codon Usage
2.4. Intergenic Sequences
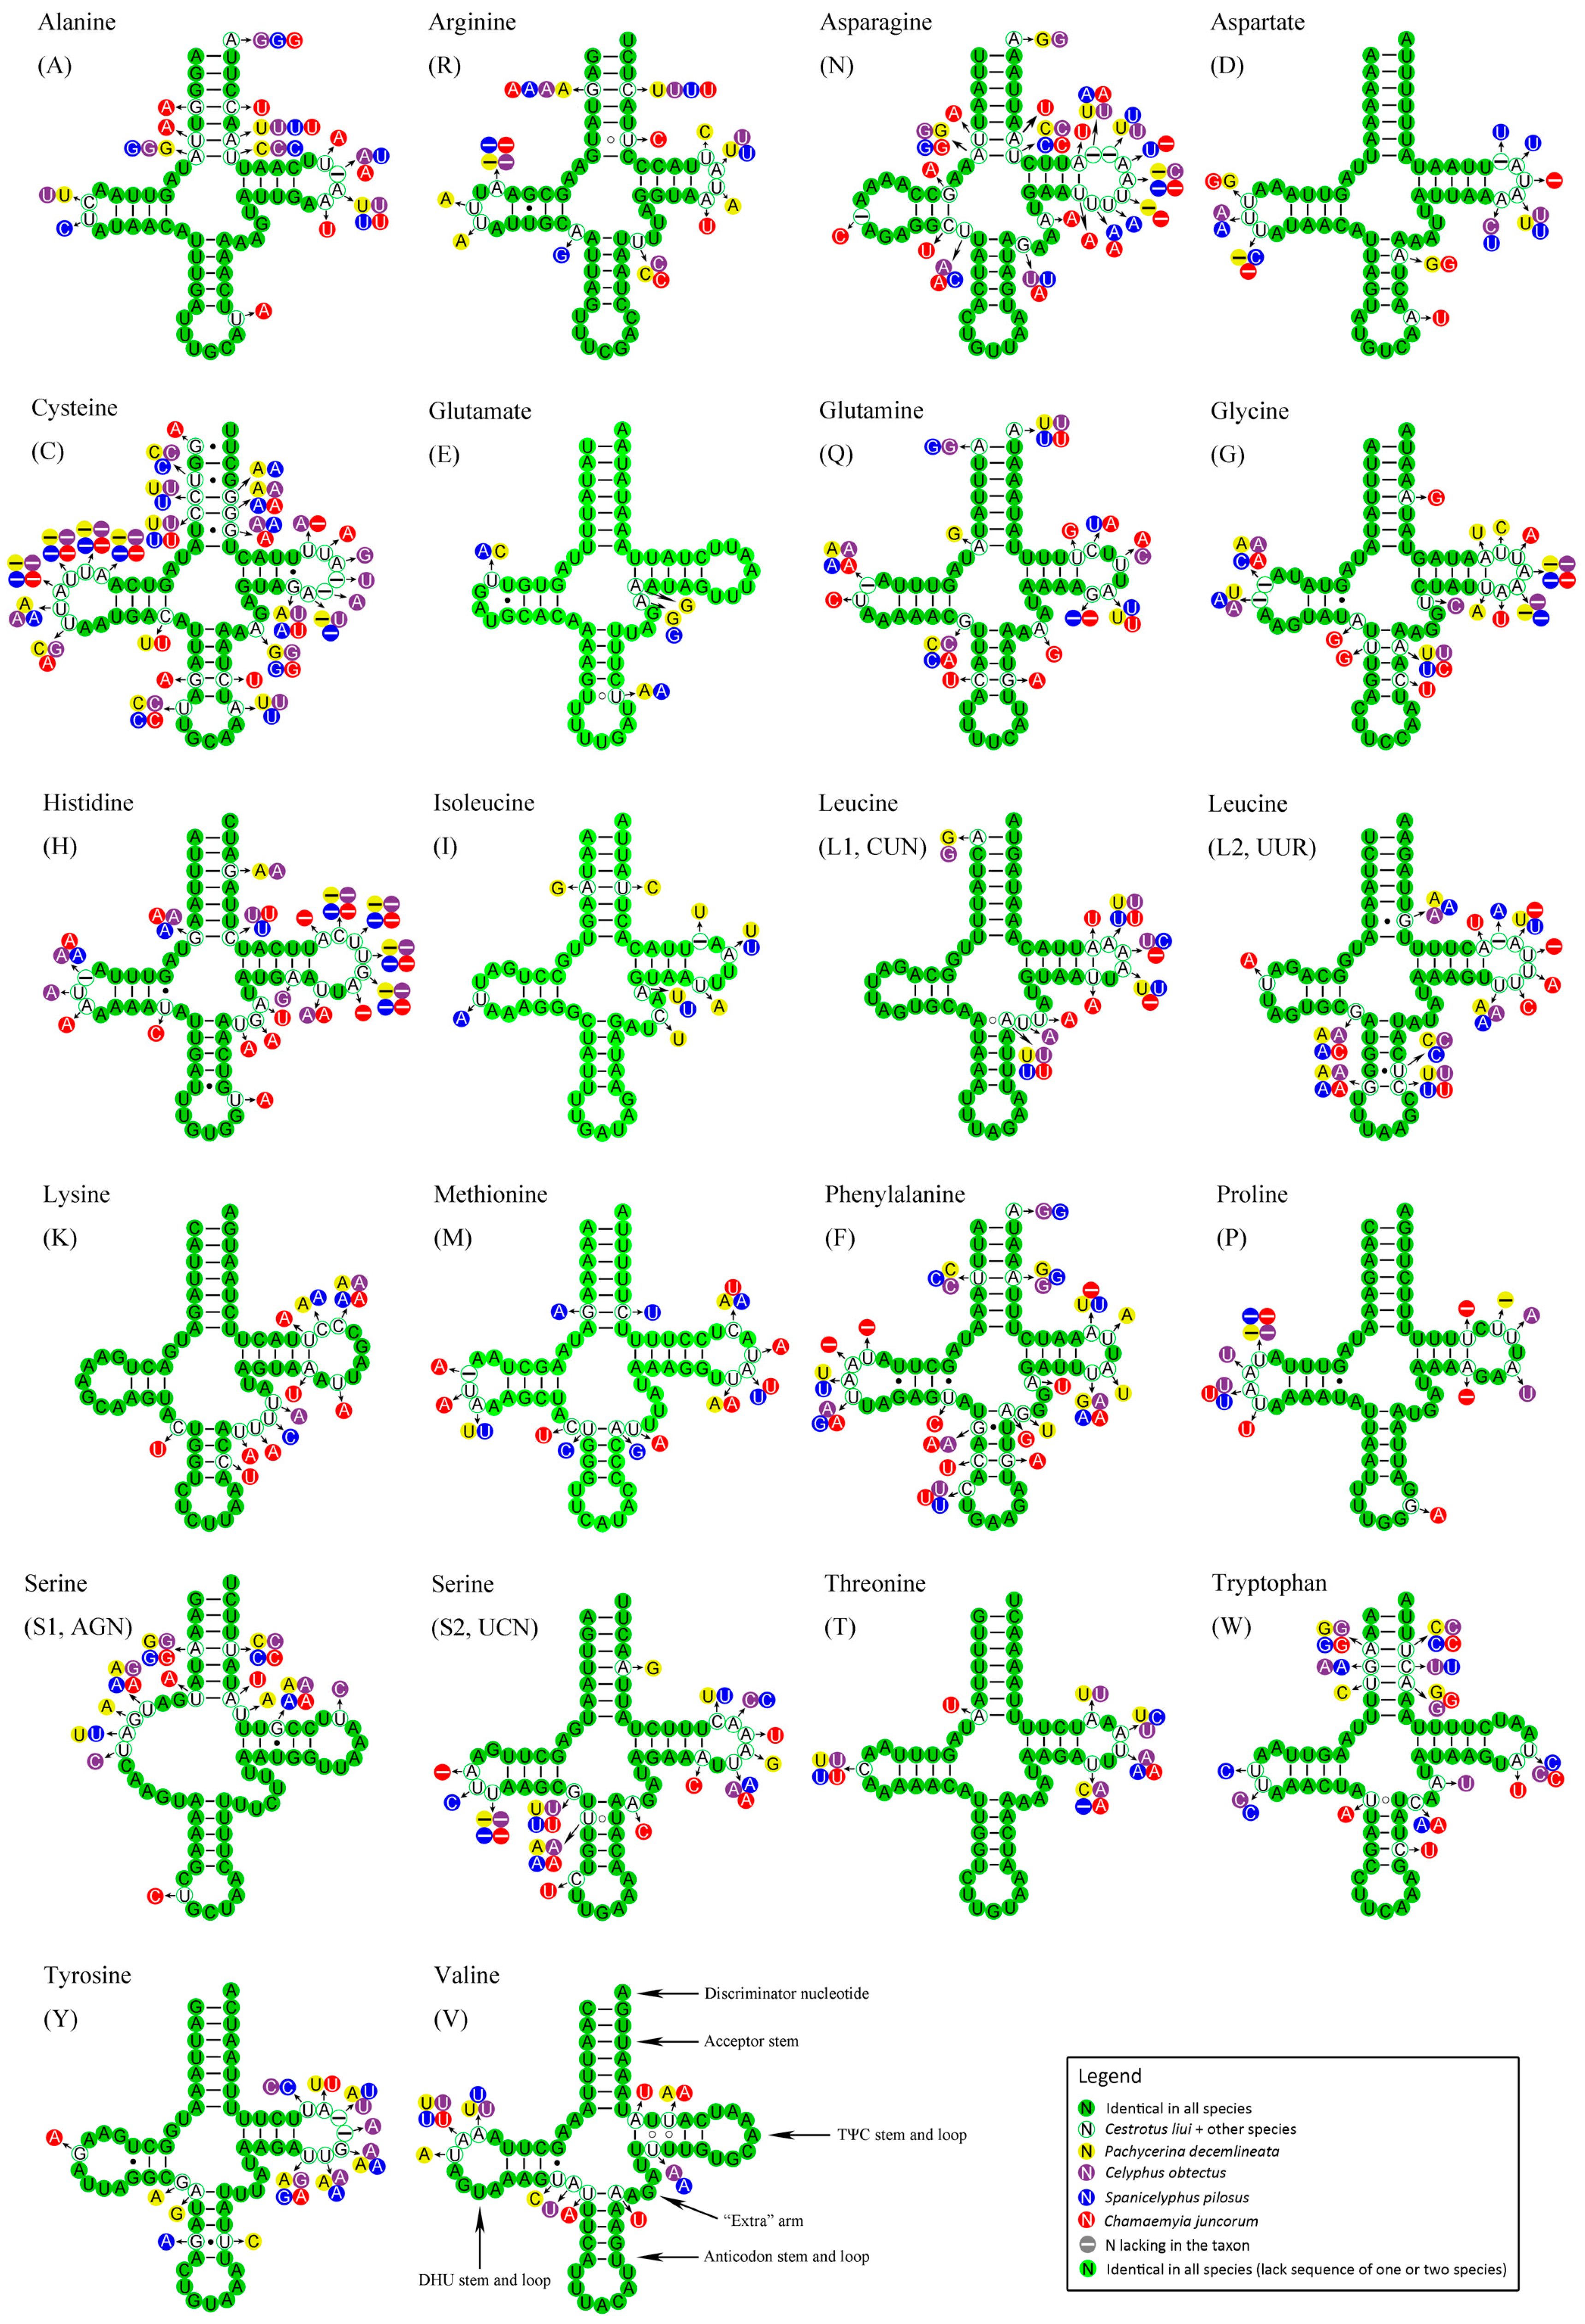
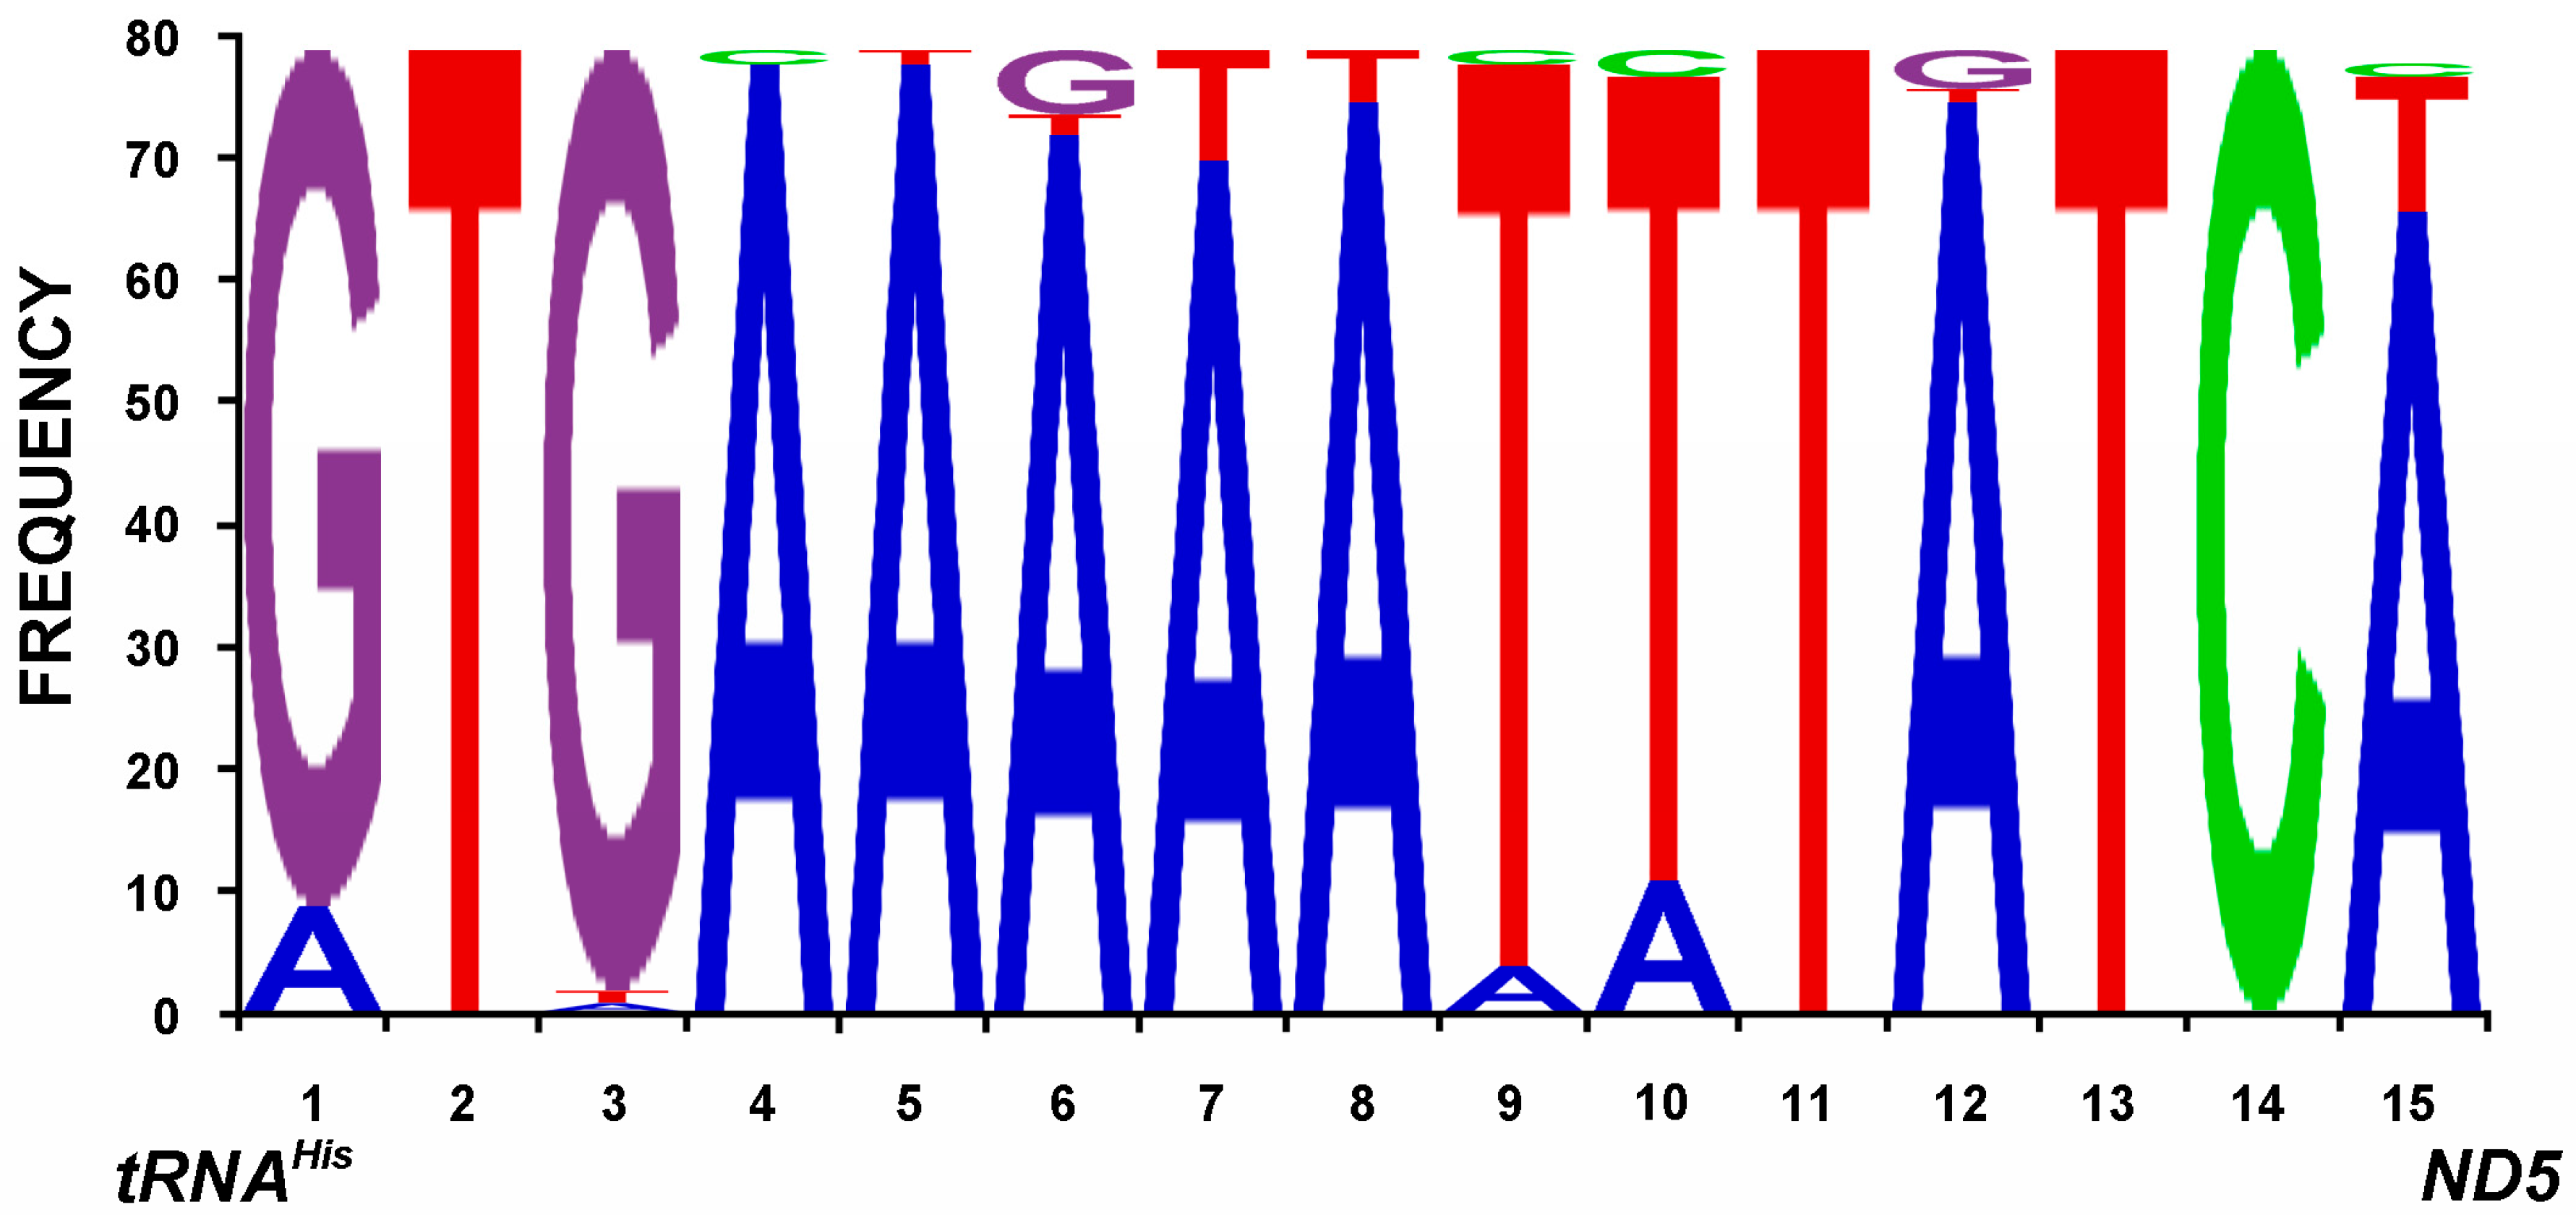
2.5. Transfer RNAs
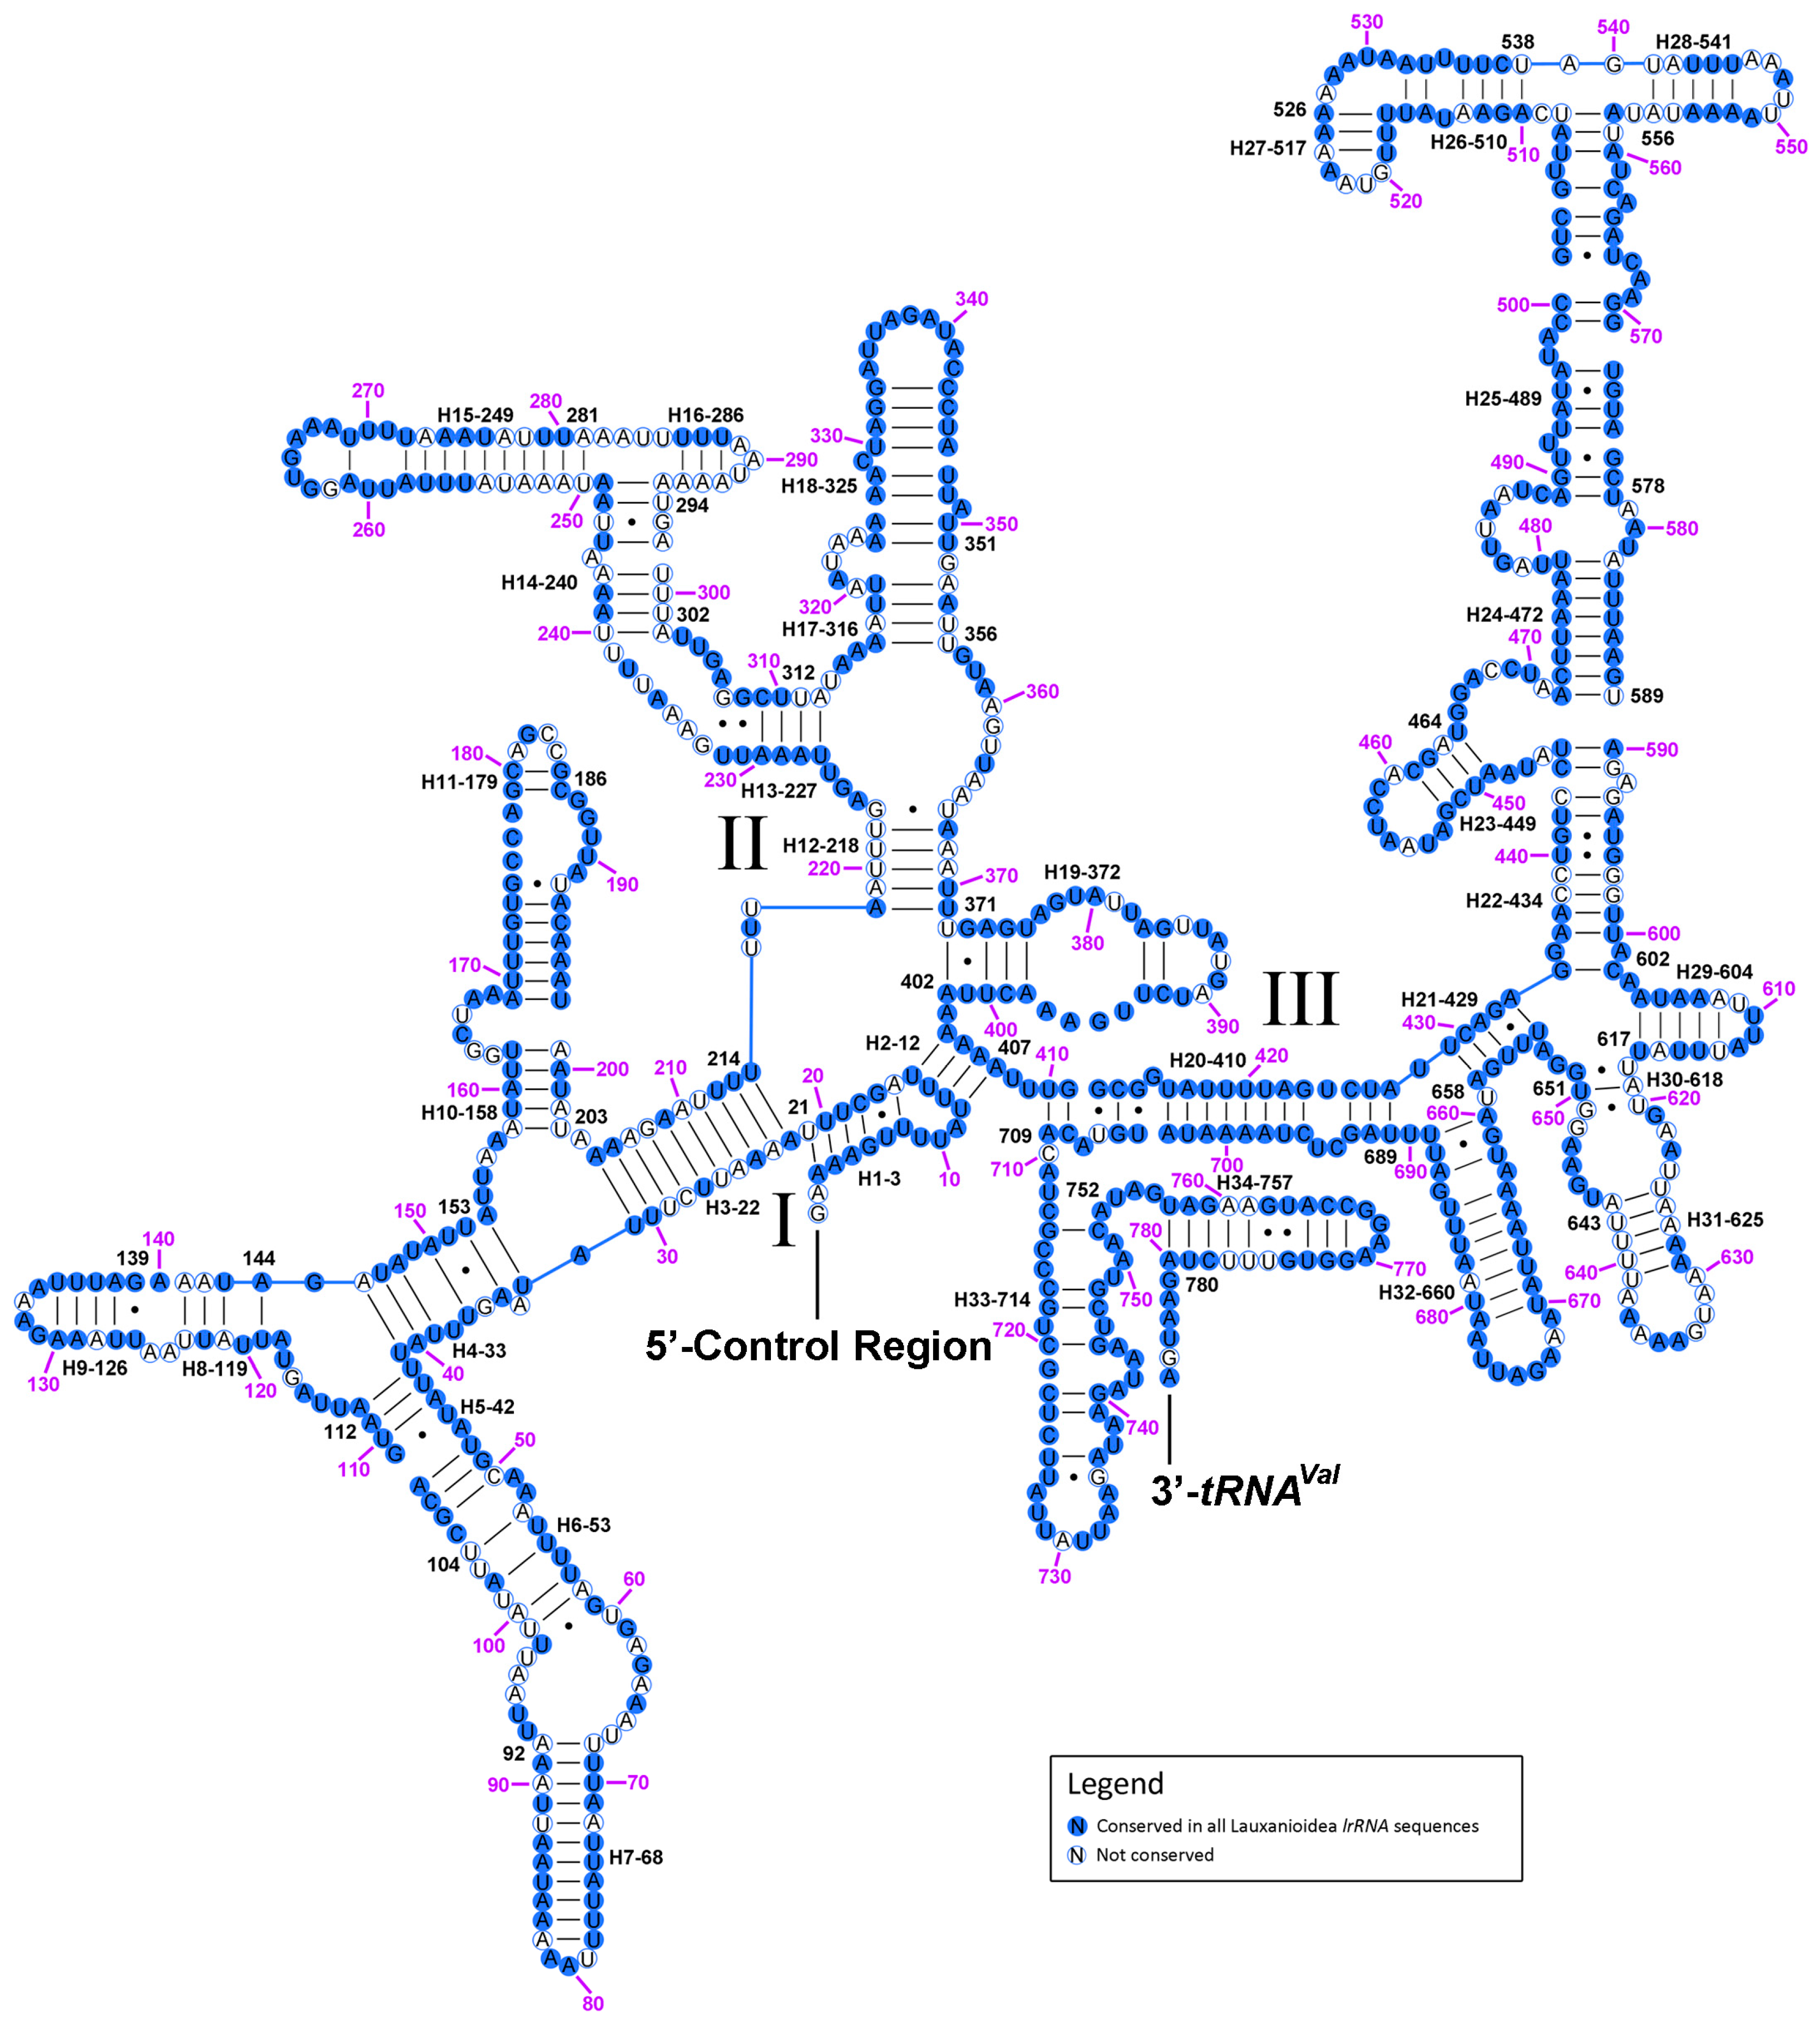
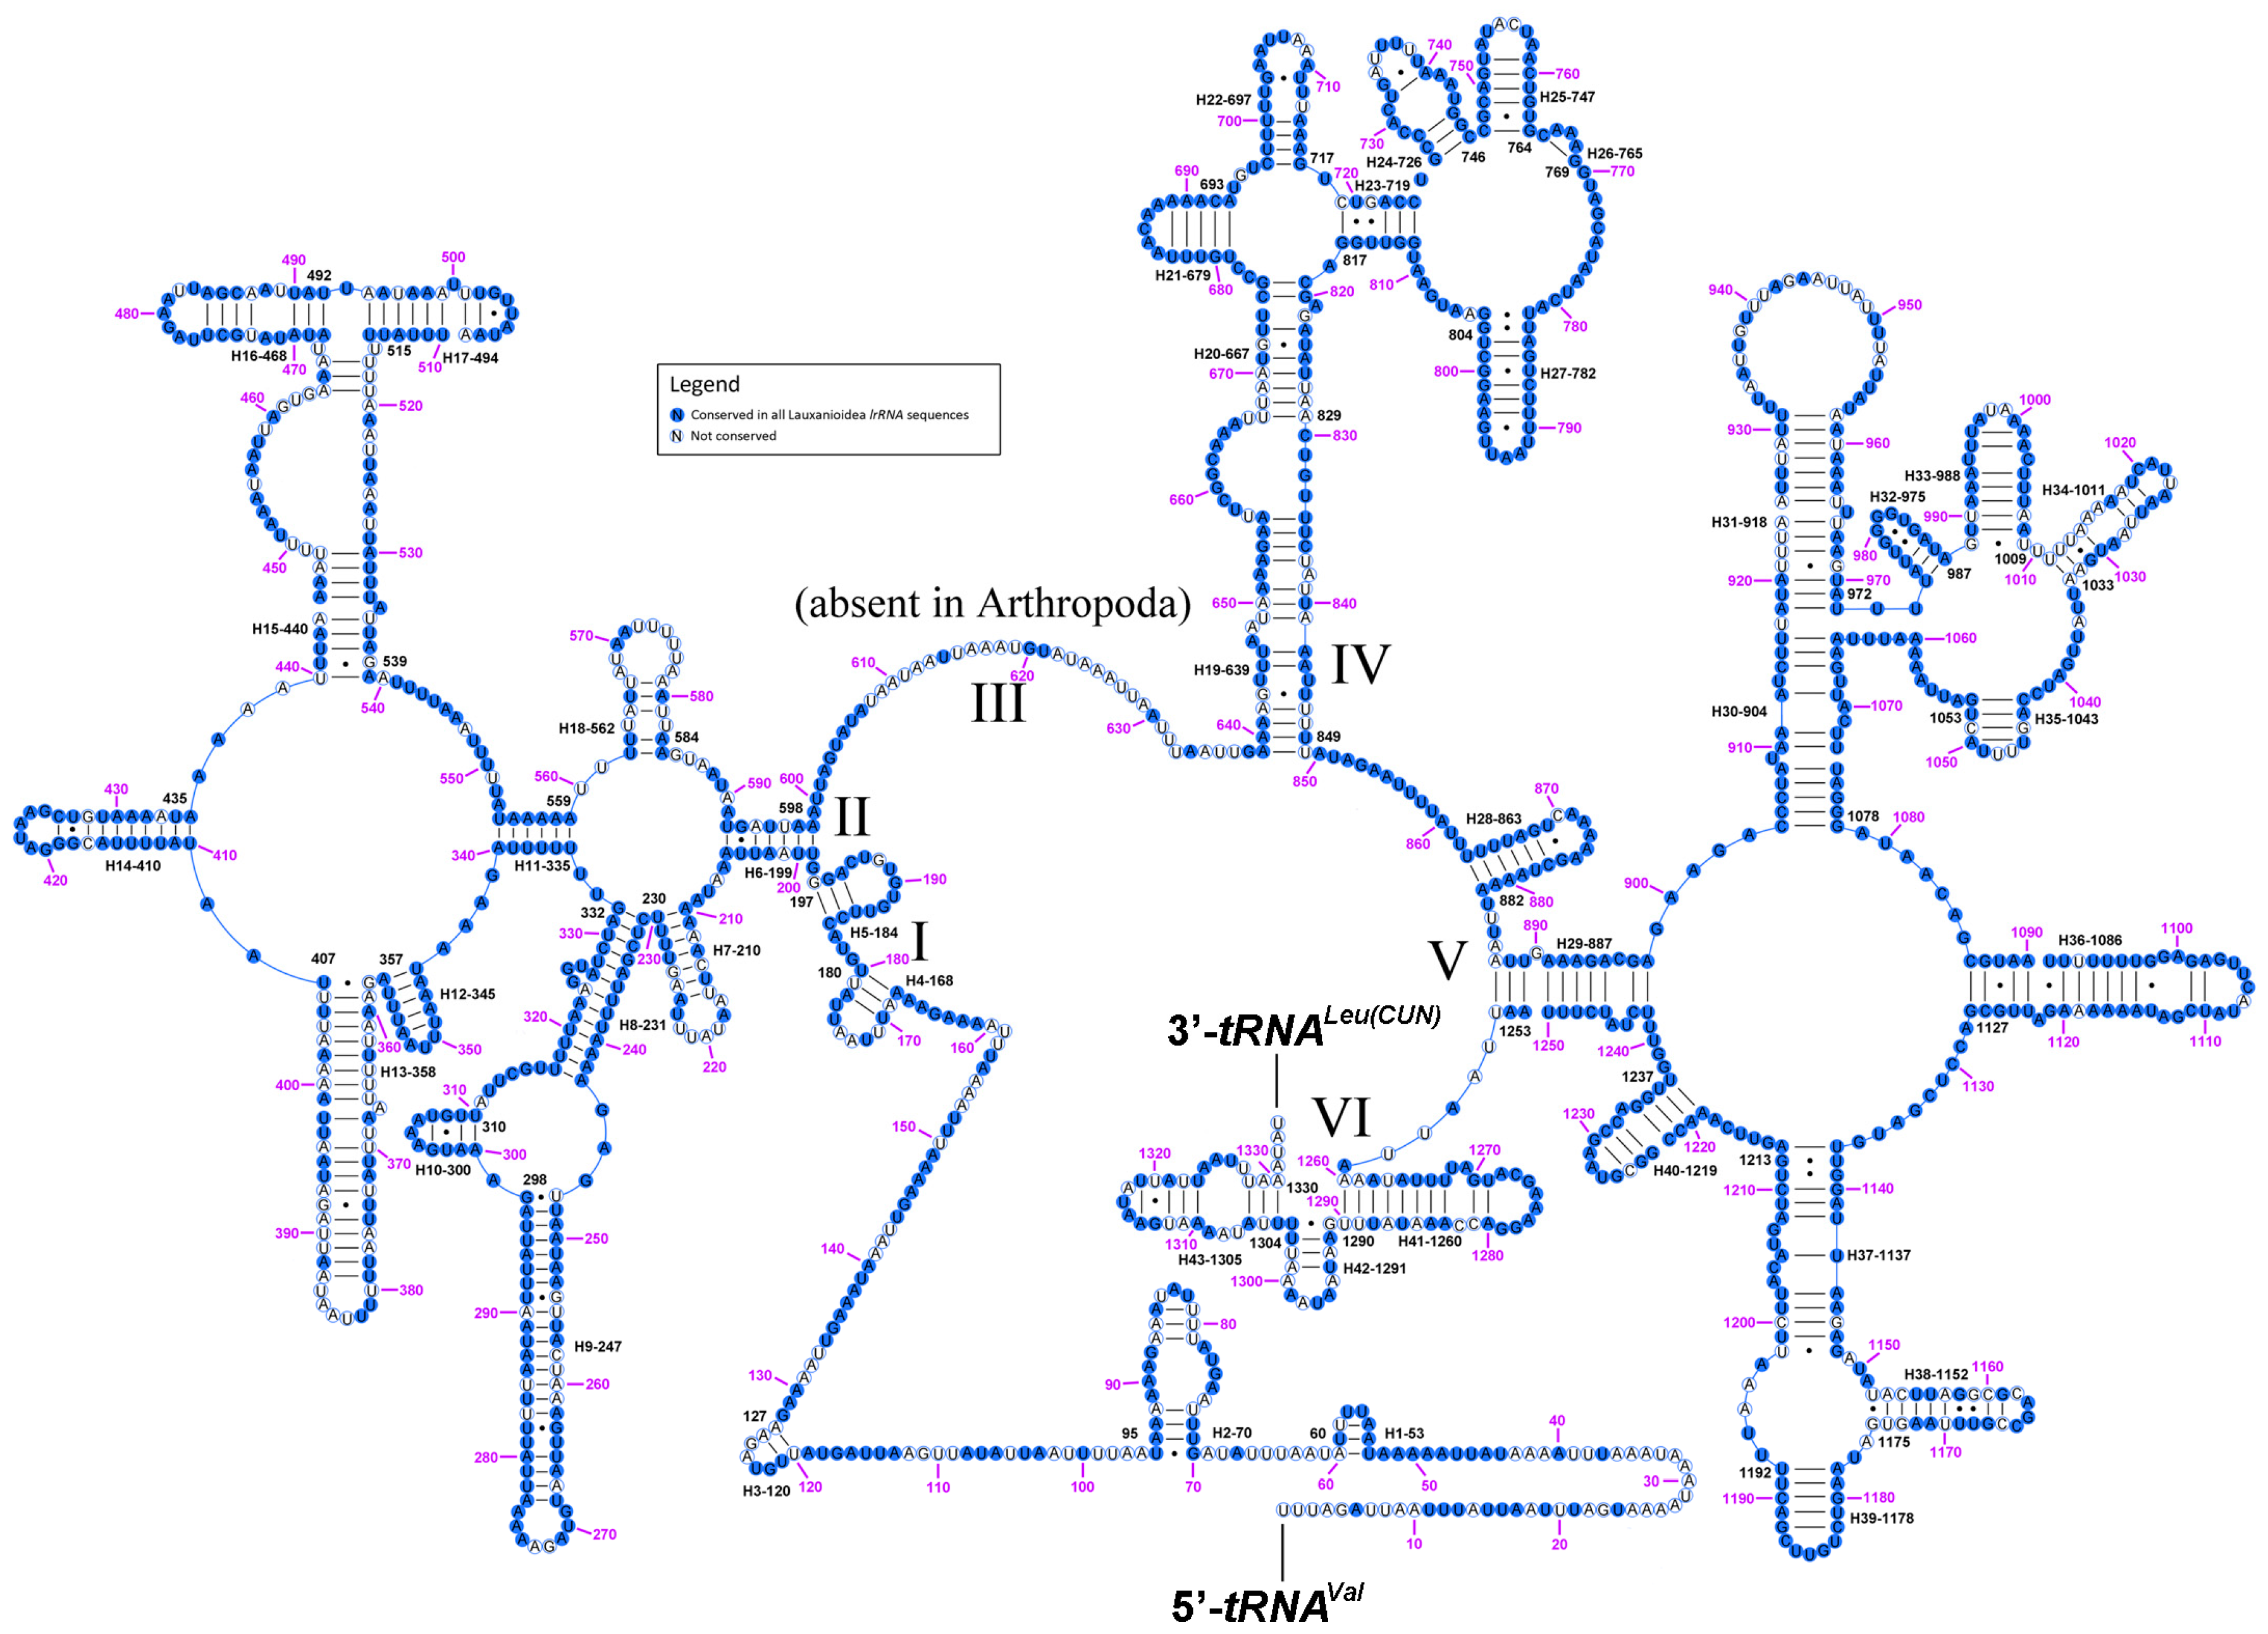
2.6. Ribosomal RNAs
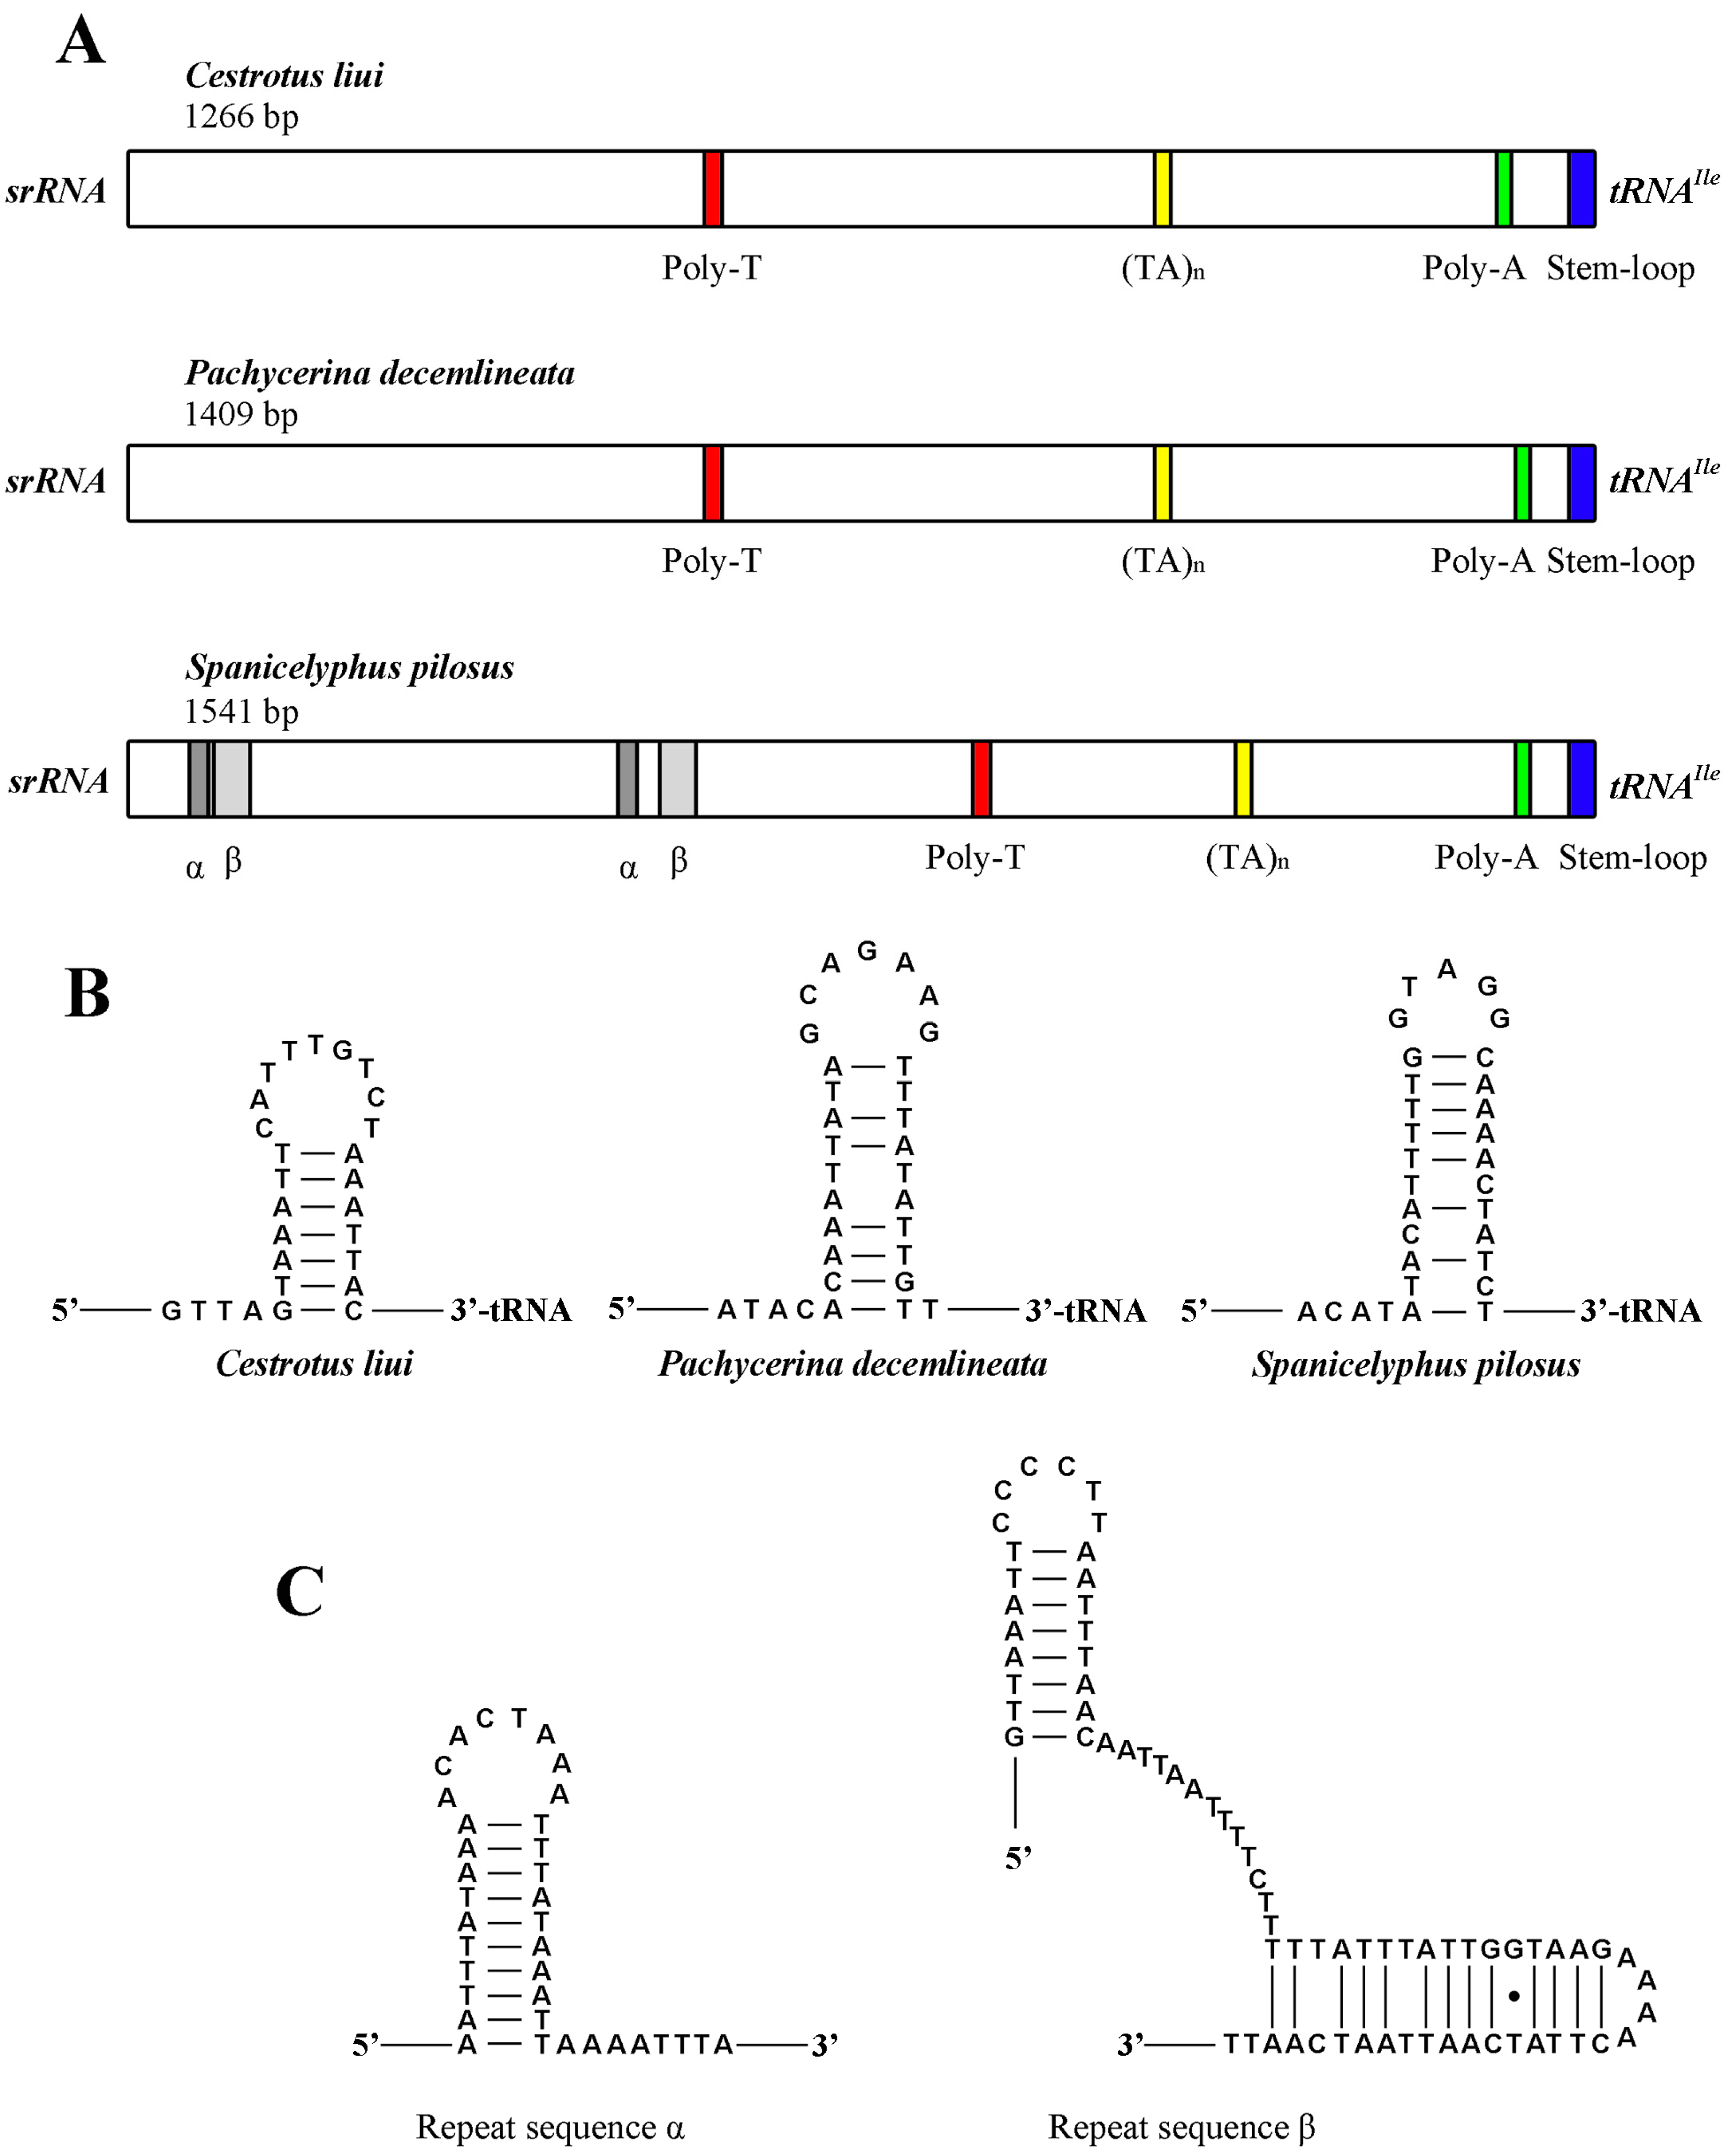
2.7. The Control Region
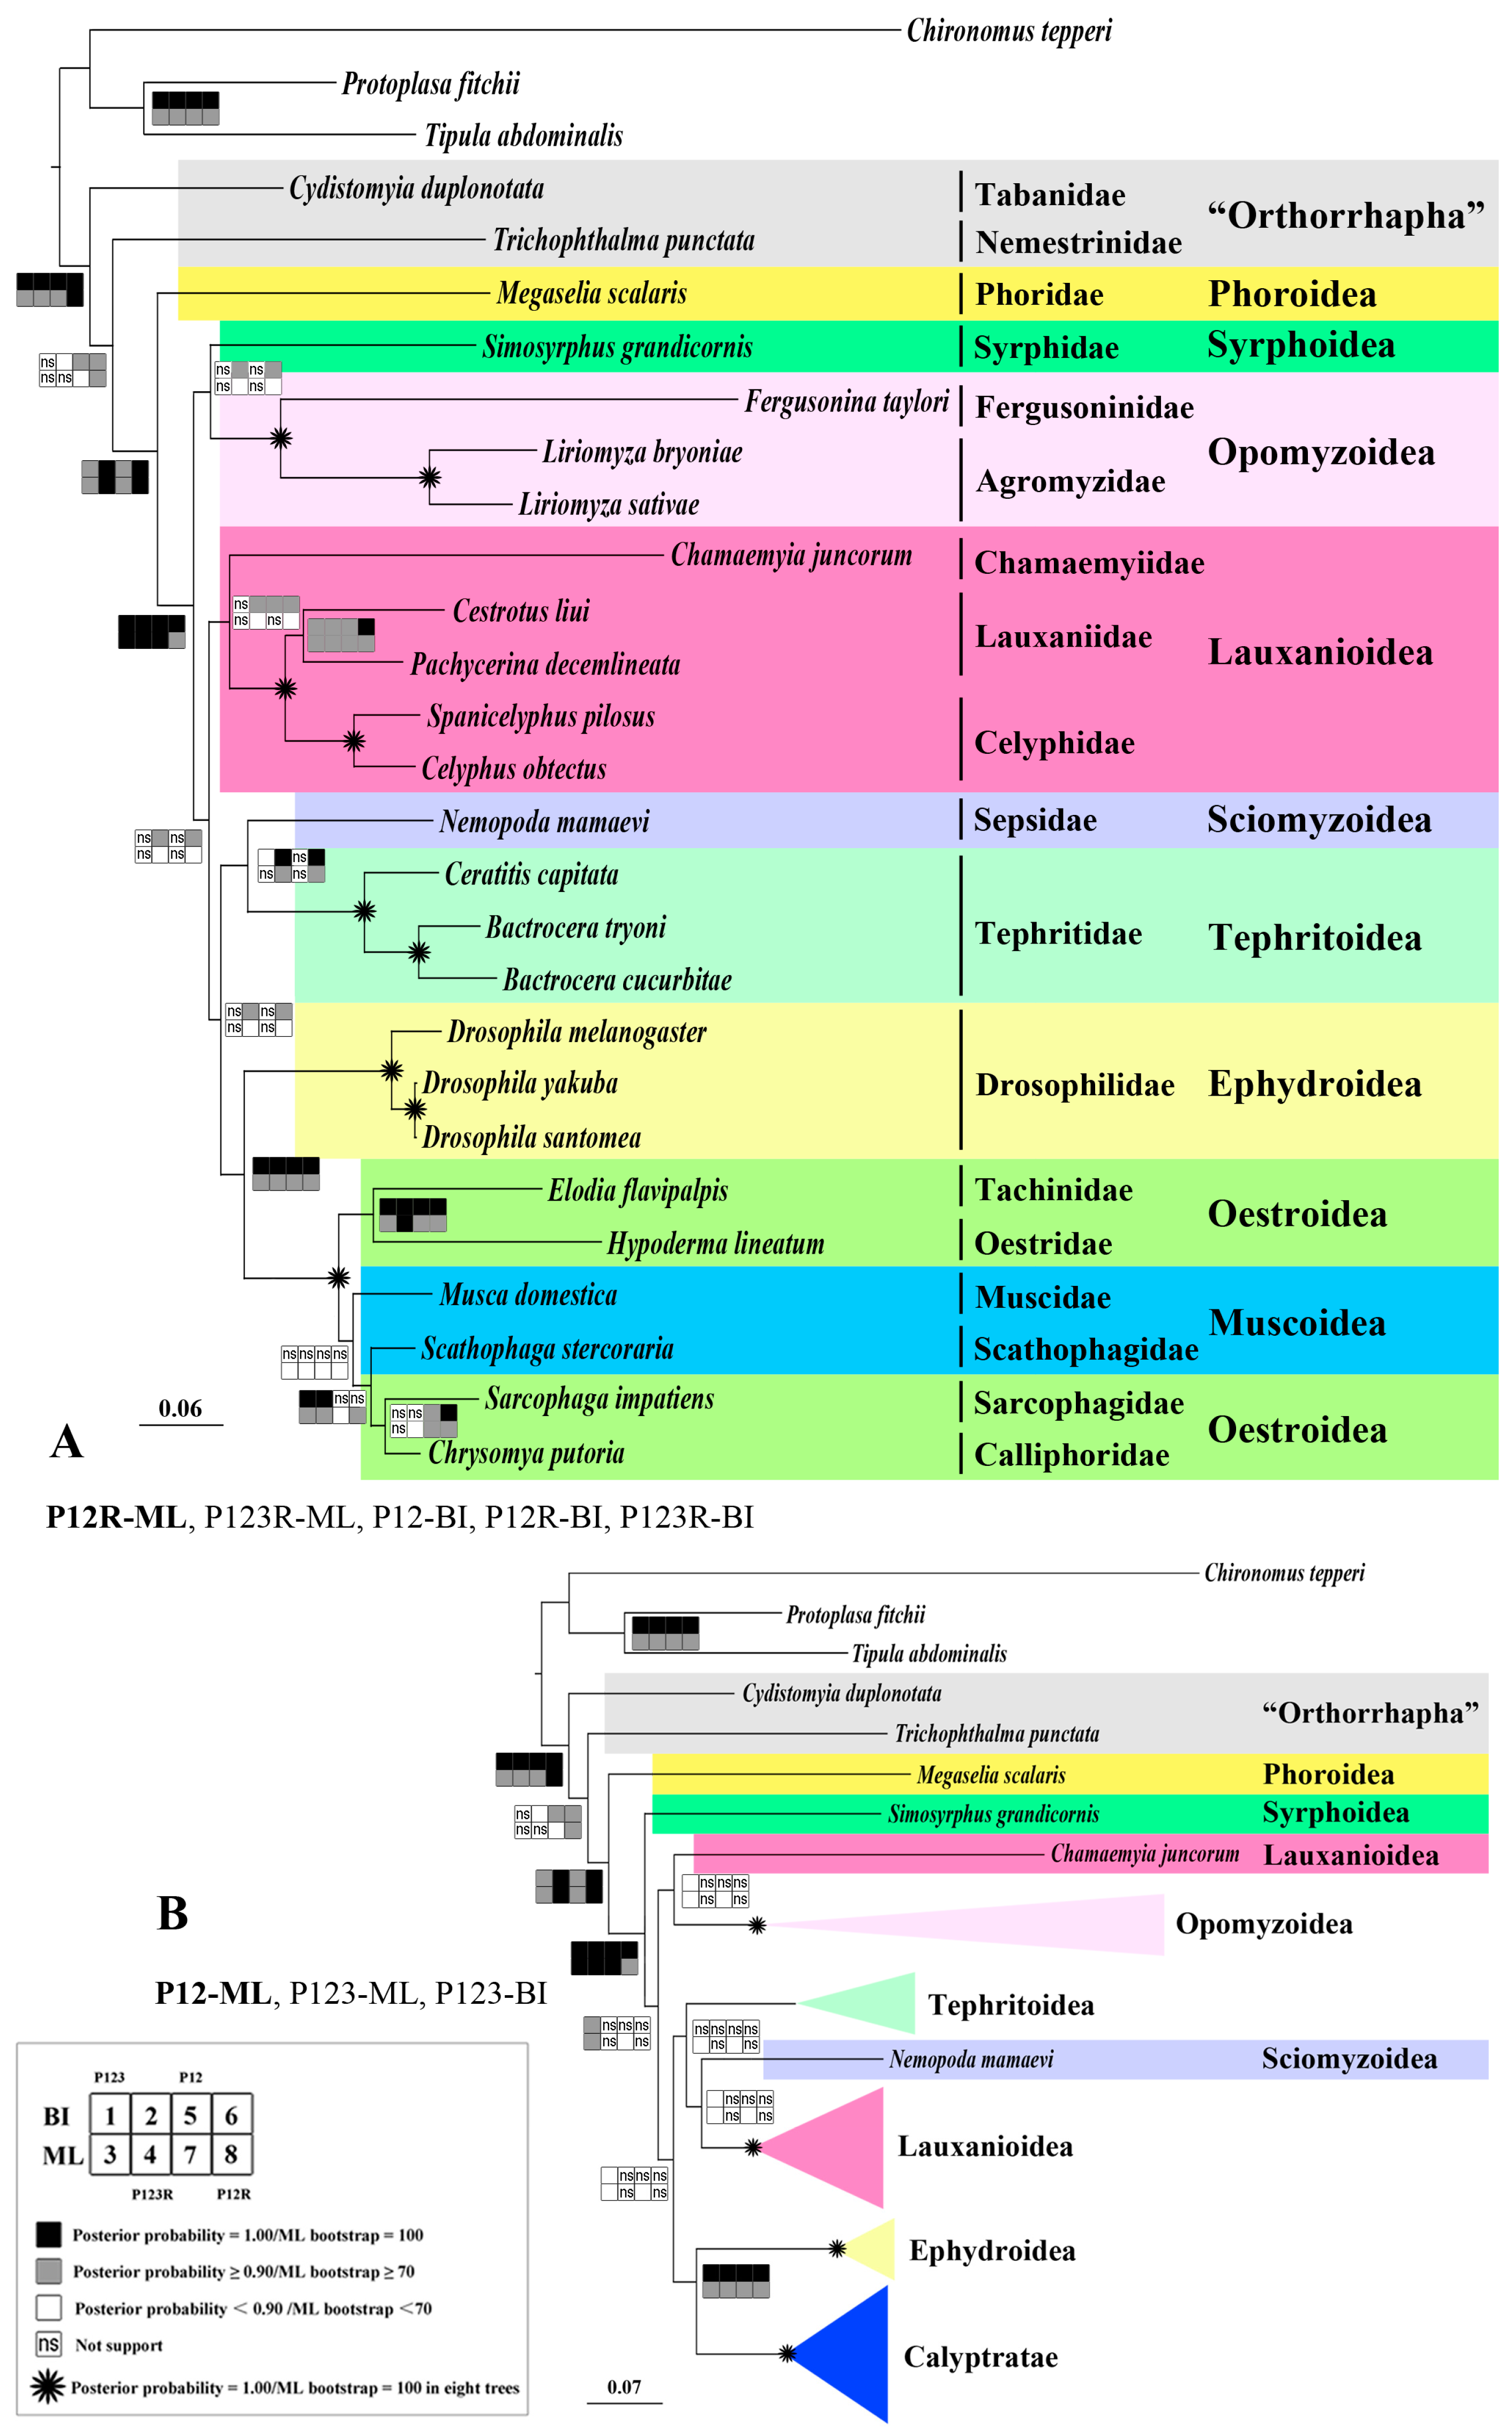
2.8. Phylogeny
3. Materials and Methods
3.1. Ethics Statement
3.2. Sampling and DNA Extraction
3.3. PCR Amplification and Sequencing
3.4. Bioinformatic Analysis
3.5. Phylogenetic Analysis
Supplementary Materials
Acknowledgments
Author Contributions
Conflicts of Interest
References
- Koehler, C.M.; Bauer, M.F. Mitochondrial Function and Biogenesis; Springer: Berlin, Germany, 2004; p. 341. [Google Scholar]
- Cameron, S.L. Insect mitochondrial genomics: Implications for evolution and phylogeny. Annu. Rev. Entomol. 2014, 59, 95–117. [Google Scholar] [CrossRef] [PubMed]
- Cameron, S.L. How to sequence and annotate insect mitochondrial genomes for systematic and comparative genomics research. Syst. Entomol. 2014, 39, 400–411. [Google Scholar] [CrossRef]
- Simon, C.; Frati, F.; Beckenbach, A.; Crespi, B.; Liu, H.; Flook, P. Evolution, weighting, and phylogenetic utility of mitochondrial gene-sequences and a compilation of conserved polymerase chain-reaction primers. Ann. Entomol. Soc. Am. 1994, 87, 651–701. [Google Scholar] [CrossRef]
- Cameron, S.L.; Sullivan, J.; Song, H.; Miller, K.B.; Whiting, M.F. A mitochondrial genome phylogeny of the Neuropterida (lace-wings, alderlies and snakelies) and their relationship to the other holometabolous insect orders. Zool. Scr. 2009, 38, 575–590. [Google Scholar] [CrossRef]
- Nelson, L.A.; Lambkin, C.L.; Batterham, P.; Wallman, J.F.; Dowton, M.; Whiting, M.F.; Yeates, D.K.; Cameron, S.L. Beyond barcoding: A mitochondrial genomics approach to molecular phylogenetics and diagnostics of blowflies (Diptera: Calliphoridae). Gene 2012, 511, 131–142. [Google Scholar] [CrossRef] [PubMed]
- Zhao, Z.; Su, T.; Chesters, D.; Wang, S.; Ho, S.Y.W.; Zhu, C.; Chen, X. The mitochondrial genome of Elodia flavipalpis Aldrich (Diptera: Tachinidae) and the evolutionary timescale of tachinid flies. PLoS ONE 2013, 8, e61814. [Google Scholar] [CrossRef] [PubMed]
- Ma, C.; Yang, P.; Jiang, F.; Chapuis, M.; Shali, Y.; Sword, G.A.; Kang, L. Mitochondrial genomes reveal the global phylogeography and dispersal routes of the migratory locust. Mol. Ecol. 2012, 21, 4344–4358. [Google Scholar] [CrossRef] [PubMed]
- Logue, K.; Chan, E.R.; Phipps, T.; Small, S.; Reimer, L.; Henry-Halldi, C.; Sattabongkot, J.; Siba, P.M.; Zimmerman, P.A.; Serre, D. Mitochondrial genome sequences reveal deep divergences among Anopheles punctulatus sibling species in Papua New Guinea. Malar J. 2013, 12, 64. [Google Scholar] [CrossRef] [PubMed]
- Clary, D.O.; Wolstenholme, D.R. The mitochondrial DNA molecule of Drosophila yakuba: Nucleotide sequence, gene organization, and genetic code. J. Mol. Evol. 1985, 22, 252–271. [Google Scholar] [CrossRef] [PubMed]
- Beckenbach, T.A. Mitochondrial genome sequences of Nematocera (Lower Diptera): Evidence of rearrangement following a complete genome duplication in a winter crane fly. Genome Biol. Evol. 2012, 4, 89–101. [Google Scholar] [CrossRef] [PubMed]
- Cameron, S.L.; Lambkin, C.L.; Barker, S.C.; Whiting, M.F. A mitochondrial genome phylogeny of Diptera: Whole genome sequence data accurately resolve relationships over broad timescales with high precision. Syst. Entomol. 2007, 32, 40–59. [Google Scholar] [CrossRef]
- Zhong, M.; Wang, X.; Liu, Q.; Luo, B.; Wu, C.; Wen, J. The complete mitochondrial genome of the scuttle fly, Megaselia scalaris (Diptera: Phoridae). Mitochondr. DNA Part A 2016, 27, 182–184. [Google Scholar] [CrossRef]
- Nelson, L.A.; Cameron, S.L.; Yeates, D.K. The complete mitochondrial genome of the gall-forming fly, Fergusonina taylori Nelson and Yeates (Diptera: Fergusoninidae). Mitochondr. DNA 2011, 22, 197–199. [Google Scholar] [CrossRef]
- Yang, F.; Du, Y.; Cao, J.; Huang, F. Analysis of three leafminers’ complete mitochondrial genomes. Gene 2013, 529, 1–6. [Google Scholar] [CrossRef] [PubMed]
- Yang, F.; Du, Y.; Wang, L.; Cao, J.; Yu, W. The complete mitochondrial genome of the leafminer Liriomyza sativae (Diptera: Agromyzidae): Great difference in the A + T-rich region compared to Liriomyza trifolii. Gene 2011, 485, 7–15. [Google Scholar] [CrossRef] [PubMed]
- Wang, S.; Lei, Z.; Wang, H.; Dong, B.; Ren, B. The complete mitochondrial genome of the leafminer Liriomyza trifolii (Diptera: Agromyzidae). Mol. Biol. Rep. 2011, 38, 687–692. [Google Scholar] [CrossRef]
- Ye, J.; Fang, R.; Yi, J.; Zhou, G.; Zheng, J. The complete sequence determination and analysis of four species of Bactrocera mitochondrial genome. Plant Quarantine 2010, 24, 11–14. [Google Scholar]
- Yu, D.J.; Xu, L.; Nardi, F.; Li, J.G.; Zhang, R.J. The complete nucleotide sequence of the mitochondrial genome of the oriental fruit fly, Bactrocera dorsalis (Diptera: Tephritidae). Gene 2007, 396, 66–74. [Google Scholar] [CrossRef]
- Zhang, B.; Nardi, F.; Hull-Sanders, H.; Wan, X.; Liu, Y. The complete nucleotide sequence of the mitochondrial genome of Bactrocera minax (Diptera: Tephritidae). PLoS ONE 2014, 9, e100558. [Google Scholar] [CrossRef] [PubMed]
- Nardi, F.; Carapelli, A.; Dallai, R.; Frati, F. The mitochondrial genome of the olive fly Bactrocera oleae: Two haplotypes from distant geographical locations. Insect Mol. Biol. 2003, 12, 605–611. [Google Scholar] [CrossRef]
- Nardi, F.; Carapelli, A.; Boore, J.L.; Roderick, G.K.; Dallai, R.; Frati, F. Domestication of olive fly through a multi-regional host shift to cultivated olives: Comparative dating using complete mitochondrial genomes. Mol. Phylogenet. Evol. 2010, 57, 678–686. [Google Scholar] [CrossRef] [PubMed]
- Spanos, L.; Koutroumbas, G.; Kotsyfakis, M.; Louis, C. The mitochondrial genome of the Mediterranean fruit fly, Ceratitis capitata. Insect Mol. Biol. 2000, 9, 139–144. [Google Scholar] [CrossRef] [PubMed]
- Clark, A.G.; Eisen, M.B.; Smith, D.R.; Bergman, C.M.; Oliver, B.; Markow, T.A.; Kaufman, T.C.; Kellis, M.; Gelbart, W.; Iyer, V.N.; et al. Evolution of genes and genomes on the Drosophila phylogeny. Nature 2007, 450, 203–218. [Google Scholar] [CrossRef] [PubMed]
- Andrianov, B.; Goryacheva, I.; Mugue, N.; Sorokina, S.; Gorelova, T.; Mitrfanov, V. Comparative analysis of the mitochondrial genomes in Drosophila virilis species group (Diptera: Drosophilidae). Trends Evol. Biol. 2010, 2, e4. [Google Scholar] [CrossRef]
- Lewis, D.L.; Farr, C.L.; Kaguni, L.S. Drosophila melanogaster mitochondrial DNA: Completion of the nucleotide sequence and evolutionary comparisons. Insect Mol. Biol. 1995, 4, 263–278. [Google Scholar] [CrossRef] [PubMed]
- Torres, T.T.; Dolezal, M.; Schlötterer, C.; Otenwalder, B. Expression profiling of Drosophila mitochondrial genes via deep mRNA sequencing. Nucleic Acids Res. 2009, 37, 7509–7518. [Google Scholar] [CrossRef] [PubMed]
- Llopart, A.; Herrig, D.; Brud, E.; Stecklein, Z. Sequential adaptive introgression of the mitochondrial genome in Drosophila yakuba and Drosophila santomea. Mol. Ecol. 2014, 23, 1124–1136. [Google Scholar] [CrossRef] [PubMed]
- Ballard, J.W.O. Comparative genomics of mitochondrial DNA in members of the Drosophila melanogaster subgroup. J. Mol. Evol. 2000, 51, 48–63. [Google Scholar] [CrossRef] [PubMed]
- Li, X.; Ding, S.; Cameron, S.L.; Kang, Z.; Wang, Y.; Yang, D. The First Mitochondrial genome of the sepsid fly Nemopoda mamaevi Ozerov, 1997 (Diptera: Sciomyzoidea: Sepsidae), with mitochondrial genome phylogeny of Cyclorrhapha. PLoS ONE 2015, 10, e0123594. [Google Scholar] [CrossRef] [PubMed]
- Oliveira, M.T.; Barau, J.G.; Junqueira, A.C.M.; Ferjao, P.C.; da Rosa, A.C.; Abreu, C.F.; Azeredo-Espin, A.M.L. Structure and evolution of the mitochondrial genomes of Haematobia irritans and Stomoxys calcitrans: The Muscidae (Diptera: Calyptratae) perspective. Mol. Phylogenet. Evol. 2008, 48, 850–857. [Google Scholar] [CrossRef] [PubMed]
- Li, X.; Wang, Y.Y.; Su, S.; Yang, D. The complete mitochondrial genomes of Musca domestica and Scathophaga stercoraria (Diptera: Muscoidea: Muscidae and Scathophagidae). Mitochondr. DNA Part A 2016, 27, 1435–1436. [Google Scholar] [CrossRef] [PubMed]
- Ding, S.; Li, X.; Wang, N.; Cameron, S.L.; Mao, M.; Wang, Y.; Xi, Y.; Yang, D. The phylogeny and evolutionary timescale of muscoidea (Diptera: Brachycera: Calyptratae) inferred from mitochondrial genomes. PLoS ONE 2015, 10, e0134170. [Google Scholar] [CrossRef] [PubMed]
- Junqueira, A.C.M.; Lessinger, A.C.; Torres, T.T.; da Silva, F.R.; Vettore, A.L.; Arruda, P.; Espin, A.M.L. The mitochondrial genome of the blowfly Chrysomya chloropyga (Diptera: Calliphoridae). Gene 2004, 339, 7–15. [Google Scholar] [CrossRef] [PubMed]
- Lessinger, A.C.; Martins Junqueira, A.C.; Lemos, T.A.; Kemper, E.L.; da Silva, F.R.; Vettore, A.L.; Arruda, P.; Azeredo-Espin, A.M.L. The mitochondrial genome of the primary screwworm fly Cochliomyia hominivorax (Diptera: Calliphoridae). Insect Mol. Biol. 2000, 9, 521–529. [Google Scholar] [CrossRef] [PubMed]
- De Azeredo-Espin, A.M.L. The complete mitochondrial genome of the human bot fly Dermatobia hominis (Diptera: Oestridae). In Proceedings of the 2004 ESA Annual Meeting and Exhibition, Salt Lake City, UT, USA, 14–17 November 2004. [Google Scholar]
- Weigl, S.; Testini, G.; Parisi, A.; Dantas-Torres, F.; Traversa, D.; Colwell, D.D.; Otranto, D. The mitochondrial genome of the common cattle grub, Hypoderma lineatum. Med. Vet. Entomol. 2010, 24, 329–335. [Google Scholar] [CrossRef] [PubMed]
- Zhong, M.; Wang, X.; Liu, Q.; Luo, B.; Wu, C.; Wen, J. The complete mitochondrial genome of the flesh fly, Boettcherisca peregrine (Diptera: Sarcophagidae). Mitochondr. DNA Part A 2016, 27, 106–108. [Google Scholar] [CrossRef] [PubMed]
- Shao, Y.; Hu, X.; Wang, R.; Gao, R.; Lin, C.; Shen, W.; Li, R.; Li, B. Structure and evolution of the mitochondrial genome of Exorista sorbillans: The Tachinidae (Diptera: Calyptratae) perspective. Mol. Biol. Rep. 2012, 39, 11023–11030. [Google Scholar] [CrossRef] [PubMed]
- Hendel, F. Beitrage zur Systematik der Acalyptraten Musciden. Ent. Mitt. 1916, 5, 294–299. [Google Scholar]
- Hendel, F. Die palaarktischen Muscidae Acalyptrate Girsch. = Haplostomata Frey nach ihre Familien und Gattungen I. Die Familien. Konowia 1922, 1, 145–160. [Google Scholar]
- Hennig, W. Die Familien der Diptera Schizophora und ihre phylogenetischen Verwandtschaftsbeziehungen. Entomol. Beitr. 1958, 8, 505–688. [Google Scholar]
- Hennig, W. Neue Untersuchungen über die Familien der Diptera Schizophora (Diptera: Cyclorrhapha). Stuttg. Beitr. Naturk. 1971, 226, 1–76. (In German) [Google Scholar]
- Hennig, W. Diptera (Zweiflügler). Handbuch der Zoologie 1973, 4, 1–200. [Google Scholar]
- Gaimari, S.D.; Silva, V.C. Revision of the Neotropical subfamily Eurychoromyiinae (Diptera: Lauxaniidae). Zootaxa 2010, 2342, 1–64. [Google Scholar]
- Reddersen, J. Distribution and abundance of lauxaniid flies in Danish cereal fields in relation to pesticides, crop and field boundary (Diptera, Lauxaniidae). Entomol. Medd. 1994, 62, 117–128. [Google Scholar]
- Marshall, S.A. Flies: The Natural History & Diversity of Diptera; Firefly Books: Richmond Hill, ON, Canada, 2012; p. 616. [Google Scholar]
- Yeates, D.K.; Wiegmann, B.M.; Courtney, G.W.; Meier, R.; Lambkin, C.; Pape, T. Phylogeny and systematics of Diptera: Two decades of progress and prospects. Zootaxa 2007, 1688, 565–590. [Google Scholar]
- McAlpine, J.F. Phylogeny and classification of the Muscomorpha. In Manual of Nearctic Diptera; McAlpine, J.F., Wood, D.M., Eds.; Research Branch Agriculture Canada: Ottawa, ON, Canada, 1989; Volume 3, pp. 1397–1518. [Google Scholar]
- Griffiths, G.C. The Phylogenetic Classification of Diptera Cyclorrhapha, with Special Reference to the Structure of the Male Postabdomen; Springer: The Hague, The Netherlands, 1972; p. 339. [Google Scholar]
- Wiegmann, B.M.; Trautwein, M.D.; Winkler, I.S.; Barr, N.B.; Kim, J.; Lambkin, C.; Bertone, M.A.; Cassel, B.K.; Bayless, K.M.; Heimberg, A.M.; et al. Episodic radiations in the fly tree of life. Proc. Natl. Acad. Sci. USA 2011, 108, 5690–5695. [Google Scholar] [CrossRef] [PubMed]
- Hennig, W. Die Acalyptratae des Baltischer Bernsteins. Stuttg. Beitr. Naturk. 1965, 145, 1–215. [Google Scholar]
- Lambkin, C.L.; Sinclair, B.J.; Pape, T.; Courtney, G.W.; Skevington, J.H.; Meier, R.; Yeates, D.K.; Blagoderov, V.; Wiegmann, B.M. The phylogenetic relationships among infraorders and superfamilies of Diptera based on morphological evidence. Syst. Entomol. 2013, 38, 164–179. [Google Scholar] [CrossRef]
- Zhu, Z.; Liao, H.; Ling, J.; Cai, J.; Ding, Y. The complete mitochondria genome of Aldrichina grahami (Diptera: Calliphoridae). Mitochondr. DNA Part B 2016, 1, 107–109. [Google Scholar] [CrossRef]
- Grant, J.R.; Stothard, P. The CGView Server: A comparative genomics tool for circular genomes. Nucleic Acids Res. 2008, 36, W181–W184. [Google Scholar] [CrossRef] [PubMed]
- Wei, S.; Shi, M.; Chen, X.; Sharkey, M.J.; van Achterberg, C.; Ye, G.; He, J. New views on strand asymmetry in insect mitochondrial genomes. PLoS ONE 2010, 5, e12708. [Google Scholar] [CrossRef] [PubMed]
- Cameron, S.L.; Lo, N.; Bourguignon, T.; Svenson, G.J.; Evans, T.A. A mitochondrial genome phylogeny of termites (Blattodea: Termitoidae): Robust support for interfamilial relationships and molecular synapomorphies define major clades. Mol. Phylogenet. Evol. 2012, 65, 163–173. [Google Scholar] [CrossRef] [PubMed]
- Roberti, M.; Polosa, P.L.; Bruni, F.; Musicco, C.; Gadaleta, M.N.; Cantatore, P. DmTTF, a novel mitochondrial transcription termination factor that recognizes two sequences of Drosophila melanogaster mitochondrial DNA. Nucleic Acids Res. 2003, 31, 1597–1604. [Google Scholar] [CrossRef] [PubMed]
- Taanman, J.W. Themitochondrial genome: Structure, transcription, translation and replication. Biochim. Biophys. Acta 1999, 1410, 103–123. [Google Scholar] [CrossRef]
- Wolstenholme, D.R. Animal mitochondrial DNA: Structure and evolution. Int. Rev. Cytol. 1992, 141, 173–216. [Google Scholar] [PubMed]
- Lavrov, D.V.; Brown, W.M.; Boore, J.L. A novel type of RNA editing occurs in the mitochondrial tRNAs of the centipede Lithobius forficatus. Proc. Natl. Acad. Sci. USA 2000, 97, 13738–13742. [Google Scholar] [CrossRef] [PubMed]
- Cannone, J.J.; Subramanian, S.; Schnare, M.N.; Collett, J.R.; D’Souza, L.M.; Du, Y.; Feng, B.; Lin, N.; Madabusi, L.V.; Muller, K.M. The Comparative RNA Web (CRW) Site: An online database of comparative sequence and structure information for ribosomal, intron, and other RNAs. BMC Bioinform. 2002, 3, 1–31. [Google Scholar]
- Abascal, F.; Posada, D.; Zardoya, R. The evolution of the mitochondrial genetic code in arthropods revisited. Mitochondr. DNA 2012, 23, 84–91. [Google Scholar] [CrossRef] [PubMed]
- Abascal, F.; Posada, D.; Knight, R.D.; Zardoya, R. Parallel evolution of the genetic code in arthropod mitochondrial genomes. PLoS Biol. 2006, 4, 711–718. [Google Scholar] [CrossRef] [PubMed]
- Knight, R.D.; Freeland, S.J.; Landweber, L.F. Rewiring the keyboard: Evolvability of the genetic code. Nat. Rev. Genet. 2001, 2, 49–58. [Google Scholar] [CrossRef] [PubMed]
- Rawlings, T.A.; Collins, T.M.; Bieler, R. Changing identities: tRNA duplication and remolding within animal mitochondrial genomes. Proc. Natl. Acad. Sci. USA 2003, 100, 15700–15705. [Google Scholar] [CrossRef]
- Sengupta, S.; Yang, X.G.; Higgs, P.G. The mechanisms of codon reassignments in mitochondrial genetic codes. J. Mol. Evol. 2007, 64, 662–688. [Google Scholar] [CrossRef] [PubMed]
- Wang, Y.; Li, H.; Wang, P.; Song, F.; Cai, W. Comparative Mitogenomics of Plant Bugs (Hemiptera: Miridae): Identifying the AGG Codon Reassignments between Serine and Lysine. PLoS ONE 2014, 9, e101375. [Google Scholar] [CrossRef] [PubMed]
- Boore, J.L. Requirements and standards for organelle genome databases. OMICS 2006, 10, 119–126. [Google Scholar] [CrossRef] [PubMed]
- Griffiths, G. Book review: Manual of Nearctic Diptera, Vol. 3. Quaest. Entomol. 1990, 26, 117–130. [Google Scholar]
- Cumming, J.M.; Sinclair, B.J.; Wood, D.M. Homology and phylogenetic implications of male genitalia in Diptera-Eremoneura. Entomol. Scand. 1995, 26, 121–151. [Google Scholar] [CrossRef]
- Wada, S. Morphologische Indizien für das unmittelbare Schwestergruppenverhältnis der Schizophora mit den Syrphoidea (‘Aschiza‘) in der phylogenetischen Systematik der Cyclorrhapha (Diptera: Brachycera). J. Nat. Hist. 1991, 25, 1531–1570. (In German) [Google Scholar] [CrossRef]
- Zatwarnicki, T. A new reconstruction of the origin of the eremoneuran hypopygium and its implications for classification (Insecta: Diptera). Genus 1996, 3, 103–175. [Google Scholar]
- Wang, K.; Li, X.; Ding, S.; Wang, N.; Mao, M.; Wang, M.; Yang, D. The complete mitochondrial genome of the Atylotus miser (Diptera: Tabanomorpha: Tabanidae), with mitochondrial genome phylogeny of lower Brachycera (Orthorrhapha). Gene 2016, 586, 184–196. [Google Scholar] [CrossRef] [PubMed]
- Hall, T.A. BioEdit: A user-friendly biological sequence alignment editor and analysis program for Windows 95/98/NT. Nucleic Acids Symp. Ser. 1999, 41, 95–98. [Google Scholar]
- Lowe, T.M.; Eddy, S.R. tRNAscan-SE: A program for improved detection of transfer RNA genes in genomic sequence. Nucleic Acids Res. 1997, 25, 0955–0964. [Google Scholar] [CrossRef]
- Tamura, K.; Peterson, D.; Peterson, N.; Stecher, G.; Nei, M.; Kumar, S. MEGA5: Molecular evolutionary genetics analysis using maximum likelihood, evolutionary distance, and maximum parsimony methods. Mol. Biol. Evol. 2011, 28, 2731–2739. [Google Scholar] [CrossRef] [PubMed]
- Perna, N.T.; Kocher, T.D. Patterns of nucleotide composition at fourfold degenerate sites of animal mitochondrial genomes. J. Mol. Evol. 1995, 41, 353–358. [Google Scholar] [CrossRef] [PubMed]
- Abascal, F.; Zardoya, R.; Telford, M.J. TranslatorX: Multiple alignment of nucleotide sequences guided by amino acid translations. Nucleic Acids Res. 2010, 38, W7–W13. [Google Scholar] [CrossRef] [PubMed]
- Castresana, J. Selection of conserved blocks from multiple alignments for their use in phylogenetic analysis. Mol. Biol. Evol. 2000, 17, 540–552. [Google Scholar] [CrossRef] [PubMed]
- Tabei, Y.; Kiryu, H.; Kin, T.; Asai, K. A fast structural multiple alignment method for long RNA sequences. BMC Bioinform. 2008, 9, 33. [Google Scholar] [CrossRef] [PubMed]
- Edgar, R.C. MUSCLE: Multiple sequence alignment with high accuracy and high throughput. Nucleic Acids Res. 2004, 32, 1792–1797. [Google Scholar] [CrossRef] [PubMed]
- Vaidya, G.; Lohman, D.J.; Meier, R. SequenceMatrix: Concatenation software for the fast assembly of multi-gene datasets with character set and codon information. Cladistics 2010, 27, 171–180. [Google Scholar] [CrossRef]
- Lanfear, R.; Calcott, B.; Ho, S.Y.W.; Guindon, S. PartitionFinder: Combined selection of partitioning schemes and substitution models for phylogenetic analysis. Mol. Biol. Evol. 2012, 29, 1695–1701. [Google Scholar] [CrossRef] [PubMed]
- Miller, K.B.; Bergsten, J.; Whiting, M.F. Phylogeny and classification of the tribe Hydaticini (Coleoptera: Dytiscidae): Partition choice for Bayesian analysis with multiple nuclear and mitochondrial protein-coding genes. Zool. Scr. 2009, 38, 591–615. [Google Scholar] [CrossRef]
- Pons, J.; Ribera, I.; Bertranpetit, J.; Balke, M. Nucleotide substitution rates for the full set of mitochondrial protein-coding genes in Coleoptera. Mol. Phylogenet. Evol. 2010, 56, 796–807. [Google Scholar] [CrossRef] [PubMed]
- Ronquist, F.; Huelsenbeck, J.P. MrBayes 3: Bayesian phylogenetic inference under mixed models. Bioinformatics 2003, 19, 1572–1574. [Google Scholar] [CrossRef] [PubMed]
- Stamatakis, A. RAxML-VI-HPC: Maximum likelihood-based phylogenetic analysis with thousands of taxa and mixed models. Bioinformatics 2006, 22, 2688–2690. [Google Scholar] [CrossRef] [PubMed]
- Sukumaran, J.; Holder, M.T. SumTrees: Phylogenetic Tree Summarization. 4.0.0. Available online: https://github.com/jeetsukumaran/DendroPy (accessed on 3 April 2017).


| Family | Species | Published Information | Code | Length (bp) |
|---|---|---|---|---|
| Tipulidae | Tipula abdominalis # | [11] | JN_861743 | - |
| Chironomidae | Chironomus tepperi # | [11] | NC_016167 | 15,652 |
| Tanyderidae | Protoplasa fitchii # | [11] | NC_016202 | 16,154 |
| Nemestrinidae | Trichophthalma punctate * | [12] | NC_008755 | 16,396 |
| Tabanidae | Cydistomyia duplonotata * | [12] | NC_008756 | 16,247 |
| Phoridae | Megaselia scalaris * | [13] | NC_023794 | 15,599 |
| Syrphidae | Simosyrphus grandicornis * | [12] | NC_008754 | 16,141 |
| Fergusoninidae | Fergusonina taylori * | [14] | NC_016865 | 16,000 |
| Agromyzidae | Liriomyza bryoniae * | [15] | NC_016713 | 16,183 |
| Liriomyza huidobrensis | [15] | NC_016716 | 16,236 | |
| Liriomyza sativae * | [16] | NC_015926 | 15,551 | |
| Liriomyza trifolii | [17] | NC_014283 | 16,141 | |
| Tephritidae | Bactrocera carambolae | [18] | NC_009772 | 15,915 |
| Bactrocera correcta | Wu et al. Unpublished | NC_018787 | 15,936 | |
| Bactrocera cucurbitae * | Wu et al. Unpublished | NC_016056 | 15,825 | |
| Bactrocera dorsalis | [19] | NC_008748 | 15,915 | |
| Bactrocera minax | [20] | NC_014402 | 16,043 | |
| Bactrocera oleae | [21] | NC_005333 | 15,815 | |
| Bactrocera papayae | [18] | NC_009770 | 15,915 | |
| Bactrocera philippinensis | [18] | NC_009771 | 15,915 | |
| Bactrocera tryoni * | [22] | NC_014611 | 15,925 | |
| Ceratitis capitata * | [23] | NC_000857 | 15,980 | |
| Procecidochares utilis | Wu et al. Unpublished | NC_020463 | 15,922 | |
| Drosophilidae | Drosophila ananassae | [24] | BK006336 (Without CR) | - |
| Drosophila erecta | [24] | BK006335 (Without CR) | - | |
| Drosophila grimshawi | [24] | BK006341 (Without CR) | - | |
| Drosophila littoralis | [25] | NC_011596 | 16,017 | |
| Drosophila melanogaster * | [26] | NC_001709 | 19,517 | |
| Drosophila mojavensis | [24] | BK006339 (Without CR) | - | |
| Drosophila persimilis | [24] | BK006337 (Without CR) | - | |
| Drosophila pseudoobscura | [27] | NC_018348 (Without CR) | - | |
| Drosophila santomea * | [28] | NC_023825 | 16,022 | |
| Drosophila sechellia | [29] | NC_005780 (Without CR) | - | |
| Drosophila simulans | [29] | NC_005781 (Without CR) | - | |
| Drosophila virilis | [24] | BK006340 (Without CR) | - | |
| Drosophila willistoni | [24] | BK006338 (Without CR) | - | |
| Drosophila yakuba * | [10] | NC_001322 | 16,019 | |
| Sepsidae | Nemopoda mamaevi * | [30] | KM605250 | 15,878 |
| Lauxaniidae | Cestrotus liui * | Present study | KX372559 | 16,171 |
| Pachycerina decemlineata * | Present study | KX372561 | 16,286 | |
| Chamaemyiidae | Chamaemyia juncorum * | Present study | KX372560 | - |
| Celyphidae | Celyphus obtectus * | Present study | KX372558 | - |
| Spanicelyphus pilosus * | Present study | KX372562 | 16,426 | |
| Muscidae | Haematobia irritans | [31] | NC_007102 | 16,078 |
| Musca domestica * | [32] | NC_024855 | 16,108 | |
| Stomoxys calcitrans | [31] | DQ533708 | 15,790 | |
| Anthomyiidae | Delia platura | [33] | KP01268 | - |
| Fanniidae | Euryomma sp. | [33] | KP01269 | - |
| Scathophagidae | Scathophaga stercoraria * | [32] | NC_024856 | 16,223 |
| Calliphoridae | Calliphora vicina | [6] | NC_019639 | 16,112 |
| Chrysomya albiceps | [6] | NC_019631 | 15,491 | |
| Chrysomya bezziana | [6] | NC_019632 | 15,236 | |
| Chrysomya megacephala | [6] | NC_019633 | 15,273 | |
| Chrysomya putoria * | [34] | NC_002697 | 15,837 | |
| Chrysomya rufifacies | [6] | NC_019634 | 15,412 | |
| Chrysomya saffranea | [6] | NC_019635 | 15,839 | |
| Protophormia terraenovae | [6] | NC_019636 | 15,170 | |
| Cochliomyia hominivorax | [35] | NC_002660 | 16,022 | |
| Lucilia cuprina | [6] | NC_019573 | 15,952 | |
| Lucilia porphyrina | [6] | NC_019637 | 15,877 | |
| Lucilia sericata | [6] | NC_009733 | 15,945 | |
| Hemipyrellia ligurriens | [6] | NC_019638 | 15,938 | |
| Polleniidae | Pollenia rudis | [6] | JX913761 (Partial Genome) | - |
| Oestridae | Dermatobia hominis | [36] | NC_006378 | 16,460 |
| Hypoderma lineatum * | [37] | NC_013932 | 16,354 | |
| Sarcophagidae | Sarcophaga impatiens * | [6] | NC_017605 | 15,169 |
| Sarcophaga peregrina | [38] | NC_023532 | 14,922 | |
| Tachinidae | Elodia flavipalpis * | [7] | NC_018118 | 14,932 |
| Exorista sorbillans | [39] | NC_014704 | 14,960 | |
| Rutilia goerlingiana | [6] | NC_019640 | 15,331 |
© 2017 by the authors. Licensee MDPI, Basel, Switzerland. This article is an open access article distributed under the terms and conditions of the Creative Commons Attribution (CC BY) license (http://creativecommons.org/licenses/by/4.0/).
Share and Cite
Li, X.; Li, W.; Ding, S.; Cameron, S.L.; Mao, M.; Shi, L.; Yang, D. Mitochondrial Genomes Provide Insights into the Phylogeny of Lauxanioidea (Diptera: Cyclorrhapha). Int. J. Mol. Sci. 2017, 18, 773. https://0-doi-org.brum.beds.ac.uk/10.3390/ijms18040773
Li X, Li W, Ding S, Cameron SL, Mao M, Shi L, Yang D. Mitochondrial Genomes Provide Insights into the Phylogeny of Lauxanioidea (Diptera: Cyclorrhapha). International Journal of Molecular Sciences. 2017; 18(4):773. https://0-doi-org.brum.beds.ac.uk/10.3390/ijms18040773
Chicago/Turabian StyleLi, Xuankun, Wenliang Li, Shuangmei Ding, Stephen L. Cameron, Meng Mao, Li Shi, and Ding Yang. 2017. "Mitochondrial Genomes Provide Insights into the Phylogeny of Lauxanioidea (Diptera: Cyclorrhapha)" International Journal of Molecular Sciences 18, no. 4: 773. https://0-doi-org.brum.beds.ac.uk/10.3390/ijms18040773