Applying Broadband Dielectric Spectroscopy (BDS) for the Biophysical Characterization of Mammalian Tissues under a Variety of Cellular Stresses


Abstract
:1. Introduction
2. Results
2.1. Broadband Dielectric Spectroscopy (BDS) Measurements
2.2. Tissue Water Fraction
2.3. BDS Analysis
3. Discussion
3.1. BDS Measurements
3.2. Tissue Water Fraction
3.3. BDS Analysis
4. Materials and Methods
4.1. Animal Exposure
4.2. Human Malignant Tissues
4.3. Broadband Dielectric Spectroscopy (BDS)
4.4. Determination of Water Fraction, h
4.5. Dielectric Data Analysis
5. Conclusions
Acknowledgments
Author Contributions
Conflicts of Interest
Abbreviations
| BDS | Broadband dielectric spectroscopy |
| DECT | Digital enhanced cordless telecommunication |
| HSP | Heat shock proteins |
| IR | Ionizing radiation |
| NIR | Non-ionizing radiation |
| RF-EMR | Radiofrequency electromagnetic radiation |
References
- Söderqvist, F.; Carlberg, M.; Hardell, L. Use of wireless telephones and self-reported health symptoms: A population-based study among swedish adolescents aged 15–19 years. Environ. Health 2008, 7, 18. [Google Scholar] [CrossRef] [PubMed]
- Fragopoulou, A.F.; Samara, A.; Antonelou, M.H.; Xanthopoulou, A.; Papadopoulou, A.; Vougas, K.; Koutsogiannopoulou, E.; Anastasiadou, E.; Stravopodis, D.J.; Tsangaris, G.T.; et al. Brain proteome response following whole body exposure of mice to mobile phone or wireless dect base radiation. Electromagn. Biol. Med. 2012, 31, 250–274. [Google Scholar] [CrossRef] [PubMed]
- Manta, A.K.; Stravopodis, D.J.; Papassideri, I.S.; Margaritis, L.H. Reactive oxygen species elevation and recovery in drosophila bodies and ovaries following short-term and long-term exposure to dect base EMF. Electromagn. Biol. Med. 2014, 33, 118–131. [Google Scholar] [CrossRef] [PubMed]
- Yang, X.S.; He, G.L.; Hao, Y.T.; Xiao, Y.; Chen, C.H.; Zhang, G.B.; Yu, Z.P. Exposure to 2.45 GHz electromagnetic fields elicits an HSP-related stress response in rat hippocampus. Brain Res. Bull. 2012, 88, 371–378. [Google Scholar] [CrossRef] [PubMed]
- Jorge-Mora, M.T.; Alvarez-Folgueiras, M.; Leiro-Vidal, J.M.; Jorge-Barreiro, F.J.; Ares-Pena, F.J.; López-Martin, M.E. Exposure to 2.45 GHz microwave radiation provokes cerebral changes in induction of HSP-90 α/β, heat shock protein in rats. PIER 2010, 100, 351–379. [Google Scholar] [CrossRef]
- Georgakilas, A.G.; O’Neill, P.; Stewart, R.D. Induction and repair of clustered DNA lesions: What do we know so far? Radiat. Res. 2013, 180, 100–109. [Google Scholar] [CrossRef] [PubMed]
- Georgakilas, A.G. Bystander and non-targeted effects: A unifying model from ionizing radiation to cancer. Cancer Lett. 2015, 356, 3–4. [Google Scholar] [CrossRef] [PubMed]
- Sprung, C.N.; Ivashkevich, A.; Forrester, H.B.; Redon, C.E.; Georgakilas, A.; Martin, O.A. Oxidative DNA damage caused by inflammation may link to stress-induced non-targeted effects. Cancer Lett. 2015, 356, 72–81. [Google Scholar] [CrossRef] [PubMed]
- Pethig, R. Dielectric properties of biological materials: Biophysical and medical applications. IEEE Trans. Electr. Insul. 1984, EI-19, 453–474. [Google Scholar] [CrossRef]
- Miklavčič, D.; Pavšelj, N.; Hart, F.X. Electric properties of tissues. In Wiley Encyclopedia of Biomedical Engineering; John Wiley & Sons, Inc.: New York, NY, USA, 2006. [Google Scholar]
- Wolf, M.; Gulich, R.; Lunkenheimer, P.; Loidl, A. Broadband dielectric spectroscopy on human blood. Biochim. Biophys. Acta Gen. Subj. 2011, 1810, 727–740. [Google Scholar] [CrossRef] [PubMed]
- Panagopoulou, A.; Kyritsis, A.; Shinyashiki, N.; Pissis, P. Protein and water dynamics in bovine serum albumin-water mixtures over wide ranges of composition. J. Phys. Chem. B 2012, 116, 4593–4602. [Google Scholar] [CrossRef] [PubMed]
- Heileman, K.; Daoud, J.; Tabrizian, M. Dielectric spectroscopy as a viable biosensing tool for cell and tissue characterization and analysis. Biosens. Bioelectron. 2013, 49, 348–359. [Google Scholar] [CrossRef] [PubMed]
- Khodadadi, S.; Sokolov, A.P. Protein dynamics: From rattling in a cage to structural relaxation. Soft Matter 2015, 11, 4984–4998. [Google Scholar] [CrossRef] [PubMed]
- Artis, F.; Chen, T.; Chretiennot, T.; Fournie, J.J.; Poupot, M.; Dubuc, D.; Grenier, K. Microwaving biological cells: Intracellular analysis with microwave dielectric spectroscopy. IEEE Microw. Mag. 2015, 16, 87–96. [Google Scholar] [CrossRef]
- Levy, E.; Barshtein, G.; Livshits, L.; Ishai, P.B.; Feldman, Y. Dielectric response of cytoplasmic water and its connection to the vitality of human red blood cells: I. Glucose concentration influence. J. Phys. Chem. B 2016, 120, 10214–10220. [Google Scholar] [CrossRef] [PubMed]
- Lazebnik, M.; Popovic, D.; McCartney, L.; Watkins, C.B.; Lindstrom, M.J.; Harter, J.; Sewall, S.; Ogilvie, T.; Magliocco, A.; Breslin, T.M.; et al. A large-scale study of the ultrawideband microwave dielectric properties of normal, benign and malignant breast tissues obtained from cancer surgeries. Phys. Med. Biol. 2007, 52, 6093–6115. [Google Scholar] [CrossRef] [PubMed]
- Georgakilas, A.G.; Haveles, K.S.; Sideris, E.G.; Konsta, A.A. Dielectric study of the double helix to single coil transition of DNA. IEEE Trans. Dielectr. Electr. Insul. 1998, 5, 26–32. [Google Scholar] [CrossRef]
- Konsta, A.A.; Visvardis, E.E.; Haveles, K.S.; Georgakilas, A.G.; Sideris, E.G. Detecting radiation-induced DNA damage: From changes in dielectric properties to programmed cell death. J. Non-Cryst. Solids 2002, 305, 295–302. [Google Scholar] [CrossRef]
- Georgakilas, A.G.; Konsta, A.A.; Sideris, E.G.; Sakelliou, L. Dielectric and UV spectrophotometric study of physicochemical effects of ionizing radiation on mammalian macromolecular DNA. IEEE Trans. Dielectr. Electr. Insul. 2001, 8, 549–554. [Google Scholar] [CrossRef]
- Gabriel, S.; Lau, R.W.; Gabriel, C. The dielectric properties of biological tissues: III. Parametric models for the dielectric spectrum of tissues. Phys. Med. Biol. 1996, 41, 2271–2293. [Google Scholar] [CrossRef] [PubMed]
- Surowiec, A.J.; Stuchly, S.S.; Barr, J.R.; Swarup, A. Dielectric properties of breast carcinoma and the surrounding tissues. IEEE Trans. Biomed. Eng. 1988, 35, 257–263. [Google Scholar] [CrossRef] [PubMed]
- Abd El-Hakam, R.; Khalil, S.; Mahani, R. Dielectric and FT-Raman spectroscopic approach to molecular identification of breast tumor tissues. Spectrochim. Acta Part A Mol. Biomol. Spectrosc. 2015, 151, 208–212. [Google Scholar] [CrossRef] [PubMed]
- Pateras, I.S.; Havaki, S.; Nikitopoulou, X.; Vougas, K.; Townsend, P.A.; Panayiotidis, M.I.; Georgakilas, A.G.; Gorgoulis, V.G. The DNA damage response and immune signaling alliance: Is it good or bad? Nature decides when and where. Pharmacol. Ther. 2015, 154, 36–56. [Google Scholar] [CrossRef] [PubMed]
- Samadi, A.K.; Bilsland, A.; Georgakilas, A.G.; Amedei, A.; Amin, A.; Bishayee, A.; Azmi, A.S.; Lokeshwar, B.L.; Grue, B.; Panis, C.; et al. A multi-targeted approach to suppress tumor-promoting inflammation. Semin. Cancer Biol. 2015, 35, S151–S184. [Google Scholar] [CrossRef] [PubMed]
- Reinoso, R.F.; Telfer, B.A.; Rowland, M. Tissue water content in rats measured by desiccation. J. Pharmacol. Toxicol. Methods 1997, 38, 87–92. [Google Scholar] [CrossRef]
- Gabriel, S.; Lau, R.W.; Gabriel, C. The dielectric properties of biological tissues: II. Measurements in the frequency range 10 Hz to 20 GHz. Phys. Med. Biol. 1996, 41, 2251. [Google Scholar] [CrossRef] [PubMed]
- Nikitaki, Z.; Hellweg, C.E.; Georgakilas, A.G.; Ravanat, J.L. Stress-induced DNA damage biomarkers: Applications and limitations. Front. Chem. 2015, 3, 35. [Google Scholar] [CrossRef] [PubMed]
- Papadopoulou, A.; Kletsas, D. Human lung fibroblasts prematurely senescent after exposure to ionizing radiation enhance the growth of malignant lung epithelial cells in vitro and in vivo. Int. J. Oncol. 2011, 39, 989–999. [Google Scholar] [PubMed]
- Andreuccetti, D.; Fossi, R.; Petrucci, C. An internet resource for the calculation of the dielectric properties of body tissues in the frequency range 10 Hz–100 GHz. Available online: http://niremf.ifac.cnr.it/tissprop/ (accessed on 28 February 2017).
- Cerveny, S.; Mallamace, F.; Swenson, J.; Vogel, M.; Xu, L. Confined water as model of supercooled water. Chem. Rev. 2016, 116, 7608–7625. [Google Scholar] [CrossRef] [PubMed]
- Pablo, G.D. Supercooled and glassy water. J. Phys. Condens. Matter 2003, 15, R1669. [Google Scholar]
- Johari, G.P.; Whalley, E. The dielectric properties of ice Ih in the range 272–133 K. J. Chem. Phys. 1981, 75, 1333–1340. [Google Scholar] [CrossRef]
- Sasaki, K.; Kita, R.; Shinyashiki, N.; Yagihara, S. Glass transition of partially crystallized gelatin-water mixtures studied by broadband dielectric spectroscopy. J. Chem. Phys. 2014, 140, 124506. [Google Scholar] [CrossRef] [PubMed]
- Suzuki, Y.; Steinhart, M.; Graf, R.; Butt, H.-J.; Floudas, G. Dynamics of ice/water confined in nanoporous alumina. J. Phys. Chem. B 2015, 119, 14814–14820. [Google Scholar] [CrossRef] [PubMed]
- Popov, I.; Puzenko, A.; Khamzin, A.; Feldman, Y. The dynamic crossover in dielectric relaxation behavior of ice Ih. Phys. Chem. Chem. Phys. 2015, 17, 1489–1497. [Google Scholar] [CrossRef] [PubMed]
- Gabriel, C.; Gabriel, S.; Corthout, E. The dielectric properties of biological tissues: I. Literature survey. Phys. Med. Biol. 1996, 41, 2231. [Google Scholar] [CrossRef] [PubMed]
- Prodan, C.; Mayo, F.; Claycomb, J.R.; Miller, J.H.; Benedik, M.J. Low-frequency, low-field dielectric spectroscopy of living cell suspensions. J. Appl. Phys. 2004, 95, 3754–3756. [Google Scholar] [CrossRef]
- Martinsen, O.G.; Grimnes, S.; Schwan, H.P. Interface Phenomena and Dielectric Properties of Biological Tissue. In Encyclopedia of Surface and Colloid Science; Marcel Dekker: New York, NY, USA, 2002; pp. 2643–2653. [Google Scholar]
- Asami, K. Characterization of biological cells by dielectric spectroscopy. J. Non-Cryst. Solids 2002, 305, 268–277. [Google Scholar] [CrossRef]
- Foster, K.R.; Schwan, H.P. Dielectric properties of tissues and biological materials: A critical review. Crit. Rev. Biomed. Eng. 1989, 17, 25–104. [Google Scholar] [PubMed]
- Stoy, R.D.; Foster, K.R.; Schwan, H.P. Dielectric properties of mammalian tissues from 0.1 to 100 MHz: A summary of recent data. Phys. Med. Biol. 1982, 27, 501–513. [Google Scholar] [CrossRef] [PubMed]
- Stasinopoulou, M.; Fragopoulou, A.F.; Stamatakis, A.; Mantziaras, G.; Skouroliakou, K.; Papassideri, I.S.; Stylianopoulou, F.; Lai, H.; Kostomitsopoulos, N.; Margaritis, L.H. Effects of pre- and postnatal exposure to 1880–1900MHz DECT base radiation on development in the rat. Reprod. Toxicol. 2016, 65, 248–262. [Google Scholar] [CrossRef] [PubMed]
- Tsuchihashi, S.; Enomoto, Y.; Yamada, T.; Nakamura, W.; Eto, H. The mortality and body weight response of male wistar rats in the lethal X-ray dose range. J. Radiat. Res. 1969, 10, 133–138. [Google Scholar] [CrossRef] [PubMed]
- Lee, Y.K.; Chang, H.H.; Kim, W.R.; Kim, J.K.; Yoon, Y.D. Effects of γ-radiation on ovarian follicles. Arh. Hig. Rada Toksikol. 1998, 49, 147–153. [Google Scholar] [PubMed]
- Greenspan, L. Humidity fixed points of binary saturated aqueous solutions. J. Res. Natl. Bur. Stand. 1977, 81, 89–96. [Google Scholar] [CrossRef]
- Havriliak, S.; Negami, S. A complex plane representation of dielectric and mechanical relaxation processes in some polymers. Polymer 1967, 8, 161–210. [Google Scholar] [CrossRef]
- Fragiadakis, D. Grafity: Data Analysis Software. Available online: http://grafitylabs.com/ (accessed on 28 February 2017).
- Kremer, F.; Schönhals, A. Broadband Dielectric Spectroscopy; Springer: Berlin, Germany, 2002. [Google Scholar]
- Joines, W.T.; Zhang, Y.; Li, C.; Jirtle, R.L. The measured electrical properties of normal and malignant human tissues from 50 to 900 MHz. Med. Phys. 1994, 21, 547–550. [Google Scholar] [CrossRef] [PubMed]
- Fornes-Leal, A.; Garcia-Pardo, C.; Frasson, M.; Pons Beltran, V.; Cardona, N. Dielectric characterization of healthy and malignant colon tissues in the 0.5–18 GHz frequency band. Phys. Med. Biol. 2016, 61, 7334–7346. [Google Scholar] [CrossRef] [PubMed]
- Yamashiro, T.; Ando, M.; Okazaki, Y.; Sasaguri, S. Dielectric behavior of pulmonary edema induced in the rat lung. Respir. Physiol. Neurobiol. 2005, 145, 91–100. [Google Scholar] [CrossRef] [PubMed]


| Conductivity, σDC (S/cm) | 20 °C at 105 Hz | −40 °C at 105 Hz | −40 °C at 1 Hz | ||
|---|---|---|---|---|---|
| Tissue | Type of Stress | Dose (age) | |||
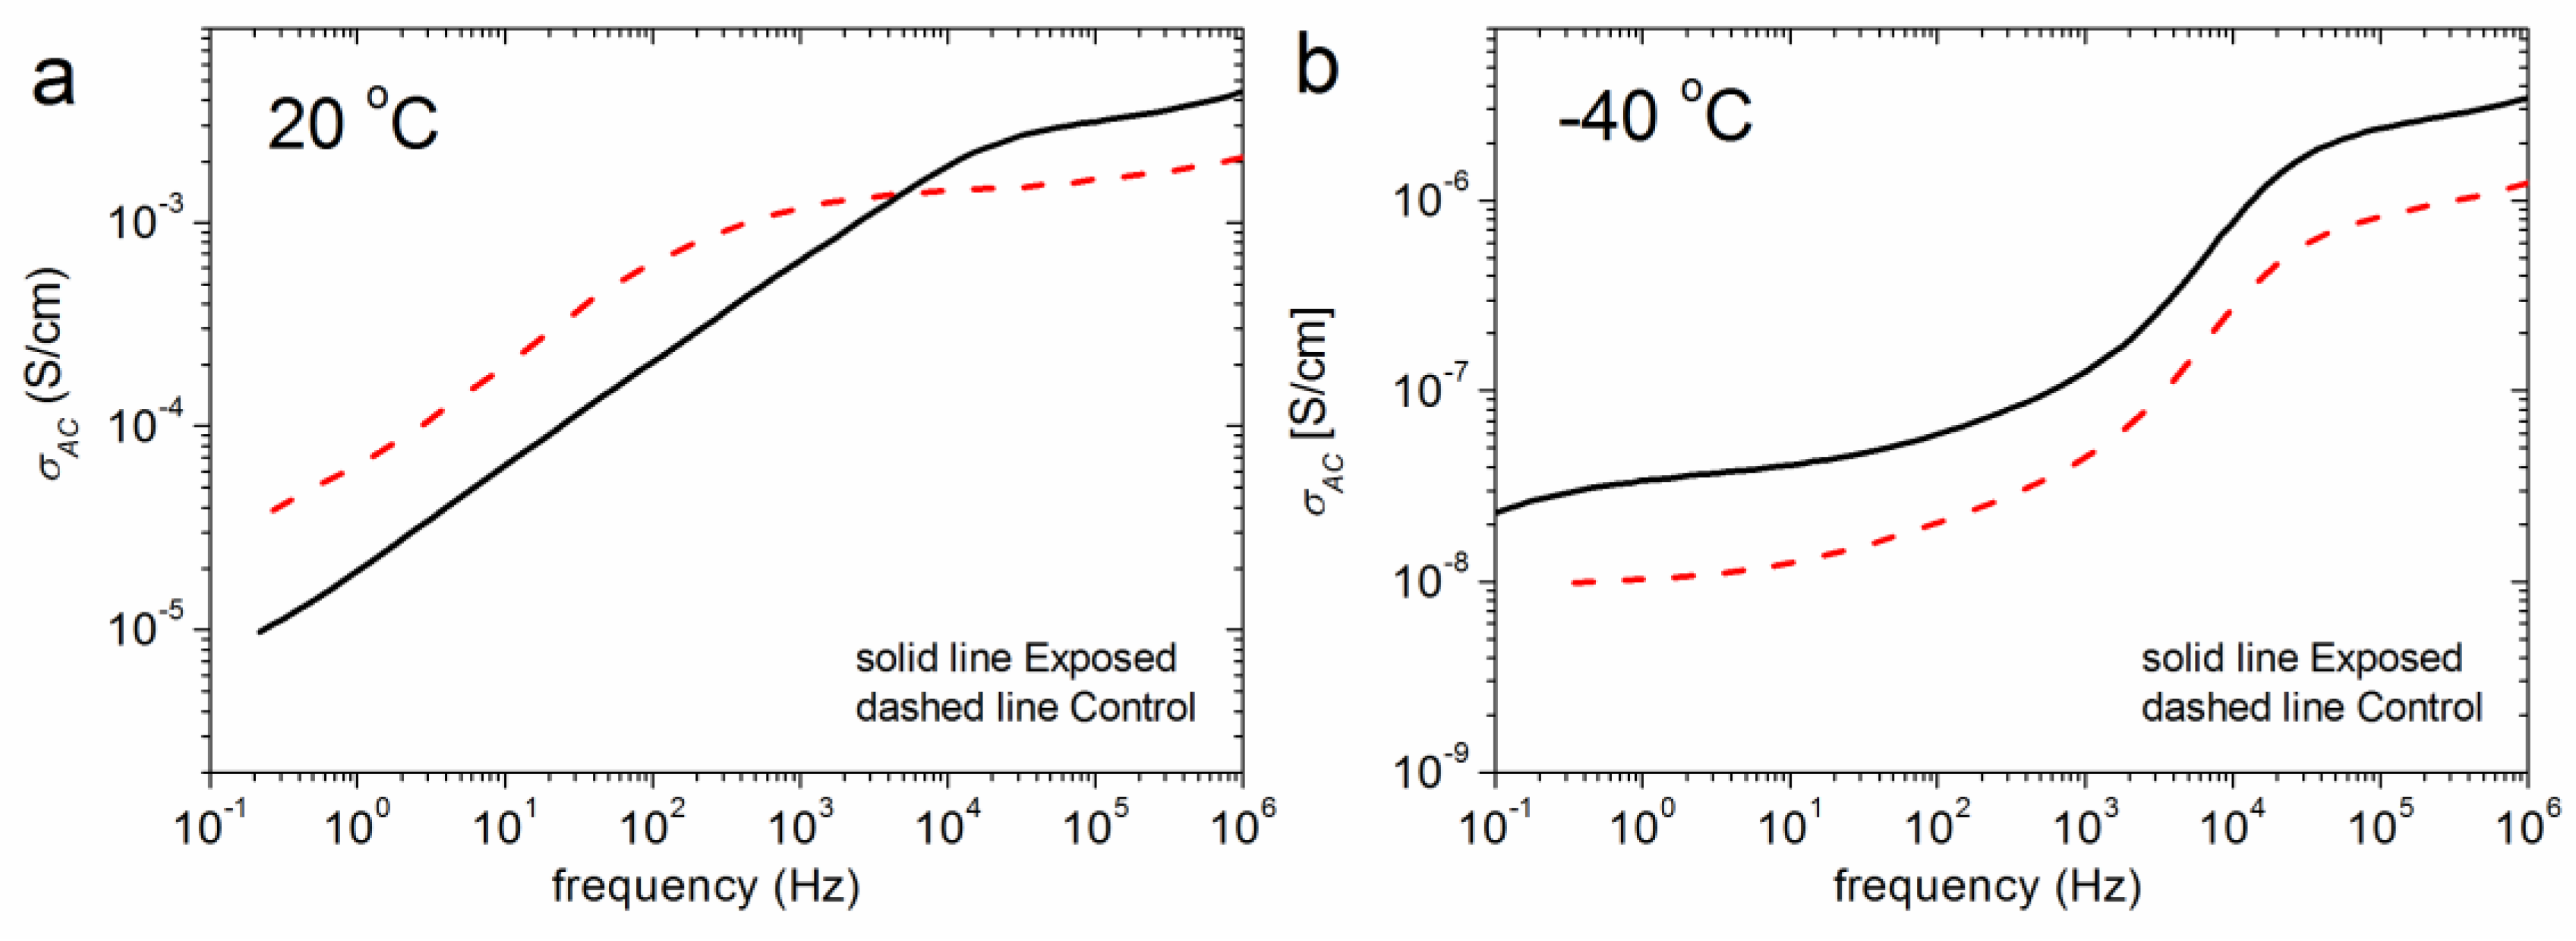
| Rat Cerebellum | DECT Exposure | Prenatally (three months old) | 1.40 × 10⁻³ | 5.30 × 10⁻⁷ | 5.00 × 10⁻⁹ |
| 1.30 × 10⁻³ | 7.30 × 10⁻⁷ | 5.00 × 10⁻⁹ | |||
| Prenatally + one month after birth (one month old) | 3.10 × 10⁻³ | 2.40 × 10⁻⁶ | 3.40 × 10⁻⁸ | ||
| 1.20 × 10⁻³ | 7.90 × 10⁻⁷ | 4.40 × 10⁻⁹ | |||
| Prenatally + one month after birth (two months old) | 1.00 × 10⁻³ | 7.20 × 10⁻⁷ | 1.00 × 10⁻⁸ | ||
| Control | (three months old) | 1.50 × 10⁻³ | 4.70 × 10⁻⁷ | 3.80 × 10⁻¹³ | |
| (one and two months old) | 1.10 × 10⁻³ | 6.20 × 10⁻⁷ | 6.60 × 10⁻⁹ | ||
| 1.60 × 10⁻³ | 8.20 × 10⁻⁷ | 1.00 × 10⁻⁸ | |||
| 1.40 × 10⁻³ | 6.70 × 10⁻⁷ | 5.60 × 10⁻⁹ | |||
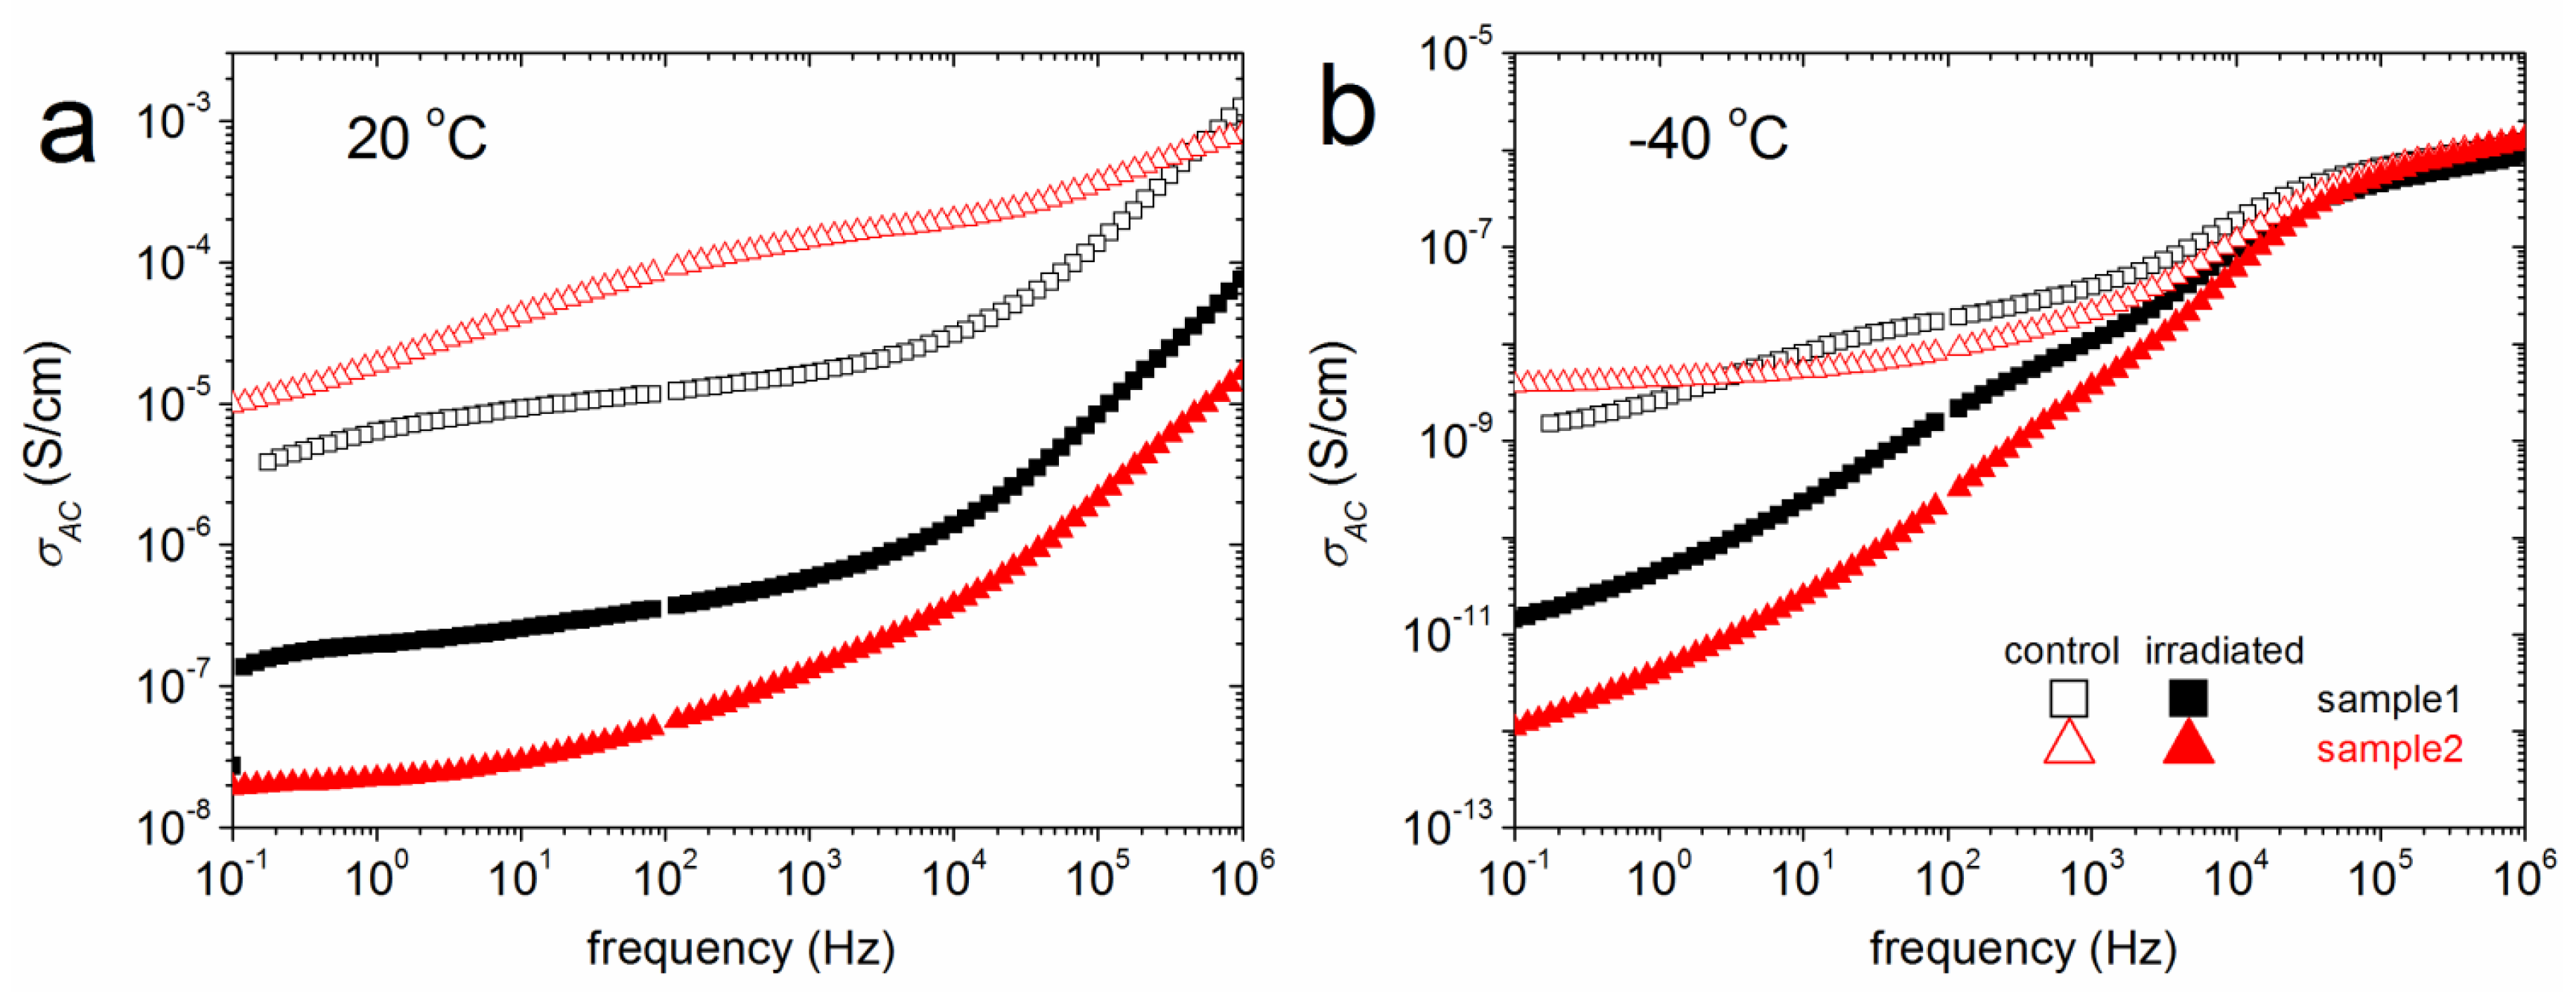
| Rat Skin | γ-Irradiation | 5 Gy | 8.30 × 10⁻⁶ | 4.50 × 10⁻⁷ | 4.40 × 10⁻¹¹ |
| 2.10 × 10⁻⁶ | 5.30 × 10⁻⁷ | 4.10 × 10⁻¹² | |||
| Control | 3.60 × 10⁻⁴ | 6.20 × 10⁻⁷ | 4.20 × 10⁻⁹ | ||
| 1.40 × 10⁻⁴ | 6.70 × 10⁻⁷ | 2.60 × 10⁻⁹ | |||
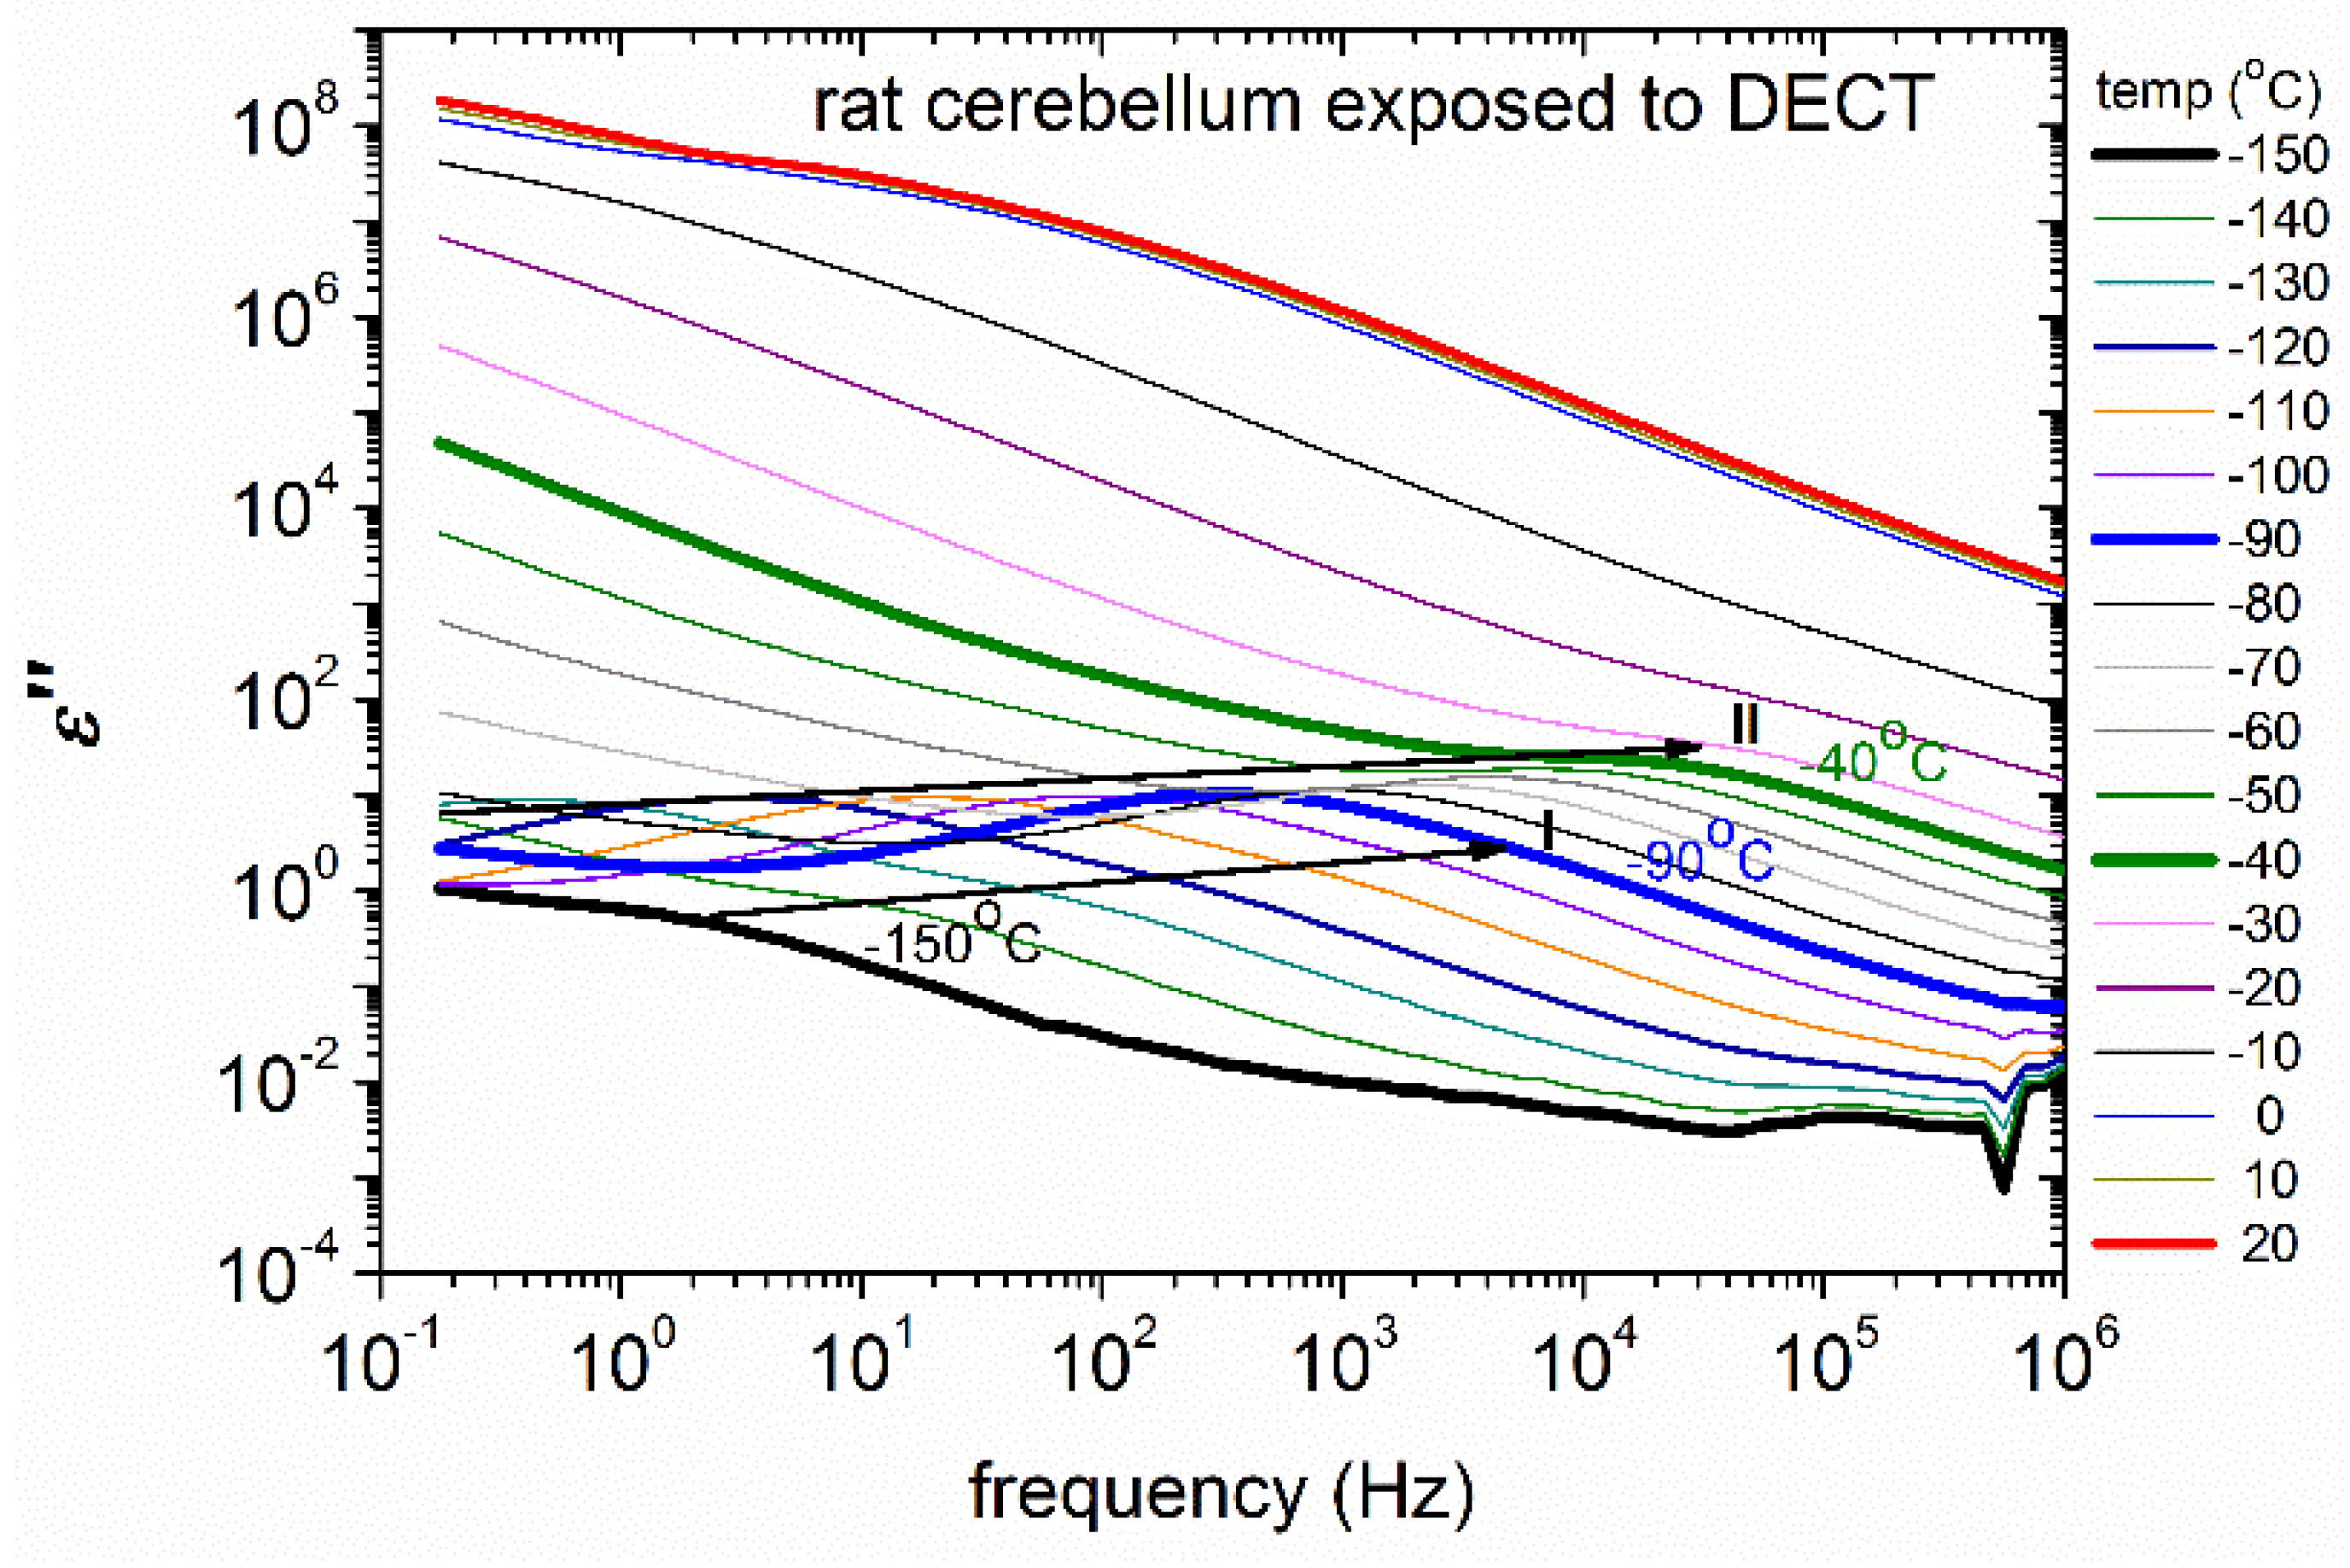
| Human Lung | Adenocarcinoma of low differentiation | ~25% necrotic cells (I) | 1.90 × 10⁻⁴ | 1.40 × 10⁻⁶ | 8.90 × 10⁻⁸ |
| ~75% necrotic cells (II) | 5.50 × 10⁻³ | 1.40 × 10⁻⁶ | 1.30 × 10⁻⁷ | ||
| Control | (I) | 6.40 × 10⁻³ | 2.20 × 10⁻⁶ | 1.20 × 10⁻⁷ | |
| (II) | 6.20 × 10⁻³ | 1.90 × 10⁻⁶ | 3.50 × 10⁻⁷ | ||
| Human Prostate | Cancer | T3cNxMx, Gleason score 8(i) | 2.00 × 10⁻¹⁰ | 4.60 × 10⁻¹⁵ | |
| T2bNxMx, Gleason score 8(ii) | 7.50 × 10⁻¹⁰ | 7.60 × 10⁻¹⁴ | |||
| T2cNxMx, Gleason score 6(iii) | 2.50 × 10⁻³ | 1.70 × 10⁻⁶ | 6.20 × 10⁻⁸ | ||
| Control | (i) | 2.00 × 10⁻⁸ | 4.00 × 10⁻¹⁰ | ||
| (ii) | 4.30 × 10⁻⁹ | 1.80 × 10⁻¹² | |||
| (iii) | 4.20 × 10⁻⁹ | 1.70 × 10⁻¹⁰ | 8.00 × 10⁻¹⁵ | ||
| Type | Stress | h | hBDS |
|---|---|---|---|
| Rat cerebellum | DECT exposure | 0.79 | 0.65 |
| 0.80 | 0.61 | ||
| Control | 0.81 | 0.64 | |
| 0.80 | 0.67 | ||
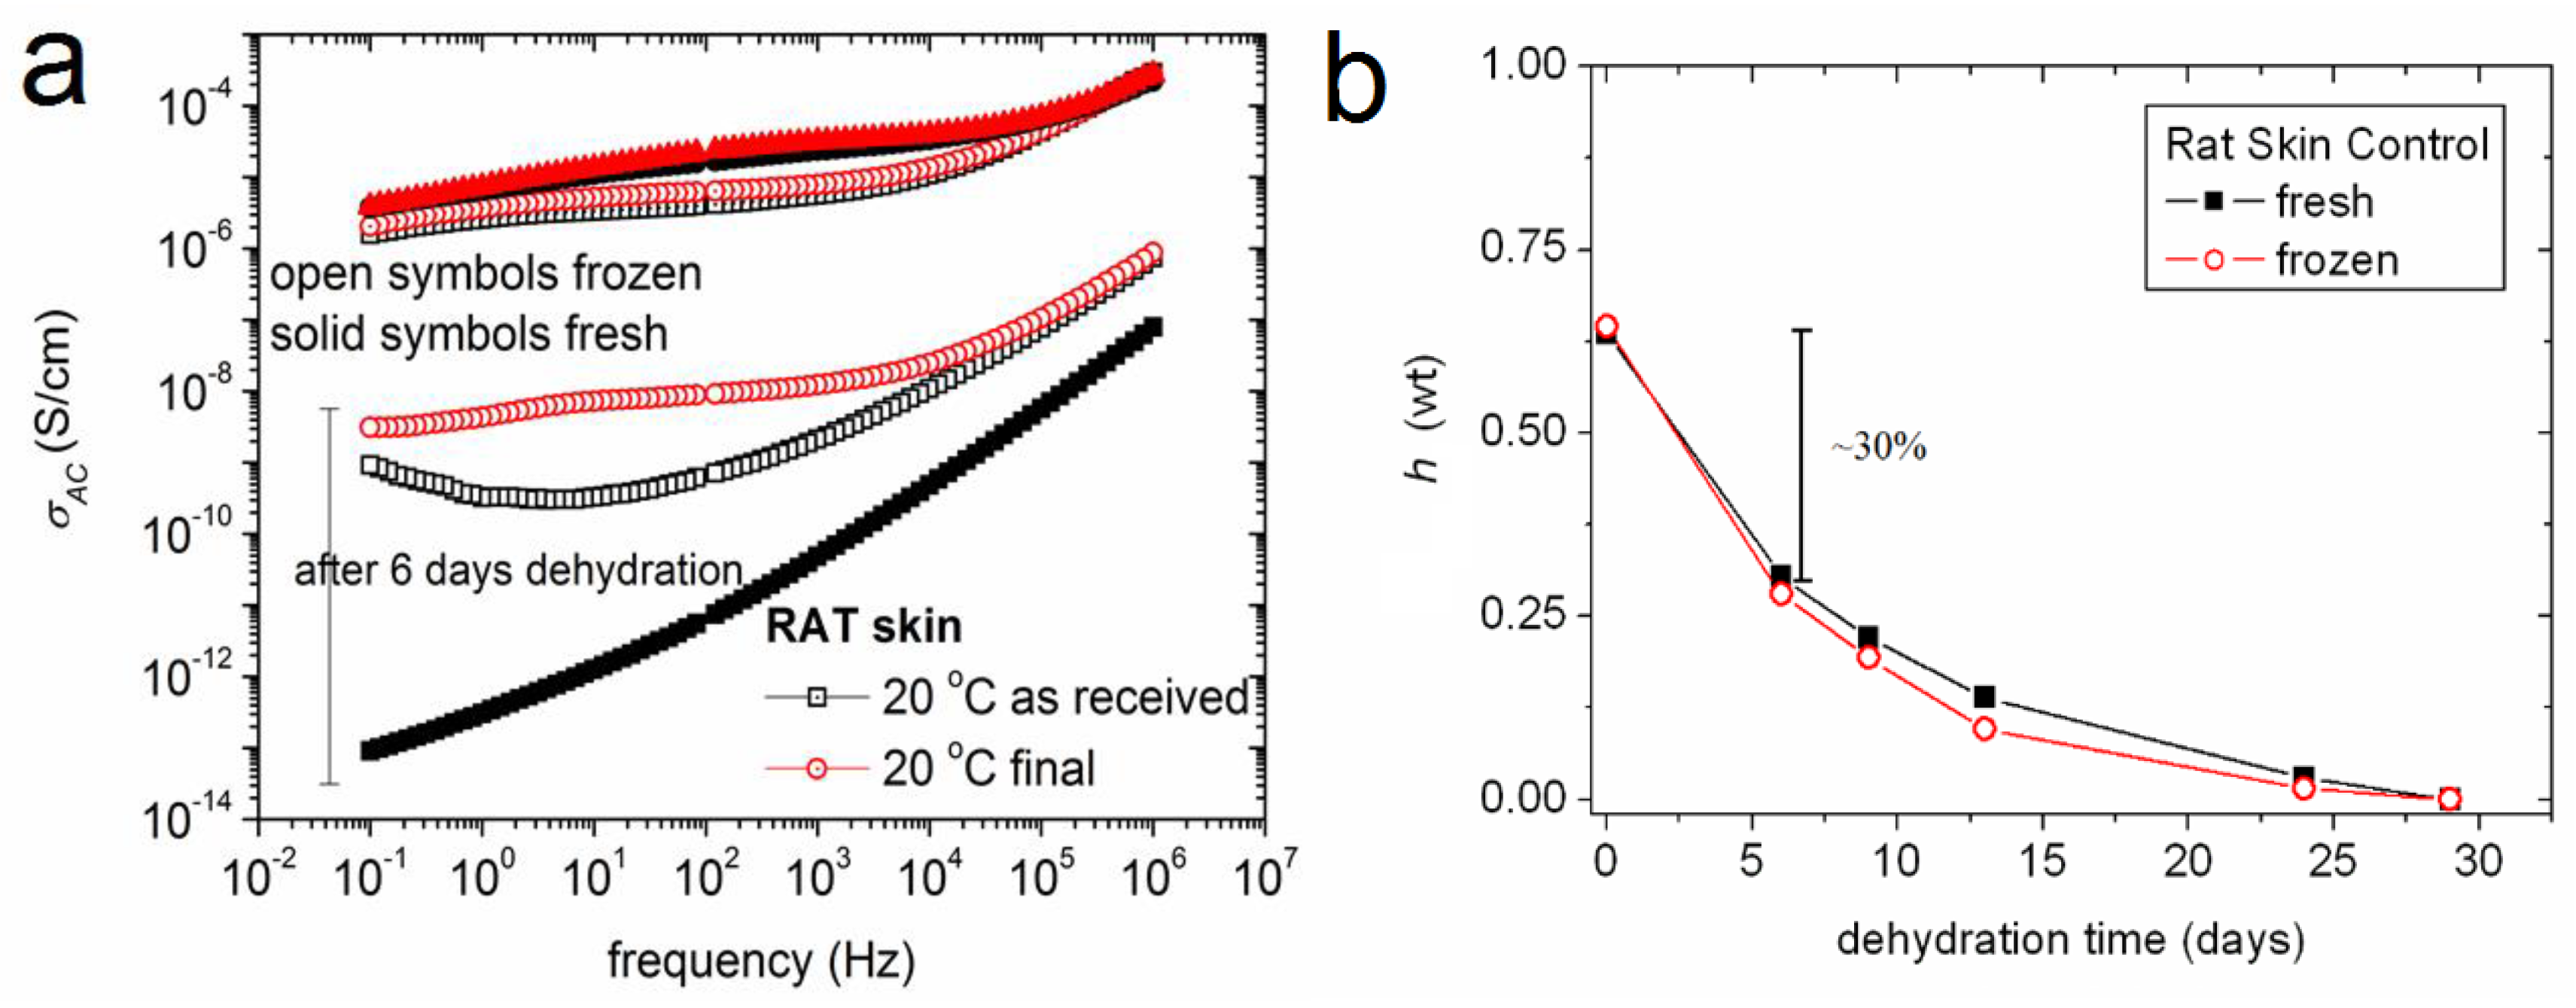
| Rat skin | CONTROL fresh | 0.47 | 0.42 |
| control frozen | 0.49 | 0.43 | |
| γ-radiation | 0.55 | 0.49 | |
| Control | 0.57 | 0.50 | |
| Human lung | Adenocarcinoma | 0.81 | 0.61 |
| 0.79 | 0.66 | ||
| Control | 0.77 | 0.60 | |
| 0.77 | 0.67 |
© 2017 by the authors. Licensee MDPI, Basel, Switzerland. This article is an open access article distributed under the terms and conditions of the Creative Commons Attribution (CC BY) license (http://creativecommons.org/licenses/by/4.0/).
Share and Cite
Souli, M.P.; Klonos, P.; Fragopoulou, A.F.; Mavragani, I.V.; Pateras, I.S.; Kostomitsopoulos, N.; Margaritis, L.H.; Zoumpoulis, P.; Kaklamanis, L.; Kletsas, D.; et al. Applying Broadband Dielectric Spectroscopy (BDS) for the Biophysical Characterization of Mammalian Tissues under a Variety of Cellular Stresses. Int. J. Mol. Sci. 2017, 18, 838. https://0-doi-org.brum.beds.ac.uk/10.3390/ijms18040838
Souli MP, Klonos P, Fragopoulou AF, Mavragani IV, Pateras IS, Kostomitsopoulos N, Margaritis LH, Zoumpoulis P, Kaklamanis L, Kletsas D, et al. Applying Broadband Dielectric Spectroscopy (BDS) for the Biophysical Characterization of Mammalian Tissues under a Variety of Cellular Stresses. International Journal of Molecular Sciences. 2017; 18(4):838. https://0-doi-org.brum.beds.ac.uk/10.3390/ijms18040838
Chicago/Turabian StyleSouli, Maria P., Panagiotis Klonos, Adamantia F. Fragopoulou, Ifigeneia V. Mavragani, Ioannis S. Pateras, Nikolaos Kostomitsopoulos, Lukas H. Margaritis, Pavlos Zoumpoulis, Loukas Kaklamanis, Dimitris Kletsas, and et al. 2017. "Applying Broadband Dielectric Spectroscopy (BDS) for the Biophysical Characterization of Mammalian Tissues under a Variety of Cellular Stresses" International Journal of Molecular Sciences 18, no. 4: 838. https://0-doi-org.brum.beds.ac.uk/10.3390/ijms18040838