Article

Overexpression of S-Adenosyl-l-Methionine Synthetase 2 from Sugar Beet M14 Increased Arabidopsis Tolerance to Salt and Oxidative Stress

1
Key Laboratory of Molecular Biology, College of Heilongjiang Province, College of Life Sciences, Heilongjiang University, Harbin 150080, China
2
Engineering Research Center of Agricultural Microbiology Technology, Ministry of Education, Heilongjiang University, Harbin 150080, China
3
Key Laboratory of Sugar Beet Genetic Breeding of Heilongjiang Province, Heilongjiang University, Harbin 150080, China
4
Department of Biology, Genetics Institute, Plant Molecular and Cellular Biology Program, University of Florida, Gainesville, FL 32610, USA
*
Authors to whom correspondence should be addressed.
Int. J. Mol. Sci. 2017, 18(4), 847; https://0-doi-org.brum.beds.ac.uk/10.3390/ijms18040847
Submission received: 18 January 2017 / Revised: 8 April 2017 / Accepted: 10 April 2017 / Published: 18 April 2017
(This article belongs to the Special Issue Selected Papers from the 6th National Plant Protein Research Congress)

Abstract

:
The sugar beet monosomic addition line M14 is a unique germplasm that contains genetic materials from Beta vulgaris L. and Beta corolliflora Zoss, and shows tolerance to salt stress. Our study focuses on exploring the molecular mechanism of the salt tolerance of the sugar beet M14. In order to identify differentially expressed genes in M14 under salt stress, a subtractive cDNA library was generated by suppression subtractive hybridization (SSH). A total of 36 unique sequences were identified in the library and their putative functions were analyzed. One of the genes, S-adenosylmethionine synthetase (SAMS), is the key enzyme involved in the biosynthesis of S-adenosylmethionine (SAM), a precursor of polyamines. To determine the potential role of SAMS in salt tolerance, we isolated BvM14-SAMS2 from the salt-tolerant sugar beet M14. The expression of BvM14-SAMS2 in leaves and roots was greatly induced by salt stress. Overexpression of BvM14-SAMS2 in Arabidopsis resulted in enhanced salt and H2O2 tolerance. Furthermore, we obtained a knock-down T-DNA insertion mutant of AtSAMS3, which shares the highest homology with BvM14-SAMS2. Interestingly, the mutant atsam3 showed sensitivity to salt and H2O2 stress. We also found that the antioxidant system and polyamine metabolism play an important role in salt and H2O2 tolerance in the BvM14-SAMS2-overexpressed plants. To our knowledge, the function of the sugar beet SAMS has not been reported before. Our results have provided new insights into SAMS functions in sugar beet.

Graphical Abstract

1. Introduction

Soil salinity is a serious ecological problem that affects crop distribution and yield around the world [1,2,3]. More than 6% of land throughout the globe is affected by salinization [4]. Thus, improving the salt tolerance of crops to utilize saline soil is of high urgency [5,6]. High concentrations of salt usually lead to ionic imbalance, oxidative damage and nutrient deficiency in plants [2]. In order to adapt to the saline environment, plants can use some strategies allowing for adaptation, which include efflux of salt ions, compartmentalization of Na+ in vacuoles, synthesis of osmolytes, and increased synthesis of antioxidant enzymes [7]. In these adaptation processes, salt stress regulatory genes are induced, leading to changes in the protein levels that enable adaptation to the salinity conditions. For instance, many genes involved in signal transduction and redox reaction have been identified in several plant species [8]. It is reported that about 2300 ESTs (Expressed equence tags) in some halophytes showed differential expression under salt stress [9,10,11]. In addition, numerous proteins have exhibited salt stress responses as identified by proteomics studies in several halophytes [12,13,14,15].
S-adenosyl-l-methionine (SAM) synthetase, one of the salt-responsive genes, is an important enzyme in the synthesis of SAM. Usually, SAM synthesized by SAM synthetase (SAMS) from methionine and ATP, forms a universal methyl group donor involved in numerous transmethylation reactions [16]. It plays a vital role in metabolism and development regulation, as well as abiotic and biotic stresses [17,18]. Additionally, it functions as a precursor for the synthesis of polyamines (PAs), which are involved in regulating plant responses to abiotic or biotic stresses [19]. In the process of PA biosynthesis, SAM can be decarboxylated by SAM decarboxylase (SAMDC) to form decarboxylated SAM (dcSAM). Then, dcSAM provides aminopropyl groups to putrescine (Put) for sequential formation of spermidine (Spd) and spermine (Spm), catalyzed by Spd synthase (SPDS) and Spm synthase (SPMS), respectively. Put, Spd and Spm are major constituents of polyamines in plants. It is reported that up-regulation of polyamine synthesis by SAMDC-overexpressing tobacco plants displayed a significant increase in the contents of soluble conjugated PAs and resulted in enhanced tolerance to salinity [20]. On the basis of the SAM functions, a hypothesis of SAMS involved in plants abiotic or biotic stress tolerance was proposed. For example, transgenic plants overexpressing SlSAMS1 exhibited a strong tolerance to alkali stress and maintained a balance of nutrients under stress conditions [21]. Overexpressing MfSAMS1 in transgenic plants led to high accumulation of SAM and promoted polyamine synthesis, which in turn improved H2O2-induced antioxidant protection and increased tolerance to various abiotic stresses [22]. It is also reported that overexpression of SsSAMS2 from a halophyte plant Suaeda salsa in tobacco led to salt stress tolerance [23].
Sugar beet monosomic addition line M14 was acquired from the hybridization between Beta vulgaris L. and Beta corolliflora Zoss [24]. The M14 line has shown characteristics of apomixis and tolerance to abiotic stress [25,26,27]. In this study, we employed suppression subtractive hybridization (SSH) to investigate alterations in the transcriptional profiles of the M14 line under salt stress. Furthermore, BvM14-SAMS2 was found to be increased in the transcriptional level under NaCl treatment. In order to determine the role of salt-induced BvM14-SAMS2 in salt response, BvM14-SAMS2 was cloned using the rapid amplification of complementary deoxyribonucleic acid ends (RACE) method. To investigate the gene functions, transgenic Arabidopsis overexpressing BvM14-SAMS2 was generated and used to examine antioxidant activity and polyamine contents. The results demonstrated that the overexpression of BvM14-SAMS2 can confer salt and H2O2 stress tolerance in the transgenic plants.

2. Results

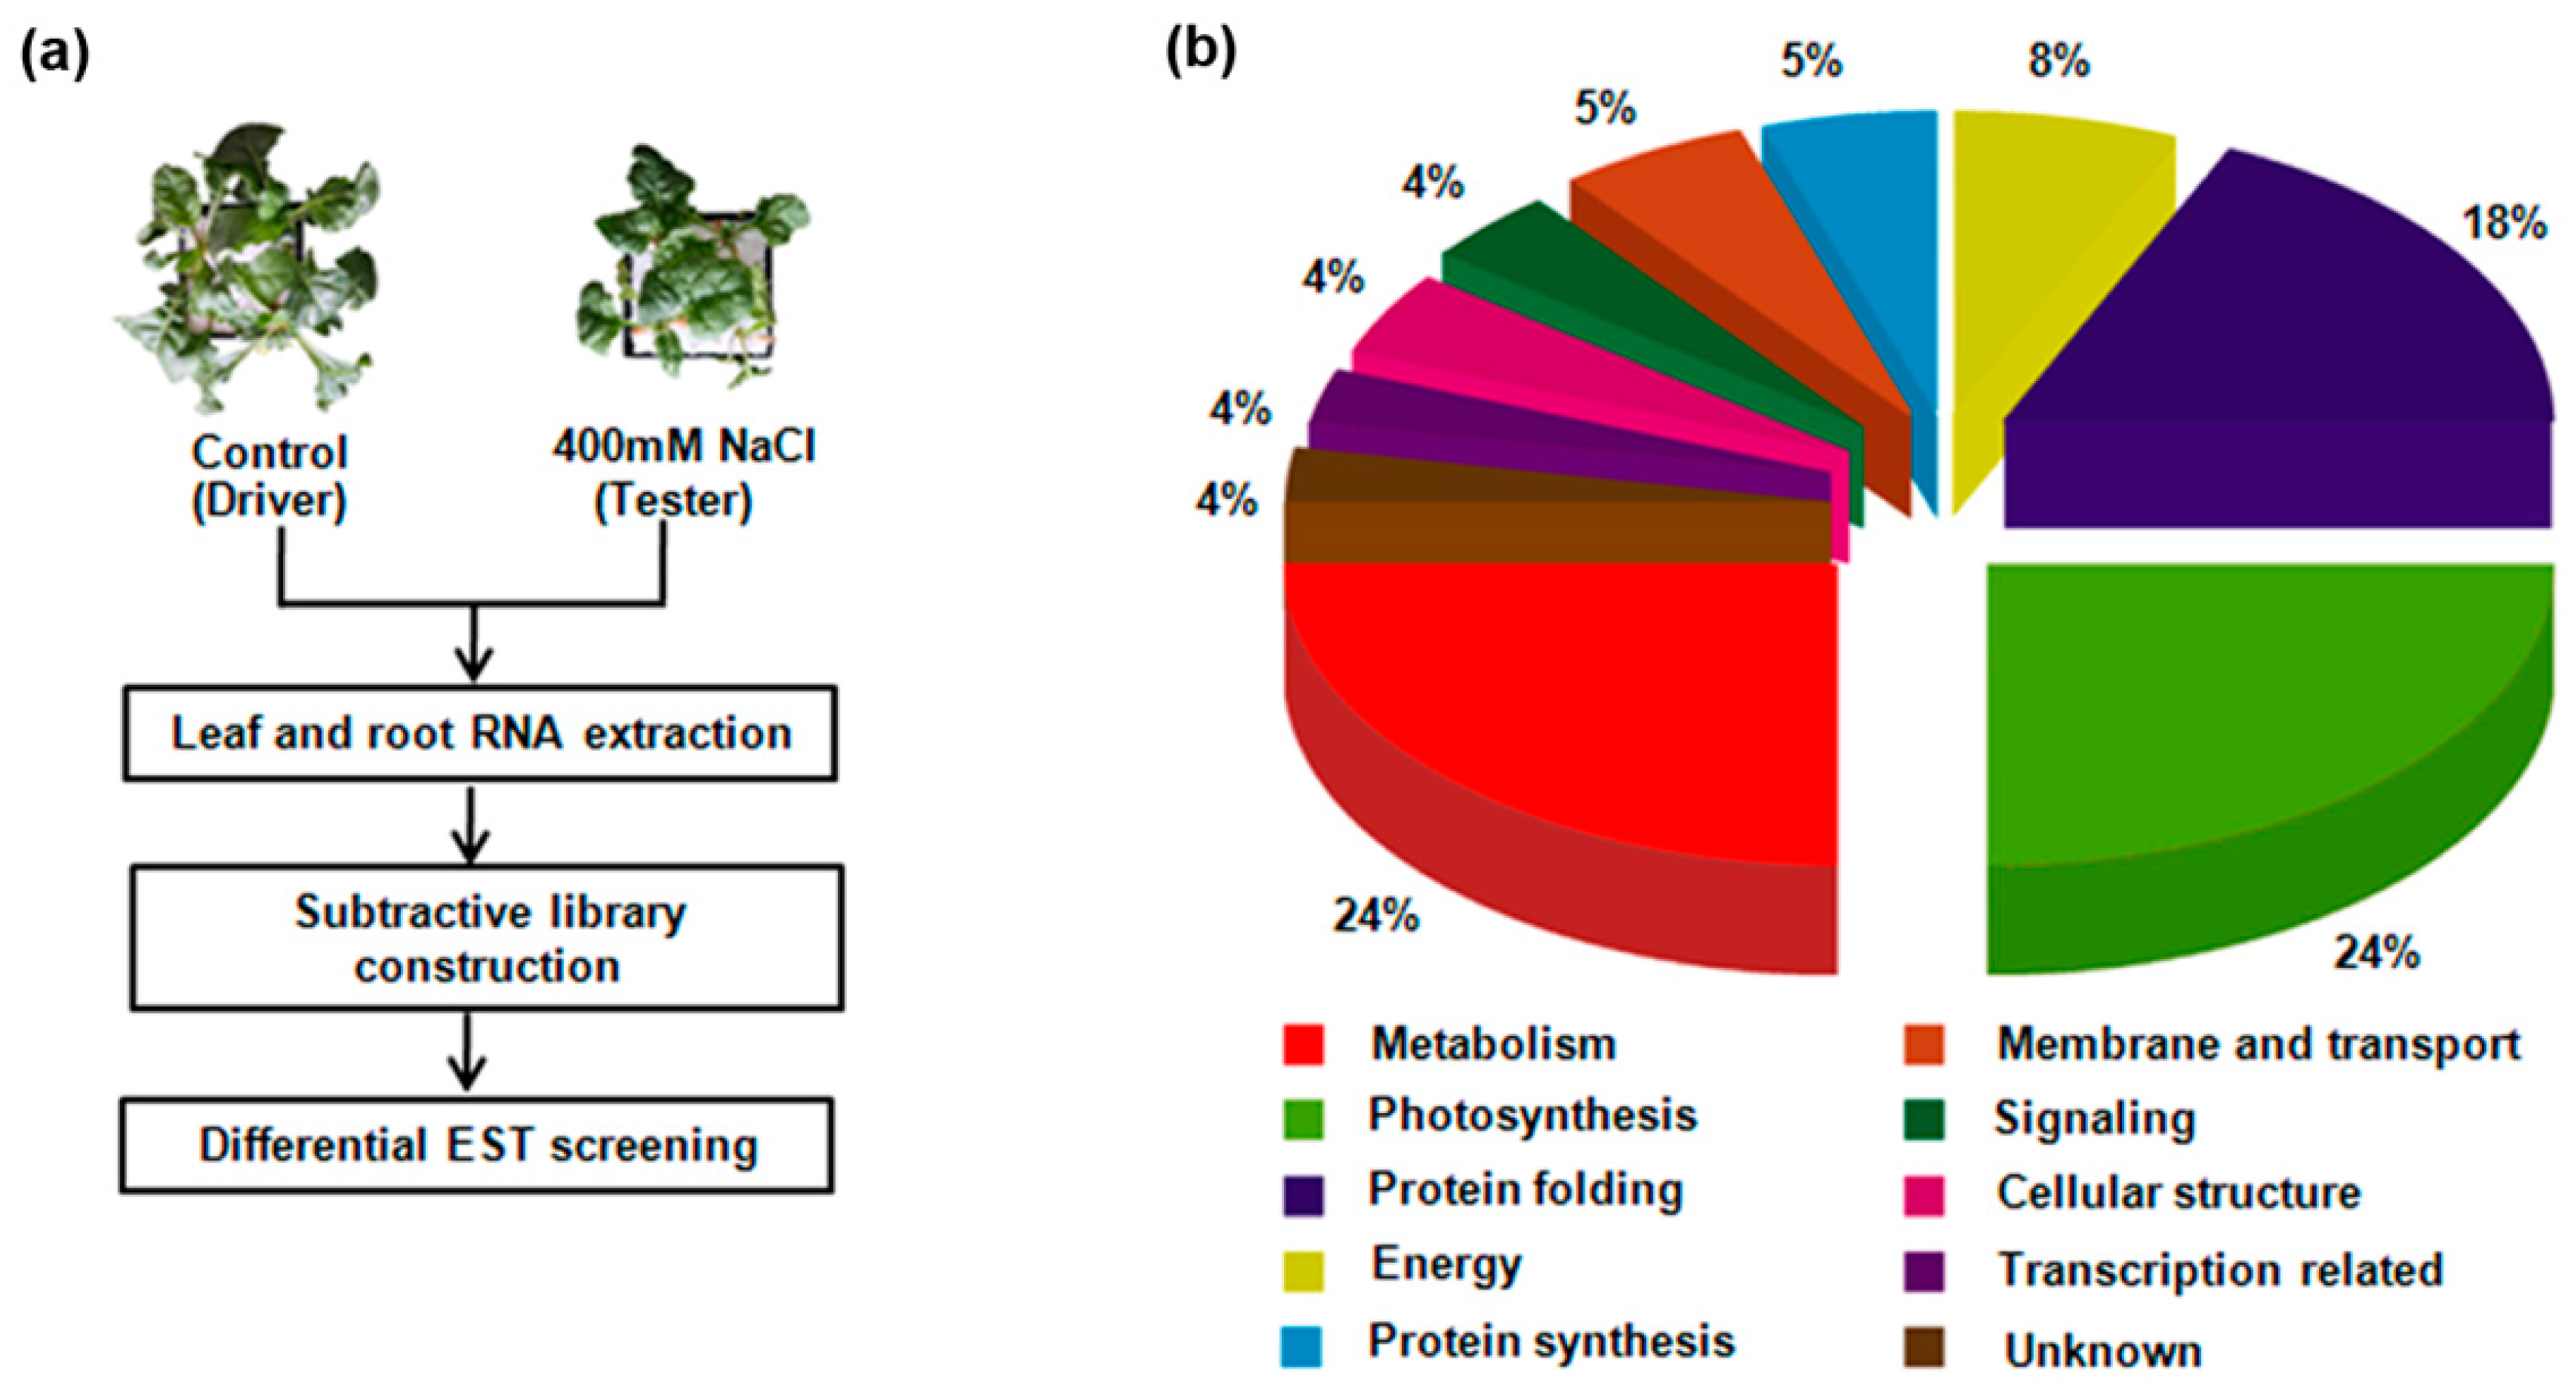
2.1. Identification of Differentially Expressed M14 Genes under Salt Stress Using SSH

To identify the differentially expressed genes in the M14 line under salt stress, SSH was employed to profile differential gene expression following 400 mM NaCl treatment for 7 days. The cDNAs synthesized from the sugar beet M14 root and leaf mRNAs under control conditions were used as drivers, and those from roots and leaves under salt stress were selected as testers. A total of 500 colonies were randomly selected for sequencing. After counting assembly, 36 unigenes were acquired and annotated by comparison with the non-redundant (Nr) database using Blastx (Table 1). Furthermore, gene classification was carried out by the Gene Ontology (GO) method (Figure 1). For example, many of the genes were classified in terms of catalytic activity (39%) according to their molecular functions. Interestingly, among the differentially expressed genes, leaf (L) 22 and root (R) 6 EST clones showed high homology with plant SAMS, which has been reported to play an important role in stress tolerance [17,18].

2.2. Cloning of a BvM14-SAMS2 Gene and Sequence Analysis

Based on the EST sequences (L 22 and R 6) matched to a BvM14-SAMS2 gene, a full-length cDNA clone was obtained using a 5′-/3′-RACE extension method. Sequence analysis confirmed the clone to be the SAMS gene. As shown in Supplementary Materials Figure S1, the full-length BvM14-SAMS2 was comprised of 1538 bp, containing an open reading frame of 1182 bp nucleotides, which encodes a 393-amino acid protein with a molecular mass of 42.99 kDa and a pI (isoelectric point) of 5.59. No signal peptide was found.
Phylogenetic analysis of BvM14-SAMS2 was performed using a neighbor-joining method with MEGA4.1. The phylogenetic tree reflects both the taxonomy and specificity. As shown in Figure S2, BvM14-SAMS2 forms a clade with the Arabidopsis thaliana AtSAMS3. The result showed that the BvM14-SAMS2 was closely related to monocotyledon and other plants, and SAMS genes were relatively conserved in evolution.

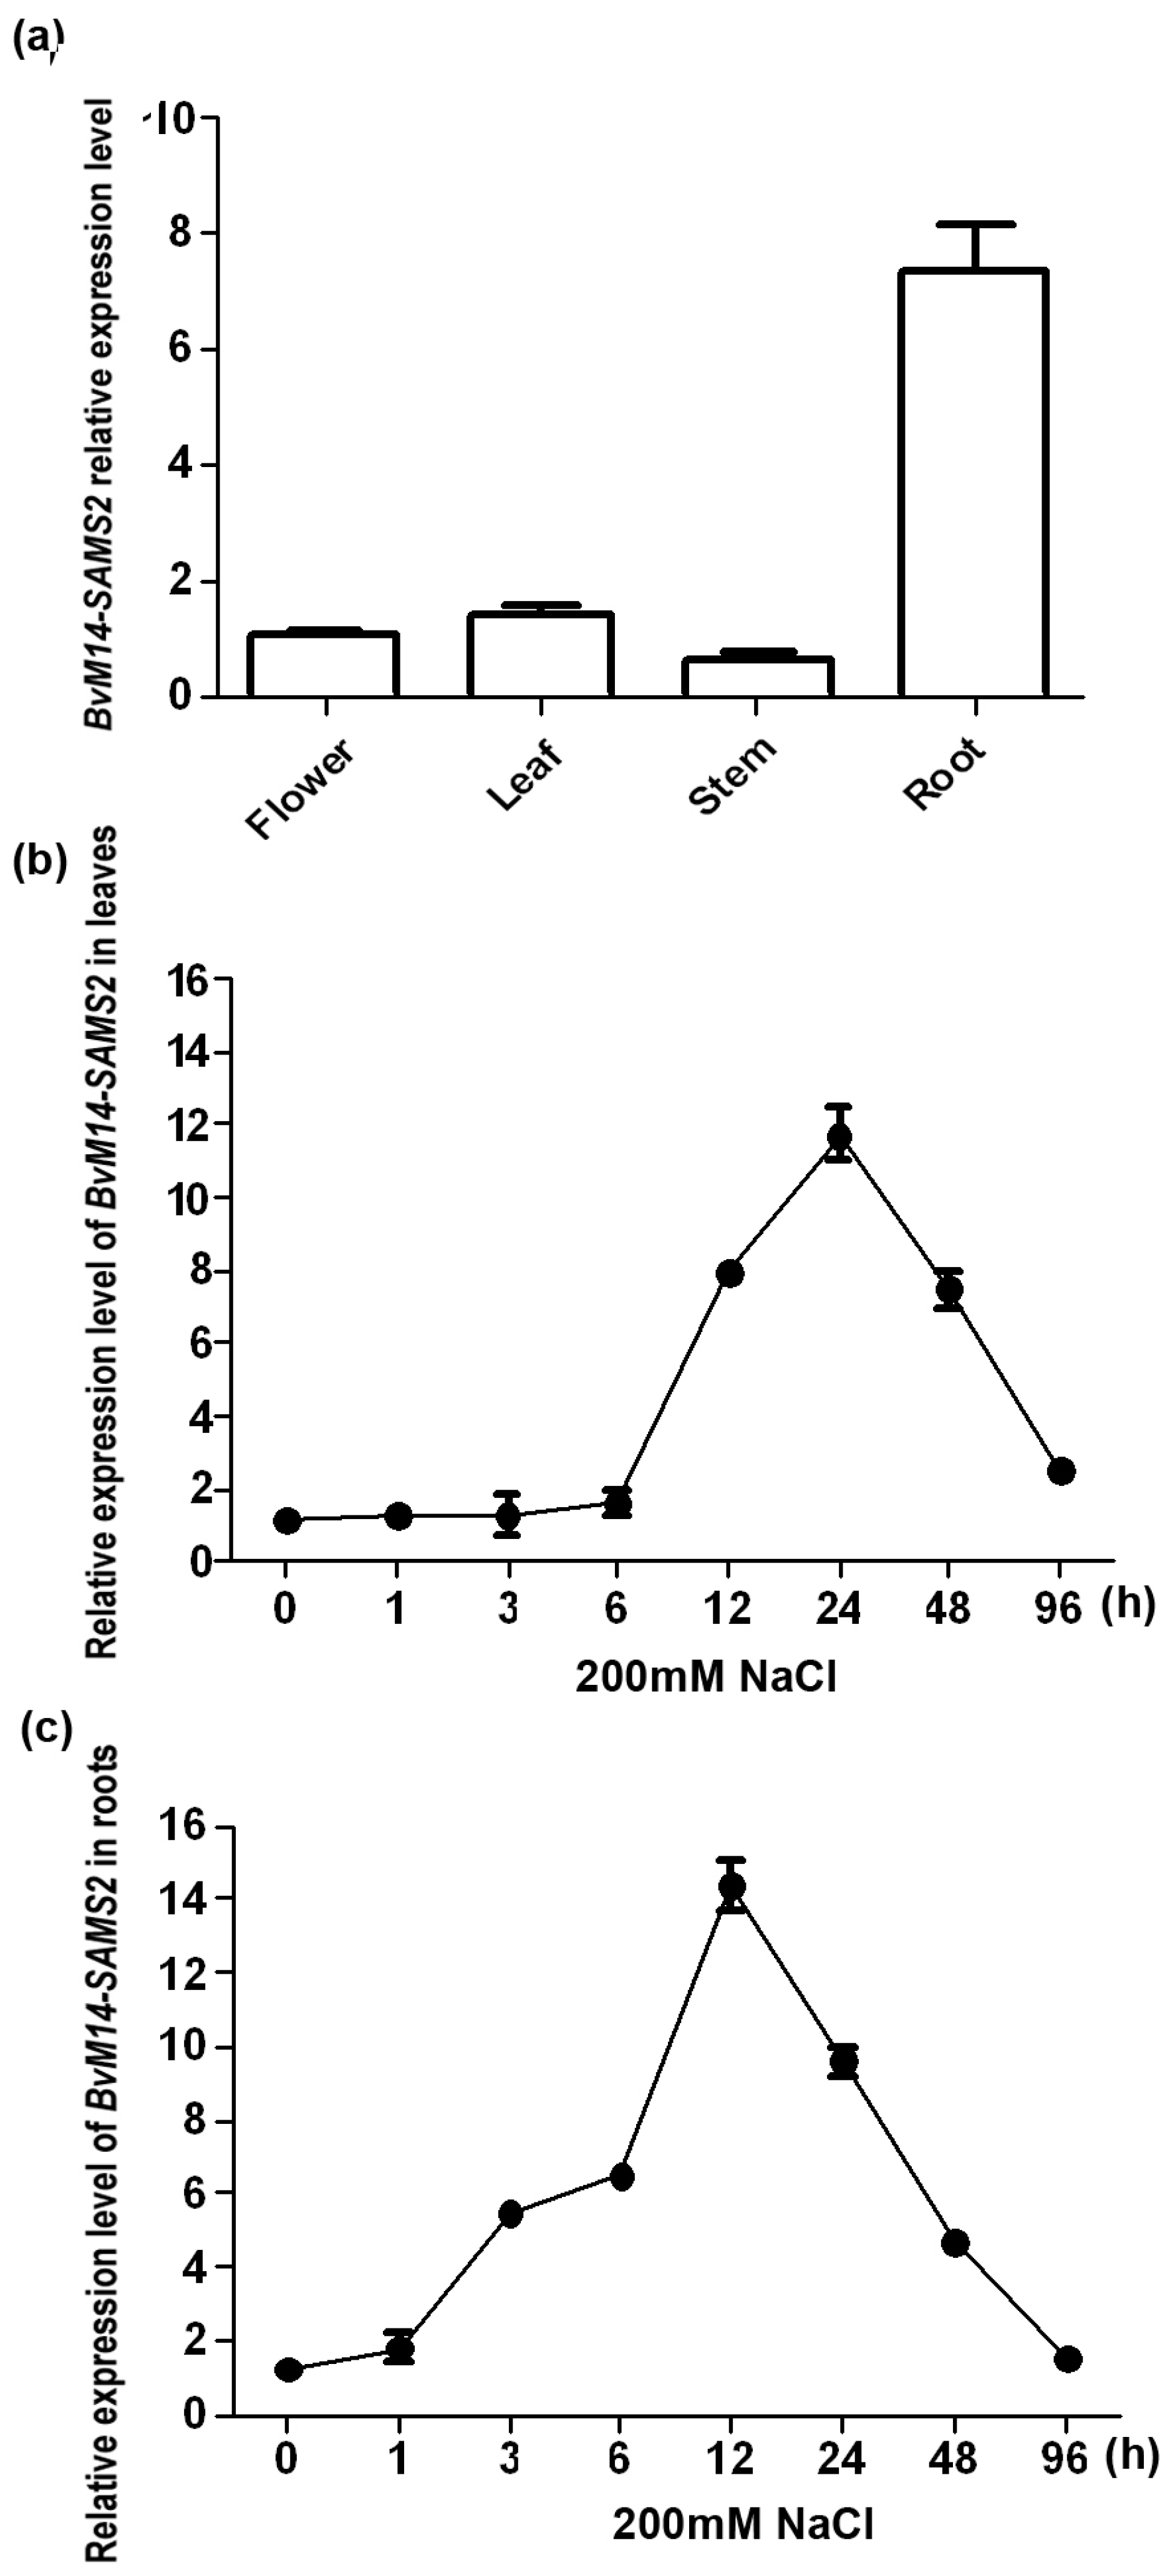
2.3. Analysis of BvM14-SAMS2 Response to Salt Stress

BvM14-SAMS2 transcript levels in different tissues were detected. Under normal control conditions, high levels of BvM14-SAMS2 transcript were found in roots, but a small quantity of BvM14-SAMS2 transcript was detected in flowers, leaves and stems (Figure 2a). We also determined AtSAMS3 gene expression in different tissues of A. thaliana (Figure S3). AtSAMS3 expression was strong in roots, and its expression patterns were not substantially different from those of BvM14-SAMS2 in sugar beet M14. These results confirmed that BvM14-SAMS2 is closely related to AtSAMS3, and we speculated the function of BvM14-SAMS2 in sugar beet M14 may be similar to AtSAMS3.
The responses of BvM14-SAMS2 mRNA to salt stress were determined in roots and leaves using quantitative reverse transcription-polymerase chain reaction (RT-PCR). The induction of BvM14-SAMS2 transcript was found much earlier in roots than in leaves (Figure 2b,c). High levels of BvM14-SAMS2 transcripts were observed at 12 h and 24 h after salt treatment in roots and leaves, respectively (Figure 2b,c). These results showed that the expression of BvM14-SAMS2 was significantly up-regulated by salt stress.

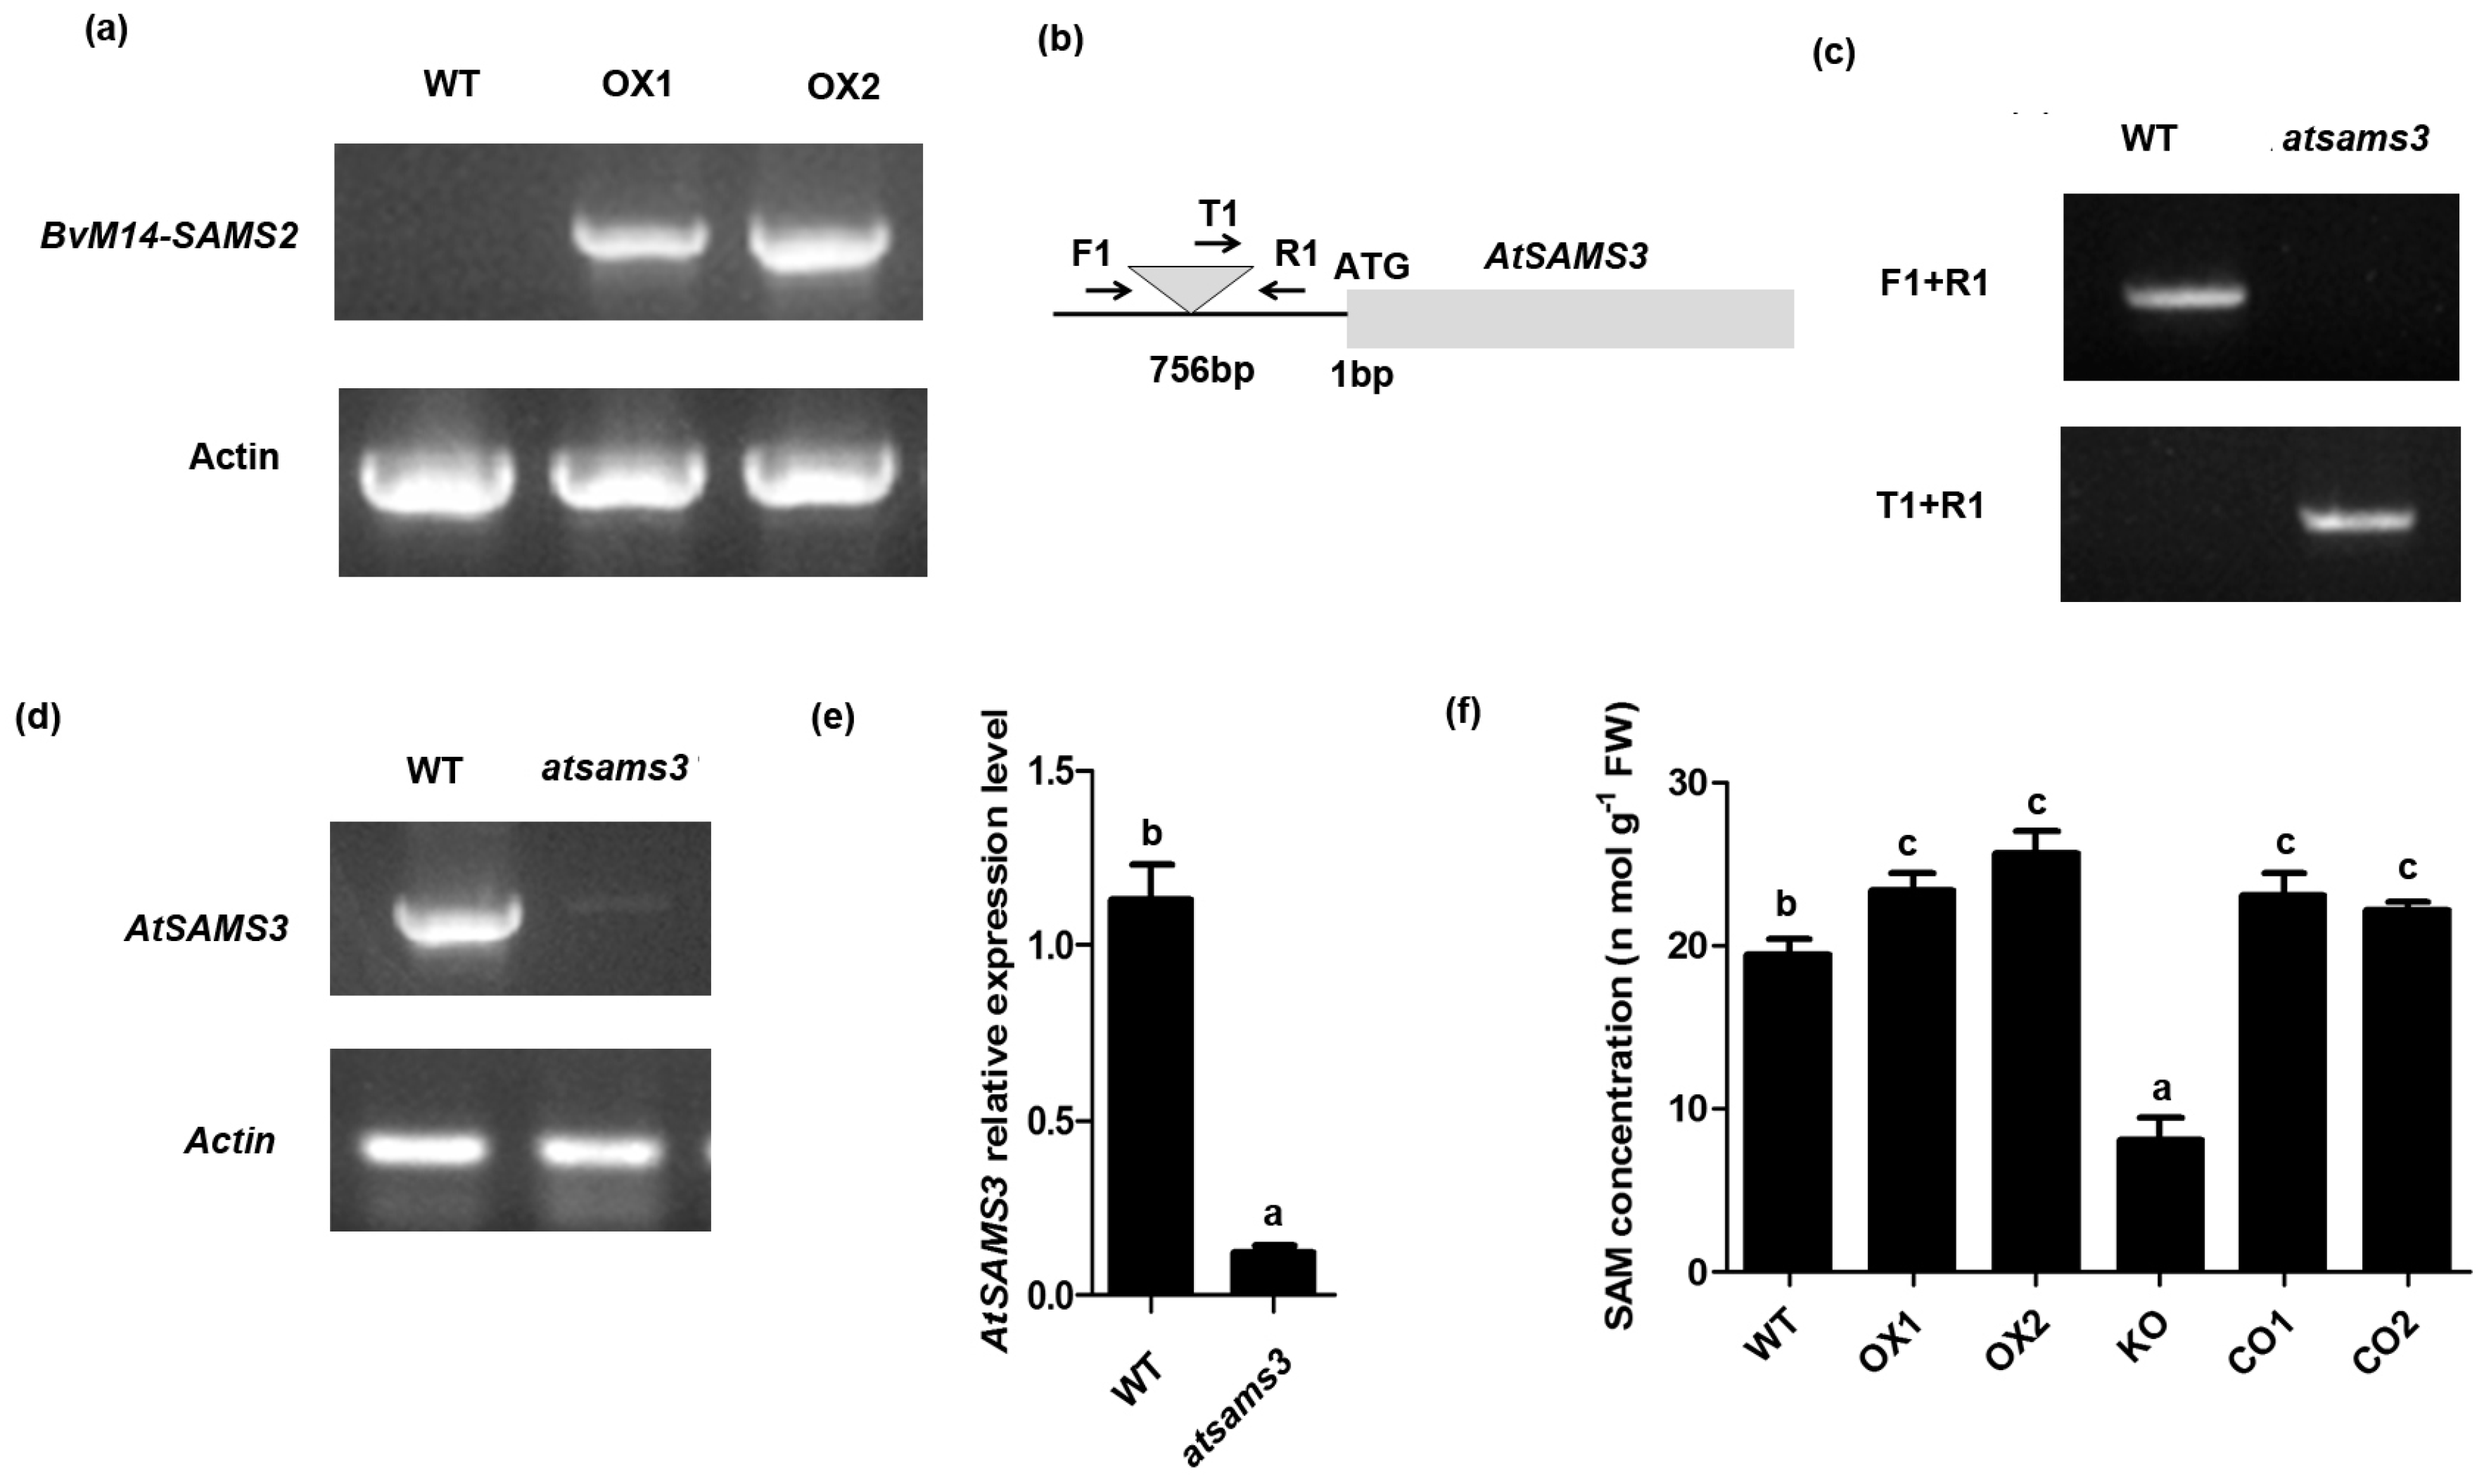
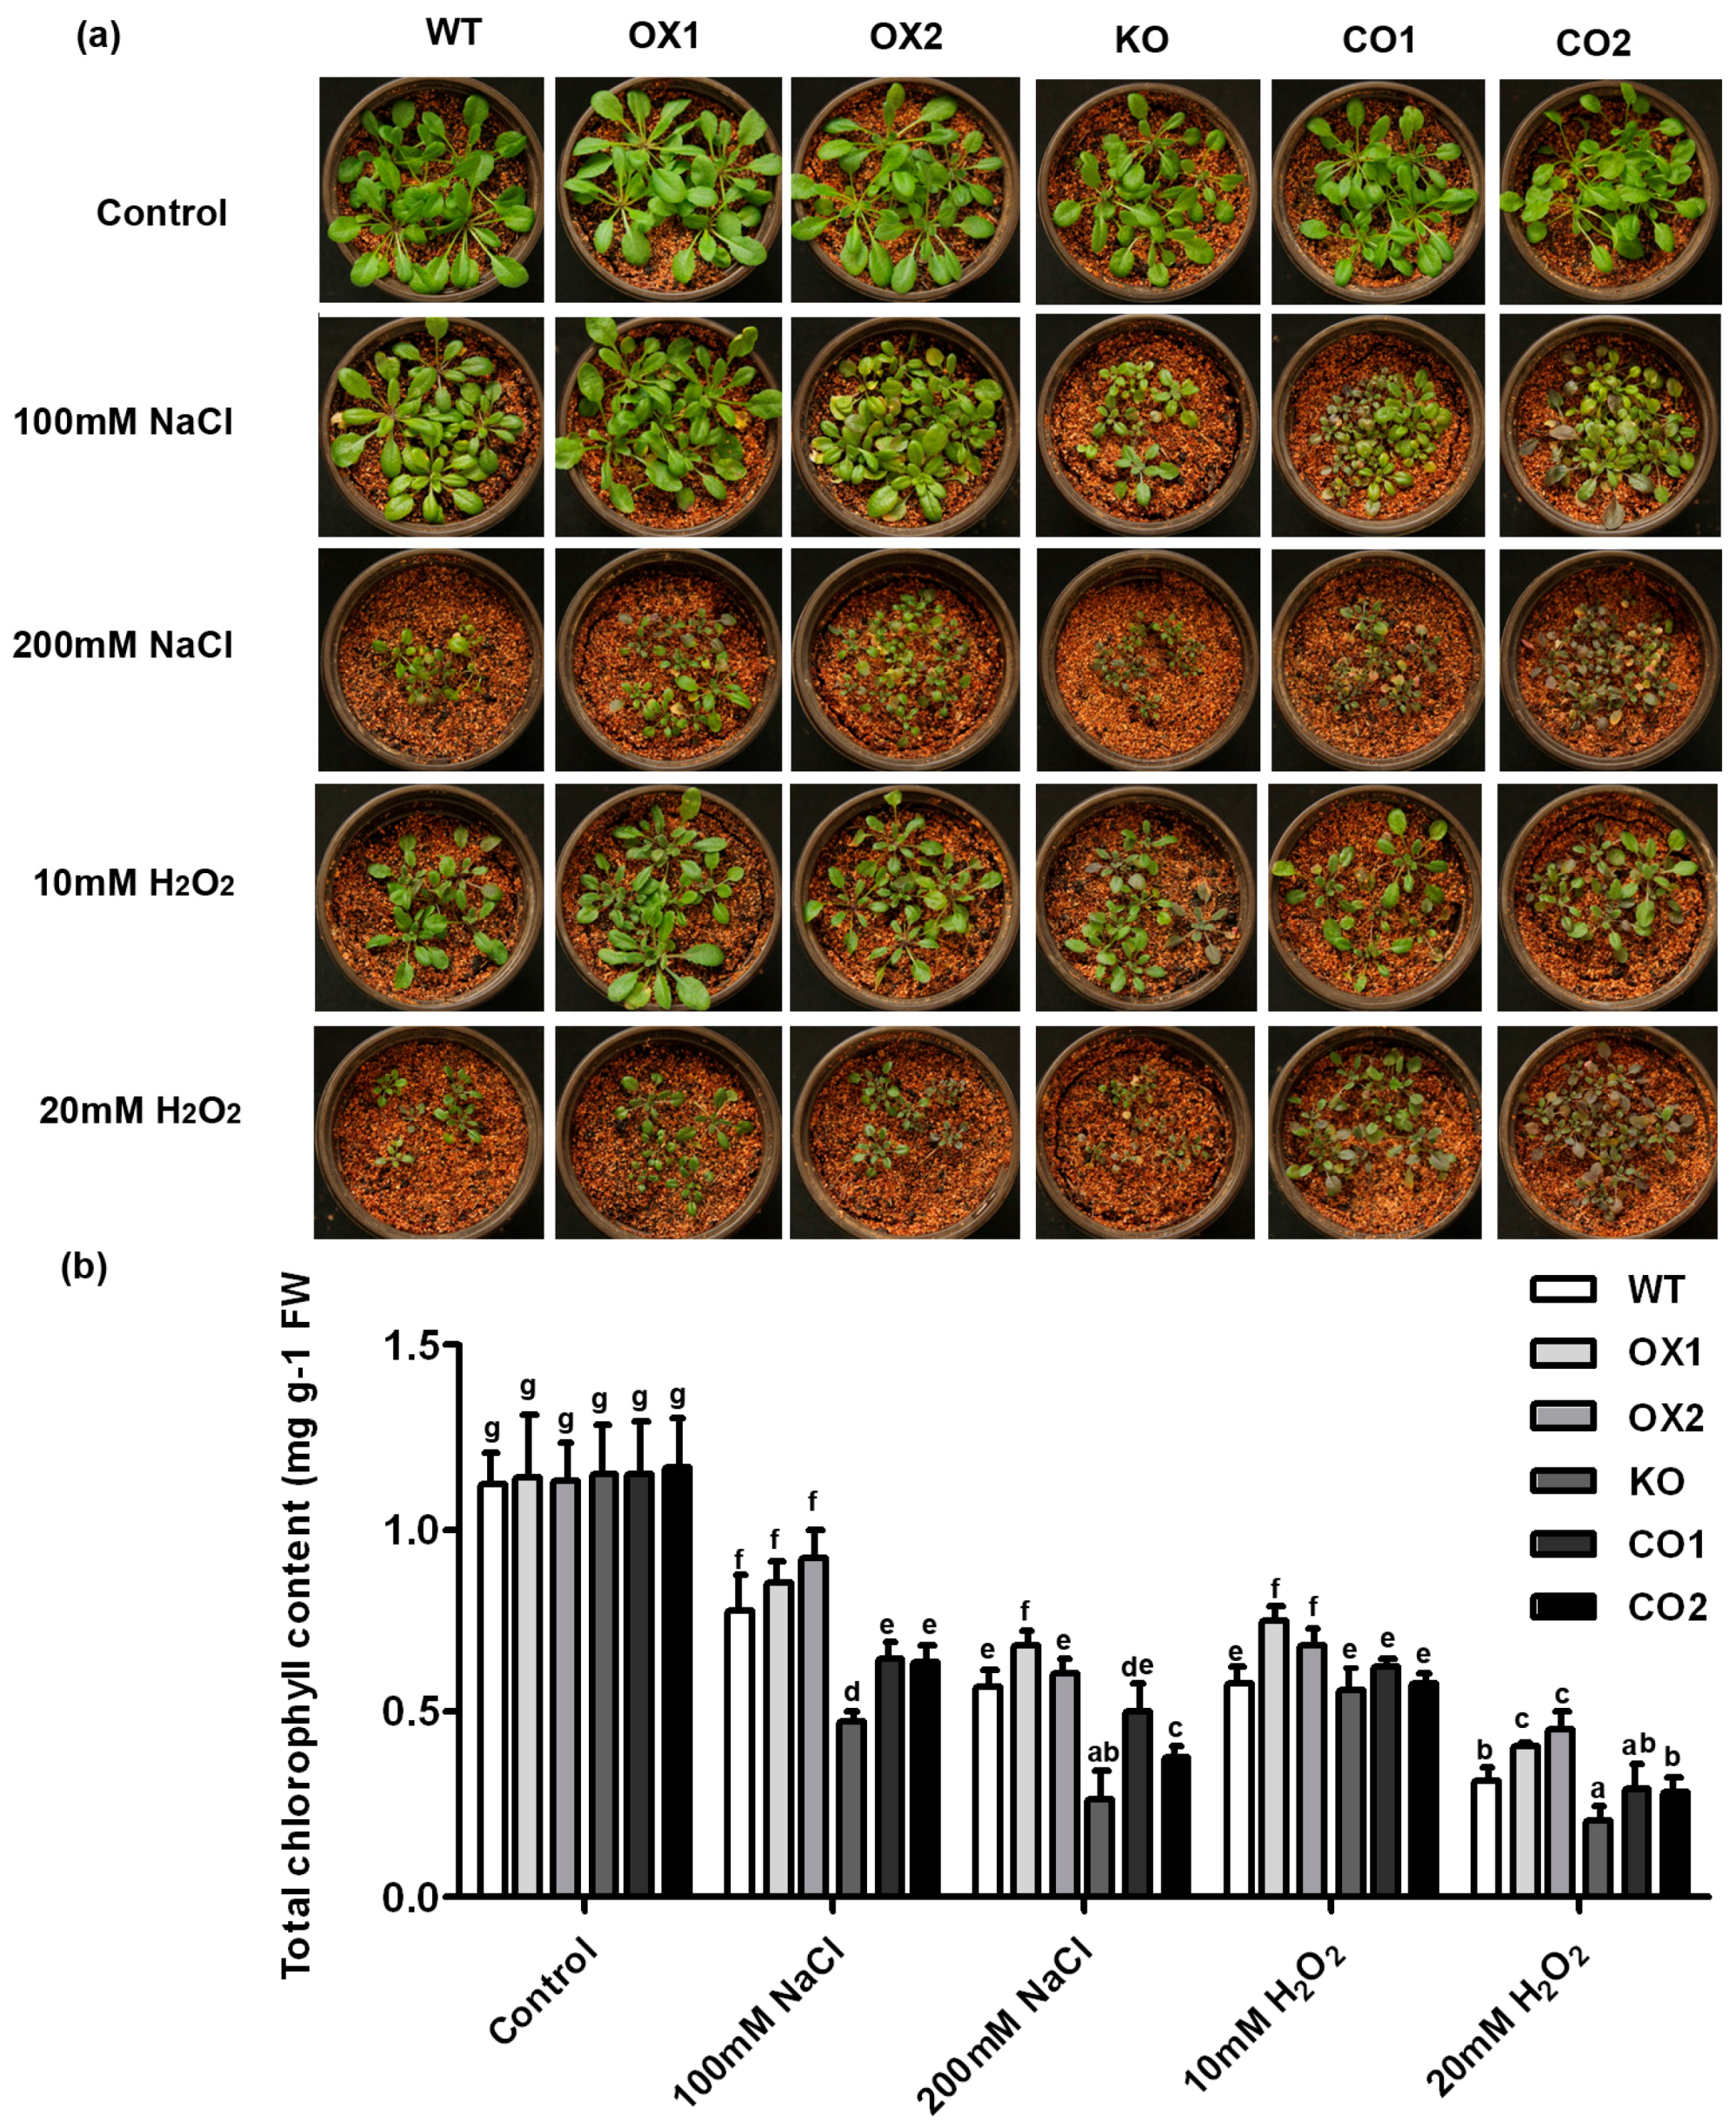
2.4. Overexpression of BvM14-SAMS2 Confers Enhanced Salt and H2O2 Tolerance in Arabidopsis

To determine the functions of BvM14-SAMS2 under salt stress conditions, we created transgenic Arabidopsis plants that over-express the BvM14-SAMS2 gene. Two homozygous T3 overexpressed BvM14-SAMS2 transgenic lines (OX1 and OX2) were identified by RT-PCR analysis (Figure 3a). Furthermore, the T-DNA insertion mutant line of atsam3 from Arabidopsis was identified (Figure 3b–d). The T-DNA was inserted in the upstream region of the AtSAMS3 promoter (at 765 bp) (Figure 3b,c) and the expression level of AtSAMS3 was significantly decreased in the atsam3 mutant (Figure 3d,e). In addition, the construct overexpressing BvM14-SAMS2 was also transformed into the atsam3 mutant background and two homozygous T3 complementation lines (CO1 and CO2) were selected. Furthermore, the content of SAM was also detected in different Arabidopsis seedlings (Figure 3e). The BvM14-SAMS2-overexpressed transgenic lines showed higher levels of SAM than the wild type (WT), and AtSAMS3 konckdown mutant (KO) line exhibited much lower SAM levels than WT.
The transgenic Arabidopsis lines were analyzed in salt stress tolerance on Murashige and Skoog (MS) plates. Overexpression of BvM14-SAMS2 in Arabidopsis did not show growth inhibition under normal conditions. However, obvious wilting was found in all the seedlings under salt stress, the OX lines exhibited lower reduction in fresh weight and root length compared with the wild type or the atsams3 mutant under salt stress (Figure 4). Similar phenotype was also identified under H2O2 stress (Figure 4). Furthermore, KO lines are more sensitive to salt and H2O2 stresses than the atsams3 complementation seedlings (CO1/CO2) or wild type. In order to confirm the above results, the transgenic seedlings were treated with salt and H2O2 stress in soil. After 7 days of the 100 mM salt or 20 mM H2O2 stress treatments, plants overexpressing BvM14-SAMS2 showed lower levels of wilting than wild type (Figure 5a). In addition, salt and H2O2 stresses caused a decrease of total chlorophyll content in the control seedlings. Under salt stress conditions, no significant differences were found between wild type and BvM14-SAMS2-overexpressed lines. However, the contents of chlorophyll were higher in the overexpressed BvM14-SAMS2 lines than wild type under H2O2 stress (Figure 5b). In addition, atsams3 mutants showed higher reduction in chlorophyll contents than WT and CO lines under salt stress and H2O2 stress.

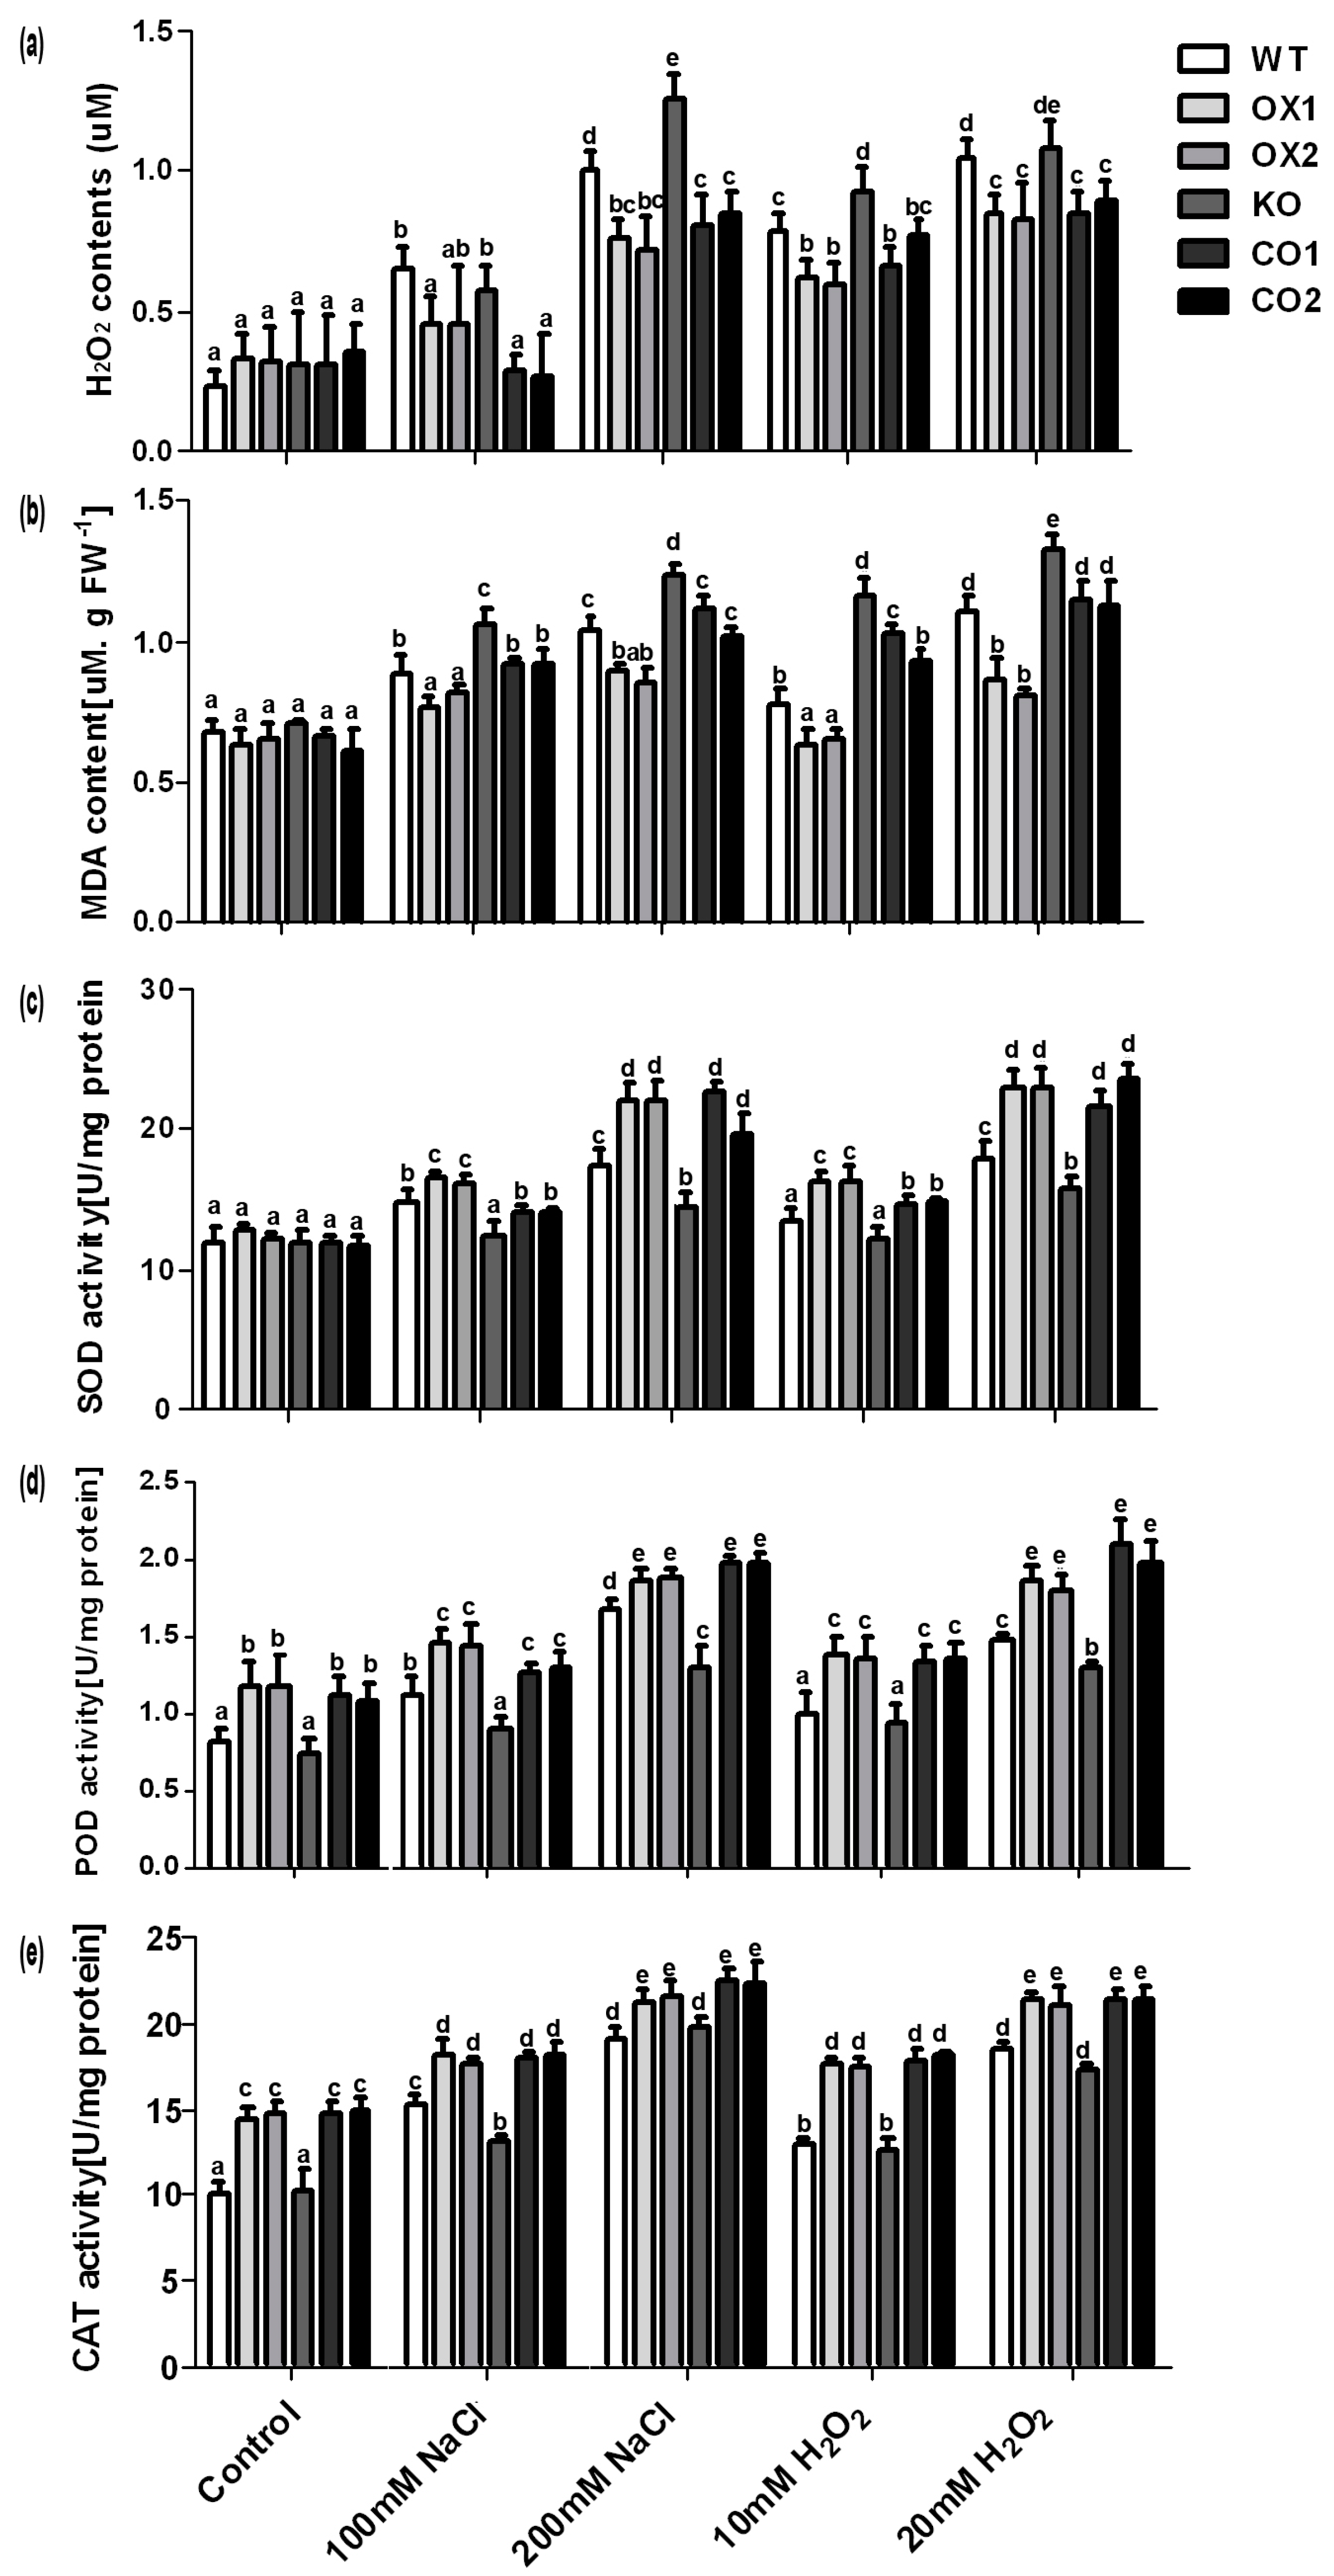
2.5. Overexpression of BvM14-SAMS2 Increased Antioxidative Activities in Arabidopsis

Salt stress usually causes oxidation induced lipid membrane damage. The damage can be determined by lipid peroxidation, and the malondialdehyde (MDA) content reflects the level of lipid peroxidation. Under stress conditions, all genotype seedlings exhibited the increasing trend of H2O2 and MDA contents. However, KO lines accumulated higher contents of H2O2 and MDA than WT plants or CO lines (Figure 6a,b). Furthermore, overexpressed plants showed lower H2O2 and MDA contents than wild type plants under stress conditions (Figure 6a,b). These results demonstrated that oxidative damage was reduced in the overexpressed plants. In addition, we analyzed the activities of antioxidant enzymes to determine whether the antioxidant enzyme system was involved in reducing the oxidative damage. The activities of antioxidant enzymes including superoxide dismutase (SOD), catalase (CAT) and peroxidase (POD) exhibited higher activities in the OX lines than in WT under salt and H2O2 stresses (Figure 6c–e). Although stress conditions can induce the activities of these antioxidant enzymes in all the plants, the KO lines exhibited smaller extent of increasing activities than WT under salt and H2O2 stresses (Figure 6c–e). In addition, no differences in the activity of SOD were detected under the normal conditions between all the seedlings, except that the activities of CAT and POD in the overexpressed plants were higher than WT or KO line under the control conditions.

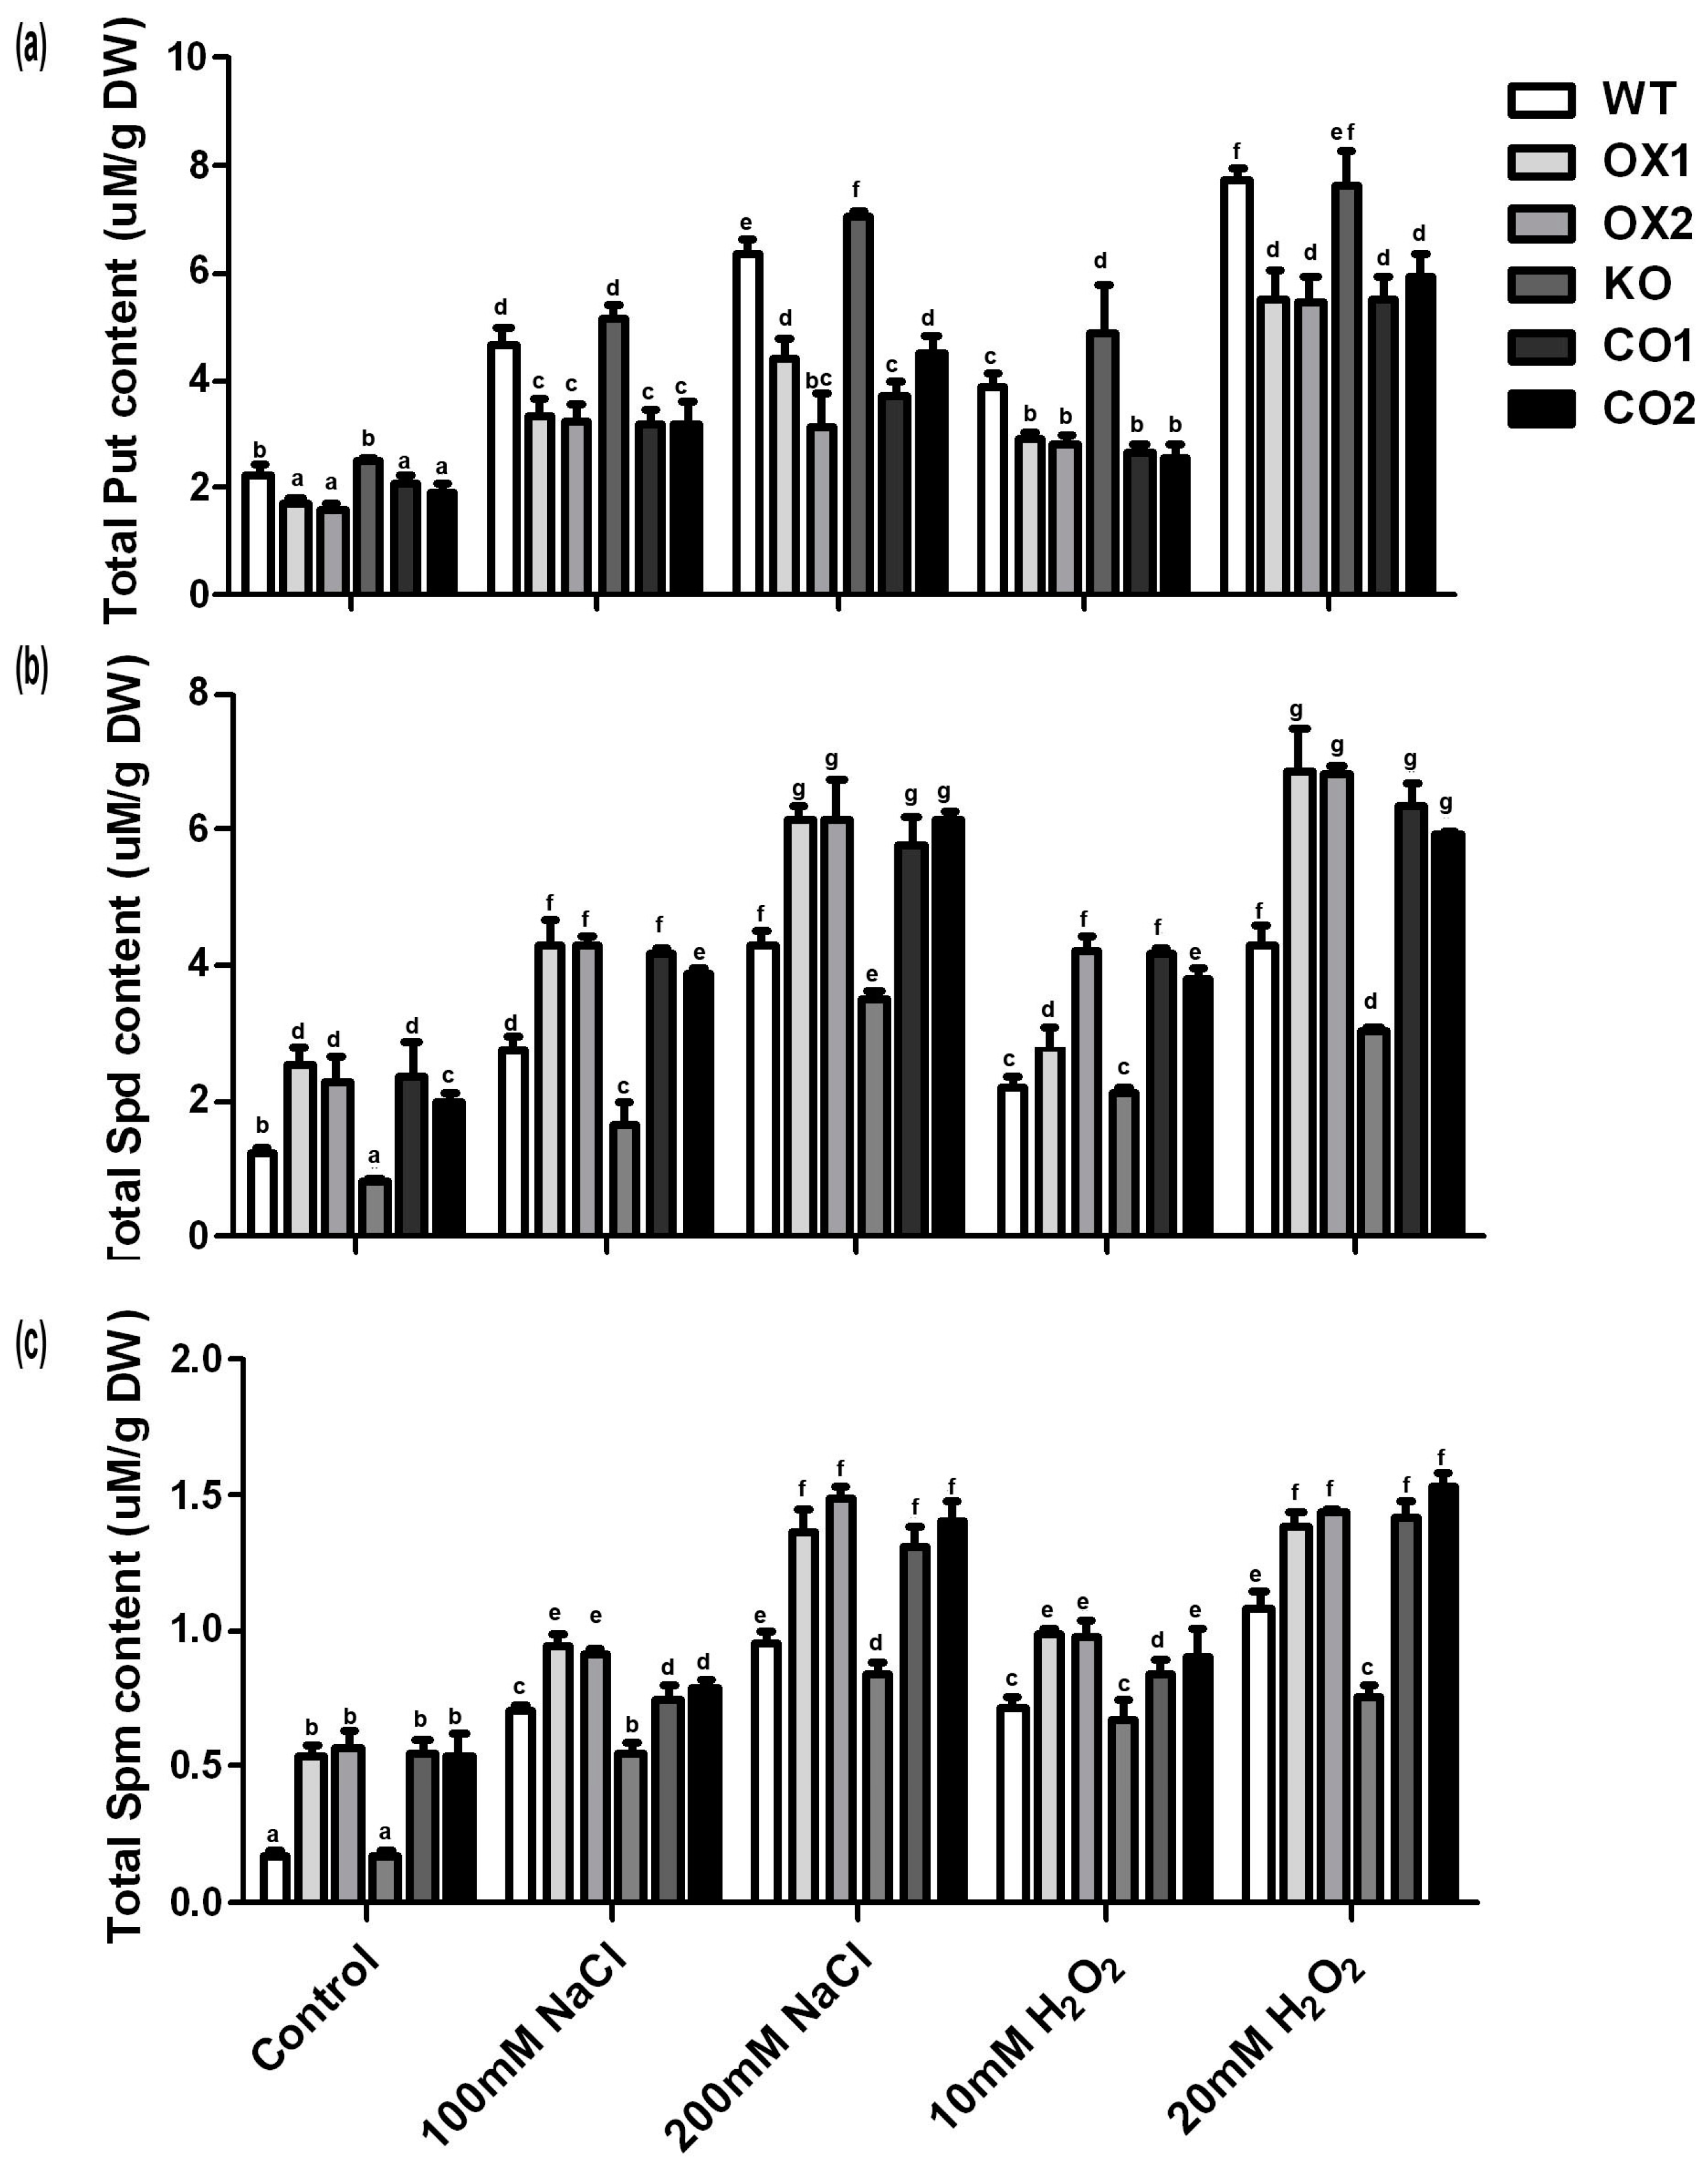
2.6. Overexpression of BvM14-SAMS2 Greatly Influenced Polyamine Metabolism

Three types of polyamines, total putrescine (Put), spermidine (Spd) and spermine (Spm) were detected in the overexpressed transgenic plants and wild type. The OX lines showed lower Put concentration than the wild type under control, salt stress and H2O2 stress conditions (Figure 7a). However, under control and stress conditions, Spd and Spm increased in the OX lines (Figure 7b,c). These results showed that overexpressed BvM14-SAMS2 greatly influenced polyamine metabolism. In addition, proline contents were analyzed (Figure S4) and the results showed that there were no differences between OX lines and wild type under the control condition. Under stress conditions, proline contents increased in both transgenic plants and wild type. However, proline contents were significantly higher in OX lines than in the wild type during salt and H2O2 stresses, indicating that the wild type plants experienced higher extent of cell damage than the transgenic plants under stress conditions.

3. Discussion

The BvM14-SAMS2 characterized in this study was salt-stress induced in roots and leaves of the sugar beet M14 line. Our results are consistent with previous findings of the induction of SAMS expression by salt, cold, drought and H2O2 [28,29,30]. Furthermore, overexpression of BvM14-SAMS2 in Arabidopsis led to significant increases in salt and H2O2 stress tolerance (Figure 4). Photosynthesis, as the most important and complex physiological process of plants, is severely affected by many abiotic stresses. It is reported that salt stress reduced the level of photosynthetic pigments. Usually, the level of photosynthetic pigment is thought to be a biochemical indicator for evaluating salinity tolerance in plants. The KO lines showed a decrease in the total chlorophyll content compared to WT under the stress conditions (Figure 5). Therefore, the decreased chlorophyll content clearly indicates the sensitivity of the KO line to salt and H2O2 stresses.
SAMS in Arabidopsis is encoded by four genes. AtSAMS1 and AtSAMS2 are expressed in most of plant tissues, including leaves, roots and flowers [31], whereas AtSAMS4 is expressed predominantly in pollen [32]. Our data indicate that AtSAM3 is also widely expressed in different plant tissues, and showed relatively high expression levels in roots. These results showed that SAMS is involved in many aspects of plant metabolism and development. AtSAMS1 and AtSAMS2 are most similar in sequence and expression patterns, and the double mutant atsams1/atsams2 showed decreases in ethylene [31]. Furthermore, the atsam4 mutant was impaired in pollen tube growth and reduced seed production [32]. Moreover, over-expression of the AtSAMS1 in Arabidopsis leads to a dwarf phenotype [31]. In this study, overexpression of BvM14-SAMS2 did not cause the dwarf phenotype. This result is similar to the overexpression of a potato SAMS in Arabidopsis, and the transgenic Arabidopsis lines exhibited high salt and drought stress tolerance [33]. Clearly, the SAMS gene family had function diversity and species specificity. In addition, atsams3 plants decreased SAM content by more than 50%, as compared to the WT plants (Figure 3f). We speculate that different SAMSs catalyze SAM production at different seedling developmental stages, and AtSAMS3 may play a predominantly role in the 20-day old seedlings.
Reactive oxygen species (ROS) and MDA contents are proposed to be indicators of oxidative stress. Usually, reducing the use of absorption light energy caused by inhibition of calvin cycle enzyme under stress conditions will promote production of ROS [34]. Plants possess efficient enzymatic antioxidant defense systems to protect the cells from oxidative damage by scavenging ROS. For example, SOD dismutates superoxide radicals to H2O2, which is sequentially scavenged by CAT and POD [35]. Other reports showed that exogenous Spd enhanced chilling tolerance in tomato through enhancing the expression of SOD, POD, CAT and ascorbate peroxidase (APX), and their activities in tomato leaves [36]. Meanwhile, nitric oxide (NO) induced by Spd plays a crucial role in regulating these antioxidant enzymes. Similarly, in our study, the activities of CAT and POD were higher in the BvM14-SAMS2 overexpression plants than WT or atsams3 mutant under control and stress conditions. In addition, the low accumulation of H2O2 and MDA after H2O2 or salt stress in the BvM14-SAMS2-overexpressed plants was observed (Figure 6). These results showed that the OX lines possessed high antioxidant enzyme activities that help them to better cope with the stress conditions than the other plants. Furthermore, although the activity of SOD was not different between the genotypes in control conditions, the BvM14-SAMS2-overexpressed transgenic lines showed higher activity than WT or mutant under stress conditions. These results were similar to a previous study [37], where SOD was activated to reduce the ROS levels in TaWRKY44 overexpression transgenic lines after drought and salt stresses [37]. Usually, SOD provides the first line of defense against ROS by catalyzing the dismutation of O2 to oxygen and H2O2. Thus, our result indicated the antioxidant enzymes involved in first line of defense in BvM14-SAMS2 overexpression plants function more effectively than the WT or KO line.
Recently, several studies have shown the interplay between PAs and signal molecules (e.g., abscisic acid (ABA) and ethylene) under abiotic stresses [38]. It is reported that exogenous Put significantly increased the ABA content in tomato [38]. Furthermore, the expression levels of genes related to ethylene biosynthesis and ABA response were up-regulated in SbSAMS-overexpressing Arabidopsis lines, and the transgenic Arabidopsis plants exhibited higher salt and drought stress tolerance than control plants [33]. Taken together, it is speculated that, under salt or H2O2 stresses, the increased Spd and Spm contents due to the overexpressed BvM14-SAMS2 may affect the stress-related genes including the ethylene and ABA genes responsible for abiotic stress response and tolerance.
In the process of PA synthesis, SAM is converted to decarboxylated S-adenosylmethionine (dcSAM), which can supply an aminopropyl group donor for the synthesis of PA. PA is well-known to play an important role in regulating plant adaptation to abiotic stresses [19]. PAs have been reported to scavenge ROS in plants [39] and are thought to be membrane protectors [40]. The contents of the diamine (Put) and triamine (Spd and Spm) were analyzed here. The levels of these common PAs were induced under salt stress conditions in the wild type plants. However, the level of Put was much lower in the BvM14-SAMS2 overexpression lines under both control and salt stress conditions, while the contents of Spd and Spm were much higher in the BvM14-SAMS2 overexpression lines, leading to a high ratio of (Spd + Spm)/Put. Other reports showed that Spd and Spm play a vital role in maintaining the thylakoid membrane integrity. Nevertheless, Put may be involved in depolarization of the membrane [21,41]. Therefore, a high ratio of (Spd + Spm)/Put in the BvM14-SAMS2 overexpression lines may be an important factor for the salt stress tolerance in the M14 plants. This trend was observed not only in the sugar beet M14 under control and salt stress conditions, but also in tomato plants under high level alkali stress [21]. It is reported that arginine decarboxylase (ADC) and omithine decarboxylase (ODC), two key enzymes in Put biosynthesis, exhibited much higher activities in SlSAMS overexpression lines under alkali stress, while they did not cause higher accumulation of Put. They speculated that up-regulation of SlSAMDC and SlSPDS may be the main cause of this phenomenon. High levels of Put were quickly converted to Spm and Spd by SlSAMDC and SlSPDS. Thus, it may be concluded that salt or H2O2 stress tolerance induced by overexpressing the BvM14-SAMS2 might be involved in increasing the SAM levels for generating Put (Figure 3f), and enhanced conversion of Put to Spd and Spm has been suggested to play important roles in plant tolerance to stress conditions.

4. Materials and Methods

4.1. Plant Materials and Growth Conditions

Seeds of monosomic addition line M14 were sown in vermiculite and watered daily. After one week, seedlings were transferred to hydroponic containers with Hoagland solution. Seedlings were cultivated in a greenhouse at Heilongjiang University with a 12 h/12 h light/dark, a 450 μmol·m−2·s−1 light intensity, a 24 °C/20 °C day/night temperature, and a relative humidity of 70%. Arabidopsis growth and treatment were conducted as previously described [27].

4.2. Construction of a Subtractive cDNA Library

Total RNAs were extracted using TRIzol reagent (Invitrogen, Carlsbad, CA, USA) from the salt stress and the control samples and mRNA was selected by the Oligotex mRNA Kit (Qiagen, Los Angeles, CA, USA). A subtractive cDNA library was generated by the method of our previous report using the salt-treated roots and leaves as the tester and the control roots and leaves as the driver [6].

4.3. Molecular Cloning of BvM14-SAMS2 Gene and Sequence Analysis

An EST named as Me-359 matching to BvM14-SAMS2 was identified. The 0.4-kb cDNA sequence was amplified by the method of reverse transcription RT-PCR using two primers: 5′-GTCTGATGATGTGGGTCTTGATGCT-3′ (sense primer) and 5′-GAGTCTTACCATCAGGTCTC AGCCA-3′ (antisense primer). Furthermore, the full length of BvM14-SAMS2 was acquired by the method of Smart-RACE (Clontech, MountainView, CA, USA). Phylogenetic tree of BvM14-SAMS genes was made using the ClustalX program combined with MEGA 4 software [42].

4.4. Real-Time Quantitative PCR

First-strand cDNA was generated from 0.5 µg of total RNA, using ReverTra Ace reverse transcriptase (Toyobo, Tokyo, Japan). The BvM14-SAMS2 specific primers (5′-GTCTGATGATGTGGGTCTTGATGCT-3′ and 5′-GAGTCTTACCATCAGGTCTCAGCCA-3′) were used for real-time quantitative RT-PCR. In order to verify specific of BvM14-SAMS2 primer, we conducted an analysis using Primer-BLAST tool in sugar beet (Beta vulgaris) genome. This pair of primers was specifically matched on SAMS2 in sugar beet genome (Figure S5). Furthermore, randomly-selected 10 positive clones from PCR products from this pair of primers were sequenced, and only BvM14-SAMS2 sequences can be identified. The 18S rRNA gene (primers: 5′-CCCCAATGGATCCTCGTTA-3′ and 5′-TGACGGAGAATTAGGGTTCG-3′) was used as an internal control. The reaction system contained aliquots of cDNA (1/20) of 1 μL, 150 nM each for forward and reverse primers and 5 μL SYBR Premix Ex Taq (Takara, Kusatsu Shiga, Japan) in total for the 10 µL PCR mixture. The cycle threshold (CT) for internal control should be between 15 and 20. A negative control without cDNA template was always included. The experiment was conducted by a LightCycler480 (Roche, Penzberg, Germany) instrument according to the manufacturer’s instructions. Triplicate quantitative assays were performed on each cDNA sample.

4.5. Isolation of T-DNA Insertion Mutants in AtSAMS3

Arabidopsis T-DNA insertion lines were identified for AtSAMS3 mutation by PCR. Specific primers for the left and right borders of the T-DNA and for AtSAMS3 (F1: 5′-CTAGATCTCATTGTCTGAACACAGTT-3′, R1: 5′-CGTACAGGAACCATGGCTCCGCTTT-3′, T1: 5′-TAGCATCTGAATTTCATAACCAATCTCGATACAC-3′) were used to identify mutant lines.

4.6. Constitutive Expression of BvM14-SAMS2 in Arabidopsis and Stress Tolerance Analysis

The coding region of the BvM14-SAMS2 gene was amplified using primers (5′-GCG AGATCTTCTCTCACTCTCTTCGTCCAGG-3′ and 5′-GCGACTAGTGCATTACGCAGGGATTTTC-3′). Then, it was ligated into the PMD18-T vector. It was cut with BglII and SpeI and ligated into the BglII and SpeI sites of a binary vector pCAMBIA1305.1 under the control of CaMV35S promoter. The construct was introduced into the Agrobacterium tumefaciens EHA105. Arabidopsis was transformed by the floral dip method [27]. The expression of BvM14-SAMS2 in different homozygous lines selected at the concentration of 50 μg/mL Kanamycin was confirmed by the method of RT-PCR. The content of chlorophyll was measured in accordance with a previous report [43].

4.7. Determination of Antioxidant Enzyme Activities, Lipid Peroxidation, H2O2 Concentration, SAM Concentration and Polyamine Metabolism

Measurement of concentration H2O2 was performed as previously described [21]. For the antioxidant enzyme assays, SOD activity was measured by analyzing its ability to inhibit the photochemical reduction of nitrobluetetrazolium following the method of Guo et al. [22]. CAT and POD activities were analyzed according to a previous report [21]. SAM concentration was determined following the method of Roeder et al. [44]. PA contents were assayed in accordance with a method described by Hu et al. [20]. Lipid peroxidation was estimated by determining the malondialdehyde (MDA) content in the leaves. For MDA extraction, fresh leaf samples (0.5 g) were homogenized with 0.1% trichloroacetic acid (TCA). The homogenate was then centrifuged at 15,000× g for 10 min. An aliquot (1 mL) of the supernatant was mixed to 4 mL of 20% TCA prepared in 0.5% thiobarbituric acid (TBA) and incubated at 90 °C for 30 min in a shaking water bath. The reaction was stopped in ice bath. The samples were then centrifuged at 10,000× g for 5 min, and the absorbance of the supernatant was measured at 532 and 600 nm.

4.8. Statistical Analysis
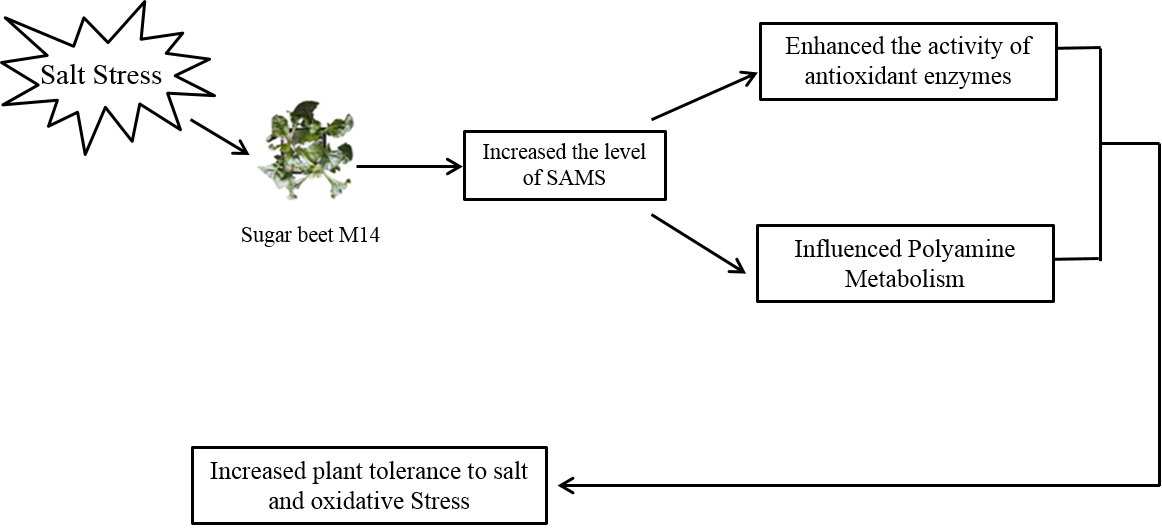
All the data were subjected to analysis of variance according to the model for completely randomized design using an SPSS program (SPSS Inc., Chicago, IL, USA). Differences among means of treatments and plant lines were evaluated by the Duncan’s test at 0.05 probability level.

5. Conclusions

In summary, the expression of BvM14-SAMS2 is significantly induced by salt treatment. Our study showed that overexpression of BvM14-SAMS2 significantly conferred salt and H2O2 stress tolerance in transgenic Arabidopsis plants. The functions of BvM14-SAMS2 are mainly accomplished through increased accumulation of Spd, Spm and activities of the antioxidant system, which are involved in scavenging ROS under stress conditions.

Supplementary Materials

Supplementary materials can be found at www.mdpi.com/1422-0067/18/4/847/s1.

Acknowledgments

Research in the HL lab was supported by the National Science Foundation of China (Project 31471552: The response of antioxidant enzymes to salt stress in sugar beet M14, and Project 31401441: Identification of root variation related proteins in sugar beet (Beta vulgaris L.) monosomic addition line M14 using iTRAQ analysis); and also The Common College Science and Technology Innovation Team of Heilongjiang Province (2014TD004). Support was received also from the Natural Science Foundation of Heilongjiang Province (project No. C2016048: A preliminary study on the molecular drought tolerance mechanism of 510 strains of sugar beet), and the Youth Science Foundation of Heilongjiang University (Project QL201511: A preliminary study on salt tolerance mechanism of 510 strains of sugar beet).

Author Contributions

Haiying Li and Sixue Chen compiled and edited the manuscript. Haiying Li is principal investigator of the project and conceived the overall concept of the study. Yuguang Wang, Chunquan Ma, Jingdong Nan and Dan Gu participated in the sampling, carried out the experiments and statistical analysis. All authors read and approved the final manuscript.

Conflicts of Interest

The authors declare no conflict of interest.

References

  1. Zhu, J.K. Genetic analysis of plant salt tolerance using Arabidopsis. Plant Physiol. 2000, 124, 941–948. [Google Scholar] [CrossRef] [PubMed]
  2. Zhu, J.K. Plant salt tolerance. Trends Plant Sci. 2001, 6, 66–71. [Google Scholar] [CrossRef]
  3. Munns, R.; Tester, M. Mechanisms of salinity tolerance. Annu. Rev. Plant Biol. 2008, 59, 651–681. [Google Scholar] [CrossRef] [PubMed]
  4. Turan, M.A.; Elkarim, A.H.A.; Taban, N.; Taban, S. Effect of salt stress on growth, stomatal resistance, proline and chlorophyll concentrations on maize plant. Afr. J. Agric. Res. 2009, 4, 893–897. [Google Scholar]
  5. Barkla, B.J.; Castellanos-Cervantes, T.; de León, J.L.; Matros, A.; Mock, H.P.; Perez-Alfocea, F.; Salekdeh, G.H.; Witzel, K.; Zörb, C. Elucidation of salt stress defense and tolerance mechanisms of crop plants using proteomics—Current achievements and perspectives. Proteomics 2013, 13, 1885–1900. [Google Scholar] [CrossRef] [PubMed]
  6. Yang, L.; Ma, C.; Wang, L.; Chen, S.; Li, H. Salt stress induced proteome and transcriptome changes in sugar beet monosomic addition line M14. J. Plant Physiol. 2012, 169, 839–850. [Google Scholar] [CrossRef] [PubMed]
  7. Yang, L.; Zhang, Y.; Zhu, N.; Koh, J.; Ma, C.; Pan, Y.; Yu, B.; Chen, S.; Li, H. Proteomic analysis of salt tolerance in sugar beet monosomic addition line M14. J. Proteome Res. 2013, 12, 4931–4950. [Google Scholar] [CrossRef] [PubMed]
  8. Zhang, Y.; Lai, J.; Sun, S.; Li, Y.; Liu, Y.; Liang, L.; Chen, M.; Xie, Q. Comparison analysis of transcripts from the halophyte Thellungiella halophila. J. Integr. Plant Biol. 2008, 50, 1327–1335. [Google Scholar] [CrossRef] [PubMed]
  9. Zhang, L.; Ma, X.L.; Zhang, Q.; Ma, C.L.; Wang, P.P.; Sun, Y.F.; Zhao, Y.X.; Zhang, H. Expressed sequence tags from a NaCl-treated Suaeda salsa cDNA library. Gene 2001, 267, 193–200. [Google Scholar] [CrossRef]
  10. Zouari, N.; Saad, R.B.; Legavre, T.; Azaza, J.; Sabau, X.; Jaoua, M.; Masmoudi, K.; Hassairi, A. Identification and sequencing of ESTs from the halophyte grass Aeluropus littoralis. Gene 2007, 404, 61–69. [Google Scholar] [CrossRef] [PubMed]
  11. Jha, B.; Agarwal, P.K.; Reddy, P.S.; Lal, S.; Sopory, S.K.; Reddy, M.K. Identification of salt-induced genes from Salicornia brachiata,an extreme halophyte through expressed sequence tags analysis. Genes Genet. Syst. 2009, 84, 111–120. [Google Scholar] [CrossRef] [PubMed]
  12. Askari, H.; Edqvist, J.; Hajheidari, M.; Kafi, M.; Salekdeh, G.H. Effects of Salinity levels on proteome of Suaeda aegyptiaca leaves. Proteomics 2006, 6, 2542–2554. [Google Scholar] [CrossRef] [PubMed]
  13. Pang, Q.; Chen, S.; Dai, S.; Chen, Y.; Wang, Y.; Yan, X. Comparative proteomics of salt tolerance in Arabidopsis thaliana and Thellungiella halophila. J. Proteome Res. 2010, 9, 2584–2599. [Google Scholar] [CrossRef] [PubMed]
  14. Wang, J.; Meng, Y.; Li, B.; Ma, X.; Lai, Y.; Si, E.; Yang, K.; Xu, X.; Shang, X.; Wang, H.; Wang, D. Physiological and proteomic analyses of salt stress response in the halophyte Halogeton glomeratus. Plant Cell Environ. 2015, 38, 655–669. [Google Scholar] [CrossRef] [PubMed]
  15. Wang, X.; Fan, P.; Song, H.; Chen, X.; Li, X.; Li, Y. Comparative proteomic analysis of differentially expressed proteins in shoots of Salicornia europaeaunder different salinity. J. Proteome Res. 2009, 8, 3331–3345. [Google Scholar] [CrossRef] [PubMed]
  16. Roje, S. S-Adenosyl-l-methionine: Beyond the universal methyl group donor. Phytochemistry 2006, 67, 1686–1698. [Google Scholar] [CrossRef] [PubMed]
  17. Nagel, J.; Culley, L.K.; Lu, Y.; Liu, E.; Matthews, P.D.; Stevens, J.F.; Page, J.E. EST analysis of hop glandular trichomes identifies an O-methyltransferase that catalyzes the biosynthesis of xanthohumol. Plant Cell 2008, 20, 186–200. [Google Scholar] [CrossRef] [PubMed]
  18. Köllner, T.G.; Lenk, C.; Zhao, N.; Seidl-Adams, I.; Gershenzon, J.; Chen, F.; Degenhardt, J. Herbivore-induced SABATH methyltransferases of maize that methylate anthranilic acid using S-adenosyl-l-methionine. Plant Physiol. 2010, 153, 1795–1807. [Google Scholar] [CrossRef] [PubMed]
  19. Jang, S.J.; Wi, S.J.; Choi, Y.J.; An, G.; Park, K.Y. Increased polyamine biosynthesis enhances stress tolerance by preventing the accumulation of reactiveoxygen species:T-DNA mutational analysis of Oryza sativa lysine decarboxylase-like protein 1. Mol. Cells 2012, 34, 251–262. [Google Scholar] [CrossRef] [PubMed]
  20. Hu, X.; Zhang, Y.; Shi, Y.; Zhang, Z.; Zou, Z.; Zhang, H.; Zhao, J. Effect of exogenous spermidine on polyamine content and metabolism in tomato exposed to salinity-alkalinity mixed stress. Plant Physiol. Biochem. 2012, 57, 200–209. [Google Scholar] [CrossRef] [PubMed]
  21. Gong, B.; Li, X.; VandenLangenberg, K.M.; Wen, D.; Sun, S.; Wei, M.; Li, Y.; Yang, F.; Shi, Q.; Wang, X. Overexpression of S-adenosyl-l-methionine synthetase increased tomato tolerance to alkali stress through polyamine metabolism. Plant Biotechnol. J. 2014, 12, 694–708. [Google Scholar] [CrossRef] [PubMed]
  22. Guo, Z.; Tan, J.; Zhuo, C.; Wang, C.; Xiang, B.; Wang, Z. Abscisic acid, H2O2 and nitricoxide interactions mediated cold-induced S-adenosylmethionine synthetase in Medicag osativa subsp. falcata that confers cold tolerance through up-regulating polyamine oxidation. Plant Biotechnol. J. 2014, 12, 601–612. [Google Scholar] [CrossRef] [PubMed]
  23. Qi, Y.C.; Wang, F.F.; Zhang, H.; Liu, W.Q. Overexpression of Suadea salsa S-adenosylmethionine synthetase gene promotes salt tolerance in transgenic tobacco. Acta Physiol. Plant 2010, 32, 263–269. [Google Scholar] [CrossRef]
  24. Li, H.; Cao, H.; Wang, Y.; Pang, Q.; Ma, C.; Chen, S. Proteomic analysis of sugar beet apomictic monosomic addition line M14. J. Proteom. 2009, 73, 297–308. [Google Scholar] [CrossRef] [PubMed]
  25. Ge, Y.; He, G.; Wang, Z.; Guo, D.; Qin, R.; Li, R. GISH and BAC-FISH study of apomicitic Beta M14. Sci. China Ser. C Life Sci. 2007, 37, 209–216. [Google Scholar]
  26. Guo, D.; Kang, C.; Liu, L.; Li, Y. Study of apomixis in theallotriploid beet (VVC). Agric. Sci. China 1999, 32, 1–5. [Google Scholar]
  27. Wang, Y.; Zhan, Y.; Wu, C.; Gong, S.; Zhu, N.; Chen, S.; Li, H. Cloning of a cystatin gene from sugar beet M14 that can enhance plant salt tolerance. Plant Sci. 2012, 191, 93–99. [Google Scholar] [CrossRef] [PubMed]
  28. Li, W.; Han, Y.; Tao, F.; Chong, K. Knockdown of SAMS genes encoding S-adenosyl-l-methionine synthetases causes methylation alterations of DNAs and histones and leads to late flowering in rice. J. Plant Physiol. 2011, 168, 1837–1843. [Google Scholar] [CrossRef] [PubMed]
  29. Lee, J.H.; Chae, H.S.; Lee, J.H.; Hwang, B.; Hahn, K.W.; Kang, B.G.; Kim, W.T. Structure and expression of two cDNAs encoding S-adenosyl-l-methionine synthetase of rice (Oryza sativa L.). Biochim. Biophys. Acta 1997, 1354, 13–18. [Google Scholar] [CrossRef]
  30. Hazarika, P.; Rajam, M.V. Biotic and abiotic stress tolerance in transgenic tomatoes by constitutive expression of S-adenosylmethionine decarboxylase gene. Physiol. Mol. Biol. Plants 2011, 17, 115–128. [Google Scholar] [CrossRef] [PubMed]
  31. Mao, D.; Yu, F.; Li, J.; Van de Poel, B.; Tan, D.; Li, J.; Liu, Y.; Li, X.; Dong, M.; Chen, L.; et al. FERONIA receptor kinase interacts with S-adenosylmethionine synthetase and suppresses S-adenosylmethionine production and ethylene biosynthesis in Arabidopsis. Plant Cell Environ. 2015, 38, 2566–2574. [Google Scholar] [CrossRef] [PubMed]
  32. Chen, Y.; Zou, T.; McCormick, S. S-Adenosylmethionine Synthetase 3 is important for pollen tube growth. Plant Physiol. 2016, 172, 244–253. [Google Scholar] [CrossRef] [PubMed]
  33. Kim, S.H.; Kim, S.H.; Palaniyandi, S.A.; Yang, S.H.; Suh, J.W. Expression of potato S-adenosyl-l-methionine synthase (SbSAMS) gene altered developmental characteristics and stress responses in transgenic Arabidopsis plants. Plant Physiol. Biochem. 2015, 87, 84–91. [Google Scholar] [CrossRef] [PubMed]
  34. Zago, E.; Morsa, S.; Dat, J.F.; Alard, P.; Ferrarini, A.; Inzé, D.; Delledonne, M.; van Breusegem, F. Nitric oxide-and hydrogen peroxide-responsive gene regulation during cell death induction in tobacco. Plant Physiol. 2006, 141, 404–411. [Google Scholar] [CrossRef] [PubMed]
  35. Asada, K. The water-water cyclein in chloroplasts: Scavenging of active oxygens and dissipation of excess photons. Annu. Rev. Plant Physiol. Plant. Mol. Biol. 1999, 50, 601–639. [Google Scholar] [CrossRef] [PubMed]
  36. Diao, Q.N.; Song, Y.J.; Shi, D.M.; Qi, H.Y. Nitric oxide induced by polyamines involves antioxidant systems against chilling stress intomato (Lycopersicon esculentum Mill.) seedling. J. Zhejiang Univ Sci. B 2016, 17, 916–930. [Google Scholar] [CrossRef] [PubMed]
  37. Wang, X.; Zeng, J.; Li, Y.; Rong, X.; Sun, J.; Sun, T.; Li, M.; Wang, L.; Feng, Y.; Chai, R.; et al. Expression of TaWRKY44, a wheat WRKY gene, in transgenic tobacco confers multiple abiotic stress tolerances. Front. Plant Sci. 2015, 6, 615. [Google Scholar] [CrossRef] [PubMed]
  38. Diao, Q.; Song, Y.; Shi, D.; Qi, H. Interaction of polyamines, abscisic acid, nitric oxide, and hydrogen peroxide under chilling stress in tomato (Lycopersicon esculentum Mill.) seedlings. Front. Plant Sci. 2017, 8, 203. [Google Scholar] [CrossRef] [PubMed]
  39. Ha, H.C.; Sirisoma, N.S.; Kuppusamy, P.; Zweier, J.L.; Woster, P.M.; Casero, R.A., Jr. The natural polyamine spermine functions directly as a free radical scavenger. Proc. Natl. Acad. Sci. USA 1998, 95, 11140–11145. [Google Scholar] [CrossRef] [PubMed]
  40. Kusano, T.; Berberich, T.; Tateda, C.; Takahashi, Y. Polyamines: Essential factors for growth and survival. Planta 2008, 228, 367–381. [Google Scholar] [CrossRef] [PubMed]
  41. Botella, M.A.; Xu, Y.; Prabha, T.N.; Zhao, Y.; Narasimhan, M.L.; Wilson, K.A.; Nielsen, S.S.; Bressan, R.A.; Hasegawa, P.M. Differential expression of soybean cysteine proteinase inhibitor genes during development and in response to wounding and methyl jasmonate. Plant Physiol. 1996, 112, 1201–1210. [Google Scholar] [CrossRef] [PubMed]
  42. Thompson, J.D.; Gibson, T.J.; Plewniak, F.; Jeanmougin, F.; Higgins, D.G. The CLUSTAL_X windows interface: Flexible strategies for multiple sequence alignment aided by quality analysis tools. Nucleic Acids Res. 1997, 25, 4876–4882. [Google Scholar] [CrossRef] [PubMed]
  43. Lichtenthaler, H.K. Chlorophylls and carotenoids: Pigments of photosynthetic biomembranes. Methods Enzymol. 1987, 148, 350–382. [Google Scholar]
  44. Roeder, S.; Dreschler, K.; Wirtz, M.; Cristescu, S.M.; van Harren, F.J.; Hell, R.; Piechulla, B. SAM levels, gene expression of SAM synthetase, methionine synthase and ACC oxidase, and ethylene emission from N. suaveolens flowers. Plant Mol. Biol. 2009, 70, 535–546. [Google Scholar] [CrossRef] [PubMed]
Figure 1. Experimental scheme of screening differentially expressed genes by suppression subtractive hybridization (SSH) and functional classification of the identified genes using the UniProt database. (a) Experimental scheme; (b) Functional classification of the differential genes; EST stands for expressed sequence tag.
Ijms 18 00847 g001
Figure 2. Tissue specific expression of BvM14-SAMS2 gene in the M14 plants and induction of the BvM14-SAMS2 mRNA in response to salt stress. (a) Real time-PCR detection of BvM14-SAMS2 gene in different tissues. Time-course analysis of BvM14-SAMS2 relative expression levels in leaves (b); and roots (c) of the M14 plants under 200 mM NaCl stress. Data for real time-PCR analysis are the means of three biological replicates and three technology replicates (standard deviation, SD), separately. Each replicate contains five sugar beet seedlings. The 18S rRNA gene was used as the internal control for relative expression analysis.
Ijms 18 00847 g002
Figure 3. Identification of atsams3 mutant and overexpressed BvM14-SAMS2 in Arabidopsis plants. (a) quantitative reverse transcription-polymerase chain reaction (RT-PCR) analysis of the expression levels of overexpressed BvM14-SAMS2 (OX1 and OX2) in Arabidopsis plants; (b) Structure of the AtSAMS3 gene. The T-DNA insertional site was 756 bp upstream of the start codon, as indicated by a triangle. The primers used to identify the T-DNA insertion were marked with arrows; (c) PCR analysis of the T-DNA insertion in the atsams3 mutant (KO); (d) RT-PCR analysis of the expression levels of AtSAMS3 in atsams3 mutant and wild type (WT); (e) Real-time PCR analysis of the expression levels of AtSAMS3 in the atsams3 mutant; (f) The concentration of S-adenosylmethionine (SAM) in 20-day old whole seedlings of wild type (WT), overexpressed BvM14-SAMS2 (OX1 and OX2), AtSAMS3 konckdown mutant (KO) and BvM14-SAMS2 in mutant complementation seedlings (CO). Data are the means of three biological replicates (SD) and each replicate contains five seedlings. Different letters indicate significant difference at p < 0.05.
Ijms 18 00847 g003
Figure 4. Analysis of salt and H2O2 tolerance in transgenic Arabidopsis plants in comparison with the wild type and atsams3 mutant. (a) Phenotypes of wild type (WT), BvM14-SAMS2 BvM14-SAMS2-overexpressed seedlings in wild type Arabidopsis (OX), atsams3 mutant (KO), and BvM14-SAMS2 in mutant complementation seedlings (CO) under control and stress conditions. Photographs were taken 14 days after treatment. Inhibition of root length (b); and loss of fresh weight (c) were determined. Data are the means of three biological replicates (SD) and each replicate contains five seedlings. Different letters indicate significant difference at p < 0.05.
Ijms 18 00847 g004
Figure 5. Analysis of salt and H2O2 tolerance in transgenic Arabidopsis plants in comparison with the wild type and atsams3 mutant in soil. (a) Phenotypes of wild type (WT), BvM14-SAMS2 BvM14-SAMS2-overexpressed seedlings in wild type Arabidopsis (OX), atsams3 mutant (KO), and BvM14-SAMS2 in mutant complementation seedlings (CO) under conditions of control and stress in soil. Photographs were taken 7 days after treatment; Total chlorophyll levels (b) were determined. Data are the means of three biological replicates (SD) and each replicate contains five seedlings. Different letters indicate significant difference at p < 0.05.
Ijms 18 00847 g005
Figure 6. Effects of salt and H2O2 stresses on antioxidant system activity H2O2 content (a); malondialdehyde (MDA) content (b); and antioxidant enzyme activities (ce) were measured in wild type (WT), transgenic BvM14-SAMS2 wild type (WT), BvM14-SAMS2-overexpressed in wild type Arabidopsis (OX), atsams3 mutant (KO) and transgenic BvM14-SAMS2 in the mutant seedlings (CO) leaves. Data are the means of three biological replicates (SD) and each replicate contains five seedlings. Different letters indicate significant difference at p < 0.05.
Ijms 18 00847 g006
Figure 7. Effects of salt and H2O2 stresses on polyamines (PAs). Total putrescine (Put) content (a); total spermidine (Spd) content (b); total spermine (Spm) content (c) in wild type (WT), transgenic BvM14-SAMS2 seedlings in wild type Arabidopsis (OX), atsams3 mutant (KO) and BvM14-SAMS2 in mutant complementation seedlings (CO) leaves. Data are the means of three biological replicates with standard deviation (SD), and each replicate contains five seedlings. Different letters indicate significant difference at p < 0.05.
Ijms 18 00847 g007
Table 1. cDNA clones isolated from a subtractive hybridization library of salt stressed sugar beet M14 roots (R) and leaves (L).
Unigene NumberLength (bp)AnnotationScoreE-Value
L1354Glutathione S-transferase159 6 × 10⁻³³
L2231Late embryogenesis abundant protein73 1 × 10⁻⁵
L3174Chloroplastic chlorophyll a-b binding 8154 2 × 10⁻²⁷
L4150ATP-binding cassette transporter C family member 1470 3 × 10⁻¹¹
L5392Ca2+ transporting ATPase2604 × 10−78
L6237MYB (v-myb avian myeloblastosis viral oncogene homolog) transcription factor522 × 10−7
L7359Salt-induced hydrophilic protein70.3 2 × 10⁻⁹
L8467Aldehyde dehydrogenase family 7 A11191 × 10−32
L9233Cysteine proteinase inhibitor1341 × 10−8
L10221Aldehyde dehydrogenase1233 × 10−13
L11274S-adenosylmethionine decarboxylase155 1 × 10−36
L12148Pyruvate kinase family protein894 × 10−18
L13274Cysteine protease631 × 10−7
L14297Short-chain dehydrogenase73 7 × 10⁻¹¹
L15246Carboxyl-terminal-processing protease1321 × 10−30
L16301MYB transcription factor942 × 10−7
L17144Short-chain dehydrogenases/reductases family 7C1985 × 10−8
L18326Vacuole ATPase subunit A1443 × 10−66
L19528Putative mitochondrial carrier protein1635 × 10−77
L20416Nitrite reductase254 4 × 10−66
L21512Lipid transfer protein184 4 × 10−45
L22314S-adenosylmethionine synthase 2239 1 × 10−61
L23763Phosphoglycerate kinase407 8 × 10−112
L24236Cellulose synthase-like protein E671.2 5 × 10⁻¹¹
L25450High-mobility group B6 transcription factor693 × 10−2
L26544Heat- and acid-stable phosphoprotein953 × 10−16
L27236Thioredoxin domain 2686 × 10−31
L28437Hypothetical protein1095 × 10−4
L29197DNA replication licensing factor minichromosome maintenance 4 (MCM4)882 × 10−2
R1245Thioredoxin domain 1963 × 10−13
R2364S-adenosylmethionine synthase 21941 × 10−22
R3208WD (Trp-Asp) repeat phosphoinositide-interacting174 6 × 10⁻³⁰
R4447AAA-type ATPase family protein1434 × 10−12
R5182Putative senescence-associated protein1216 × 10−2
R6394S-adenosylmethionine synthase 2743 × 10−7
R711360S ribosomal protein L19-38634 × 10−14

